Waiting Line Models Waiting Line Models
Waiting Line Models Waiting Line Models
Waiting Line Models Waiting Line Models

Create successful ePaper yourself
Turn your PDF publications into a flip-book with our unique Google optimized e-Paper software.
<strong>Waiting</strong> <strong>Line</strong> <strong>Models</strong><br />
Before studying this supplement you should know or, if necessary, review<br />
1. Competitive advantages, Chapter 2.<br />
2. Priority rules, Chapter 16.<br />
LEARNING OBJECTIVES<br />
After completing this supplement you should be able to<br />
1<br />
2<br />
3<br />
Describe the elements of a waiting line problem.<br />
Use waiting line models to estimate system performance.<br />
Use waiting line models to make managerial decisions.<br />
SUPPLEMENT OUTLINE<br />
Elements of <strong>Waiting</strong> <strong>Line</strong>s C2<br />
<strong>Waiting</strong> <strong>Line</strong> Performance Measures C7<br />
Single-Server <strong>Waiting</strong> <strong>Line</strong> Model C7<br />
Multiserver <strong>Waiting</strong> <strong>Line</strong> Model C9<br />
WHAT’S IN OM FOR ME?<br />
SUPPLEMENT<br />
Changing Operational Characteristics C13<br />
Larger-Scale <strong>Waiting</strong> <strong>Line</strong> Systems C14<br />
<strong>Waiting</strong> <strong>Line</strong> <strong>Models</strong> within OM: How It<br />
All Fits Together C15<br />
C<br />
ACC FIN MKT OM HRM MIS<br />
C1
C2 • SUPPLEMENT C WAITING LINE MODELS<br />
� <strong>Waiting</strong> line system<br />
Includes the customer<br />
population source as well as<br />
the process or service system.<br />
� Queuing system<br />
Another name to define a<br />
waiting line.<br />
ELEMENTS OF WAITING LINES<br />
<strong>Waiting</strong> in lines is part of everyday life. Some estimates state that Americans spend<br />
37 billion hours per year waiting in lines. Whether it is waiting in line at a grocery<br />
store to buy deli items (by taking a number) or checking out at the cash registers<br />
(finding the quickest line), waiting in line at the bank for a teller, or waiting at an<br />
amusement park to go on the newest ride, we spend a lot of time waiting. We wait in<br />
lines at the movies, campus dining rooms, the registrar’s office for class registration, at<br />
the Division of Motor Vehicles, and even at the end of the school term to sell books<br />
back. Think about the lines you have waited in just during the past week. How long<br />
you wait in line depends on a number of factors. Your wait is a result of the number of<br />
people served before you, the number of servers working, and the amount of time it<br />
takes to serve each individual customer.<br />
Wait time is affected by the design of the waiting line system. A waiting line system<br />
(or queuing system) is defined by two elements: the population source of its<br />
customers and the process or service system itself. In this supplement we examine the<br />
elements of waiting line systems and appropriate performance measures. Performance<br />
characteristics are calculated for different waiting line systems. We conclude<br />
with descriptions of managerial decisions related to waiting line system design and<br />
performance.<br />
Any time there is more customer demand for a service than can be provided, a waiting<br />
line occurs. Customers can be either humans or inanimate objects. Examples of objects<br />
that must wait in lines include a machine waiting for repair, a customer order<br />
waiting to be processed, subassemblies in a manufacturing plant (that is, work-inprocess<br />
inventory), electronic messages on the Internet, and ships or railcars waiting<br />
for unloading.<br />
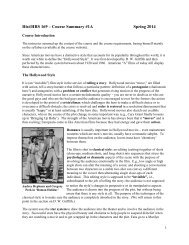
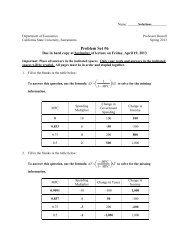
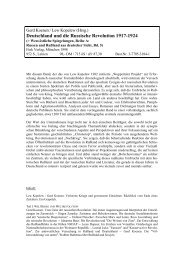
In a waiting line system, managers must decide what level of service to offer. A<br />
low level of service may be inexpensive, at least in the short run, but may incur<br />
high costs of customer dissatisfaction, such as lost future business and actual processing<br />
costs of complaints. A high level of service will cost more to provide and<br />
will result in lower dissatisfaction costs. Because of this trade-off, management<br />
must consider what is the optimal level of service to provide. This is illustrated in<br />
Figure C-1.
Fast-food restaurants illustrate<br />
the transient nature of waiting<br />
line systems. <strong>Waiting</strong> lines occur<br />
at a fast-food restaurant drivethrough<br />
during peak meal times<br />
each day. There is a temporary<br />
surge in demand that cannot be<br />
quickly handled with the available<br />
capacity. In an effort to<br />
speed up delivery, some restaurants<br />
use an extra window—the<br />
first window for paying and the second window for picking up the food. At other times<br />
of the day, the restaurant uses a single window and may have no waiting line at the<br />
drive-through window.<br />
The challenge is designing service systems with adequate but not excessive amounts<br />
of capacity. A fast-food restaurant experiences variable demand and variable service<br />
times. The restaurant cannot be sure how much customer demand there will be, and<br />
it does not know exactly what each customer will order—each order can be unique<br />
and require a different service time. It is important to understand the different elements<br />
of a waiting line system. These elements include the customer population<br />
source, the service system, the arrival and service patterns, and the priorities used for<br />
controlling the line. Let’s first look at the primary input into the waiting line system:<br />
the customers.<br />
The Customer Population<br />
The customer population can be considered to be finite or infinite. When potential<br />
new customers for the waiting line system are affected by the number of customers already<br />
in the system, the customer population is finite. For example, if you are in a<br />
ELEMENTS OF WAITING LINES • C3<br />
FIGURE C-1<br />
<strong>Waiting</strong> cost and service level<br />
trade-off<br />
Kristin Sladen/The Image Works<br />
LINKS TO PRACTICE<br />
<strong>Waiting</strong> for Fast Food<br />
� Finite customer<br />
population<br />
The number of potential new<br />
customers is affected by the<br />
number of customers already<br />
in the system.
C4 • SUPPLEMENT C WAITING LINE MODELS<br />
� Infinite customer<br />
population<br />
The number of potential new<br />
customers is not affected by<br />
the number of customers<br />
already in the system.<br />
� Balking<br />
The customer decides not to<br />
enter the waiting line.<br />
� Reneging<br />
The customer enters the line<br />
but decides to exit before<br />
being served.<br />
� Jockeying<br />
The customer enters one<br />
line and then switches to a<br />
different line in an effort to<br />
reduce the waiting time.<br />
class with nine other students, the total customer population for meeting with the<br />
professor during office hours is ten students. As the number of students waiting to<br />
meet with the professor increases, the population of possible new customers decreases.<br />
There is a finite limit as to how large the waiting line can ever be.<br />
When the number of customers waiting in line does not significantly affect the rate<br />
at which the population generates new customers, the customer population is considered<br />
infinite. For example, if you are taking a class with 500 other students (a relatively<br />
large population) and the probability of all the students trying to meet with the<br />
professor at the same time is very low, then the number of students in line does not<br />
significantly affect the population’s ability to generate new customers.<br />
In addition to waiting, a customer has other possible actions. For example, a customer<br />
may balk, renege, or jockey. Balking occurs when the customer decides not to<br />
enter the waiting line. For example, you see that there are already 12 students waiting<br />
to meet with your professor, so you choose to come back later. Reneging occurs when<br />
the customer enters the waiting line but leaves before being serviced. For example, you<br />
enter the line waiting to meet with your professor, but after waiting 15 minutes and<br />
seeing little progress, you decide to leave. Jockeying occurs when a customer changes<br />
from one line to another, hoping to reduce the waiting time. A good example of this is<br />
picking a line at the grocery store and changing to another line in the hope of being<br />
served quicker.<br />
The models used in this supplement assume that customers are patient; they do not<br />
balk, renege, or jockey; and the customers come from an infinite population. The<br />
mathematical formulas become more complex for systems in which customer population<br />
must be considered finite and when customers balk, renege, or jockey.<br />
The Service System<br />
The service system is characterized by the number of waiting lines, the number of<br />
servers, the arrangement of the servers, the arrival and service patterns, and the service<br />
priority rules.<br />
The Number of <strong>Waiting</strong> <strong>Line</strong>s <strong>Waiting</strong> line systems can have single or multiple<br />
lines. Banks often have a single line for customers. Customers wait in line until a teller<br />
is free and then proceed to that teller’s position. Other examples of single-line systems<br />
include airline counters, rental car counters, restaurants, amusement park attractions,<br />
and call centers. The advantage of using a single line when multiple servers are available<br />
is the customer’s perception of fairness in terms of equitable waits. That is, the<br />
customer is not penalized by picking the slow line but is served in a true first-come,<br />
first-served fashion. The single-line approach eliminates jockeying behavior. Finally, a<br />
single-line, multiple-server system has better performance in terms of waiting times<br />
than the same system with a line for each server.<br />
The multiple-line configuration is appropriate when specialized servers are used or<br />
when space considerations make a single line inconvenient. For example, in a grocery<br />
store some registers are express lanes for customers with a small number of items.<br />
Using express lines reduces the waiting time for customers making smaller purchases.<br />
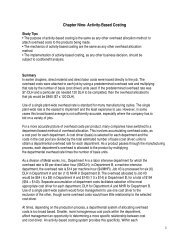
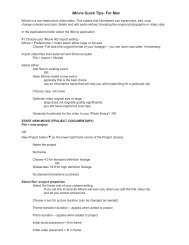
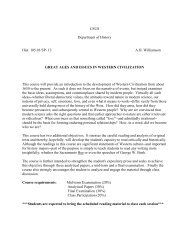
Examples of single- and multiple-line systems are shown in Figure C-2.<br />
The Number of Servers System serving capacity is a function of the number of service<br />
facilities and server proficiency. In waiting line systems, the terms server and<br />
channel are used interchangeably. It is assumed that a server or channel can serve one
customer at a time. <strong>Waiting</strong> line systems are either single server (single channel)<br />
or multiserver (multichannel). Single-server examples include small retail stores with<br />
a single checkout counter, a theater with a single person selling tickets and controlling<br />
admission into the show, or a ballroom with a single person controlling admission.<br />
Multiserver systems have parallel service providers offering the same service.<br />
Multiserver examples include grocery stores (multiple cashiers), drive-through banks<br />
(multiple drive-through windows), and gas stations (multiple gas pumps).<br />
The Arrangement of the Servers Services require a single activity or a series of activities<br />
and are identified by the term phase. Refer to Figure C-2. In a single-phase system,<br />
the service is completed all at once, such as with a bank transaction or a grocery<br />
store checkout. In a multiphase system, the service is completed in a series of steps,<br />
such as at a fast-food restaurant with ordering, pay, and pick-up windows or in many<br />
manufacturing processes.<br />
In addition, some waiting line systems have a finite size of the waiting line. Sometimes<br />
this happens in multiphase systems. For example, perhaps only two cars can<br />
physically fit between the ordering and pay window of a fast-food drive-through. Finite<br />
size limitations can also occur in single-phase systems and can be associated either<br />
with the physical system (for example, a call center has only a finite number of<br />
incoming phone lines) or with customer behavior (if a customer arrives when a certain<br />
number of people are already waiting, the customer chooses to not join the line).<br />
ELEMENTS OF WAITING LINES • C5<br />
FIGURE C-2<br />
Examples of waiting line<br />
systems
Barney Tobey/The Cartoon Bank, Inc.<br />
C6 • SUPPLEMENT C WAITING LINE MODELS<br />
� Arrival rate<br />
The average number of<br />
customers arriving per<br />
time period.<br />
� Service rate<br />
The average number of<br />
customers that can be<br />
served per time period.<br />
Arrival and Service Patterns<br />
<strong>Waiting</strong> line models require an arrival rate and a service rate. The arrival rate specifies<br />
the average number of customers per time period. For example, a system may have<br />
ten customers arrive on average each hour. The service rate specifies the average number<br />
of customers that can be serviced during a time period. The service rate is the capacity<br />
of the service system. If the number of customers you can serve per time period<br />
is less than the average number of customers arriving, the waiting line grows infinitely.<br />
You never catch up with the demand!<br />
It is the variability in arrival and service patterns that causes waiting lines. <strong>Line</strong>s<br />
form when several customers request service at approximately the same time. This<br />
surge of customers temporarily overloads the service system and a line develops. <strong>Waiting</strong><br />
line models that assess the performance of service systems usually assume that<br />
customers arrive according to a Poisson probability distribution, and service times are<br />
described by an exponential distribution. The Poisson distribution specifies the probability<br />
that a certain number of customers will arrive in a given time period (such as<br />
per hour). The exponential distribution describes the service times as the probability<br />
that a particular service time will be less than or equal to a given amount of time.<br />
Problem-Solving Tip: Make sure the arrival rate and service rate are for the same time period, that<br />
is, the number of customers per hour, or per day, or per week.<br />
<strong>Waiting</strong> <strong>Line</strong> Priority Rules<br />
A waiting line priority rule determines which customer is served next. A frequently<br />
used priority rule is first-come, first-served. This priority rule selects customers based<br />
on who has been waiting the longest in line. Generally, customers consider first-come,<br />
first-served to be the fairest method for determining priority.<br />
However, it is not the only priority rule used. Other rules include best customers<br />
first, highest-profit customer first, quickest-service requirement first, largest-service requirement<br />
first, emergencies first, and so on. Although each priority rule has merit, it is<br />
important to use the priority rule that best supports the<br />
overall organizational strategy. For example, a firstcome,<br />
first-served rule doesn’t make sense in a hospital<br />
emergency room and in fact could cause unnecessary<br />
deaths.<br />
The priority rule used affects the performance of the<br />
waiting line system. As an example, first-come, first<br />
served is generally considered fair, yet it is biased<br />
against customers requiring short service times. When<br />
checking out at a store that is using first-come, firstserved<br />
as a priority rule, a customer waiting behind another<br />
customer with a large number of items waits<br />
longer than a customer waiting behind a second customer<br />
with only a few items. Although processing is sequential,<br />
the wait times vary because of the preceding<br />
customer. Also, priority rules besides first-come, firstserved<br />
may imply that some customers wait extremely<br />
long periods of time. For example, in a busy emergency<br />
room, someone not critically sick or injured could wait<br />
a significant period of time.
The models in this chapter assume a service system with a single waiting line, single<br />
or multiple servers, a single phase, and a first-come, first-served priority rule.<br />
SINGLE-SERVER WAITING LINE MODEL • C7<br />
WAITING LINE PERFORMANCE MEASURES<br />
Performance measures are used to gain useful information about waiting line systems.<br />
These measures include:<br />
1. The average number of customers waiting in line and in the system. The number<br />
of customers waiting in line can be interpreted in several ways. Short waiting<br />
lines can result from relatively constant customer arrivals (no major surges in<br />
demand) or from the organization’s having excess capacity (many cashiers<br />
open). On the other hand, long waiting lines can result from poor server efficiency,<br />
inadequate system capacity, and/or significant surges in demand.<br />
2. The average time customers spend waiting, and the average time a customer spends<br />
in the system. Customers often link long waits to poor-quality service. When<br />
long waiting times occur, one option may be to change the demand pattern.<br />
That is, the company can offer discounts or better service at less busy times of<br />
the day or week. For example, a restaurant offers early-bird diners a discount so<br />
that demand is more level. The discount moves some demand from prime-time<br />
dining hours to the less desired dining hours.<br />
If too much time is spent in the system, customers might perceive the competency<br />
of the service provider as poor. For example, the amount of time customers<br />
spend in line and in the system at a retail checkout counter can be a<br />
result of a new employee not yet proficient at handling the transactions.<br />
3. The system utilization rate. Measuring capacity utilization shows the percentage<br />
of time the servers are busy. Management’s goal is to have enough servers to assure<br />
that waiting is within allowable limits but not so many servers as to be costinefficient.<br />
We calculate these measures for two different waiting line models: the single-server<br />
model and the multiserver model.<br />
SINGLE-SERVER WAITING LINE MODEL<br />
The easiest waiting line model involves a single-server, single-line, single-phase system.<br />
The following assumptions are made when we model this environment:<br />
1. The customers are patient (no balking, reneging, or jockeying) and come from a<br />
population that can be considered infinite.<br />
2. Customer arrivals are described by a Poisson distribution with a mean arrival<br />
rate of � (lambda). This means that the time between successive customer arrivals<br />
follows an exponential distribution with an average of 1/�.<br />
3. The customer service rate is described by a Poisson distribution with a mean<br />
service rate of � (mu). This means that the service time for one customer follows<br />
an exponential distribution with an average of 1/�.<br />
4. The waiting line priority rule used is first-come, first-served.<br />
Using these assumptions, we can calculate the operating characteristics of a waiting<br />
line system using the following formulas:
C8 • SUPPLEMENT C WAITING LINE MODELS<br />
EXAMPLE C.1<br />
Single-Server<br />
Operating<br />
Characteristics at<br />
the Help Desk<br />
� � mean arrival rate of customers (average number of customers arriving per unit<br />
of time)<br />
� � mean service rate (average number of customers that can be served per<br />
unit of time)<br />
p � � � � the average utilization of the system<br />
L � �<br />
� the average number of customers in the service system<br />
� � �<br />
L Q � pL � the average number of customers waiting in line<br />
W �<br />
1<br />
� the average time spent waiting in the system, including service<br />
� � �<br />
W Q � pW � the average time spent waiting in line<br />
Pn � (1 � p)p<br />
given time<br />
n � the probability that n customers are in the service system at a<br />
Note: The service rate must be greater than the arrival rate, that is, � � �.If� � �, the<br />
waiting line would eventually grow infinitely large. Before using the formulas, check to<br />
be sure that � � �.<br />
The computer lab at State University has a help desk to assist students working on computer<br />
spreadsheet assignments. The students patiently form a single line in front of the desk to wait for<br />
help. Students are served based on a first-come, first-served priority rule. On average, 15 students<br />
per hour arrive at the help desk. Student arrivals are best described using a Poisson distribution.<br />
The help desk server can help an average of 20 students per hour, with the service rate being described<br />
by an exponential distribution. Calculate the following operating characteristics of the<br />
service system.<br />
(a) The average utilization of the help desk server<br />
(b) The average number of students in the system<br />
(c) The average number of students waiting in line<br />
(d) The average time a student spends in the system<br />
(e) The average time a student spends waiting in line<br />
(f) The probability of having more than 4 students in the system<br />
• Before You Begin: The key to solving queuing problems is to identify the mean arrival<br />
rate of customers and the mean service rate. In this case, on average, 15 customers arrive each<br />
hour. On average, the consultant can serve 20 customers per hour. Once you have established<br />
these values, you merely plug them into the appropriate formula.<br />
• Solution:<br />
� 15<br />
(a) Average utilization: p � �<br />
� �0.75, or 75%.<br />
20<br />
� 15<br />
(b) Average number of students in the system: L � � �3 students<br />
� � � 20 � 15<br />
(c) Average number of students waiting in line: LQ � pL � 0.75 � 3 � 2.25 students<br />
1<br />
(d) Average time a student spent in the system: W � �0.2 hours, or 12 minutes<br />
� � � �<br />
1<br />
20 � 15
(e) Average time a student spent waiting in line: W Q � pW � 0.75 � (0.2) � 0.15 hours, or<br />
9 minutes<br />
(f) The probability that there are more than four students in the system equals one minus the<br />
probability that there are four or fewer students in the system. We use the following formula.<br />
Problem-Solving Tip: Any term raised to the zero power is equal to 1.<br />
P � 1 � � 4<br />
Pn � 1 � � n�0<br />
4<br />
n�0<br />
� 1 � 0.25(1 � 0.75 � 0.75 2 � 0.75 3 � 0.75 4 )<br />
� 1 � 0.7626 � 0.2374<br />
(1 � p)p n<br />
or a 0.2374 (23.74 percent) chance of having more than four students in the system.<br />
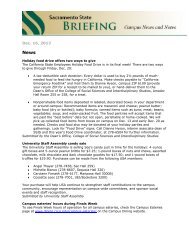
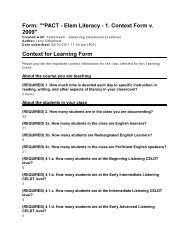
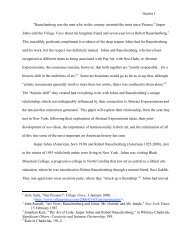
Figure C-3 shows a spreadsheet solution of this problem. The spreadsheet formulas shown are<br />
a direct implementation of the single-server formulas for performance measures. Figure C-4 is a<br />
graph of the probabilities of certain numbers of customers in the system.<br />
Key Formulas<br />
B9: � 1/B5<br />
B10: � 1/B6<br />
B13: � B5/B6<br />
B14: � 1�B13<br />
B15: � B5/(B6�B5)<br />
B16: � B13*B15<br />
B17: � 1/(B6�B5)<br />
B18: � B13*B17<br />
B22: � (1�B$13)*(B13∧B21)<br />
SINGLE-SERVER WAITING LINE MODEL • C9<br />
FIGURE C-3<br />
Spreadsheet for singleserver<br />
operating<br />
characteristics
C10 • SUPPLEMENT C WAITING LINE MODELS<br />
FIGURE C-4<br />
Single-server probabilities of customers in the system<br />
MULTISERVER WAITING LINE MODEL<br />
In the single-line, multiserver, single-phase model, customers form a single line and<br />
are served by the first server available. The model assumes that there are s identical<br />
servers, the service time distribution for each server is exponential, and the mean service<br />
time is 1/�. Using these assumptions, we can describe the operating characteristics<br />
with the following formulas:<br />
s � the number of servers in the system<br />
p � �<br />
s� � the average utilization of the system<br />
P0 � �� s�1<br />
n�0<br />
LQ � Po(�/�) s p<br />
� the average number of customers waiting in line<br />
2 s!(1 � p)<br />
W Q � L Q<br />
�<br />
(�/�)n<br />
n!<br />
� (�/�)s<br />
s!<br />
the probability that no customers<br />
� are in the system<br />
1<br />
1 � p�� �1<br />
�<br />
� the average time spent waiting in line<br />
W � WQ � 1 � � the average time spent in the system, including service<br />
L � �W � the average number of customers in the service system
Note: The total service rate must be greater than the arrival rate, that is, s� � �. If<br />
s� � �, the waiting line would eventually grow infinitely large. Before using the formulas,<br />
check to be sure that s� � �.<br />
Multiserver Operating Characteristics at the Help Desk<br />
MULTISERVER WAITING LINE MODEL • C11<br />
EXAMPLE C.2<br />
State University has decided to increase the number of computer assignments in its curriculum and is concerned about the impact<br />
on the help desk. Instead of a single person working at the help desk, the university is considering a plan to have three identical service<br />
providers. It expects that students will arrive at a rate of 45 per hour, according to a Poisson distribution. The service rate for<br />
each of the three servers is 18 students per hour, with exponential service times. Calculate the following operating characteristics of<br />
the service system:<br />
(a) The average utilization of the help desk<br />
(b) The probability that there are no students in the system<br />
(c) The average number of students waiting in line<br />
(d) The average time a student spends waiting in line<br />
(e) The average time a student spends in the system<br />
(f) The average number of students in the system<br />
Problem-Solving Tip: By definition, zero factorial, 0!, equals 1.<br />
• Solution:<br />
�<br />
(a) Average utilization: p �<br />
s�<br />
�0.833, or 83.3%<br />
(b) The probability that there are no students in the system:<br />
�<br />
45<br />
(3 � 18)<br />
P0 � �� s�1<br />
n�0<br />
(�/�)n<br />
n!<br />
� � (45/18)0<br />
0!<br />
(c) The average number of students waiting in line:<br />
(d) The average time a student spends waiting in line: WQ �<br />
(e) The average time a student spends in the system:<br />
�<br />
3.5<br />
� �0.078 hour, or 4.68 minutes<br />
45<br />
(f) The average number of students in the system:<br />
� (�/�)s<br />
s! � 1<br />
1 � p�� �1<br />
� (45/18)1<br />
1!<br />
� (45/18)2<br />
2!<br />
1<br />
� � 0.045, or 4.5% of having no students in the system<br />
22.215<br />
LQ � P0(�/�) s p<br />
s!(1 � p) 2 � 0.045(45/18)3 � 0.833<br />
3! � (1 � 0.833) 2 � 0.5857<br />
0.1673<br />
L Q<br />
W � WQ � 1<br />
1<br />
� 0.078 � � 0.134 hour, or 8.04 minutes<br />
m 18<br />
L � �W � 45(0.134) � 6.03 students<br />
� � (45/18)3 1<br />
3! �1 � 0.833��� �1<br />
� 3.5 students<br />
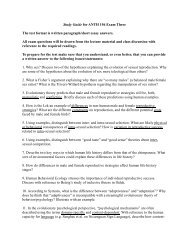
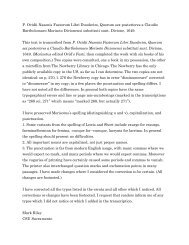
Figure C-5 shows a spreadsheet solution of this problem. The spreadsheet formulas are a direct implementation of the multiple-server<br />
formulas for performance measures. Because of the complexity of the P 0 calculation, the columns E–H break this computation down.
C12 • SUPPLEMENT C WAITING LINE MODELS<br />
Then the formula in cell B16 looks up the value from column H corresponding to the number of servers. The spreadsheet shown here<br />
will work for up to a 100-server system. Key formulas are listed here:<br />
FIGURE C-5<br />
Key Formulas<br />
F10: � F$5∧E10 (copied down)<br />
G10: � E10*G9 (copied down)<br />
H10: � H9�(F10/G10) (copied down)<br />
F5: � B5/B6<br />
F6: � INDEX(G9:G109, B7�1)<br />
B10: � 1/B5<br />
B11: � 1/B6<br />
B12: � B7*B6<br />
B15: � B5/B12<br />
B16: � (INDEX(H9:H109, B7)�(((F5∧B7)/F6)*((1)/(1�B15))))∧(�1)<br />
B17: � B5*B19<br />
B18: � (B16*(F5∧B7)*B15)/(INDEX(G9:G109, B7�1)*(1�B15)∧2)<br />
B19: � B20�(1/B6)<br />
B20: � B18/B5<br />
B24: � IF(B23 ��B7, ((F5∧B23)*B16)/INDEX(G9:G109, B23�1),<br />
((F5∧B23)*B16)/(INDEX(G9:G109, B7�2)*(B7∧(B23�B7))))<br />
Spreadsheet for multiple-server operating characteristics
Figure C-6 is a graph of the probabilities of certain numbers of customers in the system.<br />
FIGURE C-6<br />
Multiple-server probabilities of customers in the system<br />
CHANGING OPERATIONAL CHARACTERISTICS • C13<br />
CHANGING OPERATIONAL CHARACTERISTICS<br />
After calculating the operating characteristics for a waiting line system, sometimes you<br />
need to change the system to alter its performance. Let’s look at the type of changes<br />
you can make to the different elements of the waiting line system.<br />
Customer arrival rates. You can try to change arrival rates in a number of ways.<br />
For example, you can provide discounts or run special promotions during the<br />
nonpeak hours to attract customers.<br />
Number and type of service facilities. You can either increase or decrease the number<br />
of server facilities. For example, a grocery store can easily change the number<br />
of cashiers open for business (up to the number of registers available). The<br />
store increases the number of cashiers open when lines are too long.<br />
Another approach is to dedicate specific servers for specific transactions. One<br />
example would be to limit the number of items that can be processed at a particular<br />
cashier (ten items or less) or to limit a cashier to cash-only transactions.<br />
Still another possibility is to install self-service checkout systems.<br />
Changing the number of phases. You can use a multiphase system where servers<br />
specialize in a portion of the total service rather than needing to know the entire<br />
service provided. Since a server has fewer tasks to learn, the individual<br />
server proficiency should improve. This goes back to the concept of division of<br />
labor.
C14 • SUPPLEMENT C WAITING LINE MODELS<br />
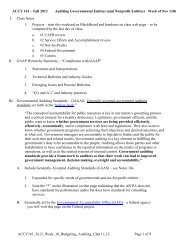
FIGURE C-7<br />
Customer service<br />
center simulation<br />
layout<br />
Server efficiency. You can improve server efficiency through process improvements<br />
or dedication of additional resources. For example, cashier accuracy and speed<br />
are improved through the use of scanners. Service speed can also be increased by<br />
dedicating additional resources. For example, if a grocery bagger is added at<br />
each cashier station, service speed will be improved and customers will flow<br />
through the system more quickly.<br />
Changing the priority rule. The priority rule determines who should be served next.<br />
There are priority rules other than first-come, first-served. If you want to change<br />
priority rules, consider the impact on those customers who will wait longer.<br />
Changing the number of lines. Changing to a single-line model from a multiline<br />
model is most appropriate when the company is concerned about fairness for its<br />
customers. A single line ensures that customers do not jockey in an attempt to<br />
gain an advantage over another customer. Multiline models easily accommodate<br />
specialty servers (express lanes).<br />
Once changes are suggested, evaluate their impact on the performance characteristics<br />
of the waiting line system. Changes in one area can require changes in other areas. For<br />
example, if you achieve a more constant customer arrival rate, you may be able to reduce<br />
the number of service facilities.<br />
LARGER-SCALE WAITING LINE SYSTEMS<br />
This supplement provides an introduction to waiting line system analysis. There are<br />
many variations of the mathematical models that are not discussed here, such as finite<br />
queue length, finite customer population, and nonexponential arrival and service times.<br />
As waiting line systems become more complex, especially as they involve more than one<br />
phase, concise mathematical formulas in general do not exist for system performance<br />
measures. Therefore, for most larger-scale waiting line systems, discrete-event simulation<br />
is often used to analyze these systems. Discrete-event simulation products allow the<br />
user to define the system, arrival and service patterns, and other aspects of the system.<br />
Then the simulation is run to mimic the behavior of the system in reality, and the results<br />
are statistically analyzed to determine system performance. Figure C-7 shows a
screen shot from a model completed in the ProcessModel simulation software. In this<br />
system, calls arrive at a customer service center and are answered by one operator (with<br />
a second operator as a backup server). Some calls are resolved quickly, others need further<br />
research, and still others don’t get answered in a timely fashion and the callers renege<br />
(hang up) before being served. Once the system is completely specified, including<br />
arrival and service rates, the simulation is run and system performance measures are<br />
automatically calculated.<br />
SUPPLEMENT HIGHLIGHTS • C15<br />
WAITING LINE MODELS WITHIN OM: HOW IT ALL FITS TOGETHER<br />
Although it is unlikely that you calculate performance measures for the lines you<br />
wait in on a day-to-day basis, you should now be aware of the potential for mathematical<br />
analysis of these systems. More importantly, management has a tool by<br />
which it can evaluate system performance and make decisions as to how to improve<br />
the performance while weighing performance against the costs to achieve that<br />
performance.<br />
<strong>Waiting</strong> line models are important to a company because they directly affect customer<br />
service perception and the costs of providing a service. Several functional areas<br />
are affected by waiting line decisions. Accounting is concerned with the cost of the<br />
waiting line system used. If system average utilization is low, that suggests the waiting<br />
line design is inefficient and too expensive. Poor system design can result in<br />
overstaffing or unnecessary capital acquisitions in an effort to improve customer service.<br />
Marketing is concerned about response time for customers—how long customers<br />
must wait in line before being served and how long it takes to be served.<br />
Quick service or response can be a competitive advantage. Long waits suggest a lack<br />
of concern by the organization or can be linked to a perception of poor service quality.<br />
Purchasing must be sure to buy capital equipment capable of achieving the proposed<br />
service rate. Operations uses waiting line theory to estimate queues or waiting<br />
times at different processing points, to allow for a better estimate of lead time and<br />
improve due-date delivery promising. Operations is also affected by the system design.<br />
When single-phase systems are used, operators must have greater skills. The organization<br />
needs to hire employees with higher skill levels or provide training to<br />
upgrade the workforce.<br />
Supplement Highlights<br />
1 The elements of a waiting line system include the<br />
customer waits in line, and the probability of n customers<br />
customer population source, the patience of the customer, in the service system.<br />
the service system, arrival and service distributions, waiting<br />
line priority rules, and system performance measures.<br />
Understanding these elements is critical when analyzing<br />
waiting line systems.<br />
3<br />
The benefit of calculating operational characteristics is<br />
to provide management with information as to whether<br />
system changes are needed. Management can change the<br />
operational performance of the waiting line system by<br />
2 <strong>Waiting</strong> line models allow us to estimate system<br />
altering any or all of the following: the customer arrival<br />
performance by predicting average system utilization,<br />
rates, the number of service facilities, the number of phases,<br />
average number of customers in the service system,<br />
server efficiency, the priority rule, and the number of lines<br />
average number of customers waiting in line, average<br />
in the system. Based on proposed changes, management<br />
time a customer spends in the system, average time a<br />
can then evaluate the expected performance of the system.
C16 • SUPPLEMENT C WAITING LINE MODELS<br />
Key Terms<br />
waiting line system C2<br />
queuing system C2<br />
finite customer population C3<br />
Formula Review<br />
For Single-Server <strong>Waiting</strong> <strong>Line</strong> <strong>Models</strong><br />
infinite customer population C4<br />
balking C4<br />
reneging C4<br />
is the average utilization of the system<br />
W � is the average number of customers in the<br />
service system<br />
LQ � pL is the average number of customers waiting in line<br />
W � is the average time spent waiting in the system,<br />
including service<br />
WQ � pW is the average time spent waiting in line<br />
Pn � (1 � p)pn p �<br />
�<br />
� � �<br />
1<br />
� � �<br />
is the probability that n customers are in the<br />
service system at a given time<br />
� �<br />
Solved Problems<br />
• Problem 1<br />
The local Division of Motor Vehicles (DMV) is concerned with<br />
its waiting line system. Currently, the DMV uses a single-server,<br />
single-line, single-phase system when processing license renewals.<br />
Based on historical evidence, the average number of<br />
customers arriving per hour is 9 and is described by a Poisson<br />
distribution. The service rate is 12 customers per hour with the<br />
service times following an exponential distribution. The customers<br />
are patient and come from an infinite population. The<br />
manager of the DMV would like you to calculate the operational<br />
characteristics of the waiting line system.<br />
(a) What is the average system utilization?<br />
(b) What is the average number of customers in the system?<br />
(c) What is the average number of customers waiting in line?<br />
jockeying C4<br />
arrival rate C6<br />
service rate C6<br />
For the Multiserver <strong>Waiting</strong> <strong>Line</strong> Model<br />
is the average utilization of the system<br />
P0 ��� is the probability<br />
that no customers are in the system<br />
s�1<br />
n�0<br />
(�/�)n<br />
�<br />
n!<br />
(�/�)s<br />
s! � 1<br />
1 � p�� �1<br />
p � �<br />
s�<br />
Po(�/�) LQ � is the average number of customers waiting<br />
in line<br />
s p<br />
s!(1 � p) 2<br />
W Q � L Q<br />
�<br />
is the average time spent waiting in line<br />
W � WQ � is the average time spent in the system,<br />
including service<br />
1 �<br />
L � �W is the average number of customers in the service system<br />
(d) What is the average time a customer spends in the system?<br />
(e) What is the average time a customer spends waiting in line?<br />
• Before You Begin<br />
The key here is identifying the mean arrival rate and the mean<br />
service rate. The average number of customers per hour is given<br />
as 9. The server is able to service 12 customers per hour on average.<br />
Plug these values into the appropriate formula.<br />
• Solution<br />
(a) Average utilization is 0.75, or 75 percent.<br />
p � � 9<br />
� � � 0.75<br />
12
(b) Average number of customers in the system is 3.<br />
L � �<br />
� � � �<br />
9<br />
� 3 customers<br />
12 � 9<br />
(c) Average number of customers waiting in line is 2.25.<br />
L Q � pL � 0.75 � 2.25 customers<br />
(d) Average time a customer spends in the system is 0.33<br />
hours, or 20 minutes.<br />
1<br />
W �<br />
� � � �<br />
1<br />
� 0.33 hours<br />
12 � 9<br />
1<br />
2<br />
3<br />
4<br />
5<br />
6<br />
7<br />
8<br />
9<br />
10<br />
11<br />
12<br />
13<br />
14<br />
15<br />
16<br />
17<br />
18<br />
19<br />
20<br />
21<br />
22<br />
• Problem 2<br />
The county has decided to consolidate several of its DMV facilities<br />
into a larger, centrally located facility. The DMV manager<br />
wants you to calculate the operational characteristics of<br />
a multiserver, single-phase waiting line system. The arrival<br />
rate is expected to be 72 customers per hour and follows a<br />
Poisson distribution. The number of identical servers is<br />
seven. Each server will be able to serve an average of 12 customers<br />
per hour. The service times are described by an exponential<br />
distribution. Your job is to calculate the following:<br />
(a) The average system utilization<br />
(b) The probability of no customers in the system<br />
(c) The average number of customers waiting in line<br />
(d) The average time a customer waits in line<br />
(e) The average time a customer spends in the system<br />
• Before You Begin<br />
Once again, the key is identifying the mean arrival rate and the<br />
mean service rate. Here the arrival rate is given as 72 customers<br />
(e) Average time a customer spends waiting in line is 0.25<br />
hours, or 15 minutes.<br />
W Q � pW � 0.75 � 0.33 � 0.25 hours<br />
These operational characteristics can be calculated as shown<br />
in the spreadsheet. Using a spreadsheet allows the modeler to<br />
vary parameters quickly and see the resulting operational<br />
characteristics.<br />
Note: This is the same spreadsheet model as introduced with<br />
Example C.1; only the input values have been changed.<br />
A B C<br />
Queuing Analysis: Single Server<br />
Solved Problem C.1<br />
Inputs<br />
Time unit hour<br />
Arrival Rate (lambda) 9 customers/hour<br />
Service Rate (mu) 12 customers/hour<br />
Intermediate Calculations<br />
Average time between arrivals 0.111111 hour<br />
Average service time 0.083333 hour<br />
Performance Measures<br />
Rho (average server utilization) 0.75<br />
P0 (probability the system is empty) 0.25<br />
L (average number in the system) 3 customers<br />
Lq (average number waiting in the queue) 2.25 customers<br />
W (average time in the system) 0.333333 hour<br />
Wq (average time in the queue) 0.25 hour<br />
Probability of a specific number of customers in the system<br />
Number 2<br />
Probability 0.140625<br />
per hour, while each of the seven servers is able to serve 12 customers<br />
per hour. Therefore, 84 customers can be served per hour.<br />
• Solution<br />
(a) Average system utilization is 0.857, or 85.7 percent.<br />
(b) The probability that no customers are in the system is<br />
0.0016, or 0.2 percent.<br />
P0 � �� s�1<br />
n�0<br />
(�/�)n<br />
n!<br />
� �� (72/12)0<br />
0!<br />
� (72/12)1<br />
1!<br />
� 1<br />
�<br />
� 0.001579<br />
623.8 (72/12)5<br />
�<br />
5!<br />
(72/12)6<br />
p � � 72<br />
� � 0.8571<br />
s� 7 � 12<br />
� (�/�)s<br />
s!<br />
� 1<br />
1 � p�� �1<br />
� (72/12)2<br />
2!<br />
6! � � � (72/12)7<br />
7!<br />
SOLVED PROBLEMS • C17<br />
� (72/12)3<br />
�<br />
3!<br />
(72/12)4<br />
4!<br />
� 1<br />
1 � p��� �1
C18 • SUPPLEMENT C WAITING LINE MODELS<br />
(c) The average number of customers waiting in line is 3.68.<br />
L Q � P 0(�/�) s p<br />
s!(1 � p) 2<br />
� 0.001579(72/12)7 � 0.857<br />
7!(1 � 0.857) 2 � 3.683 customers<br />
(d) The average time spent waiting in line is 0.05115 hours, or<br />
3.07 minutes.<br />
W Q � L Q<br />
�<br />
3.683<br />
� � 0.05115 hours<br />
72<br />
1<br />
2<br />
3<br />
4<br />
5<br />
6<br />
7<br />
8<br />
9<br />
10<br />
11<br />
12<br />
13<br />
14<br />
15<br />
16<br />
17<br />
18<br />
19<br />
20<br />
21<br />
22<br />
23<br />
24<br />
Discussion Questions<br />
1. Describe the elements of a waiting line system.<br />
2. Provide examples of when a single-line, single-server, singlephase<br />
waiting line system is appropriate.<br />
3. Describe the operating performance characteristics calculated<br />
for evaluating waiting line systems.<br />
4. Describe the implications for customer service and server<br />
skills when using a single-line, single-server, single-phase waiting<br />
line system.<br />
5. Describe the implications for customer service and server<br />
skills when using a single-line, multiserver, single-phase waiting<br />
line system.<br />
(e) The average time a customer spends in the system is 0.1345<br />
hours, or 8.07 minutes.<br />
W � WQ � 1 1<br />
� � 0.05115 � � 0.1345 hours<br />
12<br />
The spreadsheet solution is shown. This model is the same as that<br />
introduced with Example C.2, with only the input values changed.<br />
A B C<br />
Queuing Analysis: Multiple Servers<br />
Solved Problem C.2<br />
Inputs<br />
Time unit hour<br />
Arrival Rate (lambda) 72 customers/hour<br />
Service Rate per Server (mu) 12 customers/hour<br />
Number of Servers (s) 7 servers<br />
Intermediate Calculations<br />
Average time between arrivals 0.013889 hour<br />
Average service time per server 0.083333 hour<br />
Combined service rate (s*mu) 84 customers/hour<br />
Performance Measures<br />
Rho (average server utilization) 0.857143<br />
P0 (probability the system is empty) 0.001579<br />
L (average number in the system) 9.682981 customers<br />
Lq (average number waiting in the queue) 3.682981 customers<br />
W (average time in the system) 0.134486 hour<br />
Wq (average time in the queue) 0.051153 hour<br />
Probability of a specific number of customers in the system<br />
Number 5<br />
Probability 0.102305<br />
6. Describe the implications for customer service and server<br />
skills when a multiserver, multistage waiting line system is used.<br />
7. Describe a situation in your daily life that could be improved<br />
by waiting line analysis.<br />
8. Explain how the design of a waiting system can negatively<br />
affect customers.<br />
9. Visit your local bank and observe the waiting line system.<br />
Describe the system in terms of number of lines, number of facilities,<br />
and number of phases.<br />
10. On your next trip to the Division of Motor Vehicles, evaluate<br />
its waiting line system.<br />
11. Describe any disadvantages of using waiting line models.
Problems<br />
1. Melanie is the manager of the Clean Machine car wash and<br />
has gathered the following information. Customers arrive at a<br />
rate of eight per hour according to a Poisson distribution. The<br />
car washer can service an average of ten cars per hour with service<br />
times described by an exponential distribution. Melanie is<br />
concerned about the number of customers waiting in line. She<br />
has asked you to calculate the following system characteristics:<br />
(a) Average system utilization<br />
(b) Average number of customers in the system<br />
(c) Average number of customers waiting in line<br />
2. Melanie realizes that how long the customer must wait is<br />
also very important. She is also concerned about customers balking<br />
when the waiting line is too long. Using the arrival and service<br />
rates in Problem 1, she wants you to calculate the following<br />
system characteristics:<br />
(a) The average time a customer spends in the system<br />
(b) The average time a customer spends waiting in line<br />
(c) The probability of having more than three customers in<br />
the system<br />
(d) The probability of having more than four customers in<br />
the system<br />
3. If Melanie adds an additional server at Clean Machine car<br />
wash, the service rate changes to an average of 16 cars per hour.<br />
The customer arrival rate is 10 cars per hour. Melanie has asked<br />
you to calculate the following system characteristics:<br />
(a) Average system utilization<br />
(b) Average number of customers in the system<br />
(c) Average number of customers waiting in line<br />
4. Melanie is curious to see the difference in waiting times for<br />
customers caused by the additional server added in Problem 3.<br />
Calculate the following system characteristics for her:<br />
(a) The average time a customer spends in the system<br />
(b) The average time a customer spends waiting in line<br />
(c) The probability of having more than three customers in<br />
the system<br />
(d) The probability of having more than four customers in<br />
the system<br />
CASE: The Copy Center Holdup<br />
Catherine Blake, the office manager for the College of Business Administration,<br />
has received numerous complaints lately from several<br />
department chairpersons. In the past few months, the chairpersons<br />
have insisted that something be done about the amount of time<br />
their administrative assistants waste waiting in line to make copies.<br />
Currently, the college has two photocopy centers dedicated to small<br />
copying jobs: copy center A on the third floor and copy center B on<br />
the fourth floor. Both centers are self-serve and have identical processing<br />
capabilities. The copying machines are not visible to the administrative<br />
assistants from their offices. When copying is required,<br />
the administrative assistant goes to the copy room and waits in line<br />
CASE: THE COPY CENTER HOLDUP • C19<br />
5. After Melanie added another car washer at Clean Machine<br />
(service rate is an average of 16 customers per hour), business<br />
improved. Melanie now estimates that the arrival rate is 12 customers<br />
per hour. Given this new information, she wants you to<br />
calculate the following system characteristics:<br />
(a) Average system utilization<br />
(b) Average number of customers in the system<br />
(c) Average number of customers waiting in line<br />
6. As usual, Melanie then requested you to calculate system<br />
characteristics concerning customer time spent in the system.<br />
(a) Calculate the average time a customer spends in the<br />
system.<br />
(b) Calculate the average time a customer spends waiting in<br />
line.<br />
(c) Calculate the probability of having more than four customers<br />
in the system.<br />
7. Business continues to grow at Clean Machine. Melanie has<br />
decided to use a second car washing bay, staffed with another<br />
identical two-person team. Clean Machine will now use a singleline,<br />
multiserver, single-phase waiting line system. The arrival<br />
rate is estimated to average 24 customers per hour according to a<br />
Poisson distribution. Each of the car wash teams can service an<br />
average of 16 customers per hour according to an exponential<br />
distribution. Calculate the following operational characteristics:<br />
(a) Average system utilization<br />
(b) Average number of customers in the system<br />
(c) Average number of customers waiting in line<br />
(d) Average time a customer spends in the system<br />
(e) Average time a customer spends waiting in line<br />
(f) Probability of having more than four customers in the<br />
system.<br />
8. Melanie is very concerned about the number of customers<br />
waiting in line. Given the information in Problem 7,<br />
calculate how high the customer arrival rate can increase without<br />
the average number of customers waiting in line exceeding<br />
four.<br />
to make the necessary copies. Catherine’s assistant, Brian, was assigned<br />
to investigate the problem.<br />
Brian reported that, on average, administrative assistants arrive<br />
at copy center A at the rate of 10 per hour and at copy center<br />
B at the rate of 14 per hour. Each of the copy centers can<br />
service 15 jobs per hour. The administrative assistants’ arrivals<br />
essentially follow a Poisson distribution, and the service times<br />
are approximated by a negative exponential distribution. Brian<br />
has proposed that the two copy centers be combined into a single<br />
copy center with either two or three identical copy machines.<br />
He estimates that the arrival rate would be 24 per hour. Each
C20 • SUPPLEMENT C WAITING LINE MODELS<br />
machine would still service 15 jobs per hour. Currently, administrative<br />
assistants earn an average of $15 per hour.<br />
(a) Determine the utilization of each of the copy centers.<br />
(b) Determine the average waiting time at each of the copy<br />
centers.<br />
(c) What is the annual cost of the administrative assistants’<br />
average waiting time using the current system?<br />
(d) Determine the utilization of the combined copy center<br />
with two copiers.<br />
(e) Determine the average waiting time at the combined<br />
copy center.<br />
On-line Resources<br />
Visit our dynamic Web site,<br />
www.wiley.com/college/reid, for more cases, Web<br />
links, and additional information.<br />
1. Spreadsheets for Examples C.1 and C.2 and<br />
Solved Problems 1 and 2 are available on the CD.<br />
2. Additional Web Resources<br />
• Real Queuing Examples:<br />
http://www2.uwindsor.ca/�hlynka/qreal.html<br />
This site contains excerpts from news articles<br />
that deal with aspects of waiting lines.<br />
• ClearQ: http://clearq.com/ This company<br />
produces “take-a-number” systems for service<br />
facilities (e.g., delis), but also provides<br />
performance information about the waiting line.<br />
• Qmatic: http://us.q-matic.com/index.html This<br />
company produces informational displays and<br />
other products to keep customers informed<br />
about waiting times.<br />
• “Queuing Presentation” by Richard Larson, given<br />
at the Institute for Operations Research and the<br />
Management Sciences:<br />
http://caes.mit.edu/people/larson/MontrealINFOR<br />
MS1/sld001.htm.<br />
• The Queuing Theory Tutor:<br />
http://www.dcs.ed.ac.uk/home/jeh/Simjava/queuei<br />
ng/mm1_q/mm1_q.html. This site has two<br />
Selected Bibliography<br />
Albright, S. Christian, and Wayne Winston. Essentials of Practical<br />
Management Science. Mason, OH: Cengage, 2005.<br />
Hall, Randolph W. Queueing Methods for Services and Manufacturing.<br />
Englewood Cliffs, N.J.: Prentice-Hall, 1991.<br />
(f) What would be the annual cost of the administrative assistants’<br />
average waiting time using the combined twocopier<br />
setup?<br />
(g) What would be the utilization of the combined copy<br />
center with three copiers?<br />
(h) What would be the annual cost of the administrative assistants’<br />
average waiting time using the combined threecopier<br />
setup?<br />
(i) What would you recommend to Catherine?<br />
animated displays of waiting lines. The user can<br />
change arrival and service rates to see how<br />
performance is affected.<br />
• Myron Hlynka’s Queuing Page:<br />
http:www2.uwindsor.ca/�hlynka/queue.html. This<br />
Web site contains information about waiting lines<br />
as well as links to other interesting sites.<br />
• Queuing ToolPak:<br />
http://www.bus.ualberta.ca/aingolfsson/qtp/.The<br />
Queuing ToolPak is an Excel add-in that allows<br />
you to easily compute performance measures for<br />
a number of different waiting line models.<br />
Internet Challenge<br />
Visit the Web site for the United Network for Organ Sharing<br />
(UNOS) �http://www.unos.org�. This is the United States organization<br />
coordinating the donation, assignment, and transplantation<br />
of human organs. Research the organ donation situation,<br />
and prepare a report summarizing your findings from a waiting<br />
line standpoint. What are some of the important performance<br />
measures in this waiting line system? Describe the elements of<br />
the waiting line system. What is the priority rule used for selecting<br />
the next customer? Propose at least two other priority rules,<br />
and discuss what changes you think would occur in the operating<br />
characteristics. Besides the quantitative performance characteristics,<br />
what other considerations would need to be made in<br />
order to change the priority rule? Support your discussion with<br />
data and information obtainable at the UNOS Web site.<br />
Moore, P.M. Queues, Inventories and Maintenance. New York: Wiley,<br />
1958.<br />
Ragsdale, Cliff T. Spreadsheet Modeling & Decision Analysis, Fifth<br />
Edition. Stamford, Conn.: Thomson, 2008.