best available technologies for manure treatment - Baltic Green Belt
best available technologies for manure treatment - Baltic Green Belt
best available technologies for manure treatment - Baltic Green Belt

Create successful ePaper yourself
Turn your PDF publications into a flip-book with our unique Google optimized e-Paper software.
Best Available Technologies <strong>for</strong> <strong>manure</strong> <strong>treatment</strong> baltic sea 2020<br />
1: INTRODUCTION AND BACKGROUND DESCRIPTION<br />
Best Available Techniques <strong>for</strong> <strong>manure</strong> <strong>treatment</strong> - <strong>for</strong> intensive rearing of pigs in <strong>Baltic</strong> Sea Region EU Member<br />
States<br />
Approximately 30% of the <strong>Baltic</strong> population lives in the countryside. The <strong>Baltic</strong> Sea<br />
covers an area of around one fourth of the total catchment area.<br />
Table 2 shows a calculation of the load of N and P in livestock <strong>manure</strong> in all the target<br />
countries.<br />
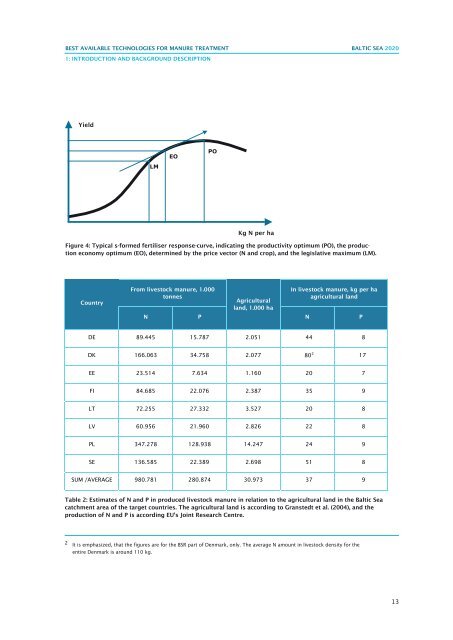
Figure 4: Typical s-<strong>for</strong>med fertiliser response-curve, indicating the productivity optimum (PO), the production<br />
economy optimum (EO), determined by the price vector (N and crop), and the legislative maximum (LM).<br />
Table 2: Estimates of N and P in produced livestock <strong>manure</strong> in relation to the agricultural land in the<br />
<strong>Baltic</strong> Sea catchment area of the target countries. The agricultural land is according to Granstedt et<br />
al. (2004), and the production of N and P is according EU’s Joint Research Centre.<br />
Country<br />
From livestock <strong>manure</strong>, 1.000<br />
tonnes<br />
N<br />
P<br />
Agricultural<br />
land, 1.000 ha<br />
In livestock <strong>manure</strong>, kg per ha<br />
agricultural land<br />
N<br />
P<br />
DE 89.445 15.787 2.051 44 8<br />
DK 166.063 34.758 2.077 80 2 17<br />
EE 23.514 7.634 1.160 20 7<br />
FI 84.685 22.076 2.387 35 9<br />
LT 72.255 27.332 3.527 20 8<br />
LV 60.956 21.960 2.826 22 8<br />
PL 347.278 128.938 14.247 24 9<br />
SE 136.585 22.389 2.698 51 8<br />
SUM /AVERAGE 980.781 280.874 30.973 37 9<br />
Table 2: Estimates of N and P in produced livestock <strong>manure</strong> in relation to the agricultural land in the <strong>Baltic</strong> Sea<br />
catchment area of the target countries. The agricultural land is according to Granstedt et al. (2004), and the<br />
It is by comparison of Table 1 and Table 2 seen, that the average level of N and P in the<br />
production of N and P is according EU’s Joint Research Centre.<br />
produced livestock <strong>manure</strong> is far below the needs of the crops, as defined by the Danish<br />
fertiliser norms in Table 1 (economic optimal norms, politically reduced with 10% in case<br />
of N) as well indicated by the Nitrates Directive, setting a limit of 170 kg N in livestock<br />
2 It is emphasized, that the figures are <strong>for</strong> the BSR part of Denmark, only. The average N amount in density <strong>for</strong> the<br />
<strong>manure</strong> per ha. The highest production of plant nutrients in livestock <strong>manure</strong>, i.e. the<br />
entire Denmark is around 110 kg.<br />
livestock density, is seen in the Danish part of the <strong>Baltic</strong> Sea catchment area, followed by<br />
Sweden.<br />
It is on basis of data in Table 1 and Table 2 concerning fertiliser norms (norms have a<br />
certain correlation to the removal by the crops) and the livestock density in the target<br />
countries, suggested that the minimising of P leaching from livestock <strong>manure</strong> first of all is<br />
ensured via distribution on a sufficiently large agricultural area. There is in the BSR<br />
averagely 37 kg N and 9 kg P per ha in the produced livestock <strong>manure</strong> (Table 2) – it<br />
would in relation to the Nitrates Directive be possible to expand the livestock production<br />
(170 kg N/ha / 37 kg N/ha =) 4.6 times, and in relation to the need of P as nutrient <strong>for</strong><br />
13