Annual report 2010 - Woolworths Holdings Limited
Annual report 2010 - Woolworths Holdings Limited
Annual report 2010 - Woolworths Holdings Limited

You also want an ePaper? Increase the reach of your titles
YUMPU automatically turns print PDFs into web optimized ePapers that Google loves.
<strong>2010</strong> ANNUAL REPORT PRINTED ON<br />
SOUTH AFRICAN SUGAR CANE WASTE<br />
WHL<br />
WOOLWORTHS<br />
HOLDINGS<br />
LIMITED
This annual <strong>report</strong><br />
is the first document<br />
to be printed on Sappi’s<br />
Masuga paper, which<br />
is made with 90% sugar<br />
cane waste sourced<br />
from previously<br />
disadvantaged local<br />
suppliers, and 10%<br />
wood fibre from<br />
sustainable forests.<br />
It supports our Good<br />
business journey<br />
goals of protecting<br />
the environment and<br />
empowering our people.
CONTENTS<br />
ANNUAL REPORT <strong>2010</strong><br />
FINANCIAL AND NON-FINANCIAL PERFORMANCE 3<br />
GROUP REVIEW 6<br />
DIRECTORATE 12<br />
REPORTS TO SHAREHOLDERS<br />
CHAIRMAN’S REPORT 14<br />
GROUP CHIEF EXECUTIVE OFFICER’S REPORT 20<br />
GROUP FINANCE DIRECTOR’S REPORT 26<br />
EXECUTIVE COMMITTEE 33<br />
ABRIDGED GOOD BUSINESS JOURNEY REPORT 34<br />
GOVERNANCE<br />
CORPORATE GOVERNANCE REPORT 40<br />
RISK REPORT 46<br />
REPORT OF THE AUDIT COMMITTEE 53<br />
REMUNERATION REPORT 59<br />
ANNUAL FINANCIAL STATEMENTS<br />
GROUP ANNUAL FINANCIAL STATEMENTS 72<br />
STATEMENT OF COMPREHENSIVE INCOME 78<br />
STATEMENT OF FINANCIAL POSITION 79<br />
STATEMENT OF CHANGES IN EQUITY 80<br />
STATEMENT OF CASH FLOWS 82<br />
NOTES TO THE GROUP ANNUAL FINANCIAL STATEMENTS 83<br />
COMPANY ANNUAL FINANCIAL STATEMENTS<br />
STATEMENT OF COMPREHENSIVE INCOME 152<br />
STATEMENT OF FINANCIAL POSITION 153<br />
STATEMENT OF CHANGES IN EQUITY 154<br />
STATEMENT OF CASH FLOWS 155<br />
NOTES TO THE COMPANY ANNUAL FINANCIAL STATEMENTS 156<br />
GLOSSARY OF TERMS 170<br />
SHAREHOLDER INFORMATION 174<br />
NOTICE OF ANNUAL GENERAL MEETING 178<br />
FORM OF PROXY 181<br />
2
<strong>2010</strong><br />
FINANCIAL AND NON-FINANCIAL PERFORMANCE<br />
<strong>2010</strong> 2009<br />
GROUP<br />
FINANCIAL PERFORMANCE<br />
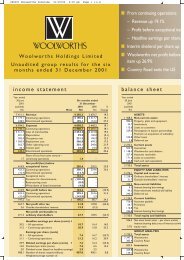
Turnover R23 393m R21 175m<br />
Adjusted headline earnings per share 157.2 cents 126.0 cents<br />
Distributions per share 105.0 cents *85.0 cents<br />
Operating margin 7.1% 6.9%<br />
Return on equity 39.4% 26.3%<br />
Cash generated from operations R2 083m R1 606m<br />
Total assets R9 010m R8 305m<br />
WOOLWORTHS<br />
OPERATING PERFORMANCE<br />
Trading space 525 403 m 2 507 277 m 2<br />
Number of stores 419 410<br />
Clothing and general merchandise<br />
sales growth 11.2% 0.2%<br />
Clothing, footwear and accessories<br />
market share 15.3% 14.4%<br />
Food sales growth 9.9% 7.4%<br />
Food market share 8.3% 8.5%<br />
NON-FINANCIAL PERFORMANCE<br />
Good business journey index % 84.0% 79.0%<br />
BBBEE score (points) 60.7 46.5<br />
Number of permanent employees 18 977 17 551<br />
Energy (reduction in relative<br />
consumption from benchmark) 18.0% 12.0%<br />
Water (reduction in relative<br />
consumption from benchmark) 26.0% 11.5%<br />
Foods packaging reduction 6.6% 3.3%<br />
Corporate social investment R314.0m R292.0m<br />
COUNTRY ROAD<br />
OPERATING PERFORMANCE<br />
Trading space 41 218 m 2 36 849 m 2<br />
Number of stores 160 149<br />
WOOLWORTHS FINANCIAL SERVICES<br />
OPERATING PERFORMANCE<br />
Gross Book Value R6 051m R6 242m<br />
Number of active accounts 1.858m 1.905m<br />
Impairment charge 5.1% 7.5%<br />
* excludes special dividend of 94.0 cents<br />
Recognition<br />
• Second in the South African Carbon<br />
Disclosure Project Leadership index<br />
• Included in the JSE SRI index for<br />
2009/10 and named as one of the<br />
best performers<br />
• 2009 annual <strong>report</strong> rated as<br />
Excellent in the E&Y Excellence<br />
in Corporate Reporting awards<br />
• Short listed as finalist for<br />
International Responsible Retailer<br />
of the Year<br />
• Winner of the President’s Award by<br />
South Africa’s Association for Food<br />
Science and Technology (SAAFoST)<br />
3
‘AS PASSIONATE<br />
COMMITTED<br />
RETAILERS, WE<br />
UNDERSTAND<br />
AND LEAD OUR<br />
CUSTOMERS<br />
THROUGH<br />
EXCELLENCE AND A<br />
DEEP KNOWLEDGE<br />
OF OUR PRODUCTS<br />
AND SERVICES AND<br />
THE WORLD WE<br />
LIVE IN.’<br />
4
WE LIVE THE WOOLWORTHS DIFFERENCE<br />
THROUGH OUR VALUES:<br />
QUALITY AND STYLE<br />
VALUE<br />
SERVICE<br />
INNOVATION<br />
INTEGRITY<br />
ENERGY<br />
DELIVER THE BEST<br />
A SIMPLE AND FAIR DEAL<br />
THINK CUSTOMER<br />
DISCOVER THE DIFFERENCE<br />
DO WHAT YOU SAY YOU WILL DO<br />
BE PASSIONATE AND DELIVER<br />
5
GROUP REVIEW<br />
PERIOD<br />
NUMBER OF WEEKS<br />
5-YEAR<br />
COMPOUND ANNUAL<br />
GROWTH RATE<br />
<strong>2010</strong><br />
52<br />
2009<br />
52<br />
2008<br />
53<br />
2007<br />
52<br />
2006<br />
52<br />
2005<br />
52<br />
2004<br />
52<br />
group statements of comprehensive income (Rm)<br />
REVENUE 12.7% 23 663 21 922 21 753 18 642 15 145 12 989 11 282<br />
TURNOVER 23 393 21 175 20 065 17 377 14 208 12 221 10 649<br />
COST OF SALES (15 656) (14 501) (13 798) (12 032) (9 844) (8 478) (7 312)<br />
GROSS PROFIT 7 737 6 674 6 267 5 345 4 364 3 743 3 337<br />
OTHER REVENUE 95 563 1 688 1 265 937 768 633<br />
EXPENSES (6 178) (5 784) (5 955) (4 764) (3 810) (3 280) (2 953)<br />
OPERATING PROFIT 6.1% 1 654 1 453 2 000 1 846 1 491 1 231 1 017<br />
INVESTMENT INCOME* 175 184 – – – – –<br />
INTEREST PAID (151) (281) (503) (379) (244) (152) (109)<br />
EARNINGS FROM ASSOCIATE 6 12 1 – – – –<br />
EARNINGS FROM JOINT VENTURES 75 58 – – – – –<br />
PROFIT BEFORE EXCEPTIONAL ITEMS 1 759 1 426 1 498 1 467 1 247 1 079 908<br />
EXCEPTIONAL ITEMS – 380 – 55 – – (10)<br />
PROFIT BEFORE TAX 1 759 1 806 1 498 1 522 1 247 1 079 898<br />
TAX (491) (546) (553) (435) (409) (300) (257)<br />
PROFIT FOR THE PERIOD 10.2% 1 268 1 260 945 1 087 838 779 641<br />
ATTRIBUTABLE TO:<br />
NON-CONTROLLING INTERESTS 10 12 8 12 2 2 1<br />
SHAREHOLDERS OF THE PARENT 1 258 1 248 937 1 075 836 777 640<br />
* Income received relating to investment activities has been separately disclosed from other revenue and is excluded from operating profit. The<br />
comparative information has been restated.<br />
Group STATEMENTS OF FINANCIAL POSITION (Rm)<br />
NON-CURRENT ASSETS 3 633 3 436 2 793 2 977 2 490 2 002 1 874<br />
CURRENT ASSETS 5 377 4 869 8 464 7 466 6 278 5 137 3 992<br />
TOTAL ASSETS 9 010 8 305 11 257 10 443 8 768 7 139 5 866<br />
EQUITY ATTRIBUTABLE TO<br />
SHAREHOLDERS OF THE PARENT 3 396 3 025 3 526 3 247 2 606 2 185 2 581<br />
NON-CONTROLLING INTEREST 57 47 52 43 28 26 21<br />
NON-CURRENT LIABILITIES 1 362 2 342 2 272 2 918 2 801 3 061 725<br />
CURRENT LIABILITIES 4 195 2 891 5 407 4 235 3 333 1 867 2 539<br />
TOTAL EQUITY AND LIABILITIES 9 010 8 305 11 257 10 443 8 768 7 139 5 866<br />
641<br />
779<br />
838<br />
1 087<br />
945<br />
1 260<br />
1 268<br />
5 866<br />
7 139<br />
8 768<br />
10 443<br />
11 257<br />
8 305<br />
9 010<br />
04 05 06 07 08 09 10<br />
PROFIT FROM CONTINUING OPERATIONS (RM)<br />
04 05 06<br />
TOTAL ASSETS (RM)<br />
07<br />
08<br />
09<br />
10<br />
6
PERIOD<br />
NUMBER OF WEEKS<br />
5-YEAR<br />
COMPOUND ANNUAL<br />
GROWTH RATE<br />
<strong>2010</strong><br />
52<br />
2009<br />
52<br />
2008<br />
53<br />
2007<br />
52<br />
2006<br />
52<br />
2005<br />
52<br />
2004<br />
52<br />
Group statementS OF CASH FLOWS (Rm)<br />
CASH INFLOW FROM TRADING 17.3% 2 220 1 652 1 308 1 374 1 073 996 794<br />
WORKING CAPITAL MOVEMENTS 215 67 (330) 184 185 (228) (7)<br />
CASH APPLIED TO FINANCIAL<br />
SERVICES ASSETS – 21 (24) (1 183) (882) (722) (710)<br />
CASH GENERATED BY OPERATING<br />
ACTIVITIES 2 435 1 740 954 375 376 46 77<br />
NET INTEREST RECEIVED 15 236 861 652 516 488 435<br />
TAX PAID (367) (370) (747) (565) (483) (315) (331)<br />
CASH GENERATED BY OPERATIONS 2 083 1 606 1 068 462 409 219 181<br />
DIVIDENDS RECEIVED FROM ASSOCIATE 1 1 1 – – – –<br />
DIVIDENDS RECEIVED FROM JOINT<br />
VENTURES 35 – – – – – –<br />
DISTRIBUTIONS TO SHAREHOLDERS (725) (655) (636) (551) (474) (384) (272)<br />
NET CASH INFLOW/(OUTFLOW)<br />
FROM OPERATING ACTIVITIES 1 394 952 433 (89) (65) (165) (91)<br />
NET CASH (OUTFLOW)/INFLOW<br />
FROM INVESTING ACTIVITIES (514) 2 625 (504) (527) (599) (313) (393)<br />
NET CASH (OUTFLOW)/INFLOW<br />
FROM FINANCING ACTIVITIES (364) (1 055) 374 794 11 1 443 55<br />
INCREASE/(DECREASE) IN CASH<br />
AND CASH EQUIVALENTS 516 2 522 303 178 (653) 965 (429)<br />
CASH AND CASH EQUIVALENTS<br />
AT THE BEGINNING OF THE PERIOD 2 391 (91) (423) (623) 23 (950) (515)<br />
EFFECT OF FOREIGN EXCHANGE RATES 10 (40) 29 22 7 8 (6)<br />
CASH AND CASH EQUIVALENTS<br />
AT THE END OF THE PERIOD 2 917 2 391 (91) (423) (623) 23 (950)<br />
2 220<br />
1 652<br />
1 374<br />
1 308<br />
996<br />
1 073<br />
794<br />
04 05 06 07 08 09<br />
CASH INFLOW FROM TRADING (RM)<br />
10<br />
7
GROUP REVIEW<br />
continued<br />
PERIOD <strong>2010</strong> 2009 2008 2007 2006 2005* 2004<br />
NUMBER OF WEEKS 52 52 53 52 52 52 52<br />
RETURNS<br />
RETURN ON ORDINARY SHAREHOLDERS’ EQUITY (%) 39.4 26.3 27.5 35.1 34.8 31.2 27.4<br />
– HEADLINE EARNINGS AS A PERCENTAGE OF THE<br />
AVERAGE OF ORDINARY SHAREHOLDERS’ INTEREST<br />
AT THE BEGINNING AND END OF THE PERIOD<br />
RETURN ON ASSETS (%)* 19.3 16.9 18.8 19.4 18.9 19.3 19.6<br />
– OPERATING PROFIT AS A PERCENTAGE OF THE<br />
AVERAGE OF TOTAL ASSETS LESS DEFERRED<br />
TAX LIABILITY AT THE BEGINNING AND END<br />
OF THE PERIOD<br />
MARGINS<br />
GROSS MARGIN (%) 33.1 31.5 31.2 30.8 30.7 30.6 31.3<br />
– GROSS PROFIT AS A PERCENTAGE OF TURNOVER<br />
OPERATING MARGIN (%)* 7.1 6.9 9.2 9.9 9.8 9.5 9.0<br />
– OPERATING PROFIT AS A PERCENTAGE<br />
OF TURNOVER (REVENUE IN 2008 AND PRIOR PERIODS)<br />
SOLVENCY AND LIQUIDITY<br />
DEBT RATIO (%) 17.3 18.1 40.8 37.9 39.2 36.4 19.4<br />
– INTEREST-BEARING DEBT AS A PERCENTAGE OF<br />
TURNOVER (REVENUE IN 2009 AND PRIOR PERIODS)<br />
CURRENT RATIO (TIMES) 1 2 1 2 2 3 2<br />
– CURRENT ASSETS DIVIDED BY CURRENT LIABILITIES<br />
TOTAL LIABILITIES TO SHAREHOLDERS’ EQUITY (%) 160.9 170.4 214.6 217.5 235.4 225.6 126.5<br />
– NON-CURRENT LIABILITIES, PLUS DEFERRED TAX<br />
AND CURRENT LIABILITIES AS A PERCENTAGE<br />
OF TOTAL SHAREHOLDERS’ INTEREST<br />
* Income received relating to investment activities has been separately disclosed from other revenue and is excluded from operating profit.<br />
The comparative information has been restated.<br />
8
PERIOD<br />
NUMBER OF WEEKS<br />
5-YEAR<br />
COMPOUND ANNUAL<br />
GROWTH RATE<br />
<strong>2010</strong><br />
52<br />
2009<br />
52<br />
2008<br />
53<br />
2007<br />
52<br />
2006<br />
52<br />
2005<br />
52<br />
2004<br />
52<br />
DIVISIONAL ANALYSIS<br />
REVENUE (RM)<br />
SA RETAIL* 11.8% 20 940 19 486 19 793 17 280 14 151 11 994 10 333<br />
COUNTRY ROAD 20.7% 2 548 2 252 1 939 1 362 994 995 949<br />
TREASURY 175 184 21 – – – –<br />
12.7% 23 663 21 922 21 753 18 642 15 145 12 989 11 282<br />
TURNOVER (RM)<br />
SA RETAIL<br />
– CLOTHING AND GENERAL MERCHANDISE 9.1% 8 253 7 423 7 410 6 985 6 012 5 350 4 792<br />
– FOODS 16.6% 12 227 11 126 10 360 8 718 6 942 5 666 4 747<br />
– LOGISTICS AND OTHER 13.3% 417 391 376 320 274 223 176<br />
COUNTRY ROAD 20.5% 2 496 2 235 1 918 1 354 981 982 933<br />
13.9% 23 393 21 175 20 065 17 377 14 208 12 221 10 649<br />
Profit before exceptional items<br />
and tax (Rm)<br />
<strong>Woolworths</strong>* 1 377 1 412 1 232 1 058 903<br />
SA Retail 1 537 1 108<br />
Clothing and General merchandise 1 092 701<br />
Food 445 407<br />
Country Road 41.5% 119 139 101 55 15 21 5<br />
Treasury 28 50<br />
<strong>Woolworths</strong> Financial Services (subsidiary<br />
to 30 September 2008) – 72<br />
<strong>Woolworths</strong> Financial Services joint venture<br />
to 1 October 2008) 75 57<br />
10.3% 1 759 1 426 1 478 1 467 1 247 1 079 908<br />
Profit attributable to ordinary<br />
shareholders (Rm)<br />
<strong>Woolworths</strong>** 9.3% 1 185 1 159 875 985 823 758 634<br />
Country Road 30.9% 73 89 62 89 13 19 6<br />
10.1% 1 258 1 248 937 1 074 836 777 640<br />
Net assets (Rm)<br />
<strong>Woolworths</strong>** 8.5% 2 966 2 663 3 130 2 936 2 401 1 977 2 429<br />
Country Road 15.6% 430 362 396 311 205 208 152<br />
9.2% 3 396 3 025 3 526 3 247 2 602 2 185 2 581<br />
* Includes <strong>Woolworths</strong> Financial Services in 2009 and prior periods<br />
** Includes SA Retail, Treasury and <strong>Woolworths</strong> Financial Services<br />
2 548<br />
139<br />
2 252<br />
119<br />
1 939<br />
101<br />
1 362<br />
949<br />
995<br />
994<br />
55<br />
5<br />
21<br />
15<br />
04<br />
05<br />
06<br />
07<br />
08<br />
09<br />
10<br />
04 05<br />
06<br />
07<br />
08<br />
09<br />
10<br />
COUNTRY ROAD – REVENUE (RM)<br />
COUNTRY ROAD – PROFIT (RM)<br />
9
GROUP REVIEW<br />
continued<br />
PERIOD<br />
NUMBER OF WEEKS<br />
5-YEAR<br />
COMPOUND ANNUAL<br />
GROWTH RATE<br />
<strong>2010</strong><br />
52<br />
2009<br />
52<br />
2008<br />
53<br />
2007<br />
52<br />
2006<br />
52<br />
2005<br />
52<br />
2004<br />
52<br />
OTHER STATISTICAL DATA<br />
SA RETAIL*<br />
GROSS MARGIN (%) 29.8 28.0 28.0 32.3 32.8 32.7 31.5<br />
NUMBER OF EMPLOYEES (FULL-TIME EQUIVALENT) 22 325 20 873 21 374 19 344 16 337 14 243 13 791<br />
NUMBER OF STORES<br />
– OWNED 259 250 228 200 173 149 136<br />
– FRANCHISED 160 160 157 149 136 125 119<br />
CLOSING TRADING AREA (m 2 )<br />
– OWNED 424 879 406 784 381 639 347 647 326 200 301 338 283 091<br />
– FRANCHISED 100 524 100 493 96 712 98 225 96 167 88 307 86 563<br />
TURNOVER RATIOS<br />
– TURNOVER PER EMPLOYEE (R’000) 936 903 849 828 810 789 704<br />
– TURNOVER PER m 2 (R’000) 49 46 48 46 41 37 34<br />
ASSET TURN (TIMES) 2.8 2.3 2.1 2.0 2.0 2.1 2.1<br />
– REVENUE DIVIDED BY TOTAL ASSETS LESS DEFERRED TAX<br />
INVENTORY TURN (TIMES) 16.2 14.3 16.7 18.5 20.8 21.7 21.4<br />
– TURNOVER DIVIDED BY AVERAGE INVENTORY AT<br />
THE BEGINNING AND END OF THE PERIOD<br />
PROFIT BEFORE EXCEPTIONAL ITEMS AND TAX<br />
TO TURNOVER (%) 7.3 6.3 7.6 8.8 9.3 9.4 9.3<br />
COUNTRY ROAD (IN AU$ TERMS)<br />
GROSS MARGIN (%) 57.4 59.5 61.0 58.1 53.7 52.2 53.3<br />
NUMBER OF EMPLOYEES (FULL-TIME EQUIVALENT) 1 331 1 206 1 133 1 093 806 868 868<br />
NUMBER OF STORES<br />
– OWNED 78 67 61 57 52 47 46<br />
– CONCESSION 82 82 78 74 0 0 0<br />
TRADING AREA (m 2 ) 41 218 36 849 33 974 31 548 22 094 23 539 23 439<br />
TURNOVER RATIOS<br />
– TURNOVER PER EMPLOYEE (AU$’000) 280 284 256 217 254 240 220<br />
– TURNOVER PER m 2 (AU$’000) 10 9 9 8 9 9 8<br />
ASSET TURN (TIMES) 3.0 3.0 3.0 2.5 2.4 2.5 2.4<br />
INVENTORY TURN (TIMES) 9.6 10.2 10.0 8.8 8.6 9.0 7.7<br />
PROFIT/(LOSS) BEFORE TAX TO TURNOVER (%) 4.7 6.4 4.8 3.9 1.6 1.5 1.3<br />
* Years prior to 2009 include <strong>Woolworths</strong> Financial Services<br />
10 333<br />
11 994<br />
14 151<br />
17 280<br />
19 793 19 486<br />
20 940<br />
34<br />
37<br />
41<br />
46<br />
48<br />
46<br />
49<br />
04 05 06 07 08 09 10<br />
SA RETAIL – REVENUE (RM)<br />
04 05 06 07 08 09 10<br />
SA RETAIL – TURNOVER PER SQUARE METRE<br />
10
PERIOD <strong>2010</strong> 2009 2008 2007 2006 2005 2004<br />
NUMBER OF WEEKS 52 52 53 52 52 52 52<br />
ORDINARY SHARE PERFORMANCE (CENTS PER SHARE)<br />
EARNINGS 162.4 157.2 114.8 133.9 105.1 91.5 74.3<br />
HEADLINE EARNINGS 164.6 109.3 114.9 127.8 105.0 89.4 75.5<br />
DISTRIBUTIONS DECLARED FOR THE FINANCIAL PERIOD 105.0 179.0 79.0 76.0 63.0 54.0 38.5<br />
NET ASSET BOOK VALUE 447.2 390.4 443.2 401.2 326.9 279.5 297.3<br />
SHARE PRICE: HIGHEST 2 580 1 358 2 302 2 510 1 779 1 181 771<br />
LOWEST 1 297 923 988 1 230 1 003 721 568<br />
AVERAGE 1 898 1 177 1 550 1 779 1 391 966 695<br />
CLOSING 2 520 1 295 1 020 2 140 1 370 1 025 710<br />
INDEXED CLOSING SHARE PRICE (JUNE 2000 = 100) 869 447 352 738 472 353 245<br />
JSE INDEXED: RETAIL (JUNE 2000 = 100) 414 275 234 407 279 244 152<br />
ALL SHARES (JUNE 2000 = 100) 354 289 359 377 266 183 133<br />
MARKET CAPITALISATION AT 30 JUNE – RM 21 365 10 374 9 000 19 179 12 112 8 959 6 750<br />
NUMBER OF SHARES IN ISSUE – MILLIONS* 760 775 796 809 797 787 868<br />
NUMBER OF SHARES TRADED – MILLIONS 1 209 1 182 1 164 738 596 502 363<br />
PERCENTAGE OF SHARES TRADED (%) 159.1 152.6 146.3 82.4 67.4 57.5 38.2<br />
VALUE OF SHARES TRADED – RM 22 947 13 912 18 037 13 131 8 291 4 892 2 525<br />
PRICE EARNINGS RATIO 15.5 8.2 8.9 18.2 13.6 12.0 9.2<br />
DISTRIBUTION YIELD (%)** 4.2 6.6 7.7 3.6 4.6 5.3 5.4<br />
FOREIGN CURRENCY EXCHANGE RATES<br />
USD – AVERAGE 7.61 9.05 7.33 7.22 6.37 6.18 6.86<br />
USD – CLOSING 7.60 7.94 7.88 7.15 7.50 6.74 6.34<br />
AUD CLOSING 6.63 6.42 7.62 6.11 5.44 5.20 4.44<br />
KEY INFORMATION IN US DOLLARS<br />
REVENUE 3 109 2 422 2 966 2 581 2 377 2 103 1 644<br />
HEADLINE EARNINGS PER SHARE (CENTS) 21.6 12.1 15.8 17.7 16.5 14.5 11.0<br />
NET PROFIT ATTRIBUTABLE TO ORDINARY SHAREHOLDERS 165 138 128 149 131 126 93<br />
TOTAL ASSETS 1 186 1 046 1 428 1 461 1 169 1 060 925<br />
MARKET CAPITALISATION 2 812 1 306 1 142 2 683 1 615 1 330 1 065<br />
* Net of treasury shares held by subsidiary, E-Com Investments 16 (Proprietary) <strong>Limited</strong><br />
** Excludes the special dividend<br />
HIGH/LOW CLOSE GENERAL RETAILERS INDEX<br />
3 000<br />
2 500<br />
2 140<br />
1 020<br />
2 520<br />
2 000<br />
1 370<br />
1 500<br />
1 000<br />
710<br />
1 025<br />
1 295<br />
500<br />
0<br />
04 05 06 07 08<br />
09 10<br />
SHARE PERFORMANCE<br />
11
WOOLWORTHS HOLDINGS LIMITED<br />
INDEPENDENT NON-EXECUTIVE DIRECTORS<br />
BUDDY HAWTON (73)<br />
FCIS<br />
CHAIRMAN<br />
Buddy has extensive experience<br />
as both an executive and nonexecutive<br />
director. Previous<br />
directorships include Nampak,<br />
Real Africa <strong>Holdings</strong>, Royale<br />
Resorts <strong>Holdings</strong> (Chairman),<br />
Sun Hotels International and<br />
Sun International (Chairman).<br />
He joined the board as<br />
Chairman in 2002.<br />
PETER BACON (64)<br />
(British) Fellow of the<br />
Institute of Hospitality (FIH)<br />
Other directorships include:<br />
Sun International Casinos (UK).<br />
Peter was previously with the Sun<br />
International group of companies<br />
for 34 years. He was Chief<br />
executive of Sun International’s<br />
South African operations from<br />
1993 and Group chief executive<br />
for the last four years of his<br />
employment with the group.<br />
He joined the board in 2006.<br />
LINDIWE BAKORO (36)<br />
BCom (UCT), Post-Graduate<br />
Diploma in Accounting<br />
(UCT), Higher Diploma in Tax<br />
Law (Wits), CA(SA)<br />
Other directorships include:<br />
Group Five, Imperial Bank and<br />
Sea Harvest.<br />
Lindiwe joined Rand Merchant<br />
Bank in 1999 where she gained<br />
extensive merchant bank<br />
experience in project and<br />
infrastructure finance. Since 2006<br />
she has worked as an independent<br />
project financier specialising in<br />
financial advisory debt and equity<br />
arranging for infrastructurerelated<br />
transactions. She joined<br />
the board in August 2009.<br />
BRIAN FROST (66)<br />
BCom, AMP (Harvard)<br />
Other directorships include:<br />
Bowler Metcalf.<br />
Brian joined <strong>Woolworths</strong> in 1981<br />
and was appointed as a director<br />
in 1986. He was responsible for<br />
certain business areas, including<br />
food, franchise and store<br />
operations prior to being<br />
appointed Joint managing<br />
director in 1996. He became<br />
a non-executive director in 2000.<br />
MIKE LEEMING (66)<br />
BCom, MCom, FCMA, FIBSA,<br />
AMP (Harvard)<br />
Other directorships include:<br />
Allied Electronics Corporation,<br />
Imperial <strong>Holdings</strong> and<br />
Real Africa <strong>Holdings</strong>.<br />
Mike was previously the Chief<br />
operating officer at Nedcor and<br />
has in-depth knowledge of<br />
financial services as well as<br />
manufacturing. He joined the<br />
board in 2004.<br />
CHRIS NISSEN (52)<br />
BA Hons (UCT), MA (UCT)<br />
Other directorships include:<br />
Boschendal (Chairman), Sea<br />
Harvest Corporation (Chairman),<br />
Standard Bank Group and JCI.<br />
Chris has been extensively<br />
involved in the development and<br />
upliftment of communities both<br />
as a Minister in the Presbyterian<br />
Church and as a community<br />
leader, serving in a number of<br />
capacities including Chairperson<br />
of the Western Cape ANC. He has<br />
executive experience in a number<br />
of industries and as a nonexecutive<br />
director has proactively<br />
led transformation at a number<br />
of listed companies. He joined<br />
the board in 2004.<br />
THINA SIWENDU (44)<br />
BA Social Science (SW)<br />
(Hons) (UCT), LLB (Natal)<br />
Other directorships include: ACSA.<br />
Thina is an attorney with 15 years’<br />
legal experience. She has been<br />
a director of various companies,<br />
both listed and unlisted, in the<br />
banking, property, portfolio<br />
investment, aviation and public<br />
sector companies over a period<br />
of six years. In 1996 Thina formed<br />
her own legal firm, Thina Siwendu<br />
& Associates. Her firm specialises<br />
in public-private partnerships,<br />
project financing, corporate<br />
structuring and corporate<br />
governance. She joined the<br />
board in August 2009.<br />
12
EXECUTIVE DIRECTORS<br />
GROUP SECRETARY<br />
NIGEL COLNE CBE (70)<br />
(British) AMP (Harvard)<br />
Other directorships include:<br />
Obento Ltd.<br />
Nigel has international<br />
experience in clothing and food<br />
retailing and was a director of<br />
Marks and Spencer plc from 1982<br />
to 1997. He also acquired financial<br />
services experience as a nonexecutive<br />
director at Halifax<br />
Building Society and Halifax plc.<br />
His other past non-executive<br />
directorships include Pizza<br />
Express plc (Chairman), Stylo<br />
plc and Town Centre Restaurants<br />
Ltd (Chairman). He joined the<br />
board in 1994.<br />
SIMON SUSMAN (60)<br />
GROUP CHIEF EXECUTIVE OFFICER<br />
Other directorships include:<br />
Country Road <strong>Limited</strong>.<br />
Simon joined <strong>Woolworths</strong> in 1982<br />
after working at clothing and<br />
food retailer, Marks and Spencer<br />
plc in London. At <strong>Woolworths</strong> he<br />
has led the retail operations, food<br />
and clothing groups and was<br />
appointed to the board in 1995.<br />
He became the Group chief<br />
executive officer in 2000.<br />
IAN MOIR (51)<br />
MBA, MA (ECON)<br />
Managing director Retail<br />
and GROUP Chief executive<br />
officer elect<br />
Other directorships include:<br />
Country Road <strong>Limited</strong>.<br />
Ian was appointed to the board of<br />
Country Road on 23 October 1998.<br />
He was formerly Chief operating<br />
officer of the company before<br />
being appointed Chief executive<br />
officer in November 2000. He was<br />
previously Executive director and<br />
Chief operating officer of Woolmark.<br />
He became the Managing director<br />
retail and Group chief executive<br />
officer-elect in January <strong>2010</strong>.<br />
SINDI ZILWA (43)<br />
BCompt (Hons), CTA, CA (SA),<br />
Advanced Taxation Certificate<br />
ZYDA RYLANDS (45)<br />
BCom (Hons), CA (SA)<br />
Managing director Food<br />
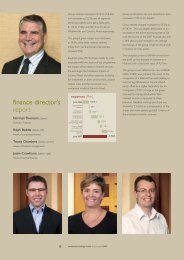
NORMAN THOMSON (59)<br />
BCom (Hons) CA (SA)<br />
Group finance director<br />
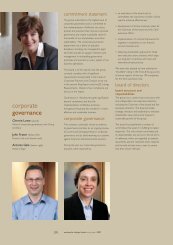
Cherrie Lowe (55)<br />
FCIS<br />
Group secretary<br />
Other directorships include:<br />
ACSA (Chairman), Aspen Pharmacare<br />
<strong>Holdings</strong>, Discovery <strong>Holdings</strong>,<br />
Strate and Institute of Directors.<br />
Sindi became the second black<br />
female chartered accountant in<br />
South Africa in 1990 and is the Chief<br />
executive officer of Nkonki. Her<br />
previous directorships include the<br />
Transkei National Buildings Society,<br />
the South African Mint, WIPHOLD,<br />
Telkom, Primedia <strong>Limited</strong> and Ethos<br />
Private Equity. She was the Chairman<br />
of the BUSA Standing committee on<br />
Transformation, was a board member<br />
of the Independent Regulatory<br />
Board for Auditors and was<br />
a member of the GAAP Monitoring<br />
Panel. She joined the board in 2002.<br />
Other directorships include:<br />
African Capital Portfolio <strong>Limited</strong>,<br />
Open Society Foundation, the<br />
National Urban Reconstruction<br />
and Housing Agency and the<br />
Centre for Justice and Crime<br />
Prevention.<br />
Zyda joined <strong>Woolworths</strong> in 1996<br />
and worked in the finance and<br />
store operation teams. She was<br />
appointed the People director<br />
of <strong>Woolworths</strong> (Proprietary)<br />
<strong>Limited</strong> in 2005 and was<br />
appointed to the board of<br />
<strong>Woolworths</strong> in August 2006.<br />
Other directorships include:<br />
Country Road <strong>Limited</strong>.<br />
Norman joined <strong>Woolworths</strong> in<br />
1991 in a logistics capacity and<br />
introduced the integrated supply<br />
chain management systems.<br />
He was appointed to the board<br />
in 2001 and was responsible for<br />
corporate stores, franchise and<br />
distribution. He became Finance<br />
director in 2002.<br />
Cherrie joined <strong>Woolworths</strong><br />
in 1997 as Group secretary<br />
before the re-listing of the<br />
group on the JSE. She is<br />
responsible for all aspects<br />
of corporate governance,<br />
including risk and internal<br />
audit, legal and corporate<br />
affairs, and is a member of<br />
the executive team.<br />
13
CHAIRMAN’S REPORT<br />
The results of the focused effort over the<br />
last 18 months are evident by our strong<br />
market share growth.<br />
ECONOMIC ENVIRONMENT<br />
The global economic recession<br />
continued throughout the company’s<br />
<strong>2010</strong> financial year and brought with it<br />
uncertain economic conditions in both<br />
South Africa and Australia.<br />
Nevertheless, the South<br />
African economy has been<br />
more resilient to the world<br />
economic conditions<br />
with many of the key retail indicators<br />
showing a positive outlook for growth.<br />
The GDP showed a growth of 2.3% for<br />
the last six months and retail spending<br />
itself showed growth through the last<br />
quarter of our financial year. Credit<br />
growth has been lagging; however,<br />
recent data tends to indicate that<br />
this trend is about to turn. Consumers,<br />
more particularly those in the upper<br />
income segment, are more confident<br />
and optimistic and have shown this in<br />
increased spending. The retail market, as<br />
measured by the Retail Liaison Committee<br />
(RLC), showed an annualised growth<br />
rate of 7.8% for clothing and footwear<br />
and 8.4% for food.<br />
In contrast, the Australian economy<br />
has been experiencing a challenging<br />
retail trading environment. There have<br />
been six interest rate increases since<br />
July 2009 and the non-recurring effect of<br />
the stimulus packages that boosted the<br />
retail spending in the November 2008<br />
to March 2009 period, has led to minimal<br />
growth in retail.<br />
RESULTS<br />
The group has performed well with<br />
all retail segments growing above<br />
the market.<br />
The results are not comparable as<br />
there were a number of once-off items<br />
included in the last financial year.<br />
These are discussed in the Group<br />
finance director’s <strong>report</strong>.<br />
Headline earnings per share<br />
that has been adjusted for<br />
once-off items, so as to<br />
reflect comparable earnings,<br />
increased by 24.8% to 157.2 cents per<br />
share. Our return on equity has improved<br />
to an acceptable level from 26.3% to<br />
39.4%, significantly above the average<br />
weighted cost of capital of 11.2%.<br />
The full year dividend of 105 cents per<br />
share to ordinary shareholders, has<br />
increased by 23.5%.<br />
The group has maintained a strong<br />
balance sheet throughout the period.<br />
The group is cash generative, and with<br />
the requirement to fund the financial<br />
services debtors book now transferred<br />
to Absa bank, we are well positioned at<br />
year end with a healthy cash balance<br />
of R1.5bn supporting our strong<br />
balance sheet. We undertook openmarket<br />
share repurchases amounting<br />
to R410m during the period.<br />
<strong>Woolworths</strong> in particular traded well<br />
against the market. Our stores are<br />
looking modern and customers are<br />
telling us that it is easier to shop. Our<br />
clothing is appealing to our customers’<br />
sense of fashion and their pockets. Our<br />
food offer provided constant innovation<br />
and we introduced promotions and<br />
great value items which helped those<br />
customers struggling through the<br />
recession.<br />
The results of the focused effort over the<br />
last 18 months are evident by our strong<br />
market share growth. Market share<br />
for clothing and footwear is at a three<br />
year high standing at 15.3%, while<br />
food is well on its way to regain the<br />
market share that it lost with a current<br />
share of 8.3%.<br />
14
Operationally <strong>Woolworths</strong> focused<br />
on productivity and operational<br />
efficiencies. The overall operating<br />
margin improved to 7.1% with our target<br />
being 8.0% over the next two years.<br />
In Australia, trading conditions were<br />
extremely challenging. Customers<br />
felt the pressure of additional<br />
interest rates and retailers had to<br />
discount heavily in order to stimulate<br />
customer spending.<br />
Turnover was up 8.5% despite the tough<br />
conditions. However, profits were<br />
down 22.7% affected by both heavy<br />
discounting and start-up costs of the<br />
new brand Trenery.<br />
In our financial services joint venture,<br />
<strong>Woolworths</strong> Financial Services (WFS),<br />
consumers have been cautious about<br />
using credit and about taking on<br />
additional credit. This has impacted<br />
the ability of WFS to show growth in the<br />
debtors’ book during this period. Year<br />
end debtors’ book is marginally below<br />
that of the previous year.<br />
While there has been little opportunity<br />
for growth, there has been a significant<br />
improvement in the impairments charge<br />
over the period. We have earned a<br />
profit of R75m from the joint venture.<br />
The results of WFS are still not<br />
comparable and this is explained<br />
further in the Group finance<br />
director’s <strong>report</strong>.<br />
GOOD BUSINESS JOURNEY<br />
We have always recognised that<br />
the true sustainability of a company<br />
is reliant on its own continuous<br />
performance and a sustainable<br />
society and environment.<br />
In 2007 we consolidated and<br />
accelerated our efforts around our<br />
Good business journey programme.<br />
This programme covers more than 260<br />
indicators across four pillars: economic,<br />
social, transformation and environment.<br />
Targets to 2012 were set and we measure<br />
ourselves against them. We are now<br />
in year three of our five year Good<br />
business journey programme ending in<br />
2012. Our score for the year was 84% with<br />
71% towards our 2012 target which we<br />
believe is a considerable achievement.<br />
Important to us is the economic value<br />
generated and distributed during<br />
the year. This is reflected in our value<br />
added statement shown below.<br />
Our social and transformation<br />
strategies were further<br />
entrenched in our business<br />
and we are pleased to<br />
<strong>report</strong> that the business became<br />
a level 5 contributor. Major shifts were<br />
made in preferential procurement and<br />
enterprise development which were<br />
well above our targets.<br />
<strong>Woolworths</strong> Value added statement <strong>2010</strong> 2009<br />
Value added 23 744 22 372<br />
Less: Cost of sales 15 656 14 501<br />
Cost of services and other operating expenses 2 888 2 706<br />
5 200 5 165<br />
Distribution of wealth<br />
to employees as salaries, wages and other benefits 2 858 55.0% 2 689 52.1%<br />
to government as income tax (including deferred tax) 491 9.4% 546 10.6%<br />
to lenders as finance costs 151 2.9% 281 5.4%<br />
to shareholders 718 13.8% 1 399 27.1%<br />
depreciation and amortisation 442 8.5% 401 7.1%<br />
earnings retained 540 10.4% (151) (2.9%)<br />
5 200 5 165<br />
15
CHAIRMAN’S REPORT<br />
continued<br />
As a retailer of clothing and particularly<br />
food we have recognised the impacts of the<br />
products we sell on the environment.<br />
Our BEE employee share ownership<br />
scheme earned a percentage of the<br />
distributions paid out to ordinary<br />
shareholders. During the year, the<br />
beneficiaries of the scheme received<br />
an increase of 61% on the previous year.<br />
The scheme has paid our staff a total<br />
of R37.3m in dividends since inception<br />
in July 2007.<br />
As a retailer of clothing and particularly<br />
food we have recognised the<br />
impacts of the products we sell on the<br />
environment. We have chosen to take<br />
responsibility for the entire lifecycle of<br />
the products we sell and not just our<br />
own direct impact on the environment.<br />
Our aspiration is not only to ensure that<br />
we reduce our own impact but that we<br />
engage with our suppliers and customers<br />
to assist them to reduce theirs.<br />
We have recognised the<br />
important relationship<br />
between the production<br />
of food and the<br />
environment and the necessity to adopt<br />
better environmental practices in our<br />
suppliers agricultural systems to provide<br />
South Africa with food security and<br />
protect our natural ecosystems. We<br />
have also found that farming in harmony<br />
with nature can be achieved without<br />
compromising quality or adding cost.<br />
During the year we initiated Farming for<br />
the Future, a programme which focuses<br />
on soil health and is instrumental in<br />
returning biodiversity to farms improving<br />
their soil quality and reducing their<br />
water and chemical usage. Already<br />
over 50% of our local farmers are on this<br />
programme and by 2012 all our local<br />
farmers will be on the programme.<br />
Government has set targets<br />
for South Africa to reduce<br />
carbon emissions by 34%<br />
by 2025 and 42% by 2050.<br />
In 2003 we set a target to reduce our<br />
own relative carbon emissions by<br />
30% by 2012. The key focus has been<br />
the reduction of electricity usage<br />
which is our major contributor to<br />
carbon emissions. Extensive efforts in<br />
reviewing store design of lighting and<br />
refrigeration, installing automated<br />
lighting and an extensive awareness<br />
programme with staff has helped us<br />
reduce our relative usage by 18% from<br />
the 2004 benchmark.<br />
GOVERNANCE<br />
We have always aspired to maintain<br />
a high level of governance based on<br />
the principle that good governance<br />
is good business. Our governance<br />
policies are designed to take into<br />
account the interests of all stakeholders<br />
and to add value to the business rather<br />
than merely complying with existing<br />
codes. We therefore welcome the<br />
codes and principles of King III and<br />
will be continuing to revise our own<br />
governance practices on a continual<br />
basis. We have started <strong>report</strong>ing in<br />
terms of King III in this <strong>report</strong> and we<br />
expect our journey will be complete<br />
by the end of this year.<br />
BOARD AND LEADERSHIP<br />
Nigel Colne and Brian Frost, current<br />
independent non-executive directors will<br />
retire at the annual general meeting in<br />
November. They have been on the board<br />
for a number of years and have brought<br />
a wealth of knowledge and experience<br />
to the board and its committees. I would<br />
personally like to thank them for their<br />
passion, commitment and guidance that<br />
they have provided to me and my fellow<br />
board members.<br />
16
We are pleased to announce that<br />
Tom Boardman has been appointed<br />
to the board with effect from<br />
27 September <strong>2010</strong>.<br />
Tom Boardman is a non-executive<br />
director of the Nedbank Group<br />
and the former Chief executive<br />
officer of Nedbank. His banking<br />
experience and his passion for<br />
sustainability and transformation will<br />
bring additional expertise to the board.<br />
As previously announced, Simon Susman<br />
will retire as Group chief executive<br />
officer at the annual general meeting.<br />
Ian Moir, currently Group managing<br />
director: retail will be appointed the<br />
Group chief executive officer.<br />
These appointments will provide the<br />
group with strong leadership and<br />
continuity and ensure that the board<br />
has strong retail representation.<br />
APPRECIATION<br />
As always, I would like to thank my<br />
colleagues on the board for their<br />
support and guidance.<br />
I<br />
extend my appreciation to Simon<br />
and his executive team on their<br />
focused effort and commitment<br />
throughout the year. Simon retires<br />
as Group chief executive officer in<br />
November and we wish to thank him for<br />
all his dedication and devotion to the<br />
group over many years. Simon’s vision<br />
of retail and commitment to ensuring<br />
that our brand is strong and relevant in<br />
today’s changing world has set a solid<br />
platform for the future.<br />
We are delighted that Simon has<br />
agreed to remain on the board after<br />
his retirement in the capacity of a nonexecutive<br />
director and to assume the<br />
role of Deputy Chairman.<br />
LSM 2 LSM 3 LSM 4 LSM 5 LSM 6 LSM Population 7 LSM 8 ('000) LSM 9 LSM10<br />
LOOKING AHEAD<br />
We have learnt from the recent<br />
recession and believe the group is<br />
better placed for the future. Our brands<br />
have emerged stronger and are more<br />
relevant to our customers of today and<br />
those of the future.<br />
We are well positioned to continue to<br />
grow and to continue producing strong<br />
cash flows.<br />
LSM 1 LSM 2 LSM 3 LSM DA 4HAWTON<br />
LSM 5 LSM 6 LSM 7 LSM 8 LSM<br />
73<br />
87<br />
54<br />
103<br />
63<br />
126<br />
76<br />
112<br />
79<br />
108<br />
85*<br />
159<br />
105<br />
27<br />
31<br />
35<br />
35<br />
28<br />
26<br />
39<br />
39<br />
04 05 06 07 08 09 10<br />
04<br />
05<br />
06<br />
07<br />
08<br />
09<br />
10<br />
DILUTED HEPS & DIVIDENDS DECLARED<br />
RETURN ON EQUITY (%)<br />
*EXCLUDES SPECIAL DIVIDEND<br />
17
GROUP CHIEF EXECUTIVE OFFICER’S REPORT<br />
This is my final <strong>report</strong> to you as<br />
Group chief executive officer,<br />
a role that I have held for the<br />
last ten years.<br />
As I reflect on that period, the South<br />
African retail market has undergone<br />
a radical structural shift that started in<br />
2000. Of most significance is the extent<br />
to which the consumer has come of age<br />
during the period. This reflects too, in<br />
a major shift away from poverty in the<br />
living standards measure (LSM) groups.<br />
The middle class black LSM 6 – 8 consumer<br />
who hardly <strong>report</strong>ed 10 years ago, now<br />
drives much of South Africa’s consumer<br />
spending. On top of this, LSM 9 and 10<br />
which is Woolies heartland customer,<br />
has strengthened constantly both in<br />
numbers and in disposable income.<br />
The size of the formal retail market has<br />
also grown substantially. As measured<br />
by the Retail Liaison Committee and<br />
AC Nielsen, the clothing and footwear<br />
market has more than doubled from<br />
R19.4bn in 2000 to R50.2bn in <strong>2010</strong>, whilst<br />
the formal food market has tripled in<br />
size from R42bn in 2000 to R147.5bn in<br />
<strong>2010</strong>. With these growing markets, the<br />
level of competition has also increased<br />
and has raised the bar of retailing in<br />
South Africa. South African retailers<br />
are amongst the most focused and<br />
professional in the world. Indeed,<br />
South Africa is now becoming a more<br />
appealing and attractive market for<br />
overseas retailers to enter.<br />
As the country has become more<br />
modern and confident, the consumer<br />
has demanded higher levels of quality<br />
and fashion. There is too, a greater<br />
consciousness of value. LSM 9 and 10<br />
customers are more aware of the impact<br />
that they and their service providers<br />
have on the environment. Consumers<br />
trust and expect retailers such as<br />
ourselves to consider the greater world<br />
around us in the way we do business –<br />
hence our Good business journey. This<br />
is a philosophy of doing business that<br />
adds value to, rather than depletes the<br />
richness of resources, both human and<br />
environmental that enable our world.<br />
I believe that the <strong>Woolworths</strong> of today<br />
has adapted well to these changes<br />
and has emerged as a far stronger<br />
brand, well placed to take on future<br />
increasingly aspirational customers.<br />
Population ('000)<br />
In Australia, the nature of the<br />
market has been more static. It is<br />
highly competitive by nature with a<br />
sophisticated, demanding consumer.<br />
Here we have taken Country Road from<br />
an underperforming, expensive niche<br />
brand into a serious, profitable player<br />
which reflects the <strong>Woolworths</strong> values<br />
in offering affordable fashion of high<br />
quality in serious volumes. The brand<br />
is now trading successfully in both<br />
countries.<br />
GROUP RESULTS FOR THE YEAR<br />
Group sales posted a 10.5% growth<br />
for the year, with <strong>Woolworths</strong> showing<br />
a 10.4% growth and Country Road<br />
showing an 11.7% growth. <strong>Woolworths</strong><br />
Financial Services book growth was<br />
static. Margins in <strong>Woolworths</strong> improved<br />
considerably. Overall this resulted in<br />
adjusted headline earnings per share<br />
improving by 24.8%.<br />
This has been a year where we have<br />
seen the strategies that were put in<br />
place some eighteen months ago, in<br />
re-positioning <strong>Woolworths</strong>, bear fruit.<br />
It has also been a tale of two markets –<br />
the South African market that has seen<br />
a growing confidence of the higher<br />
LSM customer whilst the Australian<br />
market has experienced six interest<br />
rate increases and heavy discounting.<br />
The <strong>2010</strong> FIFA World Cup TM , too added<br />
impetus to <strong>Woolworths</strong> sales in the<br />
final quarter.<br />
LSM 1 LSM 2 LSM 3<br />
Gross profit margin has<br />
improved from 31.5%<br />
LSM 4 LSM 5 LSM 6 LSM 7 LSM 8 LSM 9<br />
to 33.1%. <strong>Woolworths</strong><br />
LSM<br />
margins have shown<br />
strong improvement, primarily as<br />
a result of our sourcing strategy<br />
and lower markdowns.<br />
LSM 1 LSM 2 LSM 3 LSM 4 LSM 5 LSM 6 LSM 7 LSM 8 LSM 9 LSM 10<br />
20<br />
2001 2009
Customers are positive about the segmented<br />
shopping experience.<br />
Expense control has been good<br />
despite the additional growth<br />
in footage and the costs for<br />
the introduction of the new<br />
brand Trenery both in Australia and<br />
South Africa.<br />
Operating margin at 7.1% has increased<br />
from June 2009. Within this group<br />
margin, <strong>Woolworths</strong> achieved 7.0% and<br />
we remain of the view that an 8.0% level<br />
is readily achievable within two years.<br />
We have maintained a strong balance<br />
sheet with well controlled inventories<br />
throughout.<br />
WOOLWORTHS<br />
CLOTHING AND GENERAL<br />
MERCHANDISE<br />
Woolies has repositioned its clothing<br />
business. It is now more customer<br />
focused, has segmented its sales floor<br />
and ranges, has repositioned its pricing<br />
policy and has changed the sourcing<br />
strategy. Our customers are feeling<br />
more confident than two years ago. We<br />
have grown market share in this area for<br />
the past fifteen months with our market<br />
share for clothing and footwear now<br />
standing at 15.3%.<br />
Sales growth for the year was 11.2%,<br />
with a second half growth of 12.7%. Like<br />
for like sales were up 6.7%. The final<br />
quarter was helped by the <strong>2010</strong> FIFA<br />
World Cup TM , longer school holidays<br />
and a cold winter.<br />
We continue to review our prices to<br />
ensure that we provide our customers<br />
more product at competitive price<br />
points. Price movement for the year was<br />
8.9%, reducing in the second half to 5.6%.<br />
Customers are positive about the<br />
segmented shopping experience. We<br />
now have clearly defined in-house<br />
brands, all based on innovation, quality<br />
and value, and powerful headquarter<br />
assortments. Our loyal customers<br />
have become even more loyal. The<br />
combination of these clear and<br />
differentiated brands and management<br />
of our pricing structure have provided<br />
more choice to a greater number of<br />
customers at the same time as their<br />
discretionary spend has increased.<br />
Our sourcing strategy<br />
and lower markdowns<br />
saw us deliver a gross<br />
margin of 40.1% which<br />
was significantly higher than that<br />
achieved in the 2009 financial year.<br />
We have been working to a three year<br />
programme of margin improvement<br />
and have managed to deliver this a<br />
year ahead of schedule. We have<br />
worked with key suppliers both offshore<br />
and within the SADC region to drive<br />
competitive prices, high quality and<br />
innovation and improved profitability.<br />
The investments made into the<br />
stock planning systems have helped<br />
improve the profiling of stores in<br />
line with customer segments, have<br />
improved trading densities and<br />
reduced markdowns. Stock as a<br />
consequence, has been managed<br />
more effectively overall.<br />
Our home business, which was the<br />
most impacted by earlier economic<br />
conditions, has shown good sales<br />
growth from its repositioning and has<br />
been gaining market share.<br />
21
CHIEF EXECUTIVE OFFICER’S REPORT<br />
CONTINUED<br />
The beauty business, both branded and<br />
our own label has shown good steady<br />
growth with particular strength in our<br />
private label range which is approved<br />
by Beauty Without Cruelty.<br />
We continue to work<br />
with a number of<br />
enterprise development<br />
opportunities, tapping<br />
into the entrepreneurial and creative<br />
spirit of local communities. Our home<br />
business has some good examples of<br />
the success that this has brought both<br />
to the communities and the business.<br />
The use of sustainable fibres and<br />
materials in our product has been<br />
re-energised. The South African organic<br />
cotton programme continues. Bamboo<br />
is used in a dedicated towel range<br />
and in selected kitchenware products.<br />
Our launch of eco-walkmates, a range<br />
of children’s footwear that has been<br />
specially designed and constructed<br />
using eco friendly materials such as<br />
eco tanned leather (free of harmful<br />
chemicals) and natural rubber outsoles<br />
from sustainable rubber plantations,<br />
is another example.<br />
Our childrenswear business has been<br />
a key attractor for the black customer to<br />
shop in our stores. This is underpinned<br />
by a quality and safety ethos from our<br />
“no pin” policy in the construction of<br />
garments, to our Walkmates footwear<br />
that is endorsed by the South African<br />
Podiatry Association.<br />
FOOD<br />
With declining food inflation, growth<br />
in the South African food retail sector<br />
has softened. Our food business is less<br />
susceptible to the influence of inflation.<br />
We have though been sharper on<br />
prices particularly on our known value<br />
items (KVI) lines. This and our constant<br />
flow of new products has helped us<br />
regain market share over the past nine<br />
months. Our market share now stands<br />
at 8.3%.<br />
Sales growth for the year was<br />
9.9%, with a second half growth<br />
of 10.8%. Like-for-like sales were<br />
up 5.6%. Price movement for the<br />
year was 5.2% and in the last quarter<br />
we showed a comparable stores<br />
volume increase.<br />
Over the prior 18 months we had<br />
focused more aggressively on our<br />
value proposition. We track the prices<br />
of our KVI basket items weekly and are<br />
now highly competitive. An exciting<br />
new range “Essentials” was launched<br />
in the year. This range is at opening<br />
price points and offers customer all the<br />
quality and innovation that they expect,<br />
yet at competitive prices. We have also<br />
refined our promotional strategies to<br />
do fewer, bigger promotions. The “meal<br />
deal for R100” has proved popular and<br />
highlights our great value prices on<br />
everyday lines as well as at special<br />
occasions time – Valentine’s Day<br />
and Christmas.<br />
Improving our food availability<br />
continues to be a journey. We<br />
have invested heavily in systems<br />
over the past five years and are<br />
now beginning to consolidate the<br />
improvements this is giving.<br />
During the year we continued to roll<br />
out a number of in-store services into<br />
our larger food stores – butcheries,<br />
bakeries, cheese shops and “to go”<br />
concepts. These have created a more<br />
exciting shopping experience and<br />
will be a strong feature in our store<br />
modernisation and expansion plans<br />
going forward. A new format reflecting<br />
this was introduced in our Constantia<br />
store in Cape Town and is trading well.<br />
Our good food journey is<br />
a fundamental part of our food<br />
business. We were honoured to be<br />
recognised for our contribution to food<br />
9.0<br />
9.5<br />
9.8<br />
9.9<br />
9.2<br />
6.9<br />
7.1<br />
04 05 06 07<br />
08<br />
09<br />
10<br />
22<br />
OPERATING MARGIN (%)
We have worked hard to reduce food<br />
packaging and have made reductions of<br />
660 tons over three years.<br />
science and technology as winner of<br />
the President’s Award by South Africa’s<br />
Association for Food Science and<br />
Technology (SAAFoST). The award has<br />
only been given out four times in their<br />
50 year history and we are the first<br />
retailer to win this.<br />
During the tough economic<br />
conditions customers<br />
awareness of environmental<br />
issues did not wane, however,<br />
they are increasingly reluctant to pay<br />
extra. We have found innovative ways<br />
to do business differently without<br />
additional cost to our customers. The<br />
introduction of Farming for the Future<br />
has provided customers with fresh<br />
produce grown in an environmentally<br />
friendly way with no extra cost.<br />
We have worked hard to reduce food<br />
packaging and have made reductions<br />
of 660 tons over three years. Our<br />
customers have given us feedback on<br />
our food packaging. We will continue<br />
to reduce our packaging in ways that<br />
do not compromise our products, but<br />
have a growing emphasis on recycled<br />
or recyclable. We are also rolling out<br />
recycling facilities near our stand alone<br />
stores and Engen garages.<br />
Water usage and waste water quality<br />
surfaced as a major national issue<br />
during the year. Water is fundamental<br />
to the production of food and the<br />
majority of water in South Africa is used<br />
in the production of food. Our Farming<br />
for the Future programme in produce,<br />
has a component which covers water<br />
usage and waste water. We will focus on<br />
expanding this into other components of<br />
the food chain such as dairy.<br />
OPERATIONS<br />
Total trading space was 525 403 m 2 ² at<br />
the year end. Nine stores were opened<br />
during the year. Our store roll out<br />
plan will now focus on opening fewer<br />
but larger stores. We expect to open<br />
16 new stores and modernise or extend<br />
31 stores over the course of next year.<br />
We continue with our plans to have an<br />
increased base of experienced staff<br />
in our stores. We now have 36% of our<br />
staff on a guaranteed 40 hour week as<br />
compared to 13% a year ago. These<br />
permanent positions, the provision<br />
of healthcare and store-based<br />
performance bonuses have seen<br />
our labour turnover materially reduce<br />
from eighteen months ago.<br />
Subsequent to the end of June,<br />
we have communicated that<br />
<strong>Woolworths</strong> would stop<br />
franchising in South Africa.<br />
This means that there will be no new<br />
franchise stores and no extension<br />
of current franchise contracts when<br />
23
CHIEF EXECUTIVE OFFICER’S REPORT<br />
continued<br />
they reach their end of duration.<br />
Offers would be made to buy all local<br />
franchise stores at fair value. Fair<br />
value was determined as valuing the<br />
businesses as a going concern despite<br />
the fact that fixed term contracts<br />
are in place.<br />
WOOLWORTHS FINANCIAL<br />
SERVICES<br />
The joint venture that the group entered<br />
into with Absa to manage our financial<br />
services is progressing well. The<br />
<strong>Woolworths</strong> share of the profit earned<br />
by WFS for the year was R75m, (noncomparable<br />
with the R129m earned in<br />
June 2009).<br />
The recovery in demand for credit has<br />
been slower after the financial crisis<br />
and for most of the year it has shown<br />
negative growth. The LSM 6 – 8 customer<br />
in particular has been reluctant to take<br />
on more credit preferring to make use<br />
of cash. We experienced high attrition<br />
rates through the year. We also were<br />
more stringent in the granting of credit<br />
in order to manage the recoverability<br />
of the debtors books. As a result,<br />
impairments reduced from 7.5% to 5.1%.<br />
Much of the year has been focused on<br />
integrating the joint venture into the<br />
regulatory banking environment of<br />
the Absa Group. This will put the<br />
business onto a stronger footing<br />
for future growth.<br />
The last quarter of the year saw the<br />
launch of the black card – a credit<br />
card designed to meet the needs<br />
of our higher earning customers.<br />
With its benefits including a 3%<br />
discount on all purchases made in<br />
our <strong>Woolworths</strong> stores and a 1%<br />
discount on all purchases made outside<br />
of <strong>Woolworths</strong>, it is an attractive<br />
proposition. We look forward to this<br />
growing into the future.<br />
It is now time to grow the debtors’<br />
books, with a market showing a small<br />
increase in the demand for credit. We<br />
are increasing our recruitment effort<br />
to open new accounts and stimulating<br />
existing card customers to make more<br />
use of existing credit facilities.<br />
COUNTRY ROAD<br />
This has been a challenging year<br />
for Australasian retail. Discretionary<br />
spending declined throughout the<br />
period. The government’s stimulus<br />
payments, which were discontinued<br />
and six interest rate increases created<br />
a highly competitive retail market<br />
which was largely driven by aggressive<br />
discounting across the sector.<br />
Despite the tough trading<br />
environment, Country Road<br />
continued to expand, driven<br />
in part by heavy discounting.<br />
Total sales for the year increased 8.5%,<br />
on a like-for-like basis, we achieved<br />
1.5% growth in sales.<br />
The initial set up costs of the Trenery<br />
brand, combined with the challenging<br />
discount led market conditions of the<br />
retail sector have significantly impacted<br />
our margins and, as such, our profit<br />
before tax was down on the prior year<br />
by 20.2% to $17.5m.<br />
We saw the successful launch of the<br />
Trenery brand in South Africa and in<br />
Australia. The brand is trading in 6<br />
stores in Australia and a further 18 stores<br />
in South Africa. This new brand has<br />
expanded the Country Road proposition<br />
24
to a new customer base and initial sales<br />
results have been encouraging.<br />
We have also continued to grow our<br />
Country Road brand in South Africa with<br />
the launch in a further two <strong>Woolworths</strong><br />
stores and two combined Country Road<br />
and Trenery stand alone stores.<br />
Further stores were opened and<br />
refurbished across Australia and New<br />
Zealand. This store programme and the<br />
launch of the Trenery stores amounted<br />
to a capital investment in excess of<br />
$20m in the year. We believe that this<br />
has positioned the retail store network<br />
well for future growth.<br />
This year we also saw a<br />
significant change in the<br />
stewardship at Country Road.<br />
We bade farewell to Ian Moir<br />
as Chief executive officer at the end<br />
of December 2009. John Cheston then<br />
joined the company as his successor<br />
from July <strong>2010</strong>. Regrettably, we have<br />
had to part ways with John due to<br />
irreconcilable differences on the<br />
direction of the business. In the interim,<br />
Ian will manage the business until a<br />
successor is put in place.<br />
The business will continue to<br />
focus on opportunities for<br />
the rollout of Trenery and the<br />
ongoing expansion of<br />
Country Road. Our online store,<br />
www.countryroad.com.au launched<br />
at the end of August <strong>2010</strong> and initial<br />
results are encouraging. Initiatives<br />
implemented over the last year for<br />
controlling costs and effectively<br />
managing inventories will continue.<br />
We expect the tough conditions to ease<br />
during the year and feel the business is<br />
well set up to take advantage of this.<br />
LOOKING AHEAD<br />
I will be handing the running of this<br />
wonderful business to Ian Moir in<br />
November. Ian and I have worked<br />
closely together for ten years. He<br />
has great passion for these brands<br />
and a clarity of thinking that will add<br />
real value and fresh thinking to the<br />
organisation.<br />
I believe that the business is more<br />
focused and has strategies in place that<br />
are delivering. Under Ian’s direction, the<br />
brands will continue to build on and<br />
evolve those strategies in both South<br />
Africa and Australia.<br />
“<strong>Woolworths</strong> is a great brand and<br />
I am proud to have the opportunity<br />
to be a part of it. It is a South<br />
African icon and much loved by<br />
our customers. I have spent the last<br />
nine months getting to understand<br />
the business and am excited by<br />
the challenge of taking it to even<br />
greater heights.”<br />
Ian Moir<br />
SN SUSMAN<br />
25
GROUP FINANCE DIRECTOR’S REPORT<br />
For the PERIOD ended 27 June <strong>2010</strong><br />
The difficult trading conditions experienced by the<br />
Group last year, especially during the second half of<br />
that year, alleviated to some extent this year, as the<br />
upper end of the market made a tentative recovery.<br />
Although the economy remained fragile in South Africa and<br />
particularly difficult in Australia, the results for the year were<br />
pleasing, with Group turnover up 10.5% and profit before tax<br />
and exceptional items (PBTAE) increasing 23.4% from last<br />
year to R1 759m.<br />
The stronger result was driven by a much improved<br />
performance in the Clothing and General Merchandise (C&GM)<br />
and Food segments of our South African Retail business.<br />
Performance in the fourth quarter was particularly strong, with<br />
the consumers’ positive response to the <strong>2010</strong><br />
FIFA World Cup TM .<br />
EARNINGS PER SHARE<br />
52 weeks<br />
to 27 June<br />
<strong>2010</strong><br />
cents<br />
52 weeks<br />
to 28 June<br />
2009<br />
cents<br />
%<br />
change<br />
EPS 162.4 157.2 3.3%<br />
HEPS 164.6 109.3 50.6%<br />
DILUTED HEPS 159.3 107.5 48.2%<br />
ADJUSTED HEPS 157.2 126.0 24.8%<br />
Whilst, earnings per share (EPS) increased 3%, headline<br />
earnings per share (HEPS), which strips out capital-related<br />
transactions, most notably last year’s R380m profit on the<br />
disposal of a controlling interest in <strong>Woolworths</strong> Financial<br />
Services (WFS), was 50.6% higher.<br />
Diluted headline earnings per share was 48.2% higher. Dilution<br />
arises from share options granted in terms of employee share<br />
option schemes, with the increased level of dilution this year<br />
arising mainly from the sharp recovery in the <strong>Woolworths</strong><br />
share price.<br />
Adjusted HEPS, which excludes an abnormal foreign-exchangerelated<br />
gain this year and the related unrealised loss, as well<br />
as STC on a special dividend last year, was up 24.8%.<br />
Despite these adjustments, the Group results for the year are<br />
not strictly comparable due to the change in the nature of the<br />
investment in WFS and the interest impact of the related capital<br />
transactions during the prior year. To best comprehend these<br />
results, a review should be undertaken on a segmental basis.<br />
Group Results<br />
Divisional Contribution (RM)<br />
<strong>2010</strong><br />
Rm<br />
2009<br />
Rm<br />
%<br />
change<br />
SA Retail 1 458 1 187 22.8%<br />
Forex-related gain 79 (79)<br />
1 537 1 108 38.7%<br />
Net Interest 28 50 (44.0%)<br />
Country Road 119 139 (14.4%)<br />
WFS – to 30 Sep – 72 (100.0%)<br />
WFS JV – from 1 Oct 75 57 31.6%<br />
Group PBTAE 1 759 1 426 23.4%<br />
SA Retail<br />
SA Retail, which comprises the Clothing and General<br />
Merchandise and Food operating segments, grew turnover<br />
by 10.4%, with comparable store sales (sales from stores that<br />
were open at the beginning of the prior year) of 6.1%. It was<br />
particularly pleasing that growth accelerated from 9.1% in the<br />
first half to 11.6% in the second half (and from 5.3% to 6.9% in<br />
the comparable stores). This was partly due to a cold winter<br />
and the benefit of the <strong>2010</strong> FIFA World Cup TM .<br />
INCOME Statement<br />
<strong>2010</strong><br />
Rm<br />
2009<br />
Rm<br />
%<br />
change<br />
Sales 20 897 18 936 10.4%<br />
Cost of sales 14 672 13 626 7.7%<br />
Gross profit 6 225 5 310 17.2%<br />
Other revenue 86 96 (10.4%)<br />
Expenses 4 859 4 232 14.8%<br />
Store costs 2 929 2 584 13.4%<br />
Other operating costs 1 930 1 648 17.1%<br />
Operating profit 1 452 1 174 23.7%<br />
Earnings from associate<br />
and joint venture 6 13<br />
Profit before tax 1 458 1 187 22.8%<br />
26
Gross margin improved from 28.0% to<br />
29.8%, adding 17.2% in gross profit (rands).<br />
Gross margin improved from 28.0% to 29.8%, adding 17.2% in<br />
gross profit (rands). This improvement is explained in more detail<br />
in the segmental analyses below.<br />
Store costs (comprising employment costs, occupancy costs,<br />
electricity, bank charges and depreciation, as well as general<br />
store expenses such as plastic bags, cleaning, security and<br />
maintenance) grew 13.4%, impacted by the 16 new corporate<br />
stores opened during the year, which added 4.4% to trading<br />
space. Comparable store costs also grew at a rate ahead of<br />
sales, but the gap narrowed considerably in the second half.<br />
Other operating costs are the centrally incurred, nonstore<br />
employment and occupancy costs related<br />
to the product buying and planning, marketing,<br />
franchise, and real estate functions, as well as the<br />
central services of HR, finance, IT and corporate governance.<br />
Other significant costs include bank charges and commissions,<br />
and share-based payment charges related to the Group’s<br />
executive share incentive and black economic empowerment<br />
employee share incentive schemes. These costs grew by 17.1%,<br />
which includes non-comparable charges of R132m for incentives,<br />
and royalties and management fees amounting to R42m<br />
payable to the Country Road segment on the South African<br />
Country Road and Trenery operations. Excluding these items,<br />
the underlying core expense growth was an acceptable 7.8%.<br />
Overall, SA Retail achieved an operating margin of 7.0%,<br />
up from 6.2% in 2009. The focus on productivity to achieve<br />
positive operating margin leverage remains a key commitment<br />
and the targeted operating margin of 8.0% is planned<br />
to be achieved by 2012.<br />
Return on equity increased from 43.3% to an extremely<br />
satisfactory 69.7% – a result of both the better trading result<br />
and improved asset utilisation, most notably inventory<br />
management in the C&GM segment.<br />
Clothing and General Merchandise<br />
INCOME Statement<br />
<strong>2010</strong><br />
Rm<br />
2009<br />
Rm<br />
%<br />
change<br />
Sales 8 253 7 423 11.2%<br />
Cost of sales 4 943 4 692 5.3%<br />
Gross profit 3 310 2 731 21.2%<br />
Other revenue 21 38 (44.7%)<br />
Expenses 2 321 1 996 16.3%<br />
Operating profit 1 010 773 30.7%<br />
Earnings from associate<br />
and joint venture 3 7<br />
Profit before tax 1 013 780 29.9%<br />
Turnover grew 11.2%, with comparable store sales 6.7%.<br />
Whilst unit volumes in comparable stores were<br />
2.2% lower than in the previous year, the rate<br />
of decline slowed throughout the year, turning<br />
positive in the final quarter.<br />
Seven new corporate stores added 4.8% to turnover growth<br />
and price movement (our internal product inflation measured<br />
by the movement in the average price of the units we sell) was<br />
8.9%, driven in part by comparatively lower markdown activity.<br />
27
GROUP FINANCE DIRECTOR’S REPORT<br />
For the PERIOD ended 27 June <strong>2010</strong> continued<br />
CLOTHING AND GM SALES GROWTH (% ON LAST YEAR)<br />
CLOTHING AND GM SALES GROWTH (% ON LAST YEAR)<br />
Improved trading conditions, and the continued improvement<br />
in the buying, planning and inventory management processes<br />
and process execution resulted in higher margins and reduced<br />
markdowns. Gross margins improved from 36.8% to 40.1%,<br />
which led to an increase in gross profit (in rands) of 21.2%.<br />
Expense growth, which includes the impact of noncomparable<br />
items discussed above was 16.3%, which<br />
saw the C&GM segment achieve a 29.9% PBT growth<br />
to R1 013m and an operating margin of 12.2%, an<br />
improvement from the 10.4% of the prior year.<br />
As the economy continues to improve, we expect sales in<br />
comparable stores to continue to grow and, whilst new store<br />
development slows in the next two years, we still plan to open<br />
six stores in 2011 and two in 2012, adding 3.4% and 3.0% to<br />
trading space respectively.<br />
Food<br />
COMPARABLE STORE VOLUME<br />
COMPARABLE STORE PRICE MOVEMENT<br />
NON-COMPARABLE STORE SALES<br />
ACTUAL SALES GROWTH<br />
% -4 -2 0 2 4 6 8 10 12<br />
INCOME Statement<br />
<strong>2010</strong><br />
Rm<br />
2009<br />
Rm<br />
%<br />
change<br />
Sales 12 227 11 126 9.9%<br />
Cost of sales 9 389 8 616 9.0%<br />
Gross profit 2 838 2 510 13.1%<br />
Other revenue 65 58 12.1%<br />
Expenses 2 461 2 167 13.6%<br />
Operating profit 442 401 10.2%<br />
Earnings from associate 3 6<br />
Profit before tax 445 407 9.3%<br />
After a difficult 2009, which saw a concerted shift of consumer<br />
behaviour towards the discount food retailers, the Food<br />
segment achieved sales growth of 9.9% ahead of last year,<br />
with comparable store sales 5.6%.<br />
Nine new corporate Food stores added 3.7% to<br />
total sales growth and price movement was<br />
lower than last year’s 8.0%, at 5.2%. <strong>Woolworths</strong>’<br />
premium-branded product offering comprises<br />
a lower proportion of staple commodities than our<br />
competitors, and as such, our price movement tends to be<br />
less volatile. In a downward period of the cycle, our inflation<br />
therefore tends to be higher than the industry.<br />
FOOD SALES GROWTH (% ON LAST YEAR)<br />
COMPARABLE STORE VOLUME<br />
COMPARABLE STORE PRICE MOVEMENT<br />
NON-COMPARABLE STORE SALES<br />
ACTUAL SALES GROWTH<br />
% 0 2 4 6 8 10<br />
Gross FOOD profit SALES margins GROWTH improved (% ON LAST by 0.6% YEAR) from last year’s 22.6%<br />
to 23.2% as a result of ongoing work undertaken with our<br />
suppliers to extract cost throughout the value chain.<br />
Expenses grew 13.6%, with core expense growth impacted<br />
by new stores and non-comparable costs as detailed under<br />
SA Retail above.<br />
Despite this, the segment achieved a 9.3% PBT growth of R445m<br />
and an operating margin of 3.6%, in line with the prior year.<br />
Store expansion plans are in place to add a further 7.3%<br />
and 7.7% trading space (in 15 and eight stores) in 2011 and<br />
2012 respectively. Investment in new space will focus on store<br />
extensions and larger new stores as we find that customers are<br />
willing to increase the content of their basket within a larger<br />
store environment providing a more complete product range.<br />
28
Country Road<br />
INCOME Statement<br />
<strong>2010</strong><br />
A$m<br />
2009<br />
A$m<br />
%<br />
change<br />
Sales 372 343 8.5%<br />
Cost of sales 159 139 14.4%<br />
Gross profit 213 204 4.4%<br />
Other revenue 8 4 100.0%<br />
Expenses 203 186 9.1%<br />
Store costs 151 132 14.4%<br />
Other operating costs 52 54 (3.7%)<br />
Operating profit 18 22 (18.2%)<br />
Finance costs 1 –<br />
Profit before tax 17 22 (22.7%)<br />
The Australian consumer market continued to struggle during<br />
the year as interest rates increased, and results suffered<br />
against the strong, fiscally stimulated 2009 performance. Retail<br />
store sales performance, up 12.9%, outstripped department<br />
store concession sales of 5.1%. Sales growth was driven by the<br />
11 new stores (six Trenery stores and five Country Road stores)<br />
adding 11.8% new corporate store space.<br />
Heavy promotional activity helped support the sales growth of<br />
8.5%, but at the cost of gross margin, which dropped from 59.5% to<br />
57.4%. US dollar forward purchases also put pressure on margins<br />
as the Australian dollar strengthened throughout the year.<br />
Gross profit ended 4.4% down on the year in Australian<br />
dollar terms.<br />
The Trenery roll-out and Country Road store expansion were<br />
the main contributors to an expense growth of 9.1%, and<br />
although other operating costs remained well controlled,<br />
profit before tax ended the year down 18.2%.<br />
Store growth is planned to continue with a further 10.4%<br />
and 9.4% trading space (in 14 and 12 stores) in 2011 and<br />
2012 respectively.<br />
Return on equity declined from 21.9% to 15.4% in Australian<br />
dollar terms due to the reduction in profits. Country Road’s<br />
statement of financial position includes trademarks of<br />
A$11.3m, which are excluded from the Group statement of<br />
financial position, having been written down on acquisition.<br />
Return on equity, excluding the trademarks, would be 17.8%.<br />
Targeted return on equity for the segment is 20%.<br />
<strong>Woolworths</strong> Financial Services<br />
INCOME<br />
Statement<br />
<strong>2010</strong><br />
Rm<br />
% to<br />
Book<br />
2009<br />
Rm<br />
% to<br />
Book<br />
%<br />
change<br />
Interest income 1 167 19.5 1 432 23.9 (18.5%)<br />
Interest paid 386 6.4 568 9.5 (32.0%)<br />
Net interest income 781 13.0 864 14.4 (9.6%)<br />
Impairment 308 5.1 451 7.5 (31.7%)<br />
Risk-adjusted margin 473 7.9 413 6.9 14.5%<br />
Non-interest revenue 365 6.1 376 6.3 (2.9%)<br />
Operating costs 623 10.4 560 9.4 11.3%<br />
Profit before tax 215 3.6 229 3.8 (6.1%)<br />
Financial services<br />
assets (average) 5 995 5 989<br />
Return on equity 13.9% 14.6%<br />
Reconciliation of<br />
WFS profit<br />
Profit before tax –<br />
to 30 September 2008 71.8<br />
Profit before tax –<br />
from 1 October 2008 157.1<br />
Total above 228.9<br />
Profit before tax –<br />
to 30 September 71.8 Consolidated<br />
Joint venture profit<br />
before tax 214.7 157.1<br />
Taxation 65.8 42.4<br />
Profit after tax 148.9 114.7<br />
Less 50% 74.5 57.4<br />
Equity accounted 74.5 57.4<br />
The statement of comprehensive income, above, shows the full<br />
results of the segment in order to comprehend the operating<br />
29
GROUP FINANCE DIRECTOR’S REPORT<br />
For the PERIOD ended 27 June <strong>2010</strong> continued<br />
performance, as explained below. The group now brings to<br />
account only its 50% share of the after tax profit, under equity<br />
accounting rules. Last year, the segment was fully consolidated<br />
for the three months to 30 September 2008, and was equity<br />
accounted thereafter.<br />
Local consumers’ continued aversion to credit impacted the<br />
WFS joint venture with Absa Bank, which struggled to generate<br />
growth. The aggregate debtors’ book was only 0.1% higher on<br />
average throughout the year, and ended the year 1.0% down.<br />
The business continues to operate four product groups<br />
– the in-store card that can be used only for purchases<br />
in <strong>Woolworths</strong> stores, <strong>Woolworths</strong> Visa credit cards,<br />
personal loans and insurance products.<br />
Interest income from the combined book declined 18.5% to<br />
R1 167m as a result of the reduction in interest rates with gross<br />
yields falling from 23.9% to 19.5%.<br />
Gearing of the book is 84% and this funding is provided by<br />
Absa Bank at a three month JIBAR linked rate. In a declining<br />
interest environment, the interest margin is squeezed as a result<br />
of the multiplier effect contained within the regulated interest<br />
rate formula. As a result, the net interest yield declined from<br />
14.4% to 13.0% of the book.<br />
The impairment charge (comprising bad debts written off<br />
during the year as well as the movement in the provision for<br />
doubtful debts) improved sharply from 7.5% of the book to<br />
a pleasing 5.1%. This was due to improved risk assessment<br />
for new accounts as a result of expertise obtained through<br />
the partnership with Absa Bank and the continued focus<br />
on collections.<br />
This resulted in the “risk-adjusted margin” improving to 7.9%<br />
of the book from 6.9%, a 14.5% improvement, despite the<br />
significantly lower interest rates.<br />
Non-interest revenue (account charges regulated by<br />
the National Credit Act) declined marginally due to<br />
fewer transactions. Expenses grew 11.3% as a result<br />
of the investment in collection capacity and costs<br />
related to the implementation of controls necessary to meet<br />
Absa Bank’s compliance standards.<br />
Profit declined 6.1% for the 12 months to June, with a profit to<br />
book ratio down slightly to 3.6% from 3.8% a year earlier.<br />
Return on equity declined slightly to 13.9% from 14.6%. The<br />
target set by the business remains at 20%.<br />
Treasury<br />
The group maintained a net cash positive position throughout<br />
the year, despite maintaining borrowings of R1.5bn after the<br />
WFS transaction was completed in order to enhance liquidity<br />
during a still uncertain credit environment. Net interest income<br />
of R28m cannot be compared with the R50m segment result of<br />
the previous year due to the timing of the WFS and resultant<br />
capital transactions.<br />
Dividend policy is for the interim and final distributions to<br />
be covered 1.5 times by adjusted headline earnings, and is<br />
designed such that the group operates on a broadly cashneutral<br />
basis after operating cash flows, distributions and<br />
capital expenditure is deducted. The board considers the<br />
appropriateness of share buybacks if no other opportunities<br />
present themselves for the utilisation of excess cash.<br />
During the year, the net shares repurchased, totalled a<br />
cost of R363m.<br />
Taxation<br />
The group’s effective tax rate of 27.9% was lower than last<br />
year’s 30.2%, as no STC was payable on the share premium<br />
distributions that were paid in lieu of dividends during the<br />
year. The effective tax rate will, however, increase in 2011 as<br />
STC is once again incurred.<br />
Financial Position<br />
The group invested R607m in property, plant and equipment,<br />
R279m related to the South African store development<br />
programme which added 18 095 m 2 of new space<br />
(13 233 m 2 and 4 862 m 2 across seven and 11 new C&GM<br />
and Food locations respectively) as well as expenditure<br />
on refurbishments and modernisations across the existing<br />
real estate. Country Road invested R147m in its 11 new stores,<br />
adding 2 624 m 2 and 1 754 m 2 to trading space.<br />
A further R155m was invested in information systems as<br />
we continually improve our inventory planning and<br />
30
The group’s funding strategy is to ensure<br />
a broadly net cash-neutral position.<br />
management systems, and invest in capacity and improved<br />
financial controls.<br />
Our 50% (less one share) joint-venture interest in WFS is equity<br />
accounted and our R573m equity investment, which includes<br />
our share of retained income, is recognised in the statement<br />
of financial position.<br />
Investment in inventory contracted 2.7% to R1 676m. C&GM<br />
inventory turn was maintained at 5 times. Food inventory turn<br />
reduced slightly from 21 to 19 times, although stock levels were<br />
well controlled and availability levels were maintained.<br />
A<br />
significant focus during the year on billing and<br />
collection processes and improvements facilitated by<br />
our investment in the Oracle Financial Suite resulted<br />
in accounts receivable (mainly franchise and sundry<br />
debtors’ balances) remaining largely unchanged from last<br />
year. Interest free working capital funding in the form of trade<br />
and other payables increased 9.9%.<br />
Net asset book value per share increased by 14.3% to 447 cents<br />
per share.<br />
Cash flow and capital expenditure<br />
The following table illustrates cash flows during the year. The<br />
table demonstrates how operational cash flow generated is<br />
utilised by capital expenditure, distributions to shareholders<br />
and taxation.<br />
The group’s funding strategy is to ensure a broadly net cashneutral<br />
position.<br />
The business (especially the SA Retail segments) is extremely<br />
cash generative, demonstrated by earnings before interest,<br />
taxation, depreciation and amortisation (EBITDA) growing 12.7%<br />
to R2 097m. The improvements in working capital released<br />
cash of R579m, and with no liability for STC and an increase<br />
in capital expenditure accruals, R1 614m was available before<br />
shareholder distributions of R725m. After share repurchases<br />
totalling R363m, cash balances increased by R526m.<br />
CASH GENERATION FOR THE YEAR ENDED JUNE <strong>2010</strong> (RM)<br />
579<br />
2 097<br />
(152)<br />
(367)<br />
(543)<br />
(725)<br />
(363)<br />
526<br />
EBITDA<br />
WORKING<br />
CAPITAL AND<br />
OTHER<br />
MOVEMENTS<br />
INTEREST<br />
PAID<br />
TAX<br />
NET<br />
CAPEX<br />
DISTRIBUTIONS<br />
TO<br />
SHAREHOLDERS<br />
NET<br />
SHARE<br />
BUYBACKS<br />
INCREASE<br />
IN CASH<br />
CASH GENERATION FOR THE YEAR ENDED JUNE <strong>2010</strong> (RM)<br />
31
GROUP FINANCE DIRECTOR’S REPORT<br />
For the PERIOD ended 27 June <strong>2010</strong> continued<br />
Financial risk management<br />
Financial risks related to funding (liquidity and counterparty<br />
risks), interest rate risk and foreign exchange risk are managed<br />
by the treasury committee, which meets on a regular basis.<br />
Funding requirements are assessed in order to optimise<br />
funding structures.<br />
Liquidity risk associated with borrowings is managed<br />
by staggering the timing of maturities of borrowings<br />
and maintaining appropriate short-term committed<br />
and uncommitted banking facilities. Unutilised banking<br />
facilities totalled R2 443m at June <strong>2010</strong> (2009: R3 447m). During<br />
the year, we reduced the level of committed facilities in order<br />
to minimise the costs related to these facilities and where we<br />
considered the level of facilities to be excessive.<br />
Interest-bearing borrowings carry interest rate risk. As part<br />
of the process of managing the group’s fixed and floating<br />
rate borrowings mix, the interest rate characteristics of new<br />
borrowings and refinancing of existing borrowings are<br />
positioned according to expected movements in interest rates.<br />
It is the group’s policy to cover all foreign currency exposures<br />
arising from the acquisition of goods and services with<br />
forward exchange contracts.<br />
The group uses the pool method to manage these exposures<br />
and to provide an effective economic hedge. However, due<br />
to the complexity in documenting the relationship between<br />
hedging instruments and hedged items required in terms<br />
of IAS 39, the group does not apply hedge accounting to<br />
these transactions.<br />
Our dividend policy is set at 1.5 times adjusted headline<br />
earnings per share. In addition, we will continue to consider<br />
the repurchase of shares as and when excess cash permits.<br />
Accounting standards<br />
The annual financial statements have been prepared in<br />
accordance with International Financial Reporting Standards.<br />
Various IFRS, IFRIC interpretations and amendments were<br />
adopted during the current year. These standards and<br />
amendments had no impact on the group’s <strong>report</strong>ed results.<br />
Details can be found in note 1 on page 83 of the group annual<br />
financial statements. All additional disclosures required by<br />
these standards have been provided for both the current<br />
and comparative period.<br />
LOOKING AHEAD and Financial Targets<br />
We expect the year to June 2011 to remain challenging.<br />
However, as a result of continuing benefits from improved<br />
sourcing of merchandise we expect retail gross margins to<br />
be maintained during 2011.<br />
Operating margin for SA Retail is targeted at 8.0% in the<br />
medium term.<br />
Capital expenditure is expected to be approximately<br />
R680m, of which R600m is planned for SA Retail,<br />
mainly comprising the continued store roll-out and<br />
modernisation programme and R80m is planned<br />
for the Country Road store expansion programme. Planned<br />
increases in footage have been detailed above. We expect<br />
this to continue into 2012 at R650m for SA Retail and R120m for<br />
Country Road.<br />
We expect the group effective tax rate to approximate<br />
the normal rate of income tax of 28%, plus STC payable<br />
on dividends paid during the course of the year ahead.<br />
32
WOOLWORTHS EXECUTIVE COMMITTEE<br />
simon susman<br />
GROUP chief executive<br />
officer<br />
IAN MOIR<br />
managing DIRECTOR<br />
retail and<br />
GROUP chief executive<br />
officer-elect<br />
PAULA DISBERRY<br />
GROUP DIRECTOR<br />
CLOTHING & GENERAL<br />
MERCHANDISE PLANNING<br />
FAWZA ESSA<br />
GROUP DIRECTOR<br />
SUPPLY CHAIN AND<br />
INFORMATION TECHNOLOGY<br />
CHARMAINE HUET<br />
GROUP DIRECTOR<br />
MARKETING<br />
BRETT KAPLAN<br />
GROUP DIRECTOR<br />
CLOTHING AND<br />
GENERAL MERCHANDISE<br />
BUYING<br />
MATT KEOGH<br />
GROUP DIRECTOR<br />
HUMAN RESOURCES<br />
CHERRIE LOWE<br />
GROUP SECRETARY AND<br />
GROUP DIRECTOR<br />
GOVERNANCE<br />
ZYDA RYLANDS<br />
managing DIRECTOR<br />
food<br />
NORMAN THOMSON<br />
GROUP finance DIRECTOR<br />
33
ABRIDGED GOOD BUSINESS JOURNEY REPORT<br />
driving a more sustainable business<br />
The Good business journey aims to ensure<br />
we drive a virtuous circle that will benefit<br />
all of our stakeholders.<br />
In 2007 we consolidated and<br />
accelerated our previous<br />
sustainability efforts under<br />
our Good business journey<br />
programme which brought together our<br />
philosophy that the true sustainability<br />
of a company is reliant on its own<br />
continuous performance and a<br />
sustainable society and environment.<br />
We further believe that all the elements<br />
of economic growth, transformation,<br />
social development, the environment<br />
and climate change, can either form<br />
a vicious or virtuous circle. The Good<br />
business journey aims to ensure we<br />
drive a virtuous circle that will benefit<br />
all of our stakeholders.<br />
We consider the Good business journey<br />
as a key to enhancing our brand<br />
while being cognisant of the impacts<br />
of our business on society and the<br />
environment. We have realised over the<br />
past few years that our focus on social<br />
and environmental issues can drive<br />
innovation and operational efficiencies<br />
in our business.<br />
Our Good business journey programme<br />
covers more than 260 indicators<br />
across four pillars – economic, social,<br />
transformation and environment.<br />
<strong>Annual</strong> targets were set to 2012,<br />
with a comprehensive measurement<br />
and tracking system embedded in<br />
the business.<br />
We measure our achievement against<br />
these targets each year and aggregate<br />
the scores for each indicator to see how<br />
well we have performed.<br />
Progress of our scores is shown below:<br />
<strong>2010</strong> 2009 2008<br />
<strong>Annual</strong><br />
achievement 84% 79% 77%<br />
Achievement<br />
against 2012<br />
target 71% 61% 62%<br />
STAKEHOLDER ENGAGEMENT<br />
Stakeholder engagement is an integral<br />
part of the way we do business.<br />
We have 3.9m customers who expect us<br />
to provide them with product that has<br />
great value, is innovative and available.<br />
We engage with a panel of customers<br />
on a regular basis from topics such<br />
as product development, innovation<br />
and business issues to ensure that<br />
we exceed their expectations. Our<br />
customer research shows growing<br />
awareness of the Good business<br />
journey programme, and high levels<br />
of support for its objectives. Customers<br />
increasingly want to understand where<br />
products come from, and to be certain<br />
that these are sourced ethically and<br />
without harm to the environment.<br />
We are responding to this need with<br />
in-store and broader communication<br />
regarding our products and indeed<br />
our most recent food television<br />
campaign takes customers back to the<br />
farms from which some of our iconic<br />
products emanate.<br />
Employee understanding and backing<br />
for our Good business journey<br />
programme is measured through our<br />
annual people survey, which has shown<br />
high levels of support. Something<br />
we cannot measure, however, is<br />
the innovation and enthusiasm of<br />
employees across the business in<br />
integrating sustainability thinking into<br />
their daily jobs, and bringing new<br />
projects to life that have changed the<br />
way we operate.<br />
We continue to build our employees’<br />
knowledge around sustainability to<br />
enable them to help colleagues and<br />
customers understand their impacts<br />
and drive the Good business journey<br />
34
ABRIDGED GOOD BUSINESS JOURNEY REPORT<br />
driving a more sustainable business CONTINUED<br />
messages in the workplace and at<br />
home. A fantastic example of this has<br />
been an energy saving campaign<br />
across the business, which has helped<br />
employees reduce energy usage in<br />
stores and in their homes.<br />
Experience has shown that<br />
most sustainability challenges<br />
cannot be solved by one<br />
company acting alone, and<br />
we are excited about the support we<br />
have received from our suppliers and<br />
specialist non-profit organisations<br />
in implementing programmes like<br />
Farming for the Future, and the many<br />
things we have learnt from their efforts.<br />
These sustainability initiatives have<br />
been a natural extension of the longstanding<br />
partnerships we share with<br />
our suppliers, and have allowed us<br />
to formulate unique, and often farmspecific,<br />
responses to biodiversity,<br />
transformation and other objectives.<br />
We have also seen our business<br />
relationships with companies like Absa<br />
and Engen develop into expansions<br />
of our social and environmental<br />
initiatives with the expanded EduPlant<br />
programme and recycling at Engen<br />
service stations two clear examples<br />
of such collaboration.<br />
The full details of our programme<br />
and a detailed <strong>report</strong> for <strong>2010</strong><br />
can be found at our website at<br />
www.woolworthsholdings.co.za<br />
TRANSFORMATION<br />
The transformation pillar uses the<br />
dti’s broad-based black economic<br />
empowerment (BBBEE) scorecard<br />
framework. The scorecard targets<br />
are integrated into our strategy to<br />
ensure meaningful and sustainable<br />
empowerment endeavours.<br />
We have set a target to become a<br />
level 4 contributor by 2012. Through<br />
the external assurance received<br />
from BEE Verification Agency CC, we<br />
have achieved a 60.7 score, a level 5<br />
contributor, improving from 46.5<br />
in June 2009.<br />
Employment equity (EE) has continued<br />
to be a key business focus in <strong>2010</strong><br />
with a specific focus on establishing<br />
an EE talent pipeline in line with our<br />
strategy of developing and progressing<br />
EE talent through the business. The<br />
launch of our graduate programme,<br />
Growth Academy, in collaboration<br />
with the wholesale and retail Seta<br />
and the University of Stellenbosch<br />
Business School in February <strong>2010</strong> was<br />
groundbreaking within the retail sector,<br />
and is a significant step towards<br />
enabling this strategy. In order to build<br />
a culture that enables transformation,<br />
a new diversity workshop was piloted,<br />
and will be rolled out across the<br />
business in the new financial year.<br />
During the year <strong>Woolworths</strong> went<br />
through a Director General review<br />
of employment equity progress with<br />
the department of Labour, which<br />
highlighted the need to focus on African<br />
representation at senior management<br />
level and disability representation.<br />
We continue to work with the relevant<br />
Government departments to achieve<br />
our transformation objectives.<br />
The skills development and training for<br />
<strong>2010</strong> has focused on developing and<br />
building competence relating to both<br />
leadership and technical or functional<br />
skills. The numbers of learners<br />
participating in formalised learnerships,<br />
skills programmes and trainee<br />
programmes has increased steadily.<br />
Learning and development continues<br />
to be a key enabler for the development<br />
of a black talent pipeline for key roles<br />
in the business.<br />
Major shifts were made in preferential<br />
procurement and enterprise<br />
development which were well<br />
above our targets. The preferential<br />
procurement score has improved<br />
dramatically due to focused efforts<br />
to obtain supplier credentials, well<br />
structured central procurement<br />
processes which emphasise BEE<br />
credentials, and support for our<br />
suppliers in their own verification<br />
processes. Our enterprise development<br />
initiatives provide those enterprises<br />
with business opportunities. We have<br />
focused our efforts on emerging<br />
organisations in our greater supply<br />
chain. In the current year we have<br />
assisted 32 (2009:25) black-owned<br />
companies supplying products and<br />
services to various business units.<br />
Our BEE employee share<br />
ownership scheme<br />
earned a percentage<br />
of the distributions paid<br />
out to ordinary shareholders. The<br />
beneficiaries of the scheme have<br />
received R16.3m, an increase of 67% on<br />
the previous year. The scheme has paid<br />
a total of R37.8m in dividends to date.<br />
During the year we contributed R314m<br />
to a range of charity organisations<br />
as part of our commitment to social<br />
economic development. Our focus is<br />
to build capacity in our communities<br />
36
and to encourage and support our<br />
beneficiaries in becoming self-reliant.<br />
In particular we are committed to<br />
addressing two of our country’s<br />
key challenges – food security and<br />
education. Our EduPlant programme<br />
assists and teaches disadvantaged<br />
schools and communities to gain the<br />
skills that they need to grow their<br />
own food.<br />
Through MySchool and Making<br />
the Difference through Design<br />
and Making the Difference<br />
through Nutrition, <strong>Woolworths</strong><br />
contributes to the improvement of<br />
education in South African schools.<br />
The MySchool contributions assist in<br />
supporting more than 10 000 schools,<br />
many in impoverished areas around the<br />
country. The programme also includes<br />
MyVillage and MyPlanet, which support<br />
selected charities and environmental<br />
organisations. A percentage of the<br />
value of purchases made by customers<br />
in our stores is contributed by us to<br />
MySchool on their behalf – we have<br />
contributed more than R100m to date.<br />
SOCIAL DEVELOPMENT<br />
The social development pillar includes<br />
a focus on our people initiatives, social<br />
conditions in our supply base, product<br />
labelling and health and safety.<br />
Our people<br />
Our integrated people strategy is built<br />
on a value-based culture that creates<br />
a platform to drive high performance<br />
enabling us to deliver sustainable and<br />
profitable growth through our people.<br />
In <strong>2010</strong> we made significant strides<br />
towards establishing a leading<br />
employment value proposition through<br />
the implementation of an integrated<br />
people and reward strategy.<br />
Employment proposition<br />
We employ 18 977 people in our<br />
business, the majority of whom work<br />
in our store environment.<br />
We have seen our staff turnover in<br />
corporate stores decrease by 8% as<br />
a result of the improvements made to<br />
enhance the staff employment value<br />
proposition. We have increased<br />
stability through ensuring more<br />
guaranteed hours for our store staff.<br />
This was achieved through converting<br />
staff who were on flexible 28-hour<br />
contracts to flexible 40-hour contracts.<br />
At the end of the year, 37% of staff were<br />
on flexible 40-hour contracts ahead<br />
of our target for the year. A voluntary<br />
healthcare scheme was introduced for<br />
staff employees, with the initial take up<br />
exceeding our expectations. We trialled<br />
a variable pay scheme in four stores<br />
for all store staff and based on the<br />
employee and business benefits, we<br />
will roll it out to all stores in 2011.<br />
Remuneration<br />
Remuneration for the majority of our<br />
staff is made up of a guaranteed<br />
base pay, retirement and healthcare<br />
contributions and store discounts.<br />
To drive high performance short<br />
term incentives are available to most<br />
employees. The company’s short term<br />
performance bonus scheme and<br />
the stores and distribution centres<br />
gain share scheme serve to reward<br />
participants for successful performance.<br />
Employee engagement<br />
We have implemented an engagement<br />
tool, called LetsTalk! which provides<br />
a formal channel to communicate<br />
common messages throughout the<br />
business, receive feedback from our<br />
employees and track actions relative<br />
to the operating and trading plan.<br />
At the end of June <strong>2010</strong>, more than<br />
80% of head office teams and over<br />
50% of stores had implemented the<br />
methodology. Other communication<br />
channels are used and include a bimonthly<br />
newsletter, broadcasts and<br />
our intranet.<br />
Occupational health and safety<br />
All <strong>Woolworths</strong> buildings are<br />
designed within stringent health<br />
and safety guidelines and with<br />
employee and customer wellbeing<br />
as a primary consideration. Joint<br />
staff and management health and<br />
safety committees are in place.<br />
Occupational health practitioners<br />
deliver a comprehensive occupational<br />
health and wellness programme which<br />
includes an employee assistance<br />
programme (EAP). This programme<br />
provides confidential counselling<br />
for personal or business crises as<br />
well as lifestyle counselling to<br />
employees to help them manage<br />
health-related issues.<br />
HIV/Aids is regarded as a<br />
potential threat in South<br />
Africa. All employees have<br />
access to free treatment<br />
and care. A company funded Clinical<br />
Management Programme offers<br />
treatment and other benefits to<br />
HIV-positive employees who do not<br />
qualify for membership to the Wooltru<br />
Healthcare Fund. Those belonging<br />
to the Healthcare Fund have access<br />
to treatment via the fund.<br />
37
ABRIDGED GOOD BUSINESS JOURNEY REPORT<br />
driving a more sustainable business CONTINUED<br />
We have become water neutral by<br />
eliminating invasive water-thirsty alien<br />
plants at the Tankwa Karoo National Park.<br />
ENVIRONMENT<br />
The environment pillar focuses on<br />
our initiatives and programmes that<br />
manage the impact that this business<br />
has on the environment and our use<br />
of natural resources.<br />
As a retailer of clothing and particularly<br />
food, we have recognised the<br />
impacts of the products we sell on<br />
the environment. Our aspiration is<br />
not only to ensure that we reduce<br />
our own impact, but that we engage<br />
with our suppliers and customers to<br />
assist them to reduce theirs. We have<br />
recognised the important relationship<br />
between the production of food and<br />
the environment and the necessity to<br />
adopt better environmental practices<br />
in our suppliers’ agricultural systems to<br />
provide South Africa with food security<br />
and protect our natural ecosystems.<br />
Water programme<br />
South Africa is a water-scarce country<br />
and the quality of our water is<br />
increasingly threatened, in part by<br />
industrial and agricultural activity.<br />
The majority of South Africa’s water<br />
resource is used in farming irrigation,<br />
and as a major supplier of fresh<br />
produce, <strong>Woolworths</strong> is playing<br />
a role in water conservation.<br />
We set targets to reduce our water<br />
consumption by 30% by 2012. Our head<br />
office facilities have shown a 24%<br />
decrease in water usage and a 27%<br />
reduction in relative usage in stores<br />
compared with our 2008 benchmarks.<br />
We are working with our suppliers to<br />
measure and improve water usage and<br />
wastewater management practices,<br />
using the Farming for the Future<br />
programme as a basis, and rolling it out<br />
to other parts of the food supply chain,<br />
such as dairy and wine.<br />
We have also relooked<br />
at the design of our<br />
stores and distribution<br />
centres to enable<br />
the efficient use of water and water<br />
waste. This includes recycled and<br />
grey water systems, use of indigenous<br />
shrubs and ground covers, storm water<br />
management and pulse metres to<br />
improve water measurement<br />
and monitoring.<br />
We are also the only retailer to form<br />
part of the World Wide Fund for<br />
Nature’s (WWF) Water Neutral Scheme.<br />
We have become water neutral by<br />
eliminating invasive water-thirsty alien<br />
plants at the Tankwa Karoo National<br />
Park. The project will release enough<br />
water into South Africa’s water system<br />
to offset the water used by our<br />
operations each year.<br />
Farming for the Future<br />
Together with our farmers, we have<br />
pioneered a new approach to growing<br />
food sustainably so that South Africa’s<br />
farms will be able to provide enough<br />
food for future generations – called<br />
Farming for the Future, at no additional<br />
cost to customers.<br />
This is a holistic approach that<br />
manages the entire farming process<br />
systematically, starting with building<br />
and maintaining the soil, because it<br />
takes good soil to produce good food.<br />
Healthy soil is better able to retain<br />
water, so it needs less irrigation and<br />
water use is reduced. It also needs<br />
fewer chemical interventions, which<br />
means farmers only use synthetic<br />
fertilisers or herbicides when needed.<br />
Farmers also use integrated pest<br />
management principles in order<br />
to reduce reliance on chemical<br />
pesticides and herbicides and<br />
encourage biodiversity.<br />
We have set a target that all our locally<br />
grown fresh produce (other than<br />
organically certified produce) will be<br />
grown this way by 2012. Farming for the<br />
Future was introduced during the year<br />
and to date we have 68% of our<br />
produce farmers complying with<br />
the programme standards.<br />
Waste management packaging<br />
We have committed to reducing<br />
packaging to the minimum necessary<br />
needed to protect and promote the<br />
product and inform our customers.<br />
38
This reduction programme has been<br />
supported by an intensive customer<br />
education programme.<br />
We set targets to reduce clothing<br />
packaging by more than a third, reduce<br />
food packaging by 20% (20 000 tons)<br />
and decrease plastic bag usage.<br />
We have now saved over 660 tons of<br />
food packaging against the targets,<br />
are making good progress in clothing<br />
packaging reductions and have reduced<br />
the number of plastic bags used per<br />
transaction by 25% in three years.<br />
We have also set clear targets for<br />
reuse and recycling to offset the<br />
packaging reduction targets that<br />
we may not achieve. These include<br />
including recycled material in product<br />
packaging, restricting packaging<br />
materials to those that can be recycled<br />
locally and putting symbols on plastic<br />
packaging to help customers and<br />
recyclers easily identify packaging<br />
for sorting.<br />
Currently 24% of the product<br />
lines in food contain recycled<br />
packaging materials and<br />
where possible, the sleeves on<br />
ready-made meals, dips and other food<br />
products are made from cardboard<br />
which has a 80% recycled paper<br />
content, 66% of the food packaging<br />
is recyclable against our target of<br />
90%. We have included symbols on<br />
the plastic packaging of over 83%<br />
of our food lines for easy identification<br />
for resorting.<br />
Recycling<br />
We committed to introduce a nationwide<br />
programme supporting the<br />
recycling of our customers’ waste.<br />
We, along with partners, Engen and<br />
Nampak, have trialled recycling facilities<br />
at eight Engen service stations in the<br />
greater Cape Town region. The pilot<br />
provides customers the convenience of<br />
dropping off their glass, paper, plastic<br />
and cardboard for recycling while filling<br />
up their vehicles or shopping at selected<br />
<strong>Woolworths</strong> Foodstops and Engen<br />
convenience shops. We have collected<br />
over 110 tons of recyclable materials<br />
from the eight pilot sites in the last nine<br />
months, and the frequency of collections<br />
having been increased at all sites.<br />
We will install recycling facilities at an<br />
additional 50 Engen sites nationally over<br />
the next six months and facilities<br />
at selected food stand-alone stores<br />
will also be trialled.<br />
CLIMATE CHANGE AND ENERGY<br />
The climate change pillar seeks to<br />
manage the risks and opportunities<br />
to the business in playing its part in<br />
increasing energy efficiency and<br />
reducing carbon emissions.<br />
Energy usage<br />
We set a target to reduce our relative<br />
carbon footprint by 30%, which included<br />
a 30% reduction in the relative<br />
electricity usage.<br />
As our electricity usage contributes the<br />
major portion of our carbon footprint, we<br />
developed a number of plans to reduce<br />
that usage and control the escalation<br />
of costs as a result of the significant<br />
increase in electricity tariffs. A range of<br />
new energy efficient technologies are<br />
being put in place in our stores. They<br />
include measures such as:<br />
• on-line metering of stores energy<br />
consumption;<br />
• automated lighting and electronic<br />
ballasts for lighting;<br />
• new refrigeration systems and<br />
piloting CO 2<br />
refrigeration, which<br />
has a much lower global warming<br />
potential; and<br />
• green building design and<br />
construction specifications.<br />
With the introduction of<br />
these new technologies<br />
we have decreased<br />
our relative electricity<br />
usage by 18%, and offset some of the<br />
impact of energy tariff increases with<br />
the costs saved through our operational<br />
improvements detailed above.<br />
Carbon footprint<br />
Our carbon footprint calculation<br />
on our head office, distribution<br />
centres and corporate stores has<br />
been independently verified by<br />
Global Carbon exchange using the<br />
Greenhouse Gas Protocol Corporate<br />
Accounting and Reporting Standard.<br />
We are showing an 11% increase in our<br />
total carbon footprint from last year, but<br />
this was mainly a function of additional<br />
stores, especially food stand-alone<br />
stores, which have a higher kWh/m 2<br />
than clothing and food stores.<br />
LOOKING AHEAD<br />
We always thought of our 2012 targets<br />
as the first step in a much longer<br />
journey, and have been working hard<br />
to refine our focus areas, and add new<br />
targets to our programme.<br />
We are committed to operating our<br />
business in the most responsible<br />
way possible and partnering with<br />
our suppliers, customers and other<br />
stakeholders to achieve this.<br />
39
CORPORATE GOVERNANCE<br />
INTRODUCTION<br />
introduction<br />
The board of directors believe that in<br />
order for good corporate governance<br />
to take place, <strong>Woolworths</strong> must engage<br />
with and take the legitimate interests of<br />
all stakeholders into account which will<br />
ensure that the business is financially,<br />
environmentally and socially responsible<br />
in the countries in which we trade.<br />
In order to deliver the above,<br />
<strong>Woolworths</strong> corporate governance<br />
practices are continually being<br />
reviewed and improved, by<br />
benchmarking against internationally<br />
accepted best practices and<br />
guidelines.<br />
<strong>Woolworths</strong> is fully committed to the<br />
principles of the Code of Corporate<br />
Practices and Conduct as set out in the<br />
King Code of Governance Principles<br />
for South Africa (King III). King III is<br />
effective for all listed companies with<br />
a year end commencing on and after<br />
1 March <strong>2010</strong>. The group currently has<br />
applied many of the King III principles<br />
and recommendations. Where<br />
principles are not yet in place, the<br />
board has put a programme in place<br />
to review the recommendations of<br />
King III with a view to applying all these<br />
recommendations or explaining the<br />
non-application by June 2011.<br />
A<br />
governance model has<br />
been adopted by the<br />
group. Through the blend of<br />
specialist disciplines such as<br />
risk management, legal, compliance<br />
and sustainability within the corporate<br />
governance department the board and<br />
its management team is supported<br />
in embedding this model throughout<br />
the group.<br />
governance model<br />
Stakeholders<br />
Framework<br />
Articles of<br />
association<br />
Laws<br />
Statutes<br />
Codes<br />
Regulations<br />
Internal<br />
policies<br />
Values<br />
Independent<br />
non-executive directors<br />
Buddy Hawton (C)<br />
Peter Bacon<br />
Lindiwe Bakoro<br />
Nigel Colne<br />
Brian Frost<br />
Mike Leeming<br />
Chris Nissen<br />
Thina Siwendu<br />
Sindi Zilwa<br />
Risk<br />
Mike Leeming (C)<br />
Simon Susman<br />
Peter Bacon<br />
Lindiwe Bakoro<br />
Nigel Colne<br />
Ian Moir<br />
Zyda Rylands<br />
Thina Siwendu<br />
Norman Thomson<br />
Sindi Zilwa<br />
Remuneration<br />
Buddy Hawton (C)<br />
Peter Bacon<br />
Nigel Colne<br />
Brian Frost<br />
Unitary board of directors<br />
Nominations<br />
Buddy Hawton (C)<br />
Nigel Colne<br />
Brian Frost<br />
Mike Leeming<br />
Chris Nissen<br />
Board committees<br />
Transformation<br />
Chris Nissen (C)<br />
Buddy Hawton<br />
Thina Siwendu<br />
Simon Susman<br />
Sindi Zilwa<br />
Executive management<br />
Executive directors<br />
Simon Susman (CEO)<br />
Ian Moir<br />
Norman Thomson<br />
Zyda Rylands<br />
Sustainability<br />
Brian Frost (C)<br />
Chris Nissen<br />
Simon Susman<br />
Zyda Rylands<br />
Audit<br />
Mike Leeming (C)<br />
Lindiwe Bakoro<br />
Nigel Colne<br />
Sindi Zilwa<br />
External<br />
audit<br />
Internal<br />
audit<br />
Nonfinancial<br />
external<br />
assurance<br />
Internal<br />
controls<br />
Assurance<br />
40<br />
C – chairman • CEO – Group chief executive officer
CORPORATE GOVERNANCE<br />
accountability<br />
<strong>Woolworths</strong> board is accountable to its<br />
stakeholders and pursues dialogue with<br />
them, where practicable.<br />
The board has identified the key<br />
stakeholders and engages with them<br />
in a number of ways as highlighted in<br />
the table below.<br />
The board believes in<br />
communicating to investors the<br />
group’s strategies and financial<br />
performance in a timely,<br />
relevant and balanced manner.<br />
Analyst presentations were held after<br />
our interim and annual results. For<br />
those investors who were unable to<br />
attend the presentations in person,<br />
they were shown via web cast and<br />
the presentations were published on<br />
our website. Analysts were invited<br />
to two store visits during the year.<br />
Care is exercised to ensure that any<br />
price-sensitive information is released<br />
to all shareholders at the same<br />
time in accordance with the Listings<br />
Requirements of the JSE.<br />
During the year shareholders approved<br />
two specific issues of shares to its<br />
subsidiary <strong>Woolworths</strong> (Pty) Ltd.<br />
codes and legislation<br />
Compliance with the applicable codes<br />
and regulations in the countries in<br />
which it trades is seen as an integral<br />
part of <strong>Woolworths</strong> culture and future<br />
sustainability. Through the compliance<br />
department, the board is updated<br />
with regular <strong>report</strong>s to the various<br />
committees on any regulatory changes<br />
and significant interaction with<br />
key stakeholders.<br />
During the year the most<br />
significant codes and<br />
legislation that have<br />
impacted the group are<br />
King III, the Consumer Protection Act,<br />
the Companies Act, the Regulation<br />
of Interception of Communications<br />
Act and Payment card industry data<br />
security standards.<br />
A comprehensive review on the<br />
Consumer Protection Act was conducted<br />
and the business has been trained to<br />
ensure that they understand and are<br />
in a position to implement the new<br />
requirements of the act.<br />
A<br />
high-level review of the<br />
Companies Act 71 of 2008<br />
has been conducted and<br />
the group will manage the<br />
implementation thereof, given the<br />
new Amendment bill, during 2011. The<br />
programme to apply King III has been<br />
explained earlier.<br />
The board is of the opinion that the<br />
group has complied with all significant<br />
requirements incorporated in the Code<br />
of Corporate Practices and Conduct<br />
as set out in the King II Report and the<br />
Listings Requirements of the JSE <strong>Limited</strong><br />
for the period under review.<br />
STAKEHOLDER<br />
ENGAGEMENT PROCESS<br />
Customers<br />
Employees<br />
Shareholders<br />
Suppliers<br />
Franchisees<br />
Government and regulatory bodies<br />
Unions<br />
NGOs and community organisations<br />
Media<br />
Focus groups, customer surveys, direct marketing, in-store customer service desks,<br />
customer call centres, social media networks<br />
Communication meetings, employee surveys, performance discussions, strategy<br />
sharing, team and group communication sessions<br />
<strong>Annual</strong> (and) general meetings, SENS announcements, analyst presentations at<br />
interim and annual results, documentation on website, annual <strong>report</strong><br />
Supplier visits at strategic and operational level, supplier conferences, quality and<br />
safety audits<br />
Product buying weeks, communication sessions, franchise conferences, store visits<br />
Ad hoc meetings, participation in research, participation in drafting and input into<br />
documentation, electronic and personal engagement<br />
Wages and terms and conditions of employment, meetings and participation with<br />
labour market institutions<br />
Participation in research and joint projects, education and capacity building on<br />
key issues<br />
Interviews, news releases, publications and electronic format on web<br />
41
CORPORATE GOVERNANCE<br />
INTRODUCTION CONTINUED<br />
The group has a set of values that guides<br />
the manner in which it conducts business<br />
with its stakeholders.<br />
internal policies<br />
To drive and embed effective corporate<br />
governance practices, the company has<br />
a number of policies which complement<br />
the delegation of authority. These<br />
include a board charter, a conflicts<br />
of interest policy, an external auditor<br />
independence policy, an insider trading<br />
policy, a price-sensitive information<br />
policy and an ethics policy.<br />
During the year the external<br />
auditor independence policy,<br />
insider trading policy and<br />
price-sensitive information<br />
policy were reviewed, with amendments<br />
to reflect all new requirements<br />
approved by the board.<br />
insider trading, price sensitive<br />
information and conflicts of<br />
interest policies<br />
The board recognises its responsibility<br />
for ensuring that there are appropriate<br />
policies in place to manage the<br />
confidentiality of price-sensitive<br />
information and ensure that individuals<br />
do not benefit from inside information.<br />
To manage this, the company has<br />
insider trading and price-sensitive<br />
information policies, the terms of which<br />
are more restrictive than those required<br />
by the JSE Listings Requirements.<br />
The Group secretary regularly<br />
disseminates written notice to all<br />
directors and senior management<br />
throughout the group, highlighting the<br />
provisions of the Securities Services Act<br />
and JSE Listings Requirements, informing<br />
them that dealing in <strong>Woolworths</strong> shares<br />
during certain restricted periods,<br />
may not be undertaken. No director<br />
or any employee who participates<br />
in the share scheme may trade in<br />
<strong>Woolworths</strong> shares during restricted<br />
periods as defined by the JSE Listings<br />
Requirements and determined by the<br />
board. In addition, no director of<br />
the company may trade in the company’s<br />
shares without prior written approval<br />
having been obtained. A <strong>report</strong><br />
detailing the dealings in securities<br />
by the directors, the directors of<br />
subsidiaries and the Group secretary<br />
is tabled at each board meeting, and<br />
is disclosed in accordance with the<br />
Listings Requirements of the JSE.<br />
The price sensitive information<br />
policy, governs trading in<br />
shares by any employee<br />
and/or director with unpublished<br />
price-sensitive information. Projects and<br />
initiatives, which are price-sensitive,<br />
are registered with the Group secretary<br />
and directors and employees involved<br />
in these projects are required to sign<br />
confidentiality agreements and are<br />
restricted from trading in shares.<br />
The conflicts of interest policy requires<br />
senior management to declare<br />
details of their business interests<br />
and confirmation that they are in<br />
compliance with the requirements of<br />
the policy. These details were updated<br />
during the year.<br />
values and ethics<br />
The group has a set of values that<br />
guides the manner in which it conducts<br />
business with its stakeholders. The<br />
ethics policy supports these values<br />
and sets out the standards that we<br />
expect to attain when dealing with all<br />
customers, suppliers, business partners,<br />
employees, competitors, community<br />
and our shareholders. In addition, the<br />
policy contains guidelines with respect<br />
to gifts, travel and entertainment as well<br />
as a code of conduct for our business<br />
partners. The policy was reviewed by<br />
the sustainability committee prior<br />
to implementation.<br />
assurance<br />
Assurance over the control environment<br />
is obtained through a combination of<br />
assurance providers.<br />
Assurance at the first level is provided<br />
by management and the control<br />
environment. The main focus of assurance<br />
is provided by the joint auditors Ernst<br />
& Young and SAB&T and other external<br />
assurance providers are used for<br />
specialist areas. This process enables the<br />
board to confirm that the annual <strong>report</strong> is<br />
an accurate reflection of the company’s<br />
financial and sustainability position.<br />
42
CORPORATE GOVERNANCE<br />
BOARD OF DIRECTORS<br />
board of directors<br />
attendance at board meetings<br />
Aug 2009 Nov 2009 Feb <strong>2010</strong> May <strong>2010</strong><br />
18th 19th 19th 20th<br />
Director Strategy Board Board Strategy<br />
Buddy Hawton 1, 3 √ √ √ √ √ √<br />
Simon Susman 2, 4 √ √ √ √ √ √<br />
Peter Bacon 3 √ √ √ √ √ √<br />
Lindiwe Bakoro 3, 5 – √ √ √ √ √<br />
Nigel Colne 3 √ √ √ √ √ √<br />
Brian Frost 3 √ √ √ √ √ √<br />
Andrew Jennings 4, 6 √ √ √ – – –<br />
Mike Leeming 3 √ √ √ √ √ √<br />
Ian Moir 4, 5 – – – √ √ √<br />
Chris Nissen 3 √ √ √ √ √ √<br />
Zyda Rylands 4 √ √ √ √ √ √<br />
Thina Siwendu 3, 5 – √ √ √ √ √<br />
Norman Thomson 4 √ √ √ √ √ √<br />
Sindi Zilwa 3 √ √ √ √ √ √<br />
Notes:<br />
1<br />
= Chairman<br />
2<br />
= Group chief executive officer<br />
3<br />
= Independent non-executive director<br />
4<br />
= Executive director<br />
5<br />
= Appointments:<br />
(i) Lindiwe Bakoro and Thina<br />
Siwendu were appointed to the<br />
board as independent non-executive<br />
directors on 26 August 2009.<br />
(ii) Ian Moir was appointed as an<br />
executive director to the board on<br />
1 January <strong>2010</strong>.<br />
6<br />
= resignation:<br />
(i) Andrew Jennings resigned as an<br />
executive director from the board on<br />
31 December 2009.<br />
board structure<br />
The group has a unitary board structure<br />
with nine non-executive directors, all<br />
of whom are considered independent,<br />
and four executive directors. The<br />
board therefore has a majority of<br />
non‐executive directors. The Chairman<br />
of the board is an independent<br />
non-executive director.<br />
A<br />
number of board committees<br />
assist the board in fulfilling<br />
its stated objectives. The role<br />
and responsibilities of each<br />
committee are set out in their formal<br />
terms of reference. The audit committee<br />
has additional responsibilities given to<br />
it by virtue of the Companies Act. The<br />
terms of reference for the company and<br />
its subsidiaries are reviewed annually to<br />
ensure that they remain relevant.<br />
During the year changes were made<br />
to the terms of reference that adopt<br />
new requirements from the JSE and<br />
where application of the principles and<br />
recommendations of King III have been<br />
adopted. All changes were approved<br />
by the board.<br />
Details of the board and committee<br />
structure can be found on page 40.<br />
board responsibilities<br />
The board is the custodian of corporate<br />
governance and it is responsible for<br />
ensuring that the group is conducted<br />
along sound corporate governance<br />
principles, by approving key policies<br />
and ensuring that the obligations to<br />
stakeholders are met.<br />
The board is responsible for adopting<br />
strategic plans and through the<br />
monitoring of operational performance,<br />
provide management with effective<br />
leadership in line with <strong>Woolworths</strong><br />
ethical values whilst understanding<br />
that strategy, risk, performance and<br />
sustainability are inseparable.<br />
The responsibilities of the board<br />
are set out in the board charter<br />
and can be found on our website<br />
at www.woolworthsholdings.co.za.<br />
During the year the board specifically:<br />
• reviewed and gave input into<br />
the strategy of the company and<br />
its subsidiaries;<br />
• reviewed the performance against<br />
budgets and targets and approved<br />
the budget for the 2011 financial<br />
year;<br />
• reviewed the governance policies<br />
that are in place; and<br />
• reviewed the key risks of the group<br />
and the mitigation strategies.<br />
There is a formal delegation of<br />
authority, which sets out the categories<br />
of business decisions which require<br />
43
CORPORATE GOVERNANCE<br />
BOARD OF DIRECTORS CONTINUED<br />
approval by the board or by one<br />
of its committees. Compliance with<br />
this delegation of authority is the<br />
responsibility of the board and is<br />
monitored by the Group secretary and<br />
the corporate governance department.<br />
directors<br />
independence<br />
All non-executive directors, including<br />
the Chairman, are independent<br />
directors as defined in the King III Report<br />
and the guidelines outlined in the JSE<br />
Listings Requirements.<br />
Independent thought is brought to bear<br />
on board decisions with the majority of<br />
independent non-executive directors.<br />
The board structure and integrity of<br />
individual directors ensure no one<br />
individual dominates the decisionmaking<br />
process.<br />
To uphold their independence<br />
and integrity, directors disclose<br />
all material interests as and<br />
when they arise. A full list of<br />
directors’ interests is tabled annually<br />
at the August board meeting and any<br />
amendments are formally tabled on<br />
a quarterly basis. Directors recuse<br />
themselves from any discussion and<br />
decision on matters in which they may<br />
have a potential conflict of interest.<br />
Individual director performance<br />
and independence evaluations are<br />
performed on those directors due<br />
to retire by rotation. When any one<br />
director reaches a nine year service<br />
period, a rigorous review of their<br />
independence will be performed on<br />
them each year.<br />
In order to ensure that a director<br />
may continue to be classified<br />
as independent, the Chairman<br />
conducts an independence review<br />
on each director retiring by rotation.<br />
The chairman is satisfied that the<br />
non‐executive directors retiring by<br />
rotation are independent.<br />
chairman and group chief<br />
executive officer<br />
The responsibilities of the Chairman<br />
and the Group chief executive officer<br />
are clearly separate. No individual has<br />
unfettered powers of decision-making.<br />
Buddy Hawton is an independent<br />
non-executive Chairman who<br />
is responsible for providing<br />
overall leadership of the board<br />
and ensuring that the board receives<br />
accurate, timely and clear information<br />
so as to ensure that the directors can<br />
perform effectively.<br />
The Group chief executive officer, Simon<br />
Susman, is responsible for formulating<br />
and recommending to the board, longterm<br />
strategies and policies and, through<br />
the approved framework of delegated<br />
authority, ensuring their implementation.<br />
On his retirement in November as Group<br />
chief executive officer, Simon Susman<br />
will remain on the board in the capacity<br />
of a non-executive director and assume<br />
the role of Deputy chairman.<br />
skills, knowledge and<br />
experience of directors<br />
The board with the assistance of the<br />
nominations committee, consider that<br />
the skills, knowledge and experience<br />
of the directors as a whole to be<br />
appropriate for their responsibilities<br />
to <strong>Woolworths</strong> stakeholders.<br />
The directors bring a wide range<br />
of skills to the board spanning<br />
international and local retail<br />
experience, understanding of the<br />
business environment in which we<br />
trade, knowledge of the regulatory<br />
environment, social responsibility,<br />
environment, financial, accounting,<br />
legal and banking experience.<br />
Nigel Colne and Brian<br />
Frost will retire as nonexecutive<br />
directors from<br />
November <strong>2010</strong>. The<br />
nominations committee has evaluated<br />
the balance of skills, knowledge<br />
and experience of the board. The<br />
board has appointed Tom Boardman<br />
to the board with effect from<br />
27 September <strong>2010</strong>.<br />
The non-executive directors have<br />
unrestricted access to all company<br />
information, records, documents and<br />
property. Non-executive directors have<br />
access to management and may meet<br />
separately with management without<br />
the attendance of executive directors.<br />
The non-executive directors meet on<br />
an informal basis each quarter to<br />
discuss points of interest and matters<br />
of concern in a forum that does not<br />
include the executive directors or<br />
senior management.<br />
Through the Group secretary, the<br />
directors may, at the expense of<br />
the company, seek professional advice<br />
on matters concerning the affairs of the<br />
group. No such advice was requested<br />
for the year under review.<br />
induction and ongoing<br />
development<br />
New directors participate in an<br />
induction programme that is adjusted<br />
as necessary to meet the specific<br />
needs of the appointed directors.<br />
The directors are provided with all<br />
44
CORPORATE GOVERNANCE<br />
the necessary documentation in<br />
order to familiarise themselves with<br />
the company and issues affecting the<br />
board. The directors also participate in<br />
an attachment programme with all the<br />
relevant executive directors and senior<br />
management, and undertake site visits<br />
to stores, suppliers and distribution<br />
centres to assist their understanding of<br />
the broad dynamics of the business. The<br />
Group secretary manages the formal<br />
induction programme.<br />
During the year the two new nonexecutive<br />
directors, Lindiwe Bakoro and<br />
Thina Siwendu, have participated in<br />
the induction programme. They have<br />
provided us with good feedback on its<br />
effectiveness and recommendations<br />
have been implemented.<br />
The board recognises that<br />
understanding the business is<br />
an ongoing process and as<br />
such, the Chairman of the board<br />
and the Group secretary ensure an<br />
appropriate quarterly programme is in<br />
place to update non-executive directors<br />
on key new business developments<br />
and initiatives.<br />
rotation of directors<br />
In accordance with the articles of<br />
association of the company, a minimum<br />
of one-third of the board are subject<br />
to retirement and re-election by<br />
shareholders each year. The directors<br />
who retire are directors appointed<br />
since the last annual general meeting<br />
and directors due to retire by rotation.<br />
A director may not hold office for more<br />
than three consecutive years before<br />
standing for re-election. The curriculum<br />
vitae of each director standing for<br />
re-election are set out in the notice of<br />
the annual general meeting.<br />
board meetings<br />
The board met four times during the<br />
year. Additional meetings may be held<br />
whenever deemed necessary. Further<br />
meetings were held in November and<br />
May devoted to strategic planning.<br />
Teleconference meetings were held<br />
in the period.<br />
The Chairman, in consultation with<br />
the Group chief executive officer and<br />
Group secretary, is responsible for<br />
setting the agenda of each meeting.<br />
Board meetings are scheduled well in<br />
advance and management ensures that<br />
board members are timeously provided<br />
with all the relevant information and<br />
facts to enable the board to reach<br />
objective and well informed decisions.<br />
The chairman of each committee<br />
<strong>report</strong>s back to the board on matters<br />
discussed after every meeting. The<br />
minutes of all board and strategy<br />
meetings are circulated to all directors.<br />
The details of individual attendance at<br />
board and strategy meetings are set<br />
out on page 43.<br />
board and committee<br />
effectiveness<br />
The board, through its nominations<br />
committee, regularly reviews its size and<br />
the required mix of skills and experience<br />
needed to provide strategic direction<br />
and leadership whilst ensuring that<br />
the board is representative. The<br />
composition of the board committees<br />
are also reviewed on an annual basis.<br />
The changes that were made during<br />
the year are highlighted in the review<br />
of each committee in this annual<br />
<strong>report</strong>. The board has recognised the<br />
important role that the risk committee<br />
has in the induction of new directors<br />
and aims to rotate new directors<br />
through this committee.<br />
The board and its committees’<br />
effectiveness are evaluated on<br />
a bi-annual basis. A significant<br />
amount of time is committed<br />
to the evaluations and therefore it is<br />
considered appropriate for them to be<br />
conducted bi-annually. Previous reviews<br />
have shown that there are no significant<br />
areas of improvement required. <strong>Annual</strong><br />
reviews may be implemented if the<br />
review indicated that significant actions<br />
were required.<br />
The assessment performed in 2009<br />
showed that the overall performance<br />
was good. The next assessment is<br />
scheduled for 2011. The Chairman<br />
has continued to ensure that agreed<br />
actions from the previous assessment<br />
have been implemented to improve the<br />
board’s effectiveness.<br />
group secretary<br />
The board is cognisant of the duties of<br />
the Group secretary and has created<br />
an environment in which the Group<br />
secretary is able to ensure that board<br />
procedures and relevant regulations<br />
are fully adhered to. The directors have<br />
unlimited access to the advice and<br />
services of the Group secretary.<br />
The role of the Group secretary<br />
can be found on our website at<br />
www.woolworthsholdings.co.za.<br />
The Group secretary acts as secretary<br />
for the committees of the board.<br />
45
CORPORATE GOVERNANCE<br />
RISK COMMITTEE AND RISK REPORT<br />
risk committee and risk <strong>report</strong><br />
attendance at the risk committee meetings<br />
Member Aug 2009 Nov 2009 Feb <strong>2010</strong> May <strong>2010</strong><br />
Mike Leeming 1, 3 √ √ √ √<br />
Simon Susman 2, 4 √ √ √ A<br />
Peter Bacon 3 √ √ √ √<br />
Lindiwe Bakoro 3, 5 – √ √ √<br />
Nigel Colne 3 √ √ √ √<br />
Andrew Jennings 4, 6 √ √ – –<br />
Ian Moir 4, 5 – – √ √<br />
Zyda Rylands 4 √ √ √ √<br />
Thina Siwendu 3, 5 – √ √ √<br />
Norman Thomson 4 √ √ √ √<br />
Sindi Zilwa 3 √ √ √ √<br />
Notes:<br />
1<br />
= Group chairman<br />
2<br />
= Group chief executive officer<br />
3<br />
= Independent non-executive director<br />
4<br />
= Executive director<br />
5<br />
= Appointments<br />
(i) Lindiwe Bakoro and Thina Siwendu<br />
were appointed to the committee<br />
from November 2009.<br />
(ii) Ian Moir was appointed to the<br />
committee from February <strong>2010</strong>.<br />
6<br />
= resignation<br />
Andrew Jennings resigned from the<br />
committee from December 2009.<br />
A = Absent with apologies tendered<br />
The main purpose of the risk<br />
committee is to assist the board<br />
to ensure that management has<br />
implemented and maintained an<br />
effective risk management process in<br />
the group and that risks are managed<br />
in an integrated and timely manner.<br />
The risk committee consists of six<br />
non-executive directors including the<br />
Chairman, Mike Leeming, and four<br />
executive directors. Lindiwe Bakoro and<br />
Thina Siwendu were appointed to the<br />
committee from the November 2009<br />
meeting and Ian Moir was appointed<br />
from the February <strong>2010</strong> meeting. The<br />
presence of the executive directors on<br />
this committee ensures that effective<br />
risk management remains an important<br />
part of the day-to-day operations of<br />
the company. The Chairman of the<br />
committee is also the chairman of the<br />
audit committee. Currently, members of<br />
the audit committee are also members<br />
of the risk committee, allowing the<br />
risk committee to have an integrated<br />
view of all the risks of the company.<br />
The executives responsible for risk and<br />
internal audit and the external auditors<br />
attend the committee meetings. The<br />
Chairman of the board attends the<br />
meetings in February and August at the<br />
time of the group’s interim and annual<br />
financial results and has discussions<br />
with the Chairman of the committee.<br />
The committee met four times during<br />
the year and the committee Chairman<br />
<strong>report</strong>ed back to the board on<br />
the activities of the committee. The<br />
minutes of the committee meetings are<br />
circulated to all directors.<br />
The committee’s terms of reference<br />
have been reviewed and updated<br />
during the year. All amendments<br />
were approved by the board.<br />
The full terms of reference<br />
can be found on our website at<br />
www.woolworthsholdings.co.za.<br />
The board has implemented<br />
a systematic and disciplined<br />
approach to evaluate<br />
the effectiveness of risk<br />
management. As part of the approved<br />
internal audit plan for the 2011 financial<br />
year, the risk management function will<br />
be independently assessed for its<br />
integrity and robustness, the results<br />
of which will be used to improve the<br />
risk management process.<br />
The risk committee is satisfied that it has<br />
carried out its responsibilities for the<br />
year in compliance with its mandate<br />
and the terms of reference.<br />
risk management<br />
The board accepts its responsibility<br />
for the governance of risk. The board<br />
regards risk management as a key<br />
business discipline which:<br />
• balances risk and reward within<br />
both existing and new initiatives;<br />
• protects the group against<br />
uncertainties and hazards, which<br />
could prevent the achievement of<br />
business objectives;<br />
• considers the exploitation of<br />
opportunities that can improve the<br />
performance of the group; and<br />
• focuses on strategic, financial and<br />
operational risks.<br />
The day-to-day responsibility for<br />
identifying and managing risk resides<br />
with management. Management is<br />
accountable to the board for designing,<br />
implementing and monitoring the<br />
46
system and process of risk management<br />
and to integrate it into the day-to-day<br />
activities. Risk management is<br />
decentralised into the business<br />
operations functions. Risk management<br />
has become a standard business<br />
discipline and is applied consistently<br />
throughout the group. The risk<br />
management process is integrated<br />
with the strategic and business<br />
planning process and is embedded<br />
through our management <strong>report</strong>ing<br />
and performance management system.<br />
Operating under a written<br />
terms of reference that is<br />
approved by the board,<br />
the risk committee <strong>report</strong>s<br />
to the board and evaluates any risk<br />
which it deems necessary for discussion<br />
and evaluation by all directors. The<br />
Chairman of the risk committee <strong>report</strong>s<br />
progress on the key risk issues to the<br />
board and the risk profile is tabled<br />
annually at the board meeting.<br />
The risk management framework and<br />
process is designed to assist the board<br />
to ensure that management monitors<br />
risks continually and <strong>report</strong>s back to the<br />
risk committee on the status of risks. The<br />
framework includes:<br />
• an annual review of the group’s risk<br />
management policy;<br />
• a review of the effectiveness and<br />
maturity of the risk management<br />
process;<br />
• an annual review of the group’s<br />
key risk profile, which details the<br />
material residual risks for the group;<br />
• a prioritisation of the key risks<br />
based on their impact to the group<br />
and likelihood of occurrence;<br />
• a continuous review of and update<br />
of the key risk profile by the<br />
executive directors;<br />
• identifying emerging risks on<br />
a regular basis;<br />
• performing ad hoc risk profiles on<br />
material emerging risks;<br />
• quarterly <strong>report</strong>ing on the status of<br />
the key risks and the management<br />
thereof based on key risk and<br />
performance indicators, to the risk<br />
committee;<br />
• the monitoring of ongoing risk<br />
exposure by reviewing objective<br />
metrics, performing control selfassessments<br />
and reviewing the<br />
<strong>report</strong>s of independent assurance<br />
providers;<br />
• regular six monthly reviews of the<br />
risk register at business unit level;<br />
• quarterly <strong>report</strong>ing on progress on<br />
the management and compliance<br />
with operational risks; and<br />
• a review of the adequacy of the<br />
group’s insurance programme.<br />
For certain special risk areas,<br />
management forums have been<br />
established to ensure that the risks<br />
in these areas are reviewed and<br />
considered by management with the<br />
required specialist skills and experience.<br />
These management forums include<br />
the treasury committee, tax committee<br />
and real estate committee. A board<br />
committee has been established to<br />
specifically monitor the management of<br />
sustainability risks. Where appropriate,<br />
feedback from these committees<br />
is incorporated into the quarterly<br />
<strong>report</strong>ing to the risk committee.<br />
Given the high level of<br />
dependence of the business<br />
on its systems, information<br />
technology (IT) governance<br />
is an ongoing focus area. A dedicated<br />
IT governance team is responsible for<br />
managing the governance aspects<br />
of IT, including compliance, continuity<br />
management and risk. A quarterly<br />
IT governance <strong>report</strong> is tabled and<br />
discussed at each risk committee<br />
meeting. Our yearly assessment of the<br />
IT governance processes benchmark to<br />
COBIT (Control Objectives for Information<br />
and related Technologies), the<br />
internationally accepted best practice<br />
governance framework, confirmed<br />
that the maturity of our IT processes is<br />
in line with our desired maturity levels.<br />
Independent assurance by internal audit<br />
has confirmed our current level is 3.2.<br />
Insurance is a key element of the<br />
risk management process. It is<br />
designed to protect us financially<br />
against the negative consequences<br />
of risk. There is a comprehensive asset<br />
and liability insurance programme<br />
in place. This programme includes<br />
appropriate levels of self-insurance.<br />
Our external insurance cover is<br />
provided by A-rated South African and<br />
international insurance companies. The<br />
completeness of our insurance cover as<br />
well as our policy wording is reviewed<br />
regularly and benchmarked by external<br />
experts to ensure that it takes into<br />
account new requirements and<br />
external developments.<br />
The business has implemented a<br />
materiality level against which risks are<br />
monitored and escalated. The materiality<br />
level is defined taking into account the<br />
impact that the risk may have on the<br />
sustainability of the business. The board<br />
is satisfied that this materiality level<br />
ensures that risks are appropriately<br />
<strong>report</strong>ed against. A process will be<br />
undertaken in 2011 to more clearly<br />
articulate and define the risk appetite and<br />
tolerance. We will be in a position to show<br />
evidence of this in the next risk <strong>report</strong>.<br />
The committee is of the opinion that the<br />
risk process is effective in continuously<br />
identifying and evaluating risks and<br />
ensuring that these risks are managed<br />
in line with business strategy.<br />
47
CORPORATE GOVERNANCE<br />
RISK COMMITTEE AND RISK REPORT CONTINUED<br />
our key risks<br />
As retail trading conditions have changed and new priorities become more pronounced, we have seen some changes to the key<br />
business risks. The management of our natural resources of water and energy have received greater attention. The risk management<br />
process is designed to anticipate, identify, manage and mitigate those risks to ensure both the short-term and long-term economic,<br />
environmental and social sustainability of the group.<br />
The key risks of the group, together with the mitigation strategies, are set out below:<br />
External environment<br />
Even though the retail trading environment in South Africa has stabilised, it remains challenging. Macroeconomic factors such as GDP<br />
growth, employment levels and interest rates affect customer demand. Our priority remains to manage the business in light of these<br />
changing conditions and remain focused on delivering or exceeding the expectations of our stakeholders.<br />
Execution of our strategy.<br />
• Strategy communicated throughout the business.<br />
• Individual KPIs linked to overall strategy.<br />
• Regular monitoring on a quarterly basis.<br />
Delivery of business long-term targets.<br />
• Targets linked to strategy communication.<br />
• Scorecards manage achievements.<br />
Product offering<br />
We are a retailer of clothing, general merchandise and food products. Our customers expect the right product in the right place<br />
and at the right time.<br />
Clothing and general merchandise<br />
Ensure the correct product offering for our customers<br />
that provides value for money.<br />
Food<br />
Ensure our quality food offering meets the needs of<br />
our customers.<br />
Ensure consistent availability of our food offering meets the<br />
expectations of our customers.<br />
• Customer lifestyle segmentation model.<br />
• Clarity of the in-house brands.<br />
• Improved store cataloguing catering for demographics and<br />
customer profile.<br />
• Pipeline of innovation.<br />
• Clear price architecture in good, better and best.<br />
• Continuous feedback from customer focus groups.<br />
• Ongoing investment in promotional strategies to improve value<br />
perception with no compromise on quality.<br />
• Improved store and range cataloguing.<br />
• Pipeline of innovation.<br />
• Continuous feedback from customer focus groups.<br />
• Focus on key top selling lines.<br />
• End-to-end processes and disciplines to improve availability.<br />
48
People<br />
As we continue to build our business for the future, and deliver to our strategies, we must ensure that we have the right skills and<br />
experience at every level.<br />
Attract, develop and retain our people.<br />
• Remuneration policies are reviewed and updated to ensure that<br />
they are relevant for current economic conditions.<br />
• A number of learning academies in place to support business<br />
unit strategies.<br />
• Conduct regular employee surveys.<br />
Transformation<br />
Supporting transformation through the BEE regulations ensuring<br />
that we are a modern South African retailer.<br />
• Transformation strategy and plans in place to achieve<br />
2012 targets.<br />
• Focus on employment equity targets.<br />
• BBBEE share ownership scheme.<br />
Financial<br />
Our financial risk is managed against our treasury policy that is approved by the board.<br />
Manage financial risks of funding (liquidity and counterparty<br />
risks), interest rate risk and foreign exchange risk.<br />
Management of foreign currency exposure.<br />
• Treasury committee meets on a regular basis to manage risks<br />
in line with the treasury policy.<br />
• All foreign currency exposures arising from the acquisition of<br />
foods and services are covered with forward exchange<br />
contracts. Foreign currency exposure arises mainly from the<br />
imports of clothing and general merchandise.<br />
Responsible use of our natural resources<br />
As a retailer, we operate in a world where natural resources are becoming increasingly scarce and where their effective use is the<br />
responsibility of all.<br />
Electricity usage.<br />
Water consumption.<br />
• Investigate and implement more efficient refrigeration and<br />
air conditioning technology.<br />
• Launch Power Saving Campaign that is aimed at saving<br />
electricity in stores with roll-out to suppliers.<br />
• Green store strategy.<br />
• Investigating clean energy options appropriate to our business.<br />
• Targets and plans set to achieve 30% relative reduction for<br />
water usage.<br />
• Off-setting all water directly used in operations through WWF’s<br />
water neutrality programme.<br />
• Farming for the future programme is working with suppliers<br />
to ensure that they are water efficient and manage waste<br />
water properly.<br />
49
CORPORATE GOVERNANCE<br />
RISK COMMITTEE AND RISK REPORT CONTINUED<br />
Operational risks<br />
Our customers expect our food products to be safe and<br />
of a high quality.<br />
Business continuity management.<br />
Health and safety of our employees and our customers.<br />
Compliance to relevant legislation.<br />
Manage stock losses at an acceptable level.<br />
• Food technology team activity involved in product development<br />
to ensure compliance with food quality standards.<br />
• Recall process to remove and, where required, destroy product<br />
from our stores and distribution centres.<br />
• Public recall of products process defined.<br />
• Plans focus on unavailability of food distribution centre, large<br />
regional store, the unavailability of key information systems and<br />
power outages.<br />
• Reviewing the business continuity strategy and plans for<br />
head office.<br />
• Implementation of generators and uninterrupted power supply<br />
capacity to reduce the impact of power outages on our stores,<br />
distribution centres and head office.<br />
• Disaster recovery for our key information systems is reviewed,<br />
updated and tested on an annual basis. Assurance provided<br />
by internal audit.<br />
• Comprehensive health and safety framework setting out the<br />
required policies and standards for suppliers, distribution<br />
centres and stores.<br />
• Occupational health practitioners manage a comprehensive<br />
health and wellness programme.<br />
• HIV/Aids awareness and treatment programme offered to<br />
our employees.<br />
• Implementation and embedding of an appropriate, best<br />
practice, risk-based compliance framework.<br />
• Projects undertaken to ensure implementation of new legislation,<br />
e.g. CPA, RICA, Companies Act.<br />
• Monitoring of compliance to regulatory requirements.<br />
• Focused effort and deliberate interventions to manage in store<br />
shrinkage and stock losses at the distribution centres.<br />
• Deflection measures in place to limit losses due to armed<br />
robberies and burglaries.<br />
• Rewards based independent and confidential fraud<br />
tip-off service.<br />
50
CORPORATE GOVERNANCE<br />
audit COMMITTEE<br />
The board is satisfied that the combined<br />
skills and experience of the audit<br />
committee members are appropriate in<br />
order to fulfil its obligations.<br />
audit committee<br />
attendance at the audit committee meetings<br />
Member Aug 2009 Nov 2009 Feb <strong>2010</strong> May <strong>2010</strong><br />
Mike Leeming 1, 2 √ √ √ √<br />
Lindiwe Bakoro 2, 3 – √ √ √<br />
Nigel Colne 2 √ √ √ √<br />
Sindi Zilwa 2 √ √ √ √<br />
For qualifications and experience please refer to pages 12 and 13.<br />
Notes:<br />
1<br />
= Chairman<br />
2<br />
= Independent non-executive director<br />
3<br />
= Appointed<br />
Lindiwe Bakoro was appointed to the<br />
committee from November 2009.<br />
The main purpose of the audit<br />
committee is to ensure the<br />
integrity of the financial<br />
statements and oversee the<br />
effectiveness of the internal financial<br />
controls and the external and internal<br />
audit functions.<br />
The audit committee consists of four<br />
independent non-executive directors,<br />
including Mike Leeming who chairs<br />
the committee. Lindiwe Bakoro was<br />
appointed to the committee from the<br />
November 2009 meeting. The board is<br />
satisfied that the combined skills and<br />
experience of the audit committee<br />
members are appropriate in order to<br />
fulfil its obligations.<br />
The audit committee is an integral part<br />
of the risk management process with a<br />
specific responsibility for the oversight<br />
of financial <strong>report</strong>ing risks, internal<br />
financial controls and fraud and<br />
information technology risks as<br />
they relate to financial <strong>report</strong>ing.<br />
Currently, all the members of the audit<br />
committee are also members of the<br />
risk committee. The Chairman of<br />
the audit committee is also the<br />
Chairman of the risk committee.<br />
The committee met four times during<br />
the year and the committee Chairman<br />
<strong>report</strong>ed back to the board on the<br />
activities of the committee. The<br />
minutes of the committee meetings<br />
are circulated to all directors.<br />
The audit committee has adopted<br />
a formal terms of reference that has<br />
been approved by the board. The<br />
format and role of the audit committee<br />
meetings have been determined<br />
taking into account the statutory<br />
responsibilities in terms of the<br />
Companies Act 1973 together with the<br />
Corporate Laws Amendment Act and<br />
the duties assigned to it by the board.<br />
The committee’s terms of reference have<br />
been reviewed and updated during the<br />
year. All amendments were approved<br />
by the board. The full terms of reference<br />
can be found on our website at<br />
www.woolworthsholdings.co.za.<br />
To ensure that the committee<br />
can effectively comply with its<br />
terms of reference, the Group<br />
finance director, the external<br />
auditors and the executives responsible<br />
for internal audit and risk attend<br />
the meetings by invitation. The audit<br />
committee held separate meetings<br />
with management, external audit, risk<br />
management and internal audit to<br />
ensure that all relevant matters have<br />
been identified and discussed without<br />
undue influence. The Chairman of<br />
the audit committee also attends<br />
the annual general meeting in<br />
order to answer any questions of<br />
a financial nature.<br />
51
CORPORATE GOVERNANCE<br />
audit COMMITTEE CONTINUED<br />
The annual audit coverage plan is<br />
developed by applying a risk-based<br />
approach.<br />
The audit committee has performed<br />
the functions of the audit committee<br />
for its subsidiaries, except for Country<br />
Road <strong>Limited</strong>.<br />
internal control<br />
The board is accountable for the<br />
group’s system of internal control and<br />
has delegated this responsibility to<br />
management. The system of internal<br />
control is designed to ensure that the<br />
significant risks are being appropriately<br />
managed and provide reasonable<br />
assurance that:<br />
• business objectives will be achieved<br />
in normal and adverse trading<br />
conditions;<br />
• operations are efficient and<br />
effective;<br />
• management and financial<br />
information is reliable;<br />
• company assets and information<br />
are appropriately safeguarded; and<br />
• there is compliance with applicable<br />
laws and regulations.<br />
Management is focused on<br />
continuous improvements<br />
to the system of internal<br />
control. The newly<br />
implemented financial system has been<br />
bedded down during the course of the<br />
financial year and has further enhanced<br />
the end-to-end financial controls and<br />
processes within the group.<br />
independent assurance<br />
providers<br />
A key element of the system of internal<br />
control is the review conducted by<br />
independent assurance providers who<br />
assess the adequacy and effectiveness<br />
of the controls. These independent<br />
assurance providers are outlined in<br />
more detail below.<br />
internal audit<br />
The internal audit function provides<br />
independent assurance on the<br />
adequacy and effectiveness of the<br />
system of internal controls in place<br />
to manage the significant risks of the<br />
business down to an acceptable level.<br />
Internal audit also engages proactively<br />
with management to drive meaningful<br />
and sustainable improvements in the<br />
control environment. This is achieved<br />
by using specialist risk and control<br />
knowledge to provide practical<br />
recommendations to improve the<br />
design of and compliance with key<br />
controls. Where necessary, for<br />
example highly specialised IT reviews,<br />
these reviews are outsourced to<br />
specialist consultants.<br />
Internal audit is a highly valuable and<br />
effective monitoring activity. During<br />
the year internal audit improved its<br />
effectiveness by:<br />
• rigorous adherence to a risk-based<br />
audit methodology to ensure that<br />
the audit effort was focused in the<br />
correct areas;<br />
• ongoing mentoring and coaching<br />
of the internal audit team to ensure<br />
that they have the skills to provide<br />
the required level of assurance as<br />
well as contributing to business<br />
improvement; and<br />
• leveraging the use of technology to<br />
drive audit efficiencies.<br />
The annual audit coverage plan is<br />
developed by applying a risk-based<br />
approach and is reviewed and<br />
approved by the audit committee in<br />
May each year. It is revised quarterly<br />
to ensure that it remains relevant to the<br />
key business priorities and changing<br />
risk environment.<br />
Key audit findings are <strong>report</strong>ed to the<br />
audit committee quarterly in the red<br />
flag <strong>report</strong>. Progress in addressing<br />
these red flag items is audited<br />
quarterly and items are <strong>report</strong>ed to<br />
the committee until they have been<br />
satisfactorily resolved. This enables the<br />
committee to ensure that prompt action<br />
has been taken to address the key<br />
areas of concern.<br />
Internal audit retains its objectivity<br />
and independence by <strong>report</strong>ing<br />
52
CORPORATE GOVERNANCE<br />
functionally to the audit committee<br />
and administratively to the Head of<br />
corporate governance. The internal<br />
audit executive attends both the audit<br />
committee and risk committee meetings<br />
by invitation.<br />
The internal audit team has<br />
a combination of skills and expertise<br />
which include operational, financial,<br />
accounting and information technology<br />
experience and knowledge.<br />
external audit<br />
Ernst & Young Inc. and SAB&T Inc.,<br />
the joint external auditors, provide<br />
stakeholders with an independent<br />
opinion on whether the annual financial<br />
statements fairly present, in all material<br />
respects, the financial position of the<br />
company and the group.<br />
External audit regularly<br />
liaises with internal audit to<br />
understand the scope of their<br />
work and the results of their<br />
audits. External audit has embarked<br />
on a programme to move to a more<br />
control-based audit approach, thus<br />
reducing their substantive testing.<br />
Internal audit performs the initial<br />
control-based testing and once it<br />
has been successfully bedded down,<br />
testing will alternate between internal<br />
and external audit on an annual basis.<br />
Any control work performed by external<br />
audit is limited to the work necessary<br />
to support their audit opinion.<br />
other independent assurance<br />
providers<br />
Specialist assurance providers have<br />
been used to assess the adequacy<br />
and effectiveness of controls in certain<br />
instances. These include audits on<br />
clothing and general merchandise<br />
product quality, food safety and safety<br />
and hygiene in our stores.<br />
external auditor independence<br />
policy<br />
External audit is a key component of<br />
the independent assurance framework<br />
and it is the responsibility of the audit<br />
committee to ensure that external<br />
audit is independent and objective.<br />
To govern this, the board has adopted<br />
an external auditor independence<br />
policy. This policy defines the prohibited<br />
and allowable non-audit services which<br />
the external auditors can perform and<br />
restricts the value of allowable nonaudit<br />
services to 20% of the annual<br />
external audit fee. This policy complies<br />
with the minimum requirements as set<br />
out in the Corporate Laws Amendment<br />
Act, 24 of 2006, the Auditing Profession<br />
Act, 26 of 2005 and the requirements<br />
of the Code of Professional Conduct<br />
of the Independent Regulatory Board<br />
for Auditors, and in a number of cases<br />
is more restrictive. The policy was<br />
reviewed during the year and changes<br />
were approved by the committee.<br />
The external auditors are also required<br />
to provide the committee with evidence<br />
of their independence.<br />
In the <strong>2010</strong> financial year, the external<br />
auditors provided taxation and other<br />
allowable services to the value of 13%.<br />
All amounts were pre-approved by the<br />
audit committee.<br />
control opinion<br />
The output of the risk management<br />
process, in conjunction with the work of<br />
the independent assurance providers,<br />
indicates to the directors that the<br />
controls, including financial controls,<br />
in place are adequate and effective.<br />
Furthermore, no material losses,<br />
exposures or financial misstatements<br />
have been <strong>report</strong>ed to the directors<br />
for the financial year.<br />
This opinion recognises that the<br />
business is dynamic and that<br />
at any point in time there are<br />
new areas of risk exposure<br />
which may require management<br />
attention. As such, there is a continual<br />
focus on ensuring that the control<br />
environment within each business area<br />
is understood and maintained at the<br />
required level.<br />
The audit committee is satisfied that it<br />
has carried out its responsibilities for<br />
the year in compliance with its terms<br />
of reference.<br />
Report of the audit<br />
committee of the group<br />
Terms of reference<br />
The audit committee has adopted<br />
a formal terms of reference that<br />
has been approved by the board.<br />
The terms of reference have been<br />
determined taking into account the<br />
statutory responsibilities in terms of<br />
the Companies Act 1973 together with<br />
the Corporate Laws Amendment Act 24<br />
of 2006 and the duties assigned to it by<br />
the board.<br />
The committee’s terms of reference are<br />
reviewed annually and have been<br />
reviewed and updated during the year.<br />
All amendments were approved by<br />
53
CORPORATE GOVERNANCE<br />
audit COMMITTEE CONTINUED<br />
the board. The full terms of reference<br />
can be found on our website at<br />
www.woolworthsholdings.co.za.<br />
Members<br />
The audit committee consists of four<br />
independent non-executive directors:<br />
Mike Leeming (Chairman)<br />
Lindiwe Bakoro<br />
Nigel Colne<br />
Sindi Zilwa<br />
external audit<br />
external auditor appointment<br />
and independence<br />
Ernst & Young Inc. and SAB&T Inc.<br />
served as <strong>Woolworths</strong> designated joint<br />
auditors for the <strong>2010</strong> financial year.<br />
The audit committee has satisfied<br />
itself that the joint auditors are<br />
independent of <strong>Woolworths</strong>,<br />
which included consideration<br />
of previous appointments of the<br />
designated auditors, the extent of other<br />
work undertaken by the joint auditors<br />
for <strong>Woolworths</strong> and compliance with<br />
criteria relating to independence or<br />
conflicts of interest as prescribed by<br />
the Independent Regulatory Board<br />
for Auditors. The auditors provided<br />
evidence to the committee of their<br />
independence.<br />
The audit committee approved the<br />
terms of engagement and the fees paid<br />
to the joint auditors. Fees paid to the<br />
joint auditors can be found in note 3 to<br />
the group annual financial statements<br />
on page 98.<br />
The audit committee ensured that the<br />
nature and extent of non-audit services<br />
provided by the external auditors<br />
were in terms of the external auditor<br />
independence policy.<br />
The audit committee has<br />
recommended, the reappointment<br />
of Ernst & Young<br />
Inc. and SAB&T Inc. as auditors of<br />
the company and its subsidiaries for the<br />
2011 financial year. The audit committee<br />
has confirmed that the auditors are<br />
accredited with the JSE <strong>Limited</strong>.<br />
complaint procedure<br />
The audit committee receives and deals<br />
with any complaints, whether from<br />
within or outside <strong>Woolworths</strong>, relating<br />
to the accounting practices and<br />
internal audit of the group, the content<br />
or auditing of <strong>Woolworths</strong> financial<br />
statements, the internal financial control<br />
of the group and any other related<br />
matters. No complaints were received<br />
during the year.<br />
Additional duties assigned<br />
by the board<br />
In addition to the statutory duties of the<br />
audit committee the board of directors<br />
has assigned further functions for the<br />
audit committee to perform.<br />
financial statements and<br />
accounting practices<br />
The audit committee has reviewed the<br />
accounting policies and the financial<br />
statements of the company and is<br />
satisfied that they are appropriate<br />
and comply with IFRS. The committee<br />
recommended the <strong>2010</strong> interim and<br />
annual <strong>report</strong>s for approval by<br />
the board of directors.<br />
going concern<br />
The audit committee has reviewed<br />
the working capital pack and the key<br />
assumptions prepared by management<br />
and have made recommendations<br />
to the board in respect of the going<br />
concern status of <strong>Woolworths</strong>.<br />
internal audit<br />
The audit committee is responsible for<br />
ensuring that the <strong>Woolworths</strong> internal<br />
audit function is independent and has<br />
the necessary resources and authority<br />
to enable it to discharge its duties. The<br />
audit committee oversees co-operation<br />
between the internal and external<br />
auditors and serves as a link between<br />
the board and these functions.<br />
expertise and experience of the<br />
group finance director and the<br />
finance function<br />
In terms of the JSE <strong>Limited</strong> Listings<br />
Requirements, the audit committee is<br />
satisfied that the Group finance director<br />
has the appropriate experience and<br />
expertise to meet the responsibilities<br />
of the position.<br />
The audit committee has considered,<br />
and is satisfied that the finance<br />
department has the appropriate<br />
expertise and is adequately resourced.<br />
54
nominations committee<br />
nominations committee<br />
attendance at the nominations committee meetings<br />
Member Aug 2009 Nov 2009 Feb <strong>2010</strong> May <strong>2010</strong><br />
Buddy Hawton 1, 2 √ √ √ √<br />
Nigel Colne 2 √ √ √ √<br />
Brian Frost 2 √ √ √ √<br />
Mike Leeming 2, 3 – √ √ √<br />
Chris Nissen 2 √ √ √ √<br />
Notes:<br />
1<br />
= Chairman<br />
2<br />
= Independent non-executive director<br />
3<br />
= Appointed<br />
Mike Leeming was appointed to the<br />
committee from November 2009.<br />
The main purpose of the<br />
nominations committee is to<br />
assist the board in ensuring that<br />
appointments of directors and<br />
board committees are made in terms of<br />
formal and transparent procedures and<br />
to ensure that sufficient consideration is<br />
given to the succession of the Chairman,<br />
non-executive directors, Group chief<br />
executive officer and senior executives.<br />
The nominations committee consists<br />
of five independent non-executive<br />
directors, including the Chairman of the<br />
board who chairs the committee. Mike<br />
Leeming was appointed to the committee<br />
from the November 2009 meeting. The<br />
Group chief executive officer attends the<br />
meetings by invitation.<br />
The committee’s terms of reference have<br />
been reviewed and updated during<br />
the year. All amendments were<br />
approved by the board. The full terms of<br />
reference can be found on our website<br />
at www.woolworthsholdings.co.za.<br />
The committee met four times during<br />
the year and the committee Chairman<br />
<strong>report</strong>ed back to the board on<br />
the activities of the committee. The<br />
minutes of the committee meetings are<br />
circulated to all directors.<br />
During the year the committee<br />
continued to evaluate the balance of<br />
skills, knowledge and experience of<br />
the board. Brian Frost and Nigel Colne,<br />
have indicated that they will be retiring<br />
in November <strong>2010</strong>. The nominations<br />
committee, has with the assistance<br />
of the Group secretary, identified<br />
candidates for consideration by the<br />
committee. The committee has made<br />
use of external consultants in order<br />
to identify suitable candidates. The<br />
nominations committee recommended<br />
the appointment of Tom Boardman<br />
to the board.<br />
The Chairman, in conjunction with<br />
the nominations committee, assessed<br />
the performance of the Group chief<br />
executive officer. The Chairman and the<br />
Group chief executive officer, together<br />
with the nominations committee,<br />
assessed the performance of the<br />
other executive directors. Currently<br />
the performance of the Chairman is<br />
reviewed annually by the board.<br />
One-third of the non-executive directors<br />
will retire by rotation at the forthcoming<br />
annual general meeting.<br />
Chris Nissen, Sindi Zilwa and Norman<br />
Thomson are due to retire by rotation<br />
at the next annual general meeting<br />
and, being eligible, offer themselves for<br />
re‐election.<br />
The Chairman confirms that each<br />
of the directors offering themselves<br />
for re‐election continue to perform<br />
effectively and to demonstrate<br />
commitment to their role. The Chairman<br />
is satisfied that the non-executive<br />
directors nominated for re-appointment<br />
are independent.<br />
Ian Moir and Tom Boardman are<br />
required to retire at the annual general<br />
meeting following their appointment<br />
between annual general meetings.<br />
On his retirement in November<br />
as Group chief executive<br />
officer, Simon Susman<br />
will remain on the board<br />
in the capacity of a non-executive<br />
director and assume the role of<br />
Deputy Chairman.<br />
The nominations committee is satisfied<br />
that it has carried out its responsibilities<br />
for the year in compliance with its<br />
terms of reference.<br />
55
CORPORATE GOVERNANCE<br />
TRANSFORMATION committee<br />
transformation committee<br />
attendance at the transformation committee meetings<br />
Member Aug 2009 Nov 2009 Feb <strong>2010</strong> May <strong>2010</strong><br />
Chris Nissen 1, 4 √ √ √ √<br />
Brian Frost 4, 7 √ – – –<br />
Buddy Hawton 2, 4 √ √ √ √<br />
Thina Siwendu 4, 6 – √ √ √<br />
Simon Susman 3, 5 √ √ √ √<br />
Sindi Zilwa 4 √ √ √ √<br />
Notes:<br />
1<br />
= Chairman<br />
2<br />
= Chairman of board<br />
3<br />
= Group chief executive officer<br />
4<br />
= Independent non-executive director<br />
5<br />
= Executive director<br />
6<br />
= Appointed<br />
Thina Siwendu was appointed to the<br />
committee from November 2009.<br />
7<br />
= Resigned<br />
brian Frost resigned as a member from the<br />
committee after the August 2009 meeting.<br />
The main purpose of the<br />
transformation committee is<br />
to assist the board in ensuring<br />
there are appropriate strategies,<br />
policies and processes in place in order<br />
to drive transformation.<br />
The committee consists of four<br />
independent non-executive directors<br />
including the Chairman, Chris Nissen<br />
and one executive director, the Group<br />
chief executive officer. Thina Siwendu<br />
was appointed to the committee from<br />
the November 2009 meeting and Brian<br />
Frost resigned from the committee at the<br />
same meeting. The executive director<br />
responsible for transformation attends<br />
by invitation.<br />
The committee’s terms of reference have<br />
been reviewed and updated during the<br />
year. All amendments were approved<br />
by the board. The full terms of reference<br />
can be found on our website at<br />
www.woolworthsholdings.co.za.<br />
The committee met four times during<br />
the year and the committee Chairman<br />
<strong>report</strong>ed back to the board on<br />
the activities of the committee. The<br />
minutes of the committee meetings are<br />
circulated to all directors.<br />
The group is committed to the spirit<br />
and principles of broad-based black<br />
economic empowerment (BBBEE).<br />
There are clear targets for each<br />
business area that are reviewed by<br />
management on a bi-annual basis.<br />
An assessment of progress is made<br />
and where appropriate new strategies<br />
and plans are developed to enable<br />
the achievement of their targets. The<br />
committee reviewed the transformation<br />
plans of each of the business areas,<br />
with particular attention given to<br />
preferential procurement, enterprise<br />
development and employment equity.<br />
BEE Verification Agency CC was<br />
appointed as the company’s<br />
verification agency for the <strong>2010</strong><br />
financial year. Through the<br />
external assurance received from the<br />
agency, we have achieved a 60.7 score,<br />
a level 5 contributor. In June 2009 we<br />
were classified as a level 6 contributor.<br />
Further details on the BEE score can<br />
be found in the <strong>2010</strong> Good<br />
business journey <strong>report</strong> that<br />
can be found on our website at<br />
www.woolworthsholdings.co.za.<br />
The transformation committee<br />
is satisfied that it has carried out<br />
its responsibilities for the year<br />
in compliance with the terms<br />
of reference.<br />
56
ee employee share ownership scheme<br />
bee employee share ownership scheme<br />
attendance at the bee employee share ownership trustee meetings<br />
Trustee Sep 2009 March <strong>2010</strong><br />
Dolly Mokgatle 1, 2 √ √<br />
Cherrie Lowe 3 √ √<br />
Cecilia Maphalla 4 √ √<br />
Zukile Nomafu 5 √ √<br />
Wahida Parker 2 √ √<br />
Notes:<br />
1<br />
= Chairman<br />
2<br />
= Employee elected independent<br />
3<br />
= Employer elected non-independent<br />
4<br />
= Employee elected non-independent<br />
5<br />
= Employer elected independent<br />
A share ownership trust was established<br />
in May 2007 in order to manage the BEE<br />
employee share ownership scheme.<br />
The purpose of the BEE scheme was<br />
to empower eligible <strong>Woolworths</strong><br />
employees by enabling them to acquire<br />
a shareholding equal to approximately<br />
10% of the ordinary issued share capital<br />
of the company. The scheme will<br />
operate for an eight year period and<br />
terminates on 30 June 2015.<br />
The Trust is administered by five<br />
trustees who manage the<br />
scheme in terms of the Trust<br />
deed. There are three trustees<br />
who are independent of the company,<br />
including the Chairman Dolly Mokgatle.<br />
Two trustees are elected by the company.<br />
The trustees meet twice a year and the<br />
minutes of their meetings are circulated<br />
to the Transformation committee.<br />
The trust owns 88 267 306 unlisted<br />
preference shares in <strong>Woolworths</strong>.<br />
This equates to 9% of the issued share<br />
capital at the end of June. Shares were<br />
allocated to employees based on three<br />
categories with the majority being<br />
allocated to staff working in our stores.<br />
At the end of June, there were 8 706<br />
employees participating in the scheme<br />
compared with the 9 756 at June 2009.<br />
During the year the trustees held<br />
their first Imbizo for beneficiaries.<br />
This provided the beneficiaries an<br />
opportunity to interact with the trustees.<br />
It was well attended and the feedback<br />
from the beneficiaries was very positive.<br />
It is the intention of the trustees to hold<br />
the Imbizo annually.<br />
CONDITIONS OF THE SCHEME<br />
Employees in the scheme earn a<br />
dividend based on an increasing<br />
percentage of any dividends or<br />
ordinary distributions made to ordinary<br />
shareholders of the company. The<br />
scheme did not require employees to<br />
fund the acquisition of the shares that<br />
were allocated to them and therefore<br />
they have seen real value in being a<br />
participant of the scheme. In <strong>2010</strong>, our<br />
employees have earned R15.7m by way<br />
of dividends, a 61% increase on the<br />
previous year and to date, have earned<br />
dividends of R37.3m.<br />
Year of<br />
scheme<br />
Financial<br />
year of the<br />
company<br />
% of<br />
ordinary<br />
dividend<br />
earned<br />
1 2008 11%<br />
2 2009 16%<br />
3 <strong>2010</strong> 23%<br />
4 2011 33%<br />
5 2012 48%<br />
6 2013 69%<br />
7 2014 100%<br />
8 2015 100%<br />
Vesting of shares is subject to an<br />
employee remaining as such for the<br />
period of the scheme. Vesting takes<br />
place on a sliding scale, based on<br />
completed years of service within the<br />
scheme.<br />
At the end of June <strong>2010</strong>, no<br />
vesting has taken place.<br />
However, from July <strong>2010</strong><br />
onwards, employees who<br />
leave the company will retain a<br />
percentage of their initial allocation<br />
and may qualify for an allocation<br />
of ordinary shares at the end of the<br />
scheme in June 2015.<br />
At the termination date of the scheme,<br />
the vested preference shares retained<br />
by employees are convertible into<br />
ordinary shares of the company<br />
provided that the growth in the share<br />
price of the company exceeds a<br />
predetermined hurdle rate. The nature<br />
of the scheme is such that employees in<br />
the scheme face an inherent share price<br />
risk. To reduce this risk, all employees<br />
who are broad-based beneficiaries<br />
on the termination date of the scheme<br />
will receive a minimum amount of<br />
R20 000, regardless of what the target<br />
share price is.<br />
57
CORPORATE GOVERNANCE<br />
sustainability committee<br />
sustainability committee<br />
attendance at the sustainability committee meetings<br />
Member Aug 2009 Nov 2009 Feb <strong>2010</strong> May <strong>2010</strong><br />
Brian Frost 1, 2 √ √ √ √<br />
Simon Susman 3, 4 √ √ √ A<br />
Chris Nissen 2 √ √ A √<br />
Zyda Rylands 4 √ √ √ √<br />
Notes:<br />
1<br />
= Chairman<br />
2<br />
= Independent non-executive director<br />
3<br />
= Group chief executive officer<br />
4<br />
= Executive director<br />
A = Absent with apologies tendered<br />
The main purpose of the<br />
sustainability committee is to<br />
assist the board in ensuring that<br />
the group has an appropriate<br />
programme in place to ensure the<br />
environmental impact of the company<br />
is managed in a responsible way.<br />
The committee consists of two<br />
independent non-executive directors<br />
including the Chairman, Brian Frost and<br />
two executive directors.<br />
The committee’s terms of reference have<br />
been reviewed and updated during the<br />
year. All amendments were approved<br />
by the board. The full terms of reference<br />
can be found on our website at<br />
www.woolworthsholdings.co.za.<br />
The committee met four times during<br />
the year and the committee Chairman<br />
<strong>report</strong>ed back to the board on<br />
the activities of the committee. The<br />
minutes of the committee meetings are<br />
circulated to all directors.<br />
The Chairman of the committee is also<br />
the chairman of the <strong>Woolworths</strong> Trust.<br />
The <strong>Woolworths</strong> Trust manages the<br />
social development aspects of our<br />
Good business journey. The chairman<br />
of the transformation committee is also<br />
a member of the sustainability<br />
committee to ensure alignment across<br />
the broader sustainability spectrum.<br />
During the year the committee reviewed:<br />
• updates on the good business<br />
barometer measurement tool that<br />
<strong>report</strong>s the achievements and nonachievements<br />
of the sustainability<br />
targets;<br />
• the risk profile of the Good business<br />
journey programme and noted<br />
that new risks relating to the use<br />
of electricity and water had been<br />
escalated; and<br />
• the ethics policy and the plan to<br />
implement it into the business.<br />
An assurance framework is<br />
in place and an internal audit<br />
coverage plan has been<br />
completed for the programme<br />
where external verification is not<br />
available. External verification was<br />
done on our carbon footprint and<br />
BEE status.<br />
The G3 guidelines of the Global<br />
Reporting Initiative have been applied<br />
in the detailed <strong>report</strong>.<br />
The sustainability committee is satisfied<br />
that it has performed its duties in<br />
accordance with its terms of reference.<br />
A detailed <strong>report</strong> of the Good<br />
business journey programme can<br />
be found in the <strong>2010</strong> Good business<br />
journey <strong>report</strong> on our website at<br />
www.woolworthsholdings.co.za.<br />
58
emuneration committee and remuneration <strong>report</strong><br />
remuneration committee and remuneration <strong>report</strong><br />
attendance at the remuneration committee meetings<br />
Member Aug 2009 Nov 2009 Feb <strong>2010</strong> May <strong>2010</strong><br />
Buddy Hawton 1, 2 √ √ √ √<br />
Peter Bacon 2 √ √ √ √<br />
Nigel Colne 2 √ √ √ √<br />
Brian Frost 2 √ √ √ √<br />
Notes:<br />
1<br />
= Chairman<br />
2<br />
= Independent non-executive director<br />
Remuneration <strong>report</strong><br />
The main purpose of the remuneration<br />
committee is to assist the board<br />
in fulfilling their responsibilities in<br />
establishing formal and transparent<br />
remuneration policies which are<br />
aligned with the company’s strategy<br />
and linked to its performance in the<br />
long and short term.<br />
Membership consists of four<br />
non-executive directors, all<br />
of whom are independent<br />
and have the relevant<br />
expertise or experience to fulfil their<br />
duties. The Chairman of the board,<br />
Buddy Hawton, chairs the committee.<br />
The Group chief executive officer and<br />
Group director: HR and the Head of<br />
remuneration attend the meetings by<br />
invitation in order to advise on the<br />
remuneration of the executives. The<br />
Group chief executive officer does<br />
not participate in any discussion<br />
or decision related to his own<br />
remuneration.<br />
The committee met four times during<br />
the year and the committee Chairman<br />
<strong>report</strong>ed back to the board on the<br />
activities of the committee. The minutes<br />
of the committee meetings are circulated<br />
to all directors.<br />
King III recommends that the<br />
Chairman of the board should not be<br />
the Chairman of the Remuneration<br />
committee. The board has considered<br />
this and given the Chairman’s wealth of<br />
experience within remuneration it has<br />
considered that it is appropriate that<br />
he should remain as chairman of the<br />
remuneration committee. It was agreed<br />
that on retirement of Buddy Hawton,<br />
the Chairman of the board and the<br />
chairman of the remuneration committee<br />
would not be the same individual.<br />
The committee’s terms of reference have<br />
been reviewed and updated during the<br />
year. All amendments were approved<br />
by the board. The full terms of reference<br />
can be found on our website at<br />
www.woolworthsholdings.co.za.<br />
The committee is satisfied that it has<br />
carried out its responsibilities for the<br />
year in compliance with its terms<br />
of reference.<br />
Activities during the year<br />
The following key issues were discussed<br />
and dealt with by the committee during<br />
the year:<br />
Guaranteed Pay<br />
• <strong>Annual</strong> review of executive<br />
directors’ and executive committee<br />
(EXCO) members’ guaranteed<br />
pay relative to individual and<br />
company performance and market<br />
competitiveness (DG Capital as<br />
anindependent consultant was<br />
used for the provision of directors’<br />
package benchmarking services).<br />
Short-Term Performance Bonus<br />
• Reviewed and agreed to the shortterm<br />
incentive targets for <strong>2010</strong><br />
financial year; and<br />
• reviewed and approved the shortterm<br />
incentive bonus payments.<br />
Long-Term Incentive Schemes<br />
• Approved the performance<br />
conditions for the 2009 annual<br />
share rolling allocations;<br />
• bi-annual updates on share plan<br />
performance against performance<br />
targets;<br />
• bi-annual testing of performance<br />
conditions to determine vesting<br />
levels for employees who have<br />
been retrenched; and<br />
• consideration of current share<br />
schemes in place for executive<br />
directors, EXCO and senior<br />
management (design, categories<br />
and quantums).<br />
Other<br />
• Reviewed and approved the<br />
executive director employment<br />
contract of Ian Moir;<br />
• approved the allocation of<br />
restricted shares to individuals as<br />
a retention mechanism for critical<br />
key talent;<br />
59
CORPORATE GOVERNANCE<br />
remuneration committee and remuneration <strong>report</strong> CONTINUED<br />
The remuneration policy has been<br />
designed and implemented to attract,<br />
retain and reward top executives in<br />
the retail sector.<br />
• reviewed and approved the<br />
company’s talent and succession<br />
framework in terms of successors<br />
and scarce skills;<br />
• reviewed and approved the total<br />
reward framework for executives<br />
in Country Road (Australia); and<br />
• reviewed the terms of reference.<br />
The remuneration committee<br />
made use of the services of the<br />
following external consultants<br />
during the year to advise<br />
them on executive remuneration and<br />
to provide advice on market data,<br />
remuneration trends, retention strategy<br />
and performance-related pay.<br />
• DG Capital for executive remuneration;<br />
• remchannel for the provision of<br />
salary benchmarking services; and<br />
• PricewaterhouseCoopers for testing<br />
performance condition and advice<br />
on current share plans.<br />
<strong>Woolworths</strong> <strong>Holdings</strong><br />
share trust<br />
The company uses the <strong>Woolworths</strong><br />
<strong>Holdings</strong> share trust to hold shares for<br />
the purposes of its long-term incentive<br />
share schemes.<br />
In terms of the Trust Deed, the number<br />
of shares which can be utilised for<br />
the share incentive schemes is limited<br />
to 15% of the issued share capital of<br />
the company calculated prior to any<br />
decrease in share capital as a result of<br />
a repurchase, reduction or redemption<br />
of capital.<br />
The number of shares available for<br />
utilisation by the <strong>Woolworths</strong> share<br />
scheme at the beginning of this<br />
year was 37 805 549. Allocations<br />
of 15 162 947 were made during the<br />
period, with 9 969 839 returned to<br />
the scheme. The balance available<br />
for utilisation as at 27 June <strong>2010</strong> is<br />
32 612 441 shares.<br />
In any one financial year, the<br />
maximum market value of grants<br />
and/or offers in terms of the longterm<br />
incentive scheme may not<br />
exceed 250% of an individual’s total<br />
cost of employment (TCoE).<br />
In addition, the value of total share<br />
awards to an individual employee<br />
may not exceed 1.5% of the issued<br />
share capital of <strong>Woolworths</strong>, taking<br />
into account the repurchase and<br />
cancellation of the treasury shares<br />
and all future repurchases<br />
and cancellations.<br />
Remuneration policy for<br />
executive directors<br />
The remuneration policy has been<br />
designed and implemented to attract,<br />
retain and reward top executives in<br />
the retail sector.<br />
The principles applied in the integrated<br />
remuneration policy are:<br />
• the guaranteed pay is benchmarked<br />
against major South African retail<br />
and non-retail companies to ensure<br />
competitiveness;<br />
• guaranteed pay recognises and<br />
rewards individual responsibility<br />
and performance;<br />
• top retail executives are attracted,<br />
retained and appropriately<br />
rewarded;<br />
• a balance is created between short<br />
and long-term incentive schemes; and<br />
• individual performance and<br />
behaviour are aligned to shareholders<br />
interest and company performance.<br />
60
Elements of reward as<br />
a percentage of total<br />
remuneration<br />
The graphs below show how the<br />
group’s integrated reward strategy<br />
translates in the compositions of the<br />
Chief executive officer and executive<br />
directors’ remuneration packages<br />
(the aggregate of both).<br />
Guaranteed pay<br />
Guaranteed pay (TCoE)<br />
is reviewed annually<br />
against retail peer<br />
companies in South<br />
Africa. Market conditions, company<br />
performance, individual performance<br />
and responsibility, and internal<br />
comparability are also considered.<br />
Executives can structure elements<br />
of their packages according to<br />
individual requirements.<br />
TCoE includes compulsory contributions<br />
to the <strong>Woolworths</strong> Group Retirement<br />
Fund and the Wooltru Healthcare Fund.<br />
Optional items include car allowance,<br />
additional pension contributions to<br />
Investment Solutions Pension Fund,<br />
discount on purchases, head office<br />
meals and car leasing options.<br />
On average the executive directors’<br />
TCoE for the financial year increased<br />
by 6.29% and will increase by 8.08% for<br />
the 2011 financial year.<br />
Short-term performance bonus<br />
Senior executives participate in an<br />
annual short-term performance bonus<br />
scheme. It is designed to motivate<br />
executives to achieve the short-term<br />
strategic, financial, operational and<br />
environmental objectives in the annual<br />
business plan.<br />
The bonus pool is created on<br />
a self-funding basis (inclusive<br />
of the cost of the incentive)<br />
after achieving a pre-defined<br />
profit before tax and exceptional items<br />
(PBTAE) growth targets. Key performance<br />
indicators (KPIs) make up 30% of the final<br />
payment and PBTAE 70%.<br />
Payouts are determined as:<br />
• on-target payouts: Chief executive<br />
officer 90% of TCoE and executive<br />
directors, 65% of TCoE; and<br />
• stretched target payouts: Chief<br />
executive officer and executive<br />
directors, 150% of TCoE.<br />
The PBTAE target was achieved for the<br />
<strong>2010</strong> financial year and performance<br />
bonuses were paid out, details of which<br />
can be found on page 65.<br />
REWARD MIX<br />
REWARD INSTRUMENTS<br />
On-target performance<br />
Stretched performance<br />
On-target performance<br />
Stretched performance<br />
38.21%<br />
26.21%<br />
38.21%<br />
26.21%<br />
28.93%<br />
32.86%<br />
39.32%<br />
34.47% GUARANTEED PAY<br />
SHORT-TERM INCENTIVES<br />
LONG-TERM INCENTIVES<br />
28.93%<br />
19.11%<br />
7.45%<br />
6.30%<br />
39.32%<br />
13.11%<br />
17.03%<br />
4.32%<br />
GUARANTEED PAY<br />
SHORT-TERM INCENTIVES<br />
SHARE APPRECIATION<br />
RIGHTS<br />
LONG-TERM INCENTIVE<br />
PLAN<br />
DEFERRED BONUS PLAN<br />
• On-target performance: 90% of TCoE short-term incentive payment for CEO, 65% of TCoE short-term incentive payment for executive directors,<br />
100% vesting of share appreciation rights (CEO and executive directors), 30% vesting of long-term incentive plan and deferred bonus plan<br />
matching (CEO and executive directors)<br />
• Stretched performance for CEO and executive directors: 150% of TCoE short-term incentive payment, 100% vesting of share appreciation rights,<br />
100% vesting of long-term incentive plan and deferred bonus plan matching.<br />
61
CORPORATE GOVERNANCE<br />
remuneration committee and remuneration <strong>report</strong> CONTINUED<br />
Long-Term Incentive Schemes<br />
The long-term incentive schemes are to advance the interests of the group and <strong>Woolworths</strong> shareholders by attracting, retaining<br />
and incentivising selected employees who contribute to the growth of the companies within the group and the achievement of<br />
long-term objectives and to encourage their continued service with the group. Three instruments are used, namely:<br />
• Share Appreciation Rights Scheme (SARS);<br />
• Long-term Incentive Plan (LTIP); and<br />
• Deferred Bonus Plan (DBP).<br />
Share Appreciation Rights (SARs)<br />
Participants are awarded a conditional right to receive shares equal to the value of the difference between the share price at the<br />
time that the rights were granted and the share price when the rights are exercised (should the share appreciate).<br />
Grant limits<br />
• Chief executive officer and executive directors 50% of TCoE.<br />
Vesting period<br />
• Not less than three years.<br />
Performance conditions<br />
• Headline earnings per share (HEPS) growth of Consumer Price Index (CPIX) plus 6% over<br />
a three-year period.<br />
• If performance conditions are not met in year three, retesting in year four with HEPS<br />
growth of CPIX plus 8% and, if necessary, in year five against CPIX plus 10%.<br />
Retesting if performance not met • Allowed.<br />
• Considered appropriate given the cyclical nature of the business in the retail sector.<br />
Other<br />
• SARs not exercised within a period of seven years lapse.<br />
Number of participants • 362<br />
Long-Term Incentive Plan (LTIP)<br />
The LTIP provides for the delivery of conditional awards in shares (plus the value of back-dated dividends) after three years from<br />
date of grant.<br />
Grant limits<br />
• Chief executive officer 85% of TCoE.<br />
• Executive directors 50% of TCoE.<br />
Vesting period<br />
• Three years, subject to achievement of performance conditions.<br />
Performance conditions<br />
• Equally weighted between headline earnings per share (HEPS) growth and total<br />
shareholder return (TSR) of the company relative to the TSR of a selected peer group<br />
index for the same period.<br />
• The HEPS condition has a minimum threshold for 30% vesting and a target for<br />
100% vesting.<br />
• TSR condition<br />
– If the TSR performance of <strong>Woolworths</strong> falls below the lower quartile (i.e. if 75% of the<br />
peers perform better than <strong>Woolworths</strong>), then 0% of the related LTIP vests.<br />
• If the TSR performance of <strong>Woolworths</strong> exceeds the upper quartile (or 75% of the peers)<br />
performance, then 100% of the award vests.<br />
Peer group<br />
• Peer group for August 2009 grant was Foschini, JD Group, Lewis Group, Massmart, Mr Price,<br />
New Clicks, Pick n Pay, Shoprite, Spar and Truworths.<br />
Retesting if performance not met • Not permitted.<br />
• Awards lapse.<br />
Other<br />
• Payments are made on a linear scale in accordance with agreed targets.<br />
• Participants receive backdated dividends in shares on vested shares.<br />
Number of participants • 24<br />
62
Deferred Bonus Plan (DBP)<br />
On receipt of a short-term performance bonus, participants are able to elect to use part of their after-tax bonus to purchase<br />
deferred bonus shares.<br />
Grant limits<br />
• Chief executive officer 18.5% of TCoE.<br />
• Executive directors 15% of TCoE.<br />
Vesting period<br />
• Three years.<br />
Retention conditions<br />
• Matching award of shares at the end of the three-year period including backdated<br />
dividend on matching component.<br />
• Forfeited on cessation of employment within a three-year period.<br />
Other<br />
• Shares are held by a third party in escrow.<br />
Number of participants • 5<br />
Details of long-term incentive awards made to executive directors are set out on pages 69 to 71.<br />
Retention scheme<br />
The restricted share plan (RSP) was implemented in November 2009. The scheme is used to retain senior directors and employees<br />
who are critical to the delivery of the company’s long-term strategy. It may also be used for once-off awards for the recruitment of key<br />
executives which invariably requires compensation to address value forfeited on resignation from a previous employer.<br />
Grant limits<br />
• Limits between 100% and 300% of TCoE.<br />
Vesting conditions<br />
• Staggered vesting between three and five years.<br />
• 100% vesting on condition that the participant is still in the employ of the group on the<br />
expiry of the agreed vesting period.<br />
Other<br />
• Shares are purchased on the open market and held by a third party in escrow.<br />
Number of participants • 25<br />
Details of RSP granted to executive directors are set out on page 71.<br />
Executive directors’ service contracts<br />
The executive directors’ service contracts do not contain notice periods exceeding twelve months.<br />
Ian Moir, the Managing director retail and Group chief executive officer-elect has a three-year service contract. It expires on<br />
31 December 2012, with the company having the option to renew for an additional two years. His contract includes<br />
a restraint of trade agreement.<br />
63
CORPORATE GOVERNANCE<br />
remuneration committee and remuneration <strong>report</strong> CONTINUED<br />
Remuneration policy for non-executive directors<br />
Non-executive directors receive fees for services on board and board committees. These fees recognise the responsibilities of<br />
non-executive directors throughout the year and the total fee is inclusive of a base fee and attendance of meetings.<br />
Non-executive directors do not receive short-term incentives and do not participate in any long-term incentive share scheme.<br />
The fees for the non-executive directors have been recommended by the remuneration committee to the board for their approval,<br />
after considering input from the executive directors.<br />
The proposals for the fees for 2011 have been based on benchmarking with other retailers and other listed JSE companies.<br />
Consideration has also been given to the substantial increase in legal and regulatory oversight requirements and increased risk<br />
being assumed by non-executive directors.<br />
The proposed fees tabled for shareholder approval at the annual general meeting are set out below.<br />
Actual for <strong>2010</strong><br />
financial year<br />
Proposed for 2011<br />
financial year<br />
Chairman R750 000 R850 000<br />
Deputy Chairman n/a R210 000<br />
UK Director £33 000 £37 000<br />
SA Director R150 000 R170 000<br />
Chairman Audit R155 000 R180 000<br />
Member Audit R77 500 R90 000<br />
Chairman Remuneration R140 000 R155 000<br />
Member Remuneration R70 000 R77 500<br />
Chairman Risk R105 000 R120 000<br />
Member Risk R52 500 R60 000<br />
Chairman Transformation R105 000 R120 000<br />
Member Transformation R52 500 R60 000<br />
Chairman Nominations R67 000 R75 000<br />
Member Nominations R42 000 R45 000<br />
Chairman Sustainability R43 000 R60 000<br />
Member Sustainability R21 500 R30 000<br />
64
directors’ fees and emoluments<br />
Emoluments paid to directors of <strong>Woolworths</strong> <strong>Holdings</strong> <strong>Limited</strong> in connection with the affairs of the company and its subsidiaries<br />
during the year ended 27 June <strong>2010</strong> and comparatives for 28 June 2009 are set out below:<br />
Name<br />
<strong>2010</strong> Guaranteed pay<br />
Notes<br />
Remuneration<br />
R000’s<br />
Retirement,<br />
medical<br />
and<br />
related<br />
benefits<br />
R000’s<br />
Other<br />
benefits<br />
(2)<br />
R000’s<br />
Total<br />
guaranteed<br />
pay<br />
R000’s<br />
Short-term<br />
performance<br />
bonus<br />
Performance<br />
bonus<br />
R000’s<br />
Long-term benefits<br />
Interestfree<br />
loan<br />
benefit<br />
(3)<br />
R000’s<br />
Fair value<br />
of shares<br />
and<br />
options<br />
granted<br />
(4)<br />
R000’s<br />
Retention<br />
Fair<br />
value of<br />
restricted<br />
shares<br />
(5)<br />
R000’s<br />
Executive<br />
directors<br />
Simon Susman (1) 4 133 701 35 4 869 6 762 2 375 2 424 0<br />
Andrew Jennings (6) 1 699 163 180 2 042 5 737 0 1 555 0<br />
Ian Moir (7) 2 125 11 407 2 543 3 137 0 0 3 886<br />
Norman Thomson (1) 2 540 245 39 2 824 3 651 1 523 1 115 4<br />
Zyda Rylands 2 642 550 11 3 203 4 186 1 142 1 920 7<br />
13 139 1 670 672 15 481 23 473 5 040 7 014 3 897<br />
Audit<br />
committee<br />
member<br />
R000’s<br />
Remuneration<br />
committee<br />
member<br />
R000’s<br />
Risk<br />
committee<br />
member<br />
R000’s<br />
Nominations<br />
committee<br />
member<br />
R000’s<br />
Sustainability<br />
committee<br />
member<br />
R000’s<br />
Transformation<br />
committee<br />
member<br />
R000’s<br />
Other<br />
benefits<br />
R000’s<br />
Total<br />
nonexecutive<br />
directors’<br />
fees<br />
R000’s<br />
Name<br />
Notes<br />
Fees<br />
R000’s<br />
Non-executive<br />
directors<br />
Buddy Hawton 750 140 67 53 11 1 021<br />
Peter Bacon 150 70 53 16 289<br />
Lindiwe Bakoro (8) 125 58 39 5 227<br />
Nigel Colne (9) 396 78 70 53 42 3 642<br />
Brian Frost (10) 150 70 42 43 13 36 354<br />
Mike Leeming (11) 150 155 105 32 15 457<br />
Chris Nissen 150 42 22 105 16 335<br />
Thina Siwendu (12) 125 39 39 0 203<br />
Sindi Zilwa 150 78 53 53 29 363<br />
2 146 369 350 342 225 65 263 131 3 891<br />
65
CORPORATE GOVERNANCE<br />
remuneration committee and remuneration <strong>report</strong> CONTINUED<br />
Notes:<br />
1. Remuneration includes fees paid by Country Road as follows: Simon Susman AU$91 875 and Norman Thomson AU$39 167.<br />
2. Other benefits include discounts received on purchases made in our stores and executive accommodation for Ian Moir<br />
and Andrew Jennings.<br />
3. The interest-free loan relates to the purchase of shares under the <strong>Woolworths</strong> Holding Share Trust. The benefit has been<br />
calculated at 8.08% on the value of the outstanding loan.<br />
4. The fair value of shares and options granted is the annual expense as determined in accordance with IFRS 2 “Share-based<br />
payments”. It includes the expense relating to the allocation of BEESOS scheme shares granted to Zyda Rylands. It is presented<br />
for information purposes only.<br />
5. IFRS 2 “Share-based Payments” has been used to equate the annual expense value relating to the allocation of restricted shares<br />
used as a retention scheme. It is presented for information purposes only.<br />
6. Andrew Jennings resigned on 31 December 2009, completing his initial three-year contract. He was paid R2 000 000 as an end o<br />
contract bonus and was paid a further R2 000 000 in recognition of his contribution to the company.<br />
He was entitled to full participation in the <strong>2010</strong> short-term performance bonus scheme and will be paid R5 737 490 in August <strong>2010</strong>.<br />
In terms of the rules of the share scheme:<br />
• the directors approved that his share options vest and that he may exercise them at any time during the period of ten years<br />
from the original grant date up to 30 November 2016; and<br />
• he chose to remain on the SARs, LTIP and DBP schemes for the duration of the allocations he received as if he had continued<br />
to be an employee.<br />
7. Ian Moir was appointed on 1 January <strong>2010</strong> with a three-year contract expiring on 31 December 2012, and a renewal option of<br />
a further two years by the company.<br />
He was paid a signing-on bonus of R7 500 000 of which R5 000 000 is repayable in full should his contract be terminated prior<br />
to 31 December 2014. In compensation for the portion of the LTIP benefit he would have received from Country Road for the<br />
six months to June <strong>2010</strong>, an amount of R5 926 050 was paid by the company.<br />
He received a once-off allocation of restricted shares to the value of R20 000 000.<br />
He participated in the <strong>2010</strong> short-term incentive scheme of the company from the date of his employment.<br />
8. Lindiwe Bakoro was appointed as a non-executive director on 26 August 2009 and was appointed to the audit and risk<br />
committees with effect from November 2009.<br />
9. Fees are paid in sterling as a British resident.<br />
10. Brian Frost was reimbursed for services rendered as Chairman of The <strong>Woolworths</strong> Trust.<br />
11. Mike Leeming was appointed to the nominations committee with effect from November 2009.<br />
12. Thina Siwendu was appointed as a non-executive director on 26 August 2009 and was appointed to the risk and transformation<br />
committees with effect from November 2009.<br />
66
2009 Guaranteed pay<br />
Retirement,<br />
medical<br />
and<br />
related<br />
benefits<br />
R000’s<br />
Other<br />
benefits<br />
(2)<br />
R000’s<br />
Total<br />
guaranteed<br />
pay<br />
R000’s<br />
Short-term<br />
performance<br />
bonus<br />
Performance<br />
bonus<br />
R000’s<br />
Long-term benefits<br />
Interestfree<br />
loan<br />
benefit<br />
(3)<br />
R000’s<br />
Fair value<br />
of shares<br />
and<br />
options<br />
granted<br />
(4)<br />
R000’s<br />
Name<br />
Notes<br />
Remuneration<br />
R000’s<br />
Executive<br />
directors<br />
Simon Susman (1) 3 720 695 30 4 445 1 412 3 741 1 357<br />
Andrew Jennings (5) 3 193 334 344 3 871 968 0 1 013<br />
Norman Thomson (1) 2 273 206 53 2 532 557 2 332 608<br />
Zyda Rylands 2 045 514 9 2 568 726 1 707 1 568<br />
11 231 1 749 436 13 416 3 663 7 780 4 546<br />
Audit<br />
committee<br />
member<br />
R000’s<br />
Remuneration<br />
committee<br />
member<br />
R000’s<br />
Risk<br />
committee<br />
member<br />
R000’s<br />
Nominations<br />
committee<br />
member<br />
R000’s<br />
Sustainability<br />
committee<br />
member<br />
R000’s<br />
Transformation<br />
committee<br />
member<br />
R000’s<br />
Other<br />
benefits<br />
R000’s<br />
Total<br />
nonexecutive<br />
directors’<br />
fees<br />
R000’s<br />
Name<br />
Notes<br />
Fees<br />
R000’s<br />
Non-executive<br />
directors<br />
Buddy Hawton 651 121 58 46 8 884<br />
Peter Bacon 131 63 45 19 258<br />
Nigel Colne (6) 474 70 63 45 37 2 691<br />
Judy Dlamini (7) 10 0 10<br />
Brian Frost 131 63 37 37 46 13 327<br />
Mike Leeming 131 133 95 12 371<br />
Chris Nissen (8) 131 28 18 92 12 281<br />
Sindi Zilwa (9) 131 70 11 46 27 285<br />
1 790 273 310 196 160 55 230 93 3 107<br />
Notes:<br />
1. Remuneration includes fees paid by Country Road as follows: Simon Susman AU$30 000 and Norman Thomson AU$30 000.<br />
2. Other benefits include discounts received on purchases made in our stores and executive accommodation for Andrew Jennings.<br />
3. The interest-free loan relates to the purchase of shares under the <strong>Woolworths</strong> Holding Share Trust. The benefit has been<br />
calculated at 12.17% on the value of the outstanding loan.<br />
4. The fair value of shares and options granted is the annual expense as determined in accordance with IFRS 2 “Share-based<br />
Payments”. It includes the expense relating to the allocation of BEESOS scheme shares granted to Zyda Rylands. It is presented<br />
for information purposes only.<br />
5. Andrew Jennings was appointed on 1 December 2006. After completing his initial three-year contract, he will receive an<br />
additional payment of R2 000 000, as an end of term contract payment.<br />
6. Fees are paid in sterling as a British resident.<br />
7. Judy Dlamini resigned on 31 July 2008.<br />
8. Chris Nissen was appointed to the nomination committee with effect from 18 November 2008.<br />
9. Sindi Zilwa was appointed to the risk committee with effect from 18 May 2009.<br />
67
CORPORATE GOVERNANCE<br />
directors’ participation in share schemes<br />
diRECTORs’ PARTiciPATiON in shARE schemES<br />
Details of directors’ interest in shares of the company are disclosed in the directors’ <strong>report</strong> on page 76. Shares purchased<br />
and options granted to executive directors in terms of the <strong>Woolworths</strong> <strong>Holdings</strong> Share Trust, which had not been exercised<br />
at 27 June <strong>2010</strong>, are set out below.<br />
Share purchase scheme<br />
Shares held as at<br />
28 June 2009 Shares purchased<br />
Name and offer date Number Price (R) Number Price (R)<br />
Simon Susman<br />
Shares held as at<br />
27 June <strong>2010</strong><br />
Vested<br />
shares<br />
Unvested<br />
shares<br />
December 2004 440 755 10.59 440 755 – 440 755<br />
August 2005 412 697 11.31 330 156 82 541 412 697<br />
August 2006 378 947 13.30 227 367 151 580 378 947<br />
October 2006 1 094 092 13.71 361 050 733 042 1 094 092<br />
Total 2 326 491 1 359 328 967 163 2 326 491<br />
Norman Thomson<br />
December 2000 236 800 2.77 236 800 24.00<br />
March 2001 533 333 2.82 113 200 24.00 420 133 420 133<br />
June 2001 1 120 297 3.03 1 120 297 1 120 297<br />
August 2003 290 698 5.16 290 698 290 698<br />
December 2004 152 597 10.59 152 597 152 597<br />
August 2005 142 882 11.31 114 304 28 578 142 882<br />
August 2006 130 075 13.30 78 045 52 030 130 075<br />
October 2006 510 576 13.71 168 490 342 086 510 576<br />
Total 3 117 258 350 000 2 344 564 422 694 2 767 258<br />
Zyda Rylands<br />
December 2000 8 420 2.77 8 420 8 420<br />
April 2001 20 000 3.03 20 000 20 000<br />
August 2001 12 970 3.33 12 970 12 970<br />
August 2002 14 738 3.98 14 738 14 738<br />
August 2003 12 125 5.16 12 125 12 125<br />
September 2003 180 510 5.76 180 510 180 510<br />
December 2004 259 573 10.59 259 573 259 573<br />
March 2005 120 000 10.18 120 000 120 000<br />
August 2005 277 549 11.31 222 036 55 513 277 549<br />
August 2006 129 699 13.30 77 817 51 882 129 699<br />
October 2006 291 758 13.71 96 280 195 478 291 758<br />
Total 1 327 342 1 024 469 302 873 1 327 342<br />
Total<br />
68
Share option scheme<br />
Options held as at<br />
28 June 2009 Options purchased<br />
Options held as at<br />
27 June <strong>2010</strong><br />
Name and offer date Number Price (R) Number Price (R)<br />
Vested<br />
shares<br />
Unvested<br />
shares Total<br />
Zyda Rylands<br />
December 2000 16 840 1.79 16 840 16 840<br />
April 2001 40 000 2.04 40 000 40 000<br />
October 2008 326 395 8.81 65 279 261 116 326 395<br />
Total 383 235 122 119 261 116 383 235<br />
Ian Moir<br />
April 2002 199 925 2.98 199 925 23.72<br />
Total 199 925 199 925 – –<br />
Andrew Jennings*<br />
December 2006 1 784 652 14.58 1 050 000 24.03 734 652 734 652<br />
Total 1 784 652 1 050 000 734 652 734 652<br />
Total 2 367 812 1 249 925 856 771 261 116 1 117 887<br />
*Resigned 31 December 2009<br />
Share appreciation rights scheme (SARs)<br />
Rights held as at<br />
28 June 2009 SARs rights awarded<br />
Name and offer date Number Price (R) Number Price (R)<br />
Rights held as at<br />
27 June <strong>2010</strong><br />
Vested<br />
rights<br />
Unvested<br />
rights<br />
Simon Susman<br />
April 2008 176 392 10.26 176 392 176 392<br />
August 2008 176 540 10.24 176 540 176 540<br />
August 2009 140 526 15.00 140 526 140 526<br />
Total 352 932 140 526 493 458 493 458<br />
Norman Thomson<br />
April 2008 87 904 10.26 87 904 87 904<br />
August 2008 87 978 10.24 87 978 87 978<br />
December 2008 83 547 10.24 83 547 83 547<br />
August 2009 84 667 15.00 84 667 84 667<br />
Total 259 429 84 667 344 096 344 096<br />
Zyda Rylands<br />
April 2008 91 767 10.26 91 767 91 767<br />
August 2008 125 628 10.24 125 628 125 628<br />
October 2008 169 456 10.26 169 456 169 456<br />
August 2009 107 000 15.00 107 000 107 000<br />
Total 386 851 107 000 493 851 493 851<br />
Andrew Jennings*<br />
April 2008 142 259 10.26 142 259 142 259<br />
August 2008 150 755 10.24 150 755 150 755<br />
August 2009 133 333 15.00 133 333 133 333<br />
Total 293 014 133 333 426 347 426 347<br />
Total 1 292 226 465 526 1 757 752 1 757 752<br />
Total<br />
*Resigned 31 December 2009<br />
69
CORPORATE GOVERNANCE<br />
directors’ participation in share schemes CONTINUED<br />
Long-term incentive plan (LTIP)<br />
Grants held as at<br />
28 June 2009 LTIP grants awarded<br />
Name and offer date Number Price (R) Number Price (R)<br />
Grants held as at<br />
27 June <strong>2010</strong><br />
Vested<br />
grants<br />
Unvested<br />
grants<br />
Simon Susman<br />
April 2008 325 125 11.95 325 125 325 125<br />
August 2008 325 398 11.94 325 398 325 398<br />
August 2009 238 894 15.00 238 894 238 894<br />
Total 650 523 238 894 889 417 889 417<br />
Norman Thomson<br />
April 2008 95 309 11.95 95 309 95 309<br />
August 2008 95 388 11.94 95 388 95 388<br />
December 2008 90 585 11.94 90 585 90 585<br />
August 2009 84 667 15.00 84 667 84 667<br />
Total 281 282 84 667 365 949 365 949<br />
Zyda Rylands<br />
April 2008 99 498 11.95 99 498 99 498<br />
August 2008 136 210 11.94 136 210 136 210<br />
October 2008 183 728 11.95 183 728 183 728<br />
August 2009 107 000 15.00 107 000 107 000<br />
Total 419 436 107 000 526 436 526 436<br />
Andrew Jennings*<br />
April 2008 154 242 11.95 154 242 154 242<br />
August 2008 163 453 11.94 163 453 163 453<br />
August 2009 133 333 15.00 133 333 133 333<br />
Total 317 695 133 333 451 028 451 028<br />
Total 1 668 936 563 894 2 232 830 2 232 830<br />
*Resigned 31 December 2009<br />
Total<br />
70
Deferred bonus plan (DBP)<br />
Shares held as at<br />
28 June 2009 Shares purchased<br />
Shares held as at<br />
27 June <strong>2010</strong><br />
Name and offer date Number Price (R) Number Price (R) Number Price (R) Total<br />
Simon Susman<br />
April 2008 62 241 12.45 62 241 12.45 62 241<br />
August 2009 49 498 15.67 49 498 15.67 49 498<br />
Total 62 241 49 498 111 739 111 739<br />
Norman Thomson<br />
April 2008 25 179 12.45 25 179 12.45 25 179<br />
August 2009 21 198 15.67 21 198 15.67 21 198<br />
Total 25 179 21 198 46 377 46 377<br />
Zyda Rylands<br />
April 2008 26 285 12.45 26 285 12.45 26 285<br />
August 2009 27 645 15.67 27 645 15.67 27 645<br />
Total 26 285 27 645 53 930 53 930<br />
Andrew Jennings*<br />
April 2008 40 916 12.45 40 916 12.45 40 916<br />
August 2009 36 860 15.67 36 860 15.67 36 860<br />
Total 40 916 36 860 77 776 77 776<br />
Total 154 621 135 201 289 822 289 822<br />
*Resigned 31 December 2009<br />
Restricted share plan (RSP)<br />
Shares at<br />
28 June 2009 Shares awarded<br />
Shares at<br />
27 June <strong>2010</strong><br />
Name and offer date Number Price (R) Number Price (R) Number Price (R) Total<br />
Ian Moir<br />
January <strong>2010</strong> 1 184 000 16.89 1 184 000 16.89 1 184 000<br />
Total 1 184 000 1 184 000 1 184 000<br />
Norman Thomson<br />
May <strong>2010</strong> 119 938 23.34 119 938 23.34 119 938<br />
Total 119 938 119 938 119 938<br />
Zyda Rylands<br />
May <strong>2010</strong> 206 250 23.34 206 250 23.34 206 250<br />
Total 206 250 206 250 206 250<br />
Total 1 510 188 1 510 188 1 510 188<br />
71
CONTENTS<br />
ANNUAL FINANCIAL STATEMENTS <strong>2010</strong><br />
<strong>report</strong> of the group secretary 73<br />
approval of the annual financial statements 73<br />
<strong>report</strong> of the independent auditors 74<br />
directors’ <strong>report</strong> 75<br />
group annual financial statements<br />
statement of comprehensive income 78<br />
statement of financial position 79<br />
statement of changes in equity 80<br />
statement of cash flows 82<br />
notes to the group annual financial statements<br />
1. Significant accounting policies 83<br />
2. Revenue 98<br />
3. Profit before exceptional items 98<br />
4. Exceptional items 99<br />
5. Tax 99<br />
6. Earnings per share 100<br />
7. Diluted earnings per share 101<br />
8. Related party transactions 102<br />
9. Property, plant and equipment 104<br />
10. Investment properties 105<br />
11. Intangible assets 106<br />
12. Investment in associate 107<br />
13. Prepaid employment costs 108<br />
14. Participation in export partnerships 108<br />
15. Other loans 109<br />
16. Deferred tax 110<br />
17. Inventories 110<br />
18. Trade and other receivables 111<br />
19. Derivative financial instruments 112<br />
20. Ordinary share capital 113<br />
21. Share premium 122<br />
22. Reserves 122<br />
23. Interest-bearing borrowings 123<br />
24. Trade and other payables 123<br />
25. Retirement benefit information 124<br />
26. Provisions 126<br />
27. Capital commitments 126<br />
28. Contingent liabilities 127<br />
29. Financial risk management 127<br />
30. Management of capital 139<br />
31. Comparative figures 140<br />
32. Distributions to shareholders 140<br />
33. Cash flow information 141<br />
34. Operating leases 142<br />
35. Finance leases 143<br />
36. Disposal group 144<br />
37. Investment in joint ventures 145<br />
38. Events after the <strong>report</strong>ing date 145<br />
39. Segmental information 146<br />
company annual financial statements<br />
statement of comprehensive income 152<br />
statement of financial position 153<br />
statement of changes in equity 154<br />
statement of cash flows 155<br />
notes to the company annual financial statements 156<br />
annexure 1 – interest in subsidiaries 168<br />
glossary of terms 170<br />
shareholder information 174
annual financial statements<br />
<strong>report</strong> of the group secretary<br />
In my capacity as Group secretary, I hereby confirm, in terms of the Companies Act 61 of 1973, as amended, that for the year ended<br />
27 June <strong>2010</strong>, the company has lodged with the Registrar of Companies all such returns as are required of a public company in<br />
terms of this Act and that all such returns are true, correct and up to date.<br />
CL Lowe<br />
Group secretary<br />
approval of the annual financial statements<br />
The financial statement were approved by the board of directors on 25 August <strong>2010</strong> and signed on its behalf by:<br />
DA Hawton<br />
Chairman<br />
SN Susman<br />
Group chief executive officer<br />
73
eport of the independent Auditors<br />
AUDIT OPINION TO THE MEMBERS OF WOOLWORTHS HOLDINGS LIMITED<br />
Report on the Financial Statements<br />
We have audited the Group and Company annual financial statements of <strong>Woolworths</strong> <strong>Holdings</strong> <strong>Limited</strong>, which comprise the<br />
directors’ <strong>report</strong>, the statement of financial position as at 27 June <strong>2010</strong>, the statement of comprehensive income, statement of<br />
changes in equity and statement of cash flow for the year then ended, a summary of significant accounting policies and other<br />
explanatory notes, as set out on pages 75 to 169.<br />
Directors’ Responsibility for the Financial Statements<br />
The company’s directors are responsible for the preparation and fair presentation of these financial statements in accordance with<br />
International Financial Reporting Standards, and in the manner required by the Companies Act of South Africa. This responsibility<br />
includes: designing, implementing and maintaining internal control relevant to the preparation and fair presentation of financial<br />
statements that are free from material misstatement, whether due to fraud or error; selecting and applying appropriate accounting<br />
policies; and making accounting estimates that are reasonable in the circumstances.<br />
Auditor’s Responsibility<br />
Our responsibility is to express an opinion on these financial statements based on our audit. We conducted our audit in accordance<br />
with International Standards on Auditing. Those standards require that we comply with ethical requirements and plan and perform<br />
the audit to obtain reasonable assurance whether the financial statements are free from material misstatement.<br />
An audit involves performing procedures to obtain audit evidence about the amounts and disclosures in the financial statements.<br />
The procedures selected depend on the auditor’s judgement, including the assessment of the risks of material misstatement of the<br />
financial statements, whether due to fraud or error. In making those risk assessments, the auditor considers internal control relevant<br />
to the entity’s preparation and fair presentation of the financial statements in order to design audit procedures that are appropriate<br />
in the circumstances, but not for the purpose of expressing an opinion on the effectiveness of the entity’s internal control. An audit<br />
also includes evaluating the appropriateness of accounting policies used and the reasonableness of accounting estimates made<br />
by the directors, as well as evaluating the overall presentation of the financial statements.<br />
We believe that the audit evidence we have obtained is sufficient and appropriate to provide a basis for our audit opinion.<br />
Opinion<br />
In our opinion, the financial statements present fairly, in all material respects, the financial position of the Group and Company as of<br />
27 June <strong>2010</strong>, and of the financial performance and its cash flows for the year then ended in accordance with International Financial<br />
Reporting Standards and in the manner required by the Companies Act of South Africa.<br />
ERNST & YOUNG Inc.<br />
SAB&T Inc.<br />
REGISTERED AUDITOR<br />
REGISTERED AUDITOR<br />
25 August <strong>2010</strong> 25 August <strong>2010</strong><br />
Cape Town<br />
Cape Town<br />
74
directors’ <strong>report</strong><br />
for the year ended 27 June<br />
nature of business<br />
<strong>Woolworths</strong> <strong>Holdings</strong> <strong>Limited</strong> is an investment holding company, listed on the JSE <strong>Limited</strong> securities exchange and operates mainly<br />
through two subsidiaries, <strong>Woolworths</strong> (Proprietary) <strong>Limited</strong> and Country Road <strong>Limited</strong>, and through a joint venture, <strong>Woolworths</strong><br />
Financial Services (Proprietary) <strong>Limited</strong>.<br />
<strong>Woolworths</strong> (Proprietary) <strong>Limited</strong> is a retail chain of stores offering a selected range of clothing, food and general merchandise,<br />
mainly under its own brand name. <strong>Woolworths</strong> has 259 corporate and 160 franchise stores throughout South Africa, Africa and the<br />
Middle East.<br />
<strong>Woolworths</strong> Financial Services (Proprietary) <strong>Limited</strong> is operated jointly with Absa and provides our customers with a credit offering.<br />
Country Road <strong>Limited</strong>, listed on the Australian Securities Exchange, offers a range of clothing and homeware. Country Road <strong>Limited</strong><br />
has 78 retail stores and 82 concession retail outlets across Australia and New Zealand and is sold in selected <strong>Woolworths</strong> stores and<br />
two stand-alone retail stores in South Africa.<br />
The nature of the business of the subsidiaries held directly and indirectly is set out on page 168.<br />
review of financial results and activities<br />
Reviews of the financial results and the activities of the group are contained in the Chairman’s <strong>report</strong>, the Group chief executive<br />
officer’s <strong>report</strong>, the Group finance director’s <strong>report</strong> and the annual financial statements.<br />
share capital<br />
Details of the authorised and issued share capital of <strong>Woolworths</strong> <strong>Holdings</strong> <strong>Limited</strong> and the movements for the period under review<br />
are disclosed in note 12 of the company annual financial statements.<br />
directorate and group secretary<br />
The composition of the board and the details of the directors and the Group secretary in office at the date of this <strong>report</strong> are<br />
reflected on pages 12 and 13.<br />
new appointments, resignations and re-election of directors<br />
retiring by rotation<br />
Andrew Jennings resigned as an executive director from the board on 31 December 2009.<br />
Ian Moir was appointed as an executive director to the board with effect from 1 January <strong>2010</strong>. Tom Boardman was appointed to the<br />
board on 27 September <strong>2010</strong>.<br />
In accordance with the articles of association of the company, at least one-third of the board are required to retire by rotation at<br />
each annual general meeting. Retiring directors are those who have been appointed between annual general meetings and those<br />
who have been in office the longest since their re-election. No director can serve more than three years without being re‐elected.<br />
Chris Nissen, Sindi Zilwa and Norman Thomson are due to retire by rotation at the next annual general meeting and, being<br />
eligible, offer themselves for re-election. The directors do not have service contracts with the company with notice periods<br />
in excess of one year.<br />
Ian Moir, Managing director and Chief executive officer-elect and Tom Boardman are required to retire as they were appointed<br />
to the board between annual general meetings. Ian has a three year service contract, expiring on 31 December 2012, with the<br />
company having the option to renew for an additional two years.<br />
Nigel Colne and Brian Frost will retire at the next annual general meeting, but will not be offering themselves up for re-election.<br />
Abridged curriculum vitae of the directors seeking re-election are contained in the notice of the annual general meeting.<br />
75
directors’ <strong>report</strong><br />
continued<br />
directors’ interests in shares<br />
As at the date of this <strong>report</strong>, the directors held, directly and indirectly, the following interests in the company’s ordinary issued<br />
share capital:<br />
<strong>2010</strong> Beneficial 2009 Beneficial<br />
Direct Indirect Direct Indirect<br />
Non-executive directors<br />
Buddy Hawton 50 000 – 28 500 –<br />
Peter Bacon 25 000 – 25 000 –<br />
Lindiwe Bakoro – – – –<br />
Nigel Colne 96 800 – 92 000 –<br />
Brian Frost – 260 000 – 260 000<br />
Mike Leeming – 20 000 – 20 000<br />
Chris Nissen – – – –<br />
Thina Siwendu – – – –<br />
Sindi Zilwa – – – –<br />
Executive directors<br />
Simon Susman 111 754 10 514 356 62 256 11 814 356<br />
Ian Moir 1 184 000 – – –<br />
Andrew Jennings (Resigned 31 December 2009) 77 776 – 40 916 –<br />
Zyda Rylands 330 180 1 327 342 96 285 1 327 342<br />
Norman Thomson 168 935 3 220 785 27 799 3 570 785<br />
Total 2 044 445 15 342 483 372 756 16 992 483<br />
As at the date of this <strong>report</strong>, the directors held indirectly, the following interest in the company’s preference issued share capital for<br />
the <strong>Woolworths</strong> Employee Share Ownership Trust:<br />
<strong>2010</strong> Beneficial 2009 Beneficial<br />
Direct Indirect Direct Indirect<br />
Executive directors<br />
Zyda Rylands – 1 250 000 – 1 250 000<br />
Total – 1 250 000 – 1 250 000<br />
There have been no changes to the directors’ interests between the end of the <strong>report</strong>ing period and the date of the<br />
directors’ <strong>report</strong>.<br />
directors’ emoluments<br />
The emoluments of directors of the company are set out on pages 65 to 67.<br />
related party contracts<br />
During the course of the year, no director had a material interest in any contract of significance with the company or any of its<br />
subsidiaries that could have given rise to a conflict of interest.<br />
Transactions defined as related party transactions in terms of the International Financial Reporting Standards between the<br />
company or its subsidiaries and the directors or their associates are disclosed in note 8 on page 102.<br />
76
directors <strong>report</strong><br />
distributions<br />
to ordinary shareholders<br />
Interim<br />
On 17 February <strong>2010</strong> a cash distribution of 38.0 cents per share (2009: 31.5 cents cash dividend) was declared to shareholders<br />
recorded at the close of business on 1 April <strong>2010</strong> and paid on 6 April <strong>2010</strong>.<br />
Final<br />
On 25 August <strong>2010</strong> a cash dividend of 67.0 cents per ordinary share (2009: 53.5 cents cash distribution) was declared<br />
to shareholders recorded at the close of business on 14 September <strong>2010</strong>, to be paid on 20 September <strong>2010</strong>.<br />
to preference shareholders<br />
Preference shares are convertible, redeemable, non-cumulative participating preference shares held by The <strong>Woolworths</strong> Employee<br />
Share Ownership Trust.<br />
Interim<br />
On 17 February <strong>2010</strong>, a cash dividend of 8.7 cents per share (2009: 5.0 cents) was declared to shareholders recorded at the close<br />
of business on 1 April <strong>2010</strong> and paid on 6 April <strong>2010</strong>.<br />
Final<br />
On 25 August <strong>2010</strong>, a cash dividend of 22.1 cents per share (2009: 12.3 cents) was declared to shareholders recorded at close<br />
of business on 17 September <strong>2010</strong>, to be paid on 20 September <strong>2010</strong>.<br />
directors’ responsibility for annual financial statements<br />
The directors are responsible for preparing the annual financial statements and other information presented in the annual <strong>report</strong><br />
in a manner that fairly presents the financial position and the results of the operations of the company and the group for the year<br />
ended 27 June <strong>2010</strong>.<br />
The external auditors are responsible for carrying out an independent examination of the annual financial statements in<br />
accordance with International Standards on Auditing in the manner required by the South African Companies Act 61 of 1973,<br />
as amended, and for <strong>report</strong>ing their findings thereon. The auditors’ <strong>report</strong> is set out on page 74 of these annual financial statements.<br />
The annual financial statements set out on pages 75 to 169 have been prepared in accordance with International Financial<br />
Reporting Standards and are based on appropriate accounting policies which have been consistently applied in all material<br />
respects, and are supported by reasonable and prudent estimates where appropriate. Adequate accounting records have been<br />
maintained throughout the period under review.<br />
going concern<br />
The directors have reviewed the group’s budget and cash flow forecast for the year to 26 June 2011 and details of the group<br />
insurance arrangements. On the basis of this review and in the light of the current financial position and existing borrowing facilities,<br />
the directors are satisfied that the group is a going concern and have continued to adopt the going concern basis in preparing the<br />
annual financial statements.<br />
borrowing powers<br />
In terms of the articles of association, the borrowing powers of the company are unlimited. However, all borrowings by the group<br />
are subject to board approval as required by the board delegation of authority. The details of borrowings appear in note 23 on<br />
page 123 to the annual financial statements.<br />
subsidiary companies<br />
An annexure containing full particulars of the subsidiary companies appears on pages 168 and 169 of the annual financial statements.<br />
events subsequent to the <strong>report</strong>ing date<br />
No event material to the understanding of this <strong>report</strong> has occurred between the end of the financial period and the date<br />
of this <strong>report</strong>.<br />
special resolutions<br />
The following special resolutions were passed during the course of the year.<br />
<strong>Woolworths</strong> <strong>Holdings</strong> <strong>Limited</strong><br />
• Authorise the specific allotment of shares by the company to <strong>Woolworths</strong> (Proprietary) <strong>Limited</strong>.<br />
• Authorise the repurchase of shares by the company and its subsidiaries.<br />
<strong>Woolworths</strong> (Proprietary) <strong>Limited</strong><br />
• Amendments to memorandum and articles of association<br />
77
GROUP STATEMENT OF COMPREHENSIVE INCOME<br />
52 weeks 52 weeks<br />
to 27 June <strong>2010</strong> to 28 June 2009<br />
Note Rm Rm<br />
Revenue 2 23 663 21 922<br />
Turnover 2 23 393 21 175<br />
Cost of sales 15 656 14 501<br />
Gross profit 7 737 6 674<br />
Other revenue 2 95 563<br />
Expenses 3 6 178 5 784<br />
Store costs 3 940 3 482<br />
Net bad debts and bad debt provisions – 134<br />
Other operating costs 2 238 2 168<br />
Operating profit 1 654 1 453<br />
Investment income 2 175 184<br />
Interest paid 3.6 151 281<br />
Profit before earnings from joint ventures and associate 1 678 1 356<br />
Earnings from joint ventures 37 75 58<br />
Earnings from associate 12 6 12<br />
Profit before exceptional items 3 1 759 1 426<br />
Exceptional items 4 – 380<br />
Profit before tax 1 759 1 806<br />
Tax 5 491 546<br />
Profit for the period 1 268 1 260<br />
Other comprehensive income:<br />
Fair-value adjustments on financial instruments 54 (74)<br />
Deferred tax on net fair-value adjustments on financial instruments (14) 20<br />
Exchange differences on translation of foreign subsidiaries 13 (81)<br />
Other comprehensive income for the period, net of tax 53 (135)<br />
Total comprehensive income for the period 1 321 1 125<br />
Profit attributable to:<br />
Shareholders of the parent 1 258 1 248<br />
Non-controlling interest 10 12<br />
Total comprehensive income attributable to:<br />
Shareholders of the parent 1 304 1 124<br />
Non-controlling interest 17 1<br />
Headline earnings per share (cents) 6 164.6 109.3<br />
Earnings per share (cents) 6 162.4 157.2<br />
Diluted headline earnings per share (cents) 7 159.3 107.5<br />
Diluted earnings per share (cents) 7 157.2 154.0<br />
78
GROUP STATEMENT OF FINANCIAL POSITION<br />
at 27 June <strong>2010</strong> at 28 June 2009<br />
Note Rm Rm<br />
ASSETS<br />
Non-current assets 3 633 3 436<br />
Property, plant and equipment 9 1 991 1 937<br />
Investment properties 10 121 121<br />
Intangible assets 11 392 351<br />
Investment in associate 12 40 35<br />
Investment in joint ventures 37 574 534<br />
Prepaid employments costs 13 29 37<br />
Participation in export partnerships 14 63 65<br />
Other loans 15 95 126<br />
Derivative financial instruments 19 1 –<br />
Deferred tax 16 327 230<br />
Current assets 5 377 4 869<br />
Inventories 17 1 676 1 723<br />
Trade and other receivables 18 759 745<br />
Derivative financial instruments 19 19 6<br />
Tax 6 4<br />
Cash 33.5 2 917 2 391<br />
Total assets 9 010 8 305<br />
EQUITY AND LIABILITIES<br />
Equity attributable to shareholders of the parent 3 396 3 025<br />
Share capital 20 1 1<br />
Share premium 21 61 142<br />
Treasury shares 20 (1 305) (317)<br />
Non-distributable reserves 22 218 207<br />
Distributable reserves 22 4 421 2 992<br />
Non-controlling interest 57 47<br />
Total shareholders’ interest 3 453 3 072<br />
Non-current liabilities 1 362 2 342<br />
Interest-bearing borrowings 23 521 1 532<br />
Operating lease accrual 24 447 457<br />
Derivative financial instruments 19 15 16<br />
Post-retirement medical benefit liability 25 292 272<br />
Deferred tax 16 87 65<br />
Current liabilities 4 195 2 891<br />
Trade and other payables 24 2 608 2 373<br />
Provisions 26 248 250<br />
Derivative financial instruments 19 20 142<br />
Tax 285 111<br />
Overdrafts and short-term interest-bearing borrowings 23 1 034 15<br />
Total equity and liabilities 9 010 8 305<br />
79
group statement of changes in equity<br />
Note<br />
Share<br />
capital<br />
Share<br />
premium<br />
Treasury<br />
shares<br />
Rm Rm Rm<br />
Shareholders’ interest at 29 June 2008 1 116 (891)<br />
Issue of ordinary shares 20 & 21 – 26 –<br />
Share repurchase 20 & 21 – – (317)<br />
Share repurchase costs – – –<br />
Shares cancelled 20 – – 891<br />
Distributions to shareholders 32 – – –<br />
Share-based payments – – –<br />
Total comprehensive income for the period – – –<br />
Shareholders’ interest at 28 June 2009 1 142 (317)<br />
Issue of ordinary shares 20 & 21 – 666 (619)<br />
Share repurchase 20 – – (410)<br />
Share repurchase costs – – –<br />
Distributions to shareholders 32 – (747) 41<br />
Share-based payments 20 – – –<br />
Total comprehensive income for the period – – –<br />
Shareholders’ interest at 27 June <strong>2010</strong> 1 61 (1 305)<br />
<strong>2010</strong> 2009<br />
Distributions per share declared for the financial period (cents) 32<br />
Ordinary shares 105.0 179.0<br />
Interim 38.0 31.5<br />
Special – 94.0<br />
Final 67.0 53.5<br />
Preference shares 30.8 17.3<br />
Interim 8.7 5.0<br />
Final 22.1 12.3<br />
80
Nondistributable<br />
reserves<br />
Foreign<br />
currency<br />
translation<br />
reserve<br />
Share-based<br />
payment<br />
reserve<br />
Distributable reserves<br />
Financial<br />
instrument<br />
revaluation<br />
reserve<br />
Retained<br />
profit<br />
Shareholders’<br />
interest before<br />
non-controlling<br />
interest<br />
Non-controlling<br />
interest<br />
Rm Rm Rm Rm Rm Rm Rm<br />
280 133 6 3 881 3 526 52 3 578<br />
– – – – 26 – 26<br />
– – – – (317) – (317)<br />
– – – (5) (5) – (5)<br />
– – – (891) – – –<br />
– – – (1 399) (1 399) (6) (1 405)<br />
– 70 – – 70 – 70<br />
(73) – (51) 1 248 1 124 1 1 125<br />
207 203 (45) 2 834 3 025 47 3 072<br />
– – – – 47 – 47<br />
– – – – (410) – (410)<br />
– – – (1) (1) – (1)<br />
– – – (12) (718) (7) (725)<br />
– 149 – – 149 – 149<br />
11 – 35 1 258 1 304 17 1 321<br />
218 352 (10) 4 079 3 396 57 3 453<br />
Total<br />
81
GROUP STATEMENT OF CASH FLOWS<br />
52 weeks 52 weeks<br />
to 27 June <strong>2010</strong> to 28 June 2009<br />
Note Rm Rm<br />
Cash flow from operating activities<br />
Cash inflow from trading 33.1 2 220 1 652<br />
Working capital movements 33.2 215 67<br />
Cash from financial services assets – 21<br />
Cash generated by operating activities 2 435 1 740<br />
Interest received 167 548<br />
Finance costs paid (152) (312)<br />
Tax paid 33.3 (367) (370)<br />
Cash generated by operations 2 083 1 606<br />
Dividends received from associate 1 1<br />
Dividends received from joint ventures 35 –<br />
Distributions to shareholders 33.4 (725) (655)<br />
Net cash inflow from operating activities 1 394 952<br />
Cash flow from investing activities<br />
Investment in property, plant and equipment and intangible assets<br />
to maintain operations (267) (537)<br />
Investment in property, plant and equipment and intangible assets<br />
to expand operations (332) (168)<br />
Proceeds on disposal of property, plant and equipment 56 91<br />
Proceeds on disposal of controlling interest in subsidiaries 36 – 875<br />
Replacement of WFS debt funding by joint venture partner – 2 909<br />
Cash disposed of on sale of controlling interest in subsidiaries 36 – (535)<br />
Costs incurred on disposal of controlling interest in subsidiaries 36 – (48)<br />
Participation in export partnerships 1 1<br />
Loans and advances to employees and share scheme participants 38 37<br />
Contributions paid to post-retirement medical benefit (10) –<br />
Net cash (outflow)/inflow from investing activities (514) 2 625<br />
Cash flow from financing activities<br />
Shares issued 47 26<br />
Repurchase of treasury shares 20 (410) (317)<br />
Special dividend to shareholders 33.4 – (750)<br />
Share repurchase transaction costs (1) (5)<br />
Payment of finance lease liabilities (20) (9)<br />
Short-term borrowings raised 20 –<br />
Net cash outflow from financing activities (364) (1 055)<br />
Increase in cash and cash equivalents 516 2 522<br />
Net cash and cash equivalents at the beginning of the period 2 391 (91)<br />
Effect of foreign exchange rate changes 10 (40)<br />
Net cash and cash equivalents at the end of the period 33.5 2 917 2 391<br />
82
NOTES<br />
TO THE GROUP ANNUAL FINANCIAL STATEMENTS<br />
1. SIGNIFICANT<br />
ACCOUNTING POLICIES<br />
The consolidated annual financial<br />
statements of <strong>Woolworths</strong> <strong>Holdings</strong><br />
<strong>Limited</strong> (the company) for the 52 weeks<br />
ended 27 June <strong>2010</strong> comprise the<br />
company, its subsidiaries, joint ventures<br />
and associate (together referred to as<br />
(“the group”).<br />
STATEMENT OF COMPLIANCE<br />
The consolidated annual financial<br />
statements have been prepared<br />
in accordance with International<br />
Financial Reporting Standards (IFRS)<br />
and its interpretations adopted by the<br />
International Accounting Standards<br />
Board (IASB), and the South African<br />
Companies Act (No. 61 of 1973),<br />
as amended.<br />
BASIS OF PREPARATION<br />
The annual financial statements are<br />
prepared on the historical cost basis,<br />
except where otherwise indicated.<br />
The accounting policies set out below<br />
have been consistently applied<br />
to all periods presented in these<br />
consolidated financial statements,<br />
except where the group has adopted<br />
the IFRS and IFRIC interpretations and<br />
amendments listed below that became<br />
effective during the period. These<br />
interpretations and amendments had<br />
no material impact on the <strong>report</strong>ed<br />
results. Where applicable, additional<br />
disclosures for the current and<br />
comparative periods were provided.<br />
IFRS and IFRIC interpretations that are<br />
not applicable to the group were<br />
not adopted.<br />
– IFRS 8 Operating Segments<br />
(effective 1 January 2009)<br />
This standard follows management’s<br />
approach to segmental <strong>report</strong>ing<br />
and emphasizes disclosure of<br />
measures used to manage the<br />
business, in place of the rigidly<br />
defined disclosures required by<br />
IAS 14. A single set of operating<br />
segments replaces the primary<br />
and secondary segments. IFRS 8<br />
disclosures are shown in note 39,<br />
including the related revised,<br />
comparative information.<br />
– IAS 1 (Revised) Presentation<br />
of Financial Statements<br />
(effective 1 January 2009)<br />
The revised standard introduces<br />
a new statement of comprehensive<br />
income which combines all items of<br />
income and expense recognised<br />
in profit or loss together with<br />
non‐owner-related items previously<br />
accounted for directly in the<br />
statement of changes in equity.<br />
Only the summarised information on<br />
results for the period and the details<br />
of transactions with owners (such<br />
as share issues, share repurchases<br />
and dividend distributions) will<br />
be presented in the statement of<br />
changes in equity. When an entity<br />
restates its financial statements<br />
or retrospectively applies a new<br />
accounting policy, or when the<br />
presentation or classification of<br />
items leading to a reclassification of<br />
comparatives is made, an opening<br />
statement of financial position as<br />
at the beginning of the earliest<br />
comparative period must be<br />
presented. The group has elected<br />
to present one statement.<br />
– IFRS 7 (Revised) Financial<br />
Instruments: Disclosures<br />
– amendment (effective<br />
1 January 2009)<br />
The amendments to IFRS 7 require<br />
an entity to classify financial<br />
instruments measured at fair<br />
value using a fair-value hierarchy<br />
that reflects the significance of<br />
the inputs used in making the<br />
measurements. In addition, liquidity<br />
risk disclosure has been enhanced<br />
whereby a maturity analysis is<br />
required for non-derivative financial<br />
liabilities that shows the remaining<br />
contractual maturities, and for<br />
derivative financial liabilities based<br />
on information presented to key<br />
management. Liquidity information<br />
for derivative liabilities is based on<br />
remaining contractual maturities<br />
essential to understand the<br />
cash flows.<br />
The following amendments have been<br />
early adopted by the group, but had no<br />
material impact on the <strong>report</strong>ed results.<br />
– IFRS 8 Operating Segments<br />
– amendment (effective<br />
1 January <strong>2010</strong>)<br />
The amendment clarifies that<br />
segment assets and liabilities<br />
need only be <strong>report</strong>ed when those<br />
assets and liabilities are included in<br />
measures that are used by the chief<br />
operating decision maker.<br />
The group’s chief operating decision<br />
maker reviews the Clothing and<br />
General Merchandise (C&GM) and<br />
Foods segments in aggregate. This<br />
is disclosed in note 39.<br />
– IAS 36 Impairment of Assets<br />
– amendment (effective<br />
1 January <strong>2010</strong>)<br />
For the purpose of impairment<br />
testing, goodwill acquired in<br />
a business combination is required<br />
to be allocated to cash-generating<br />
units and these units shall not be<br />
larger than an operating segment<br />
prior to aggregation as allowed<br />
by IFRS 8.<br />
The group has not applied various<br />
IFRS and IFRIC interpretations that have<br />
been issued but are not yet effective.<br />
The adoption of these IFRS and IFRIC<br />
interpretations will be adopted no later<br />
than the effective date. These are as<br />
follows, excluding those that are not<br />
relevant to the group:<br />
83
NOTES<br />
TO THE GROUP ANNUAL FINANCIAL STATEMENTS<br />
– Improvements to IFRSs<br />
(effective between<br />
1 January <strong>2010</strong> and<br />
1 January 2011)<br />
In April 2009 and May <strong>2010</strong>, the IASB<br />
issued amendments to various IFRSs,<br />
primarily with a view to removing<br />
inconsistencies and clarifying<br />
wording.<br />
– IFRS 3 (Revised) Business<br />
Combinations (effective<br />
1 July <strong>2010</strong>)<br />
The option to measure noncontrolling<br />
interests either at fair<br />
value or proportionate share of<br />
the acquiree’s net identifiable<br />
assets at the acquisition date<br />
applies only to non-controlling<br />
interests that are present ownership<br />
interests and entitle their holders<br />
to a proportionate share of the<br />
acquiree’s net assets in the event of<br />
liquidation. All other components<br />
of non-controlling interests should<br />
be measured at their acquisition<br />
date fair value, unless another<br />
measurement basis is required<br />
by IFRS.<br />
– IFRS 7 Financial Instruments<br />
Disclosures (effective<br />
1 January 2011)<br />
Encourages qualitative<br />
disclosures in the context of the<br />
quantitative disclosure to help<br />
users to form an overall picture<br />
of the nature and extent of risks<br />
arising from financial instruments.<br />
Clarifies the required level of<br />
disclosure around credit risk and<br />
collateral held and provides relief<br />
from disclosure of renegotiated<br />
financial assets.<br />
– IAS 1 Presentation of<br />
Financial Statements<br />
(effective 1 January 2011)<br />
An entity may present the analysis<br />
of other comprehensive income<br />
by item either in the statement of<br />
changes in equity or in the notes<br />
to the financial statements.<br />
– IFRIC 13 Customer Loyalty<br />
Programmes (effective<br />
1 January 2011)<br />
The fair value of award credits<br />
should take into account the<br />
amount of discounts or incentives<br />
that would otherwise be offered<br />
to customers who have not<br />
earned award credits from an<br />
initial sale and any expected<br />
forfeitures.<br />
– IFRS 9 Financial Instruments<br />
(effective 1 January 2013)<br />
On 12 November 2009, the IASB<br />
issued IFRS 9 Financial Instruments<br />
as the first step in its project to<br />
replace IAS 39 Financial Instruments:<br />
Recognition and Measurement.<br />
IFRS 9 introduces new requirements<br />
for classifying and measuring<br />
financial assets that must be<br />
applied. The IASB intends to expand<br />
IFRS 9 to add new requirements<br />
for classifying and measuring<br />
financial liabilities, derecognition<br />
of financial instruments, impairment,<br />
and hedge accounting. The current<br />
version of IFRS 9 could impact the<br />
classification and measurement of<br />
financial assets.<br />
– IAS 24 Related Party<br />
Disclosures (effective<br />
1 January 2011)<br />
The amendment simplifies the<br />
disclosure requirements for<br />
government-related entities and<br />
clarifies the definition of a related<br />
party. IAS 24 requires entities to<br />
disclose in their financial statements<br />
information about transactions with<br />
related parties. In broad terms, two<br />
parties are related to each other if<br />
one party controls, or significantly<br />
influences, the other party.<br />
The group expects that adoption of the<br />
pronouncements listed above will have<br />
no material financial impact on the<br />
<strong>report</strong>ed results in the period of<br />
initial application. However, the<br />
group will comply with the additional<br />
disclosure requirements resulting from<br />
such initial application.<br />
BASIS OF CONSOLIDATION<br />
The group consolidates all of its<br />
subsidiaries. Accounting policies<br />
are applied consistently in all<br />
group companies.<br />
The results of subsidiaries are<br />
included from the effective date of<br />
acquisition up to the effective date<br />
of disposal. All subsidiaries, with the<br />
exception of the <strong>Woolworths</strong> <strong>Holdings</strong><br />
Share Trust and the <strong>Woolworths</strong><br />
Employee Share Ownership Trust, have<br />
financial periods ending 27 June <strong>2010</strong><br />
and are consolidated to that date.<br />
The results of subsidiaries with period<br />
ends differing from that of the group<br />
are compiled for a rolling twelvemonth<br />
period ending 27 June <strong>2010</strong><br />
and consolidated to that date.<br />
All intragroup balances, transactions,<br />
income and expenses and profit<br />
and losses resulting from intragroup<br />
transactions are eliminated in full.<br />
A change in the ownership interest<br />
of a subsidiary, without a change<br />
of control, is accounted for as an<br />
equity transaction.<br />
Losses are attributed to the noncontrolling<br />
interest even if that results<br />
in a deficit balance.<br />
The company carries its investments in<br />
subsidiaries at cost less accumulated<br />
impairment losses.<br />
FOREIGN CURRENCY<br />
TRANSLATIONS<br />
The presentation and functional<br />
currency of the group and the company<br />
financial statements is the South<br />
African rand.<br />
84
Foreign currency transactions are<br />
recorded at the exchange rates ruling<br />
on the transaction dates. Monetary<br />
assets and liabilities designated in<br />
foreign currencies are subsequently<br />
translated at rates of exchange ruling<br />
at the <strong>report</strong>ing date, gains and losses<br />
thereon are recognised in the statement<br />
of comprehensive income.<br />
Upon settlement, foreign currency<br />
monetary assets and liabilities are<br />
translated at the rates of exchange<br />
ruling at the settlement date and<br />
resulting gains and losses are<br />
recognised in the statement of<br />
comprehensive income.<br />
Non-monetary assets and liabilities<br />
are consistently translated at rates of<br />
exchange ruling at acquisition date.<br />
Foreign operations are translated<br />
from their functional currency into<br />
rand at the rates of exchange ruling<br />
at the <strong>report</strong>ing date in respect of<br />
statement of financial position items<br />
and at an average rate per month in<br />
respect of statement of comprehensive<br />
income items. Gains and losses on the<br />
translation of foreign operations are<br />
recognised directly in equity.<br />
Translation gains and losses arising<br />
on loans which form part of the net<br />
investment in the foreign operation<br />
are <strong>report</strong>ed in the statement of<br />
comprehensive income in the company<br />
extending or receiving the loan. In the<br />
consolidated financial statements they<br />
are carried in equity until realised, and<br />
they are recognised in the statement of<br />
comprehensive income.<br />
PROPERTY, PLANT AND<br />
EQUIPMENT<br />
All items of property, plant and<br />
equipment are initially recognised<br />
at cost which includes any costs<br />
directly attributable to bringing the<br />
asset to the location and condition<br />
necessary for it to be capable of<br />
operating in the manner intended<br />
by management.<br />
The cost of an item of property, plant<br />
and equipment is recognised as<br />
an asset if it is probable that future<br />
economic benefits associated with the<br />
item will flow to the group and the cost<br />
of the item can be measured reliably.<br />
Subsequent to initial recognition,<br />
buildings and leasehold improvements<br />
are shown at cost less accumulated<br />
depreciation and any impairment in value.<br />
Land is measured at cost, less any<br />
impairment in value. The property<br />
portfolio is valued internally on an<br />
annual basis and every three years<br />
by independent valuers for additional<br />
disclosure purposes. Furniture, fittings,<br />
motor vehicles and computers are<br />
shown at cost less accumulated<br />
depreciation and any impairment<br />
in value.<br />
Subsequent expenditure including the<br />
cost of replacing parts of the asset,<br />
other than day-to-day servicing costs,<br />
are included in the cost of the asset<br />
when incurred if it is probable that<br />
such expenditure will result in future<br />
economic benefits associated with<br />
the item flowing to the company, and<br />
the cost is reliably measurable.<br />
An asset is depreciated from the time<br />
that it is available for use. Depreciation<br />
of an asset ceases at the earlier of<br />
the date the asset (or disposal group<br />
into which the asset falls) is classified<br />
as held for sale or included in a<br />
discontinued operation in accordance<br />
with IFRS 5 and the date that the asset<br />
is derecognised.<br />
The depreciable amount of an asset,<br />
being the cost of the asset less the<br />
residual value, is allocated on a<br />
straight-line basis over the estimated<br />
useful life of the asset. Residual value<br />
is the estimated amount that an<br />
entity would currently obtain from<br />
disposal of the asset, after deducting<br />
the estimated costs of disposal, if the<br />
asset were already of the age and in<br />
the condition expected at the end of<br />
its useful life. Whilst residual value is<br />
equal to or exceeds the carrying value,<br />
depreciation is discontinued.<br />
Each part of an item of property, plant<br />
and equipment with a cost which is<br />
significant in relation to the total cost<br />
of the item is depreciated separately.<br />
The residual values, useful lives and<br />
depreciation methods applied to<br />
assets are reviewed at each financial<br />
period end based on relevant market<br />
information and management<br />
consideration.<br />
Useful lives per asset category:<br />
Buildings 15 to 40 years<br />
Leasehold<br />
improvements<br />
Furniture, fittings<br />
and equipment<br />
Computers<br />
Motor vehicles<br />
Written off over<br />
the lease period<br />
or shorter period<br />
if appropriate<br />
2 to 15 years<br />
3 to 7 years<br />
5 years<br />
An item of property, plant and<br />
equipment is derecognised upon<br />
disposal or when no future economic<br />
benefits are expected from its use or<br />
disposal. Any gain or loss arising on<br />
derecognition of the asset is included in<br />
the statement of comprehensive income<br />
in other operating costs in the period<br />
the asset is derecognised.<br />
Items of property, plant and equipment<br />
are assessed for impairment as<br />
detailed in the accounting policy<br />
note on impairment.<br />
85
NOTES<br />
TO THE GROUP ANNUAL FINANCIAL STATEMENTS<br />
INTANGIBLE ASSETS<br />
Intangible assets are initially<br />
recognised at cost, if acquired<br />
separately, or at fair value if acquired<br />
as part of a business combination.<br />
After initial recognition, intangible<br />
assets are carried at cost less any<br />
accumulated amortisation and<br />
accumulated impairment losses.<br />
Internally generated intangible assets,<br />
excluding capitalised development<br />
costs, are not capitalised but expensed<br />
in the statement of comprehensive<br />
income in the period during which<br />
the expenses are incurred. Other than<br />
goodwill, all of the group’s intangible<br />
assets are assessed as having finite<br />
useful lives. The group’s intangible<br />
assets are amortised over their useful<br />
lives using a straight-line basis.<br />
Computer software is amortised over<br />
a period between five and ten years.<br />
Amortisation commences when the<br />
intangible assets are available for their<br />
intended use. The amortisation period<br />
and method for intangible assets with<br />
finite useful lives are reviewed annually.<br />
Changes in the expected useful life or<br />
the expected pattern of consumption of<br />
future economic benefits embodied in<br />
the asset is accounted for by changing<br />
the amortisation period or method, as<br />
appropriate, and treated as changes<br />
in accounting estimates.<br />
The residual value of an intangible<br />
asset may increase to an amount<br />
equal to or greater than the asset’s<br />
carrying amount. Whilst residual value<br />
exceeds carrying value, amortisation<br />
is discontinued.<br />
The residual value of an intangible<br />
asset shall be zero unless there is<br />
a commitment by a third party to<br />
purchase the asset at the end of its<br />
useful life or if the residual value can<br />
be determined by reference to an<br />
active market and it is probable that<br />
the market will still exist at the end of<br />
the asset’s useful life.<br />
Amortisation shall cease at the earlier<br />
of the date that the asset is classified<br />
as held for sale (or is included in<br />
a disposal group that is classified<br />
as held for sale), or the date that the<br />
asset is derecognised.<br />
Subsequent expenditure on intangible<br />
assets is capitalised if it is probable<br />
that future economic benefits<br />
attributable to the asset will flow to<br />
the group and the expenditure can be<br />
reliably measured. Intangible assets<br />
are derecognised upon disposal or<br />
where no future economic benefits<br />
are expected. Gains or losses arising<br />
from derecognition of an intangible<br />
asset are measured as the difference<br />
between the net disposal proceeds and<br />
the carrying amount of the asset. These<br />
gains and losses are recognised in the<br />
statement of comprehensive income<br />
when the asset is derecognised.<br />
Intangible assets are tested for<br />
impairment if indications of impairment<br />
exists. For impairment of intangible<br />
assets, refer to the policy on impairment<br />
of non-financial assets.<br />
Computer software<br />
Computer software acquired from<br />
external suppliers is initially recognised<br />
at cost.<br />
Computer software development costs<br />
are capitalised if the recognition criteria<br />
outlined below under ’research and<br />
development’ are met.<br />
Research and development<br />
Research costs are expensed<br />
as incurred.<br />
Development costs are recognised<br />
as an expense in the period in<br />
which they are incurred unless the<br />
technical feasibility of the asset has<br />
been demonstrated and the intention<br />
to complete and utilise the asset is<br />
confirmed. Capitalisation commences<br />
when it can be demonstrated how<br />
the intangible asset will generate<br />
probable future economic benefits, that<br />
it is technically feasible to complete<br />
the asset, that the intention and ability<br />
to complete and use the asset exists,<br />
that adequate financial, technical<br />
and other resources to complete<br />
the development are available and<br />
the costs attributable to the process or<br />
product can be separately identified<br />
and measured reliably.<br />
Goodwill<br />
Goodwill on acquisitions of subsidiaries<br />
is recognised as an asset and initially<br />
measured at cost.<br />
After initial recognition, goodwill<br />
on acquisitions of subsidiaries is<br />
measured at cost less any accumulated<br />
impairment losses. Goodwill is<br />
allocated to cash-generating units for<br />
the purpose of impairment testing. The<br />
allocation can be made to a single<br />
cash-generating unit or a group of<br />
cash-generating units.<br />
Goodwill is tested for impairment at<br />
every financial period end or more<br />
frequently if events or changes in<br />
circumstances indicate that the carrying<br />
value may be impaired.<br />
Impairment is determined by assessing<br />
the recoverable amount of the cashgenerating<br />
unit to which the goodwill<br />
is allocated. Where the cashgenerating<br />
unit’s recoverable<br />
amount is less than its carrying value,<br />
an impairment loss is recognised.<br />
An impairment loss for goodwill cannot<br />
be reversed in future periods.<br />
86
The group performs its annual<br />
impairment test of goodwill at<br />
period end.<br />
Goodwill on acquisitions of equity<br />
accounted associates and joint<br />
ventures is included in the investments<br />
in associates or joint ventures and<br />
tested for impairment as part of the<br />
carrying value of the investment.<br />
Goodwill recognised on the acquisition<br />
of the associate or joint ventures<br />
(equity accounted) is calculated as<br />
the difference between the cost of<br />
the investment and the fair value of the<br />
proportionate net assets obtained.<br />
Any excess of the fair value of the<br />
proportionate net assets acquired<br />
over the cost of the investment is<br />
included in the profit or loss of the<br />
investor, in the period when acquired,<br />
as part of the proportionate share in<br />
the associate or joint ventures’ profit<br />
after tax.<br />
When part of a cash-generating unit<br />
that contains goodwill is disposed<br />
of, the goodwill associated with the<br />
operation disposed of is included in<br />
the carrying amount of the operation<br />
in determining the gain or loss on<br />
disposal. Goodwill disposed of in this<br />
manner is measured on the relative<br />
values of the operation disposed of<br />
and the portion of the cash-generating<br />
unit retained.<br />
BUSINESS COMBINATIONS<br />
All business combinations are<br />
accounted for by applying the<br />
acquisition method. Goodwill can arise<br />
on the acquisition of businesses and<br />
subsidiaries and represents the excess<br />
of the fair value of the consideration<br />
paid for the business consideration, the<br />
fair value of any existing interests and<br />
the value of non-controlling interest<br />
over the fair value of the net assets<br />
acquired. Any gain from a bargain<br />
purchase is recognised in profit or<br />
loss immediately. The fair value of<br />
the consideration paid is the fair value<br />
at the date of exchange of the assets<br />
given, liabilities incurred or assumed,<br />
and equity instruments issued by<br />
the group, in exchange for control of<br />
the acquiree. Acquisition costs incurred<br />
are expensed.<br />
INVESTMENT PROPERTIES<br />
Investment properties are land and<br />
buildings which are held either to<br />
earn rental income or for capital<br />
appreciation, or both.<br />
Investment properties are initially<br />
recognised at cost, including<br />
transaction costs, when it is probable<br />
that future economic benefits<br />
associated with the investment property<br />
will flow to the group and the cost of<br />
the investment property can be<br />
measured reliably.<br />
The cost of a purchased investment<br />
property comprises its purchase<br />
price and any directly attributable<br />
expenditure.<br />
The cost of a self-constructed<br />
investment property is its cost at<br />
the date when the construction<br />
development is complete.<br />
Investment properties are<br />
accounted for under the cost model<br />
and the accounting treatment<br />
after initial recognition follows that<br />
applied to property, plant and<br />
equipment.<br />
Investment properties are derecognised<br />
when either they have been disposed<br />
of or when the investment property is<br />
permanently withdrawn from use and<br />
no future economic benefit is expected<br />
from its disposal.<br />
Any gains or losses on the retirement<br />
or disposal of an investment property<br />
are recognised in the statement<br />
of comprehensive income in other<br />
operating costs in the period of<br />
retirement or disposal. Transfers are<br />
made to or from investment properties<br />
when there is a change in use of the<br />
property. Transfers are also made<br />
from investment properties when the<br />
carrying amount will be recovered<br />
principally through a sale transaction.<br />
PREPAID EMPLOYMENT<br />
COSTS<br />
Prepaid employment costs are<br />
recognised when loans are granted to<br />
employees in terms of the group’s share<br />
purchase scheme. The favourable terms<br />
on which the loans are granted create<br />
an enduring benefit to the group in the<br />
form of incentivised staff.<br />
Prepaid employment costs are initially<br />
recognised at an amount equal to<br />
the fair-value adjustment on initial<br />
recognition of the share loans that give<br />
rise to the prepayment.<br />
These costs are amortised to the<br />
statement of comprehensive income<br />
over the period in which services are<br />
rendered by employees.<br />
TAXES<br />
Current tax<br />
Current tax assets and liabilities for the<br />
current and prior periods are measured<br />
at the amount expected to be<br />
recovered or paid to the tax authorities.<br />
The tax rates and laws used to<br />
compute the amount are those<br />
enacted or substantively enacted at<br />
the <strong>report</strong>ing date.<br />
Current tax assets and liabilities are<br />
offset if the company has a legally<br />
enforceable right to offset the<br />
recognised amounts and it intends<br />
to settle on a net basis, or to realise<br />
the asset and settle the liability<br />
simultaneously.<br />
87
NOTES<br />
TO THE GROUP ANNUAL FINANCIAL STATEMENTS<br />
Deferred tax<br />
Deferred tax is provided on the<br />
statement of financial position liability<br />
basis on the temporary differences<br />
at the <strong>report</strong>ing date between the<br />
carrying values, for financial <strong>report</strong>ing<br />
purposes, and tax bases of assets<br />
and liabilities.<br />
Deferred tax assets are recognised<br />
for deductible temporary differences<br />
to the extent that it is probable that<br />
future taxable profit will allow the<br />
deferred tax asset to be utilised,<br />
unless the deferred tax arises from<br />
the initial recognition of an asset or<br />
liability in a transaction that is not<br />
a business combination, and at the<br />
time of the transaction affects neither<br />
accounting nor taxable profit or loss.<br />
In respect of deductible temporary<br />
differences associated with<br />
investment in subsidiaries, associate<br />
and interests in joint ventures,<br />
deferred tax assets are recognised<br />
only to the extent that it is probable<br />
that the temporary differences will<br />
reverse in the foreseeable future and<br />
that taxable profit will be available<br />
against which the temporary<br />
differences will be utilised.<br />
Deferred tax assets are reviewed at<br />
each <strong>report</strong>ing date and reduced<br />
to the extent that it is no longer probable<br />
that sufficient future taxable income will<br />
be available for utilisation of the asset.<br />
Deferred tax liabilities are recognised<br />
for taxable temporary differences<br />
except where the deferred tax<br />
liability arises from the initial<br />
recognition of goodwill, or the<br />
initial recognition of an asset or<br />
liability in a transaction that is not<br />
a business combination and at<br />
the time of the transaction affects<br />
neither accounting nor taxable<br />
profit or loss. In respect of taxable<br />
temporary differences associated<br />
with investment in subsidiaries,<br />
associate and interests in joint<br />
ventures, deferred tax liabilities are<br />
not recognised when the timing of the<br />
reversal of the temporary differences<br />
can be controlled and it is probable<br />
that the temporary differences will<br />
not reverse in the foreseeable future.<br />
Deferred tax assets and liabilities are<br />
measured at tax rates that are expected<br />
to apply to the period when the asset<br />
is realised or the liability settled,<br />
based on tax rates and tax laws that<br />
have been enacted or substantively<br />
enacted at the <strong>report</strong>ing date.<br />
The measurement of deferred tax<br />
assets and liabilities reflect the<br />
tax consequences that would follow<br />
from the manner in which the group<br />
expects, at the <strong>report</strong>ing date,<br />
to recover or settle the carrying<br />
values of its assets and liabilities.<br />
Current and deferred tax is credited<br />
or charged directly to equity and<br />
other comprehensive income<br />
if it relates to items credited or<br />
charged directly to equity and other<br />
comprehensive income.<br />
Deferred tax assets and liabilities<br />
are offset if the company has a<br />
legally enforceable right to set off<br />
current tax assets against current<br />
tax liabilities, and the deferred tax<br />
assets and liabilities relate to income<br />
taxes levied by the same taxation<br />
authority on the same taxable entity,<br />
or different taxable entities that<br />
intend to settle current tax assets and<br />
liabilities on a net basis, or realise<br />
the asset and settle the liability<br />
simultaneously, in each future period<br />
in which significant amounts of<br />
deferred tax liabilities or assets are<br />
expected to be settled or recovered.<br />
Secondary Tax on<br />
Companies (STC)<br />
STC, including STC arising on the<br />
repurchase by the company of its<br />
own equity instruments, is accounted<br />
for as part of the tax charge in the<br />
statement of comprehensive income<br />
and not as a deduction directly from<br />
equity, in the same period as the<br />
related dividend.<br />
CURRENT ASSETS AND<br />
LIABILITIES<br />
Current assets and liabilities have<br />
maturity terms of less than 12 months<br />
or are expected to be settled in the<br />
group’s normal operating cycle.<br />
INVENTORIES<br />
Merchandise, raw materials and<br />
consumables are initially recognised<br />
at cost, determined using the weighted<br />
average cost formula.<br />
Subsequent to initial recognition,<br />
inventories are measured at the lower<br />
of cost and net realisable value. Net<br />
realisable value of merchandise is<br />
the estimated selling price in the<br />
ordinary course of business, less<br />
estimated costs necessary to make<br />
the sale. Management estimate,<br />
based on their assessment of<br />
quality and volume, the extent to<br />
which merchandise on hand at<br />
the <strong>report</strong>ing date will be sold<br />
below cost.<br />
Raw materials and consumables held<br />
for use in the production of inventories<br />
are not written down below cost if the<br />
finished products in which they will be<br />
incorporated are expected to be sold<br />
at or above cost.<br />
The carrying amount of inventories<br />
sold is recognised as an expense in<br />
the period in which the related revenue<br />
is recognised.<br />
88
LEASES<br />
Finance leases are leases whereby<br />
substantially all the risks and rewards of<br />
ownership are transferred to the lessee.<br />
Assets acquired in terms of finance<br />
leases are capitalised and depreciated<br />
over the shorter of the useful life of<br />
the asset and the lease period, with<br />
a corresponding liability raised on the<br />
statement of financial position. The<br />
asset and liability are recognised at<br />
the commencement date at the lower<br />
of the fair value of the leased asset or<br />
the present value of the minimum lease<br />
payments calculated using the interest<br />
rate implicit in the lease at the inception<br />
of the lease. Any initial direct costs<br />
incurred are added to the amount<br />
recognised as an asset.<br />
Related finance costs are charged<br />
to income over the period of the<br />
lease using the effective interest<br />
rate method.<br />
Leases where the lessor retains<br />
substantially all the risks and benefits<br />
of ownership of the asset are classified<br />
as operating leases.<br />
Operating lease expenses and income<br />
with fixed escalation clauses (net of<br />
any incentive received from the lessor<br />
or incentives given to the lessee)<br />
are recognised in the statement of<br />
comprehensive income on a straightline<br />
basis over the lease term. The<br />
resulting difference arising from the<br />
straight-line basis and contractual cash<br />
flows is recognised as an operating<br />
lease obligation or asset.<br />
Contingent rental escalations, such as<br />
those relating to turnover, are expensed<br />
in the period in which the escalation<br />
is determined.<br />
SHORT-TERM EMPLOYEE<br />
BENEFITS<br />
Short-term employee benefits include<br />
salaries, bonuses, allowances and<br />
other fringe benefits.<br />
Short-term employee benefit<br />
obligations are measured on an<br />
undiscounted basis and are expensed<br />
as the related service is provided.<br />
A provision is recognised for the<br />
amount expected to be paid if<br />
the group has a present legal or<br />
constructive obligation to pay the<br />
amount and the obligation can be<br />
estimated reliably.<br />
RETIREMENT BENEFITS<br />
Current contributions to defined<br />
contribution retirement funds are based<br />
on a percentage of the pensionable<br />
payroll and are recognised as an<br />
employee benefit expense when<br />
they are due.<br />
The group has no further payment<br />
obligations once the contributions<br />
are paid.<br />
The group has an obligation to<br />
provide certain post-employment<br />
medical benefits to certain employees<br />
and pensioners.<br />
The calculated cost arising in respect<br />
of post-retirement medical benefits<br />
is charged to the statement of<br />
comprehensive income as services<br />
are rendered by employees. The<br />
present value of future medical benefit<br />
subsidies for past and current service<br />
is determined in accordance with<br />
IAS 19 Employee Benefits using actuarial<br />
valuation models.<br />
The cost of providing benefits under the<br />
plan is determined using the projected<br />
unit credit valuation method. Plan assets<br />
are assets which can only be used to<br />
satisfy the obligations of the fund<br />
and are measured at fair value.<br />
Actuarial gains and losses are<br />
recognised as income or expense<br />
when the cumulative unrecognised<br />
actuarial gains or losses at the end<br />
of the previous <strong>report</strong>ing period<br />
exceed 10% of the greater of the<br />
defined obligation and the fair value<br />
of the plan assets. The gains or losses<br />
are recognised over the expected<br />
average remaining working lives of the<br />
employees participating in the plan.<br />
Any curtailment benefits or settlement<br />
amounts are recognised against<br />
income as incurred.<br />
SHARE-BASED PAYMENT<br />
TRANSACTIONS<br />
Shares and rights to acquire shares<br />
granted to employees in terms of the<br />
group’s share incentive and black<br />
economic empowerment schemes,<br />
meet the definition of share-based<br />
payment transactions. Refer note 20<br />
for a detailed description of each of<br />
the schemes.<br />
For share-based payment transactions<br />
among group entities, in the separate<br />
financial statements, the entity receiving<br />
the goods or services shall measure<br />
the goods or services received as an<br />
equity-settled share-based payment<br />
transaction when the awards granted<br />
are its own equity instruments, or<br />
the entity has no obligation to settle<br />
the share-based payment transaction.<br />
In all other circumstances, the entity<br />
receiving the goods or services shall<br />
measure the goods or services as a<br />
cash-settled share-based payment<br />
transaction.<br />
The entity settling a share-based<br />
payment transaction when another<br />
entity in the group receives the<br />
89
NOTES<br />
TO THE GROUP ANNUAL FINANCIAL STATEMENTS<br />
goods or services shall recognise<br />
the transaction as an equity-settled<br />
share-based payment transaction<br />
only if it is settled in the entity’s own<br />
equity instruments. Otherwise, the<br />
transaction shall be recognised as<br />
a cash-settled share-based payment<br />
transaction.<br />
The equity-settled share-based<br />
payment programmes allow group<br />
employees to acquire shares in the<br />
company. The fair value of rights to<br />
acquire shares granted in the form<br />
of share options and convertible<br />
preference shares is recognised as<br />
an expense with a corresponding<br />
increase in equity.<br />
The fair value is measured at grant date<br />
and expensed over the period in which<br />
the employees become unconditionally<br />
entitled to these rights.<br />
The fair value of the grants are<br />
measured using option pricing models,<br />
taking into account the terms and<br />
conditions under which the rights to<br />
acquire the shares were granted.<br />
In valuing the grants, market conditions<br />
imposed, where applicable, on the<br />
vesting or exercisability of the share<br />
rights are taken into account.<br />
No adjustments to the cost of sharebased<br />
payment schemes are made<br />
if a market condition is not satisfied.<br />
Non-vesting conditions are treated<br />
similarly to market conditions and are<br />
only taken into account to determine<br />
the fair value at grant date of the equity<br />
instruments granted. Where an award<br />
does not vest as the result of a failure<br />
to meet a non-vesting condition within<br />
the control of either the entity or the<br />
counterparty, it is accounted for<br />
as a cancellation. However, failure to<br />
satisfy a non-vesting condition that<br />
is beyond the control of either party<br />
does not give rise to a cancellation.<br />
In such cases, the expense based on<br />
grant date fair value is still recognised<br />
over the vesting period unless a vesting<br />
condition is not met (whereby the<br />
award is forfeited).<br />
Where shares were granted at<br />
a discount to the ruling market price,<br />
the intrinsic value was expensed over<br />
the vesting period of the grant.<br />
Changes in estimates of the number of<br />
shares or rights to acquire shares that<br />
will ultimately vest are included in the<br />
charge for the period.<br />
No subsequent adjustments are made<br />
to total equity after the vesting date.<br />
Where the terms of an equity-settled<br />
award are modified, the minimum<br />
expense recognised is the amount<br />
measured at the grant date at the fair<br />
value of the equity instruments granted,<br />
unless those equity instruments do<br />
not vest because of failure to satisfy<br />
a vesting condition (other than<br />
a market condition) that was specified<br />
at grant date. In addition, the group<br />
recognises, over the remainder<br />
of the vesting period, the effects<br />
of modifications that increase the<br />
total fair value of the share-based<br />
payment arrangement or are otherwise<br />
beneficial to the employee as measured<br />
at the date of the modification.<br />
Where an equity-settled award is<br />
cancelled by the group, it is accounted<br />
for as an acceleration of the vesting<br />
of the awards. It is treated as if it had<br />
vested on the date of cancellation and<br />
any expense not yet recognised for<br />
the award is recognised immediately.<br />
However, if a new award is substituted<br />
for the cancelled award, and<br />
designated as a replacement award<br />
on the date that it is granted, the<br />
cancelled and new awards are treated<br />
as if they were a modification of the<br />
original award.<br />
Outstanding rights to acquire shares<br />
could result in share dilution in the<br />
computation of earnings per share<br />
(refer note 7).<br />
PROVISIONS<br />
Provisions are recognised when<br />
the group has a present legal or<br />
constructive obligation as a result of<br />
past events, for which it is probable that<br />
an outflow of economic benefits will be<br />
required to settle the obligation, and<br />
a reliable estimate can be made of the<br />
amount of the obligation. Where the<br />
effect of discounting to present value<br />
is material, provisions are adjusted to<br />
reflect the time value of money.<br />
FINANCIAL INSTRUMENTS<br />
Recognition and measurement<br />
Financial instruments are initially<br />
recognised on the statement of<br />
financial position when the group<br />
becomes party to the contractual<br />
provisions of the instrument. Financial<br />
assets and financial liabilities are<br />
initially measured at fair value,<br />
which includes directly attributable<br />
transaction costs in the case of financial<br />
assets and liabilities not at fair value<br />
through profit or loss. Subsequent<br />
measurement for each category is<br />
specified in the sections below.<br />
Derecognition of financial<br />
assets and financial liabilities<br />
A financial asset is derecognised<br />
where the right to receive cash from<br />
the asset has expired, or the group<br />
has transferred the asset and the<br />
transfer qualifies for derecognition.<br />
A transfer qualifying for derecognition<br />
occurs when the group transfers the<br />
contractual rights to receive the cash<br />
flows of the financial asset, or retains<br />
the rights but assumes a contractual<br />
obligation to pay those cash flows<br />
90
in full without material delay to<br />
a third party under a ’pass-through’<br />
arrangement, or where the group has<br />
transferred control or substantially all<br />
the risks and rewards of the asset.<br />
Where the group has transferred<br />
its rights to the cash flows from an<br />
asset and has neither transferred nor<br />
retained substantially all the risks and<br />
rewards of the asset nor transferred<br />
control of the asset, the asset is<br />
recognised to the extent of the group’s<br />
continuing involvement in the asset.<br />
A financial liability is derecognised<br />
when the obligation specified in the<br />
contract is discharged, cancelled<br />
or expired.<br />
An exchange between the group and<br />
an existing lender of debt instruments<br />
with substantially different terms or<br />
a substantial modification to an existing<br />
financial liability is accounted for as an<br />
extinguishment of the original financial<br />
liability and the recognition of a new<br />
financial liability.<br />
The resulting difference between<br />
the carrying value on derecognition<br />
of the financial instrument and the<br />
amount received or paid is taken to the<br />
statement of comprehensive income.<br />
Fair value<br />
The fair value of instruments traded in<br />
an active market is determined with<br />
reference to quoted market bid and<br />
ask prices at close of business on the<br />
<strong>report</strong>ing date.<br />
Where there is no active market, fair<br />
value is determined using valuation<br />
techniques. Such valuation techniques<br />
include using recent arm’s length<br />
market transactions, reference to<br />
current market value of other similar<br />
instruments, discounted cash flow<br />
analysis and option pricing models.<br />
The fair value of short-term receivables<br />
and payables with no stated interest<br />
rate may be measured at original<br />
invoice amount unless the effect of<br />
imputing interest is significant.<br />
Offset<br />
Where a legally enforceable right to<br />
offset exists for recognised financial<br />
assets and financial liabilities, and<br />
there is an intention to settle the liability<br />
and realise the asset simultaneously,<br />
or to settle on a net basis, such related<br />
financial assets and financial liabilities<br />
are offset.<br />
Financial assets<br />
The trade date method of accounting<br />
has been adopted for ’regular way’<br />
purchases or sales of financial assets.<br />
The group categorises its financial<br />
assets in the following categories:<br />
loans and receivables and at fair value<br />
through profit or loss.<br />
The classification depends on the<br />
purpose for which the financial assets<br />
are acquired. Management determines<br />
the classification of its financial assets<br />
at initial recognition.<br />
Loans and receivables<br />
After initial recognition, such assets<br />
are carried at amortised cost, using<br />
the effective interest method, less<br />
accumulated impairment.<br />
Gains and losses are recognised in<br />
income when the loans and receivables<br />
are derecognised or impaired, and<br />
through the amortisation process.<br />
The group has classified the following<br />
financial assets as loans and receivables:<br />
– Participation in export<br />
partnerships<br />
Amortised cost is the group’s cost of<br />
original participation less principal<br />
subsequent repayments received,<br />
plus the cumulative amortisation of<br />
the difference between the initial<br />
amount and the maturity amount,<br />
less any write-down for impairment<br />
or uncollectability.<br />
A corresponding deferred tax<br />
liability is recorded, equal to the<br />
cost of original participation<br />
together with the group’s share of<br />
the partnership gross profit less<br />
the group’s share of subsequent<br />
amounts received by the partnership.<br />
– Financial services assets<br />
Financial services assets comprise<br />
loans to customers, <strong>Woolworths</strong><br />
in-store card and credit card<br />
receivables. These assets are<br />
subsequently measured at<br />
amortised cost less provision<br />
for impairment estimated using<br />
statistical provisioning models. Refer<br />
note 18. On 1 October 2008, these<br />
assets were no longer consolidated<br />
due to the disposal of controlling<br />
interest in WFS. Refer note 36.<br />
– Other loans<br />
Other loans comprise housing and<br />
other employee loans as well as<br />
loans to participants in the group<br />
of share purchase schemes.<br />
– Trade and other receivables<br />
Trade and other receivables<br />
comprise all trade and non-trade<br />
debtors other than financial services<br />
debtors. Short-duration receivables<br />
with no stated interest rate are<br />
measured at original invoice<br />
amount unless the effect of imputing<br />
interest is significant.<br />
– Cash and cash equivalents<br />
Cash and cash equivalents<br />
comprise cash at banks and on<br />
hand as well as short-term deposits<br />
held at call with banks.<br />
91
NOTES<br />
TO THE GROUP ANNUAL FINANCIAL STATEMENTS<br />
– Financial assets at fair value<br />
through profit or loss<br />
Financial assets at fair value through<br />
profit or loss are financial assets<br />
held for trading or designated as<br />
at fair value through profit or loss.<br />
All derivative financial instruments<br />
are classified as financial assets<br />
or financial liabilities at fair value<br />
through profit or loss unless they are<br />
designated as a hedging instrument<br />
in an effective hedge.<br />
Derivatives are initially recognised<br />
at fair value on the date a derivative<br />
contract is entered into. After initial<br />
recognition, derivative financial<br />
instruments are measured at their<br />
fair values.<br />
Gains and losses arising on<br />
the change in the fair value of<br />
financial assets or liabilities at fair<br />
value through profit or loss are<br />
accounted for in the statement of<br />
comprehensive income.<br />
To the extent that a derivative<br />
instrument has a maturity period of<br />
longer than 12 months, the fair value<br />
of these instruments will be reflected<br />
as a non-current asset or liability.<br />
Financial liabilities<br />
Financial liabilities consist of interestbearing<br />
borrowings, trade and other<br />
payables, bank overdrafts and interestbearing<br />
money market borrowings,<br />
liabilities categorised at fair value<br />
through profit or loss (refer financial<br />
assets at fair value through profit or<br />
loss accounting policy) and derivatives<br />
held for hedging (refer accounting<br />
policy on hedge accounting).<br />
After initial recognition, financial<br />
liabilities are recognised at amortised<br />
cost, using the effective interest method,<br />
except for financial liabilities at fair<br />
value through profit or loss which are<br />
measured at fair value.<br />
Finance costs on financial liabilities at<br />
amortised cost are expensed in the<br />
statement of comprehensive income<br />
in the period in which they are<br />
incurred using the effective interest<br />
rate method.<br />
In addition, gains and losses on these<br />
financial liabilities are recognised in<br />
the statement of comprehensive income<br />
when the liability is derecognised.<br />
Gains and losses on financial liabilities<br />
at fair-value through profit or loss arise<br />
from fair value movements and related<br />
transaction costs on these liabilities.<br />
These gains and losses are recognised<br />
in the statement of comprehensive<br />
income in the period in which they<br />
are incurred.<br />
Financial guarantee contracts<br />
Financial guarantee contracts issued<br />
by the group are those contracts that<br />
require a payment to be made to<br />
reimburse the holder for a loss it incurs<br />
because the specified debtor fails to<br />
make a payment when it becomes due<br />
in accordance with the terms of a debt<br />
instrument.<br />
Financial guarantee contracts are<br />
recognised initially at fair value.<br />
Subsequently, the contract is measured<br />
at the higher of the amount determined<br />
in accordance with IAS 37 and the<br />
amount initially recognised less<br />
cumulative amortisation recognised<br />
in accordance with IAS 18, unless it<br />
was designated as at fair value<br />
through profit or loss at inception and<br />
measured as such.<br />
Financial guarantees are derecognised<br />
when the obligation is extinguished,<br />
expires or transferred.<br />
The group currently does not recognise<br />
any financial guarantee contracts<br />
as, in the opinion of the directors, the<br />
possibility of loss arising from these<br />
guarantees is remote.<br />
Hedge accounting<br />
The group designates certain<br />
derivatives as cash flow hedges. When<br />
a derivative is designated as a hedge,<br />
the group documents, at the inception<br />
of the transaction, the relationship<br />
between the hedging instruments and<br />
the hedged items, as well as its risk<br />
management objectives and strategy<br />
for undertaking various hedging<br />
transactions. The group also documents<br />
its assessment, both at hedge inception<br />
and on an ongoing basis, of whether<br />
the derivatives that are used in hedging<br />
transactions are highly effective in<br />
offsetting changes in cash flows of<br />
hedged items.<br />
Gains or losses on the effective<br />
portion of cash flow hedges in<br />
respect of a risk associated with<br />
a recognised asset or liability, or<br />
highly probable forecast transaction<br />
or firm commitment is recognised<br />
directly in equity. The gain or loss on<br />
the ineffective portion is recognised<br />
in the statement of comprehensive<br />
income in the period in which it<br />
arises. When a hedged forecast<br />
transaction is recognised as a nonfinancial<br />
asset or a non-financial<br />
liability, the cumulative gains and<br />
losses associated with the forecast<br />
transaction are removed from<br />
equity and included in the initial<br />
measurement of the non-financial<br />
asset or non-financial liability.<br />
When cash flow hedges result in the<br />
recognition of a financial asset or<br />
a financial liability, the cumulative<br />
gains or losses reflected in equity<br />
are included in the statement of<br />
comprehensive income in the same<br />
period in which the related asset or<br />
liability affects profit.<br />
If the forecast transaction or firm<br />
commitment is no longer expected to<br />
occur, amounts previously recognised<br />
in equity are transferred to the<br />
statement of comprehensive income.<br />
92
If the hedging instrument expires<br />
or is sold, or if its designation as a<br />
hedge is revoked, amounts previously<br />
recognised in equity remain in equity<br />
until the forecast transaction or firm<br />
commitment occurs.<br />
Derivative instruments not designated<br />
as hedging instruments or subsequently<br />
not expected to be effective hedges<br />
are classified as held for trading<br />
and recognised at fair value with<br />
the resulting gains or losses being<br />
recognised in the statement of<br />
comprehensive income in the period<br />
in which it arises.<br />
IMPAIRMENT<br />
Non-financial assets<br />
The carrying amount of the group’s<br />
assets, other than goodwill, inventories,<br />
joint ventures and deferred tax assets<br />
(see accounting policy note on each<br />
asset mentioned respectively), are<br />
reviewed at each <strong>report</strong>ing date for<br />
any indication of impairment. If such an<br />
indication exists, the asset’s recoverable<br />
amount is estimated.<br />
The recoverable amount is the<br />
higher of an asset’s fair value less<br />
costs to sell and its value in use. In<br />
assessing value in use, the estimated<br />
future cash flows are discounted to<br />
their present value using a pre-tax<br />
discount rate that reflects current<br />
market assessments of the time value<br />
of money and the risks specific to<br />
the asset. For an asset that does not<br />
generate largely independent cash<br />
inflows, the recoverable amount is<br />
determined for the cash-generating<br />
unit to which the asset belongs.<br />
The excess of an asset’s carrying<br />
amount over its recoverable amount<br />
is recognised as an impairment loss<br />
in the statement of comprehensive<br />
income.<br />
An impairment recognised previously<br />
may be reversed when estimates<br />
change as a result of an event<br />
occurring after the impairment was<br />
initially recognised.<br />
Such a reversal may not increase the<br />
carrying value above what it would<br />
have been had no impairment loss<br />
been recognised.<br />
A reversal of an impairment loss<br />
is recognised in the statement of<br />
comprehensive income.<br />
Financial assets<br />
The group assesses at each <strong>report</strong>ing<br />
date whether objective evidence exists<br />
that a financial asset or a group of<br />
financial assets is impaired.<br />
Assets carried at<br />
amortised cost<br />
If there is objective evidence that<br />
assets carried at amortised cost are<br />
impaired, the loss is measured as<br />
the difference between the asset’s<br />
carrying amount and present value<br />
of future cash flows discounted at its<br />
original effective interest rate. When<br />
impaired, the carrying amount of the<br />
asset is reduced through the use of a<br />
provision for impairment account, and<br />
the amount of the loss is recognised<br />
in the statement of comprehensive<br />
income. Assets together with the<br />
associated provision for impairment<br />
are written off when there is no<br />
realistic prospect of future recovery.<br />
The group first assesses whether<br />
objective evidence of impairment<br />
exists individually for financial assets<br />
that are individually significant, and<br />
individually or collectively for assets<br />
that are not individually significant.<br />
If it is determined that no objective<br />
evidence of impairment exists for<br />
an individually assessed financial<br />
asset, whether significant or not,<br />
the asset is included in a group of<br />
financial assets with similar credit<br />
risk characteristics and that group<br />
of financial assets is collectively<br />
assessed for impairment.<br />
Assets that are individually assessed<br />
and for which an impairment loss is<br />
or continues to be recognised are not<br />
included in a collective assessment<br />
of impairment.<br />
If, in a subsequent period, the amount of<br />
an impairment loss decreases due to an<br />
event occurring after recognition of the<br />
impairment, the previously recognised<br />
impairment loss is reversed. Such a<br />
reversal is recognised in the statement<br />
of comprehensive income to the extent<br />
that the carrying value of the asset<br />
does not exceed its amortised cost as<br />
if the asset has never been impaired at<br />
the reversal date.<br />
For certain categories of loans and<br />
receivables provisions for impairment<br />
are recognised based on the following<br />
considerations:<br />
– Financial services assets<br />
For financial services assets,<br />
provisions for impairment are<br />
estimated using statistical models.<br />
The models incorporate historic<br />
experience such as past write-offs<br />
and recoveries for each group of<br />
customers, adjusted for current<br />
economic situations such as current<br />
interest rates and inflation. Objective<br />
evidence of impairment exists when<br />
the group will not be able to collect<br />
all amounts due according to the<br />
original terms of the receivables.<br />
On 1 October 2008, these assets were<br />
no longer consolidated due to the<br />
disposal of controlling interest in<br />
WFS. Refer note 36.<br />
93
NOTES<br />
TO THE GROUP ANNUAL FINANCIAL STATEMENTS<br />
– Trade and other receivables<br />
For trade and other receivables,<br />
a provision for impairment is<br />
established when there is objective<br />
evidence that the group will not<br />
be able to collect all amounts due<br />
according to the original terms of the<br />
receivables. Indicators of impairment<br />
include long overdue accounts,<br />
significant financial difficulties of the<br />
debtors and defaults in payments.<br />
TREASURY SHARES<br />
Shares in <strong>Woolworths</strong> <strong>Holdings</strong><br />
<strong>Limited</strong> held by wholly owned<br />
group companies are classified<br />
as treasury shares. These shares<br />
are treated as a deduction from<br />
the issued and weighted average<br />
number of shares and the cost<br />
price of the shares is deducted from<br />
group equity. Distributions received<br />
on treasury shares are eliminated<br />
on consolidation. No gains or<br />
losses are recognised in the group<br />
statement of comprehensive income<br />
on the purchase, sale, issue or<br />
cancellation of treasury shares.<br />
INVESTMENT IN JOINT<br />
VENTURES<br />
The group’s interests in jointly controlled<br />
entities are accounted for by using<br />
the equity method of accounting, and<br />
the investments are accounted for at<br />
cost less accumulated impairment in<br />
the separate financial statements of the<br />
venturer companies.<br />
Under the equity method, an investment<br />
in a joint venture is carried in the<br />
statement of financial position at<br />
cost plus post-acquisition changes in<br />
the group’s share of the net assets of the<br />
joint venture.<br />
The statement of comprehensive income<br />
reflects the share of the results of<br />
operations of the joint venture. Where<br />
there has been a change recognised<br />
directly in the equity of the joint venture,<br />
the group recognises its share of any<br />
changes and discloses this, where<br />
applicable, in the statement of changes<br />
in equity. Unrealised gains and losses<br />
resulting from transactions between<br />
the group and the joint venture are<br />
eliminated to the extent of the interest<br />
in the joint venture.<br />
The share of the profit of a joint<br />
venture is shown on the face of the<br />
statement of comprehensive income.<br />
This is the profit attributable to the<br />
equity holding of the joint venture<br />
and therefore is profit after tax and<br />
non-controlling interests of the joint<br />
venture. Any dividend received by<br />
the group is credited against the<br />
investment in the joint venture.<br />
Financial results of the joint venture<br />
are prepared for the same <strong>report</strong>ing<br />
period as the parent company. Where<br />
necessary, adjustments are made to<br />
bring the accounting policies in line<br />
with those of the group.<br />
After application of the equity method,<br />
the group determines whether it is<br />
necessary to recognise an additional<br />
impairment loss on the group’s<br />
investment in a joint venture.<br />
The group determines at each <strong>report</strong>ing<br />
date whether there is any objective<br />
evidence that the investment in the joint<br />
venture is impaired.<br />
If this is the case the group calculates<br />
the amount of impairment as being the<br />
difference between the recoverable<br />
amount of the joint venture and<br />
the carrying value and recognises<br />
the amount in the statement of<br />
comprehensive income.<br />
INVESTMENT IN ASSOCIATE<br />
An associate is an entity in which the<br />
group has significant influence. The<br />
group’s investment in its associate is<br />
accounted for using the equity method<br />
of accounting.<br />
Refer to the description of the equity<br />
method of accounting under ’investment<br />
in joint ventures’.<br />
After application of the equity method,<br />
the group determines whether it is<br />
necessary to recognise an additional<br />
impairment loss on the group’s<br />
investment in associates.<br />
The group determines at each <strong>report</strong>ing<br />
date whether there is any objective<br />
evidence that the investment in the<br />
associate is impaired. If this is the case<br />
the group calculates the amount of<br />
impairment as being the difference<br />
between the recoverable amount of the<br />
associate and the carrying value and<br />
recognises the amount in the statement<br />
of comprehensive income.<br />
REVENUE<br />
Revenue of the group comprises:<br />
– turnover: net merchandise sales,<br />
sales to franchisees and logistics<br />
services; and<br />
– other revenue: interest, dividends,<br />
rentals and franchise and other<br />
commissions.<br />
Value added tax is excluded.<br />
Revenue is recognised when it is<br />
probable that the economic benefits<br />
associated with the transaction will<br />
flow to the group and the amount can<br />
be measured reliably.<br />
Revenue is recognised on the<br />
following basis:<br />
– sale of merchandise is recognised<br />
when the group has transferred<br />
to the buyer the significant risks<br />
and rewards of ownership of the<br />
merchandise, the amount of revenue<br />
can be measured reliably and<br />
it is probable that the economic<br />
benefits associated with the<br />
transaction will flow to the group;<br />
94
– logistics services relate to the<br />
transport of goods on behalf of third<br />
parties and is recognised when the<br />
service has been provided;<br />
– interest income is recognised as<br />
interest accrues using the effective<br />
interest method;<br />
– dividends are recognised when<br />
the shareholder’s right to receive<br />
payment is established;<br />
– commissions are recognised on<br />
an accrual basis in accordance<br />
with the substance of the relevant<br />
agreement when the sale which<br />
gives rise to the commission has<br />
occurred; and<br />
– rental income for fixed escalation<br />
leases is recognised on a straightline<br />
basis.<br />
Contingent rentals are recognised in<br />
the period in which they arise.<br />
Revenue is measured at the fair value<br />
of the consideration received or<br />
receivable and is stated net of related<br />
rebates and discounts granted.<br />
BORROWING COSTS<br />
Borrowing costs directly attributable<br />
to the acquisition, construction or<br />
production of a qualifying asset is<br />
included in the cost of that asset,<br />
provided it is probable that it will<br />
result in future economic benefits to<br />
the entity and the costs can be<br />
measured reliably.<br />
All other borrowing costs are<br />
recognised as an expense<br />
when incurred.<br />
EXPENSES<br />
Expenses, other than those specifically<br />
dealt with in another accounting<br />
policy, are recognised in the statement<br />
of comprehensive income when it is<br />
probable that an outflow of economic<br />
benefits associated with a transaction<br />
will occur and that outflow can be<br />
measured reliably.<br />
Expenditure on advertising and<br />
promotional activities is recognised<br />
as an expense when the group either<br />
has the right to access the goods or has<br />
received the service.<br />
EXCEPTIONAL ITEMS<br />
Exceptional items are significant<br />
items, of an unusual nature, identified<br />
by management as warranting<br />
separate disclosure.<br />
SEGMENTAL<br />
INFORMATION<br />
The group has adopted IFRS 8<br />
Operating Segments with effect from<br />
1 July 2009. IFRS 8 requires operating<br />
segments to be identified on the basis<br />
of internal <strong>report</strong>ing about components<br />
of the group that are regularly reviewed<br />
by the chief operating decision<br />
maker (CODM) to allocate resources<br />
to the segments and to assess their<br />
performance. The CODM has been<br />
identified as the group’s executives<br />
collectively. Management has<br />
determined the operating segments<br />
based on the main internal <strong>report</strong>ing<br />
segments. The group has identified five<br />
<strong>report</strong>able segments:<br />
– Clothing and General Merchandise<br />
(C&GM) (Clothing, homeware,<br />
beauty and other lifestyle products)<br />
– Food<br />
– Country Road (Clothing retailers<br />
operating in Australasia)<br />
– <strong>Woolworths</strong> Financial Services (WFS)<br />
(Financial products and services)<br />
– Treasury (Cash management<br />
activities)<br />
The executive directors evaluate the<br />
segmental performance based on<br />
operating profit or loss before tax and<br />
exceptional items.<br />
To increase transparency and<br />
comparability of revenue, the group has<br />
included additional voluntary disclosure<br />
of revenue from logistics services.<br />
The new segments are different from<br />
the segments previously disclosed as<br />
<strong>Woolworths</strong> Retail has been subdivided<br />
into Foods and Clothing and General<br />
Merchandise. <strong>Woolworths</strong> Financial<br />
Services remains a segment, accounted<br />
for on an equity basis subsequent to<br />
the disposal of the controlling interest<br />
on 1 October 2008.<br />
EARNINGS PER SHARE<br />
The calculation of earnings per share<br />
is based on profit for the period<br />
attributable to ordinary shareholders<br />
and the weighted average number<br />
of ordinary shares in issue during<br />
the period. Headline earnings per<br />
share is calculated in accordance<br />
with Circular 3/2009 issued by the<br />
South African Institute of Chartered<br />
Accountants.<br />
DISTRIBUTIONS PAID<br />
TO SHAREHOLDERS<br />
Distributions are recorded in the period<br />
in which the distribution is declared,<br />
and charged directly to equity.<br />
USE OF ESTIMATES,<br />
JUDGEMENTS AND<br />
ASSUMPTIONS<br />
The preparation of financial statements<br />
in conformity with IFRS requires<br />
management to make judgements,<br />
estimates and assumptions that<br />
affect the application of policies<br />
and <strong>report</strong>ed amounts of assets and<br />
liabilities, income and expenses. The<br />
estimates and assumptions are based<br />
on historical experience and various<br />
other factors that are believed to be<br />
reasonable under the circumstances.<br />
Actual results may differ from these<br />
estimates.<br />
The estimates and underlying<br />
assumptions are reviewed on an<br />
ongoing basis. Revisions to accounting<br />
estimates are recognised in the period<br />
95
NOTES<br />
TO THE GROUP ANNUAL FINANCIAL STATEMENTS<br />
in which the estimate is revised if<br />
the revision affects only that period,<br />
or in the period of the revision and<br />
subsequent periods if the revision<br />
affects both.<br />
Significant accounting<br />
estimates and assumptions<br />
Estimates and assumptions that<br />
have a significant risk of causing<br />
a material adjustment to the carrying<br />
amounts of assets and liabilities<br />
within the next financial period are<br />
outlined below.<br />
Property, plant and equipment<br />
Property, plant and equipment is<br />
depreciated over its useful life taking<br />
into account residual values, where<br />
appropriate. Assessments of useful lives<br />
and residual values are performed<br />
annually after considering factors<br />
such as technological innovation,<br />
maintenance programmes, relevant<br />
market information, manner of recovery<br />
and management consideration.<br />
In assessing residual values, the group<br />
considers the remaining life of the asset,<br />
its projected disposal value and future<br />
market conditions. Refer note 9.<br />
Provision for net realisable value<br />
of inventory<br />
The provision for net realisable value<br />
of inventory represents management’s<br />
estimate, based on historic sales trends<br />
and its assessment of quality and volume,<br />
of the extent to which merchandise on<br />
hand at the <strong>report</strong>ing date will be sold<br />
below cost. Refer note 17.<br />
Fair value of right to acquire equity<br />
instruments granted<br />
The fair value of rights to acquire<br />
shares granted in terms of sharebased<br />
payment transactions is<br />
obtained using option pricing models<br />
and, in the case of options, assuming<br />
an option life of between seven and<br />
10 years, while convertible preference<br />
shares issued in terms of the broadbased<br />
black economic empowerment<br />
scheme have a life of eight years<br />
terminating in 2015.<br />
Other valuation assumptions include<br />
estimates of the volatility of the shares,<br />
dividend yield and the risk-free interest<br />
rate. Refer note 20 for additional<br />
information regarding the fair value of<br />
such instruments at grant date.<br />
Impairment of non-financial assets<br />
Goodwill, intangible assets and<br />
property, plant and equipment are<br />
considered for impairment at least<br />
annually. An asset is impaired when its<br />
carrying value exceeds its recoverable<br />
amount. The recoverable amount is the<br />
higher of an asset’s fair value less costs<br />
to sell, and its value in use.<br />
An asset’s fair value less costs to sell is<br />
approximated by its selling price in an<br />
arm’s length transaction adjusted for<br />
any costs directly attributable to the<br />
disposal of the asset. Where an asset<br />
is traded in an active market, its fair<br />
value less costs to sell will be its quoted<br />
price less disposal costs.<br />
Where neither a binding agreement<br />
nor an active market for an asset exists,<br />
management estimates an asset’s fair<br />
value less costs to sell using the entity’s<br />
most recent information and experience<br />
with similar assets. Where necessary,<br />
consulting an independent expert to<br />
obtain a valuation is considered.<br />
The value in use of the relevant asset<br />
or, in the case of goodwill, the cashgenerating<br />
unit to which the goodwill<br />
is allocated, is estimated by projecting<br />
the future cash flows expected to<br />
be generated by the assets or cashgenerating<br />
units taking into account<br />
the expected useful lives of assets and<br />
current market conditions. The present<br />
value of these cash flows is calculated<br />
using an appropriate discount rate and<br />
compared to the net asset value.<br />
Where the net asset value exceeds<br />
the present value of cash flows, an<br />
impairment loss is recognised. In the<br />
case of goodwill, the impairment loss<br />
is allocated first to goodwill and then<br />
to other assets in the cash-generating<br />
unit. For detailed information regarding<br />
the impairment testing of goodwill.<br />
Refer note 11.<br />
Impairment of financial assets<br />
Loans and receivables<br />
When evidence of impairment of loans<br />
and receivables exists, the present<br />
value of the future cash flows of the<br />
asset discounted at the asset’s original<br />
effective interest rate is determined<br />
and compared to the carrying value<br />
of the asset. Management judgement<br />
is required in the estimation of future<br />
cash flows.<br />
Provision for employee benefits<br />
Post-retirement defined benefits<br />
are provided for certain existing and<br />
former employees. Actuarial valuations<br />
are performed to assess the financial<br />
position of relevant funds and are<br />
based on assumptions which include<br />
mortality rates, healthcare inflation,<br />
the expected long-term rate of return<br />
on investments, the discount rate<br />
and current market conditions.<br />
Refer note 25.<br />
Significant judgements in<br />
applying the group’s<br />
accounting policies<br />
The following areas require<br />
significant judgements to be made by<br />
management in the application of the<br />
group’s accounting policies.<br />
Probability of vesting of rights to<br />
equity instruments granted in terms<br />
of share-based payment schemes<br />
The cumulative expense recognised<br />
in terms of the group’s share-based<br />
payment schemes reflects the extent,<br />
in the opinion of the directors, to which<br />
the vesting period has expired and the<br />
number of rights to equity instruments<br />
96
granted that will ultimately vest. At each<br />
<strong>report</strong>ing date, the unvested rights<br />
are adjusted by the number forfeited<br />
during the period to reflect the actual<br />
number of instruments outstanding.<br />
Management is of the opinion that this<br />
represents the most accurate estimate<br />
of the number of instruments that will<br />
ultimately vest.<br />
Income taxes<br />
The group is subject to income tax in<br />
more than one jurisdiction. Significant<br />
judgement is required in determining<br />
the provision for income taxes. There<br />
are many transactions and calculations<br />
for which the ultimate tax determination<br />
is uncertain during the ordinary course<br />
of business.<br />
through separate share trusts. These<br />
trusts are operated for the purposes<br />
of incentivising staff to promote<br />
the continued growth of the group,<br />
and to promote black economic<br />
empowerment.<br />
The trusts are funded by loan accounts<br />
from companies within the group and<br />
by dividends received from <strong>Woolworths</strong><br />
<strong>Holdings</strong> <strong>Limited</strong>. The group retains<br />
the residual risks associated with the<br />
trusts. In the judgement of management,<br />
the appropriate accounting treatment<br />
for these entities is to consolidate<br />
their results.<br />
Determining whether an<br />
arrangement contains a lease<br />
IFRIC 4 identifies situations where<br />
an arrangement entered into may<br />
have to be accounted for as a lease.<br />
The interpretation concludes that<br />
an arrangement is a lease when<br />
fulfilment thereof is dependent on the<br />
use of specific assets; and, when the<br />
arrangement conveys the right to use<br />
those assets. Judgement is exercised<br />
in assessing whether existing supplier<br />
agreements may contain a lease.<br />
In the opinion of management, the<br />
requirements of IFRIC 4 were not met<br />
during the current period as suppliers<br />
do not have to use specific assets<br />
to fulfil their supply obligation and,<br />
although the group enforces stringent<br />
quality standards on goods sourced,<br />
it has no control over how assets are<br />
used. In addition, purchases are priced<br />
per individual order and the group<br />
does not control physical access to<br />
suppliers’ assets.<br />
Consolidation of the group’s<br />
share trusts<br />
The group operates a share incentive<br />
scheme and a broad-based black<br />
economic empowerment scheme<br />
97
NOTES<br />
TO THE GROUP ANNUAL FINANCIAL STATEMENTS<br />
<strong>2010</strong> 2009<br />
2. revenue<br />
Turnover 23 393 21 175<br />
Clothing and General Merchandise 10 749 9 658<br />
Food 12 227 11 126<br />
Logistics services and other 417 391<br />
Investment income 175 184<br />
Interest earned from cash and investments 164 184<br />
Other 11 –<br />
Other revenue 95 563<br />
Franchise and other commissions 69 138<br />
Rentals 26 52<br />
Interest received<br />
Financial services debtors – 373<br />
Rm<br />
Rm<br />
23 663 21 922<br />
3. profit before exceptional items includes:<br />
3.1 Operating lease expenses<br />
Land and buildings – rentals 1 016 942<br />
Plant and equipment – 2<br />
Provision for onerous lease commitments 8 2<br />
3.2 Auditors’ remuneration<br />
Audit fee 8 8<br />
current period 8 8<br />
Tax advisory and other services 2 2<br />
3.3 Net foreign exchange (profit)/loss (65) 35<br />
3.4 Other expenses<br />
Technical and consulting service fees 53 59<br />
Depreciation and amortisation expenses (refer notes 9 & 11) 442 401<br />
Loss on sale of property, plant and equipment 24 4<br />
Unwinding of discount of provisions 4 5<br />
(Profit)/Loss on fair value movements arising from derivative instruments (2) 79<br />
3.5 Employment costs 2 858 2 689<br />
Short-term employment benefits 2 534 2 408<br />
Expense of share-based payments 106 70<br />
Pension costs (refer note 25) 186 168<br />
Post-retirement medical benefit (refer note 25) 30 33<br />
Termination and other benefits 2 10<br />
3.6 INTEREST PAID 151 281<br />
Bank borrowings and overdrafts 151 2<br />
Other interest-bearing borrowings – 279<br />
98
<strong>2010</strong> 2009<br />
4. exceptional items<br />
Net profit on disposal of controlling interest in <strong>Woolworths</strong> Financial Services<br />
(Proprietary) <strong>Limited</strong> (refer note 36) – 380<br />
Rm<br />
Rm<br />
5. tax<br />
Current period<br />
South Africa<br />
Normal tax 525 301<br />
Deferred tax relating to the origination and reversal of temporary<br />
differences (refer note 16) (52) 53<br />
Secondary tax on companies – 138<br />
Foreign tax 21 56<br />
494 548<br />
Prior period<br />
South Africa<br />
Normal tax (8) (1)<br />
Deferred tax (refer note 16) 5 (1)<br />
491 546<br />
<strong>2010</strong> 2009<br />
% %<br />
The rate of tax on profit is reconciled as follows:<br />
Standard rate 28.0 28.0<br />
Tax losses in subsidiaries not provided – 0.1<br />
Disallowable expenditure 0.9 1.3<br />
Other (1.0) (1.1)<br />
Prior periods (0.1) (0.1)<br />
Secondary tax on companies – 7.8<br />
Foreign tax 0.1 0.1<br />
Effective rate before exceptional items 27.9 36.1<br />
Exceptional items – (5.9)<br />
Effective tax rate 27.9 30.2<br />
99
NOTES<br />
TO THE GROUP ANNUAL FINANCIAL STATEMENTS<br />
6. earnings per share<br />
Basic and headline earnings<br />
Profit<br />
before<br />
tax<br />
Tax<br />
Minority<br />
shareholders’<br />
interest<br />
Attributable<br />
profit<br />
Rm Rm Rm Rm<br />
<strong>2010</strong><br />
Per the financial statements 1 759 (491) (10) 1 258<br />
BEE preference dividend paid (11) – – (11)<br />
Basic earnings 1 748 (491) (10) 1 247<br />
Adjustment:<br />
Loss on disposal of property, plant and equipment 24 (7) – 17<br />
Headline earnings 1 772 (498) (10) 1 264<br />
2009<br />
Per the financial statements 1 806 (546) (12) 1 248<br />
BEE preference dividend paid (9) – – (9)<br />
Basic earnings 1 797 (546) (12) 1 239<br />
Adjustments:<br />
Loss on disposal of property, plant and equipment 4 (1) – 3<br />
Net profit on disposal of controlling interest in<br />
<strong>Woolworths</strong> Financial Services (Proprietary) <strong>Limited</strong> (380) – – (380)<br />
Headline earnings 1 421 (547) (12) 862<br />
Weighted average number of shares<br />
The weighted average number of ordinary shares in issue is calculated after eliminating shares repurchased during the period.<br />
Number of shares<br />
<strong>2010</strong> 2009<br />
Weighted average number of shares 768 040 305 788 269 330<br />
Number of issued shares at the beginning of the period 774 731 831 795 521 457<br />
Weighted average number of shares repurchased during the period (9 189 868) (9 628 031)<br />
Weighted average number of shares issued during the period 2 498 342 2 375 904<br />
Earnings per share (cents)<br />
Basic 162.4 157.2<br />
Headline 164.6 109.3<br />
100
<strong>2010</strong> 2009<br />
7. diluted earnings per share<br />
DILUTED EARNINGS<br />
Basic earnings 1 247 1 239<br />
Pre-tax BEE preference dividend 12 10<br />
Diluted earnings 1 259 1 249<br />
Headline adjustment 17 (377)<br />
Diluted headline earnings 1 276 872<br />
Rm<br />
Rm<br />
DILUTED WEIGHTED AVERAGE NUMBER OF SHARES<br />
Number of shares<br />
<strong>2010</strong> 2009<br />
Weighted average number of shares 768 040 305 788 269 330<br />
Potential dilutive effect of outstanding number of share options 33 002 636 22 314 286<br />
Diluted weighted average number of shares 801 042 941 810 583 616<br />
The dilution arises from the outstanding in-the-money share incentive scheme share options<br />
that will be issued to employees at a value lower than the weighted average traded price<br />
during the past financial period, and ordinary shares expected to be issued in terms of the<br />
group’s BEE scheme for no consideration.<br />
DILUTED EARNINGS PER SHARE (CENTS)<br />
Basic 157.2 154.0<br />
% dilution 3.2% 2.0%<br />
Headline 159.3 107.5<br />
% dilution 3.2% 1.7%<br />
101
NOTES<br />
TO THE GROUP ANNUAL FINANCIAL STATEMENTS<br />
<strong>2010</strong> 2009<br />
Rm<br />
Rm<br />
8. related party transactions<br />
Related parties<br />
The related party relationships, transactions and balances as listed below exist<br />
within the group.<br />
Holding company<br />
Refer note 8 of the company annual financial statements for the transactions<br />
between the holding company and its subsidiaries.<br />
Subsidiaries<br />
During the period, group companies entered into various transactions. These transactions<br />
were entered into in the ordinary course of business. All such intragroup related party<br />
transactions and outstanding balances are eliminated in preparation of the consolidated<br />
financial statements of the group.<br />
Joint ventures<br />
The following related party transactions and balances occurred between the group and<br />
the joint ventures:<br />
<strong>Woolworths</strong> Financial Services (Proprietary) <strong>Limited</strong><br />
Service costs received by <strong>Woolworths</strong> (Proprietary) <strong>Limited</strong> 92 66<br />
Merchant fee paid by <strong>Woolworths</strong> (Proprietary) <strong>Limited</strong> 81 84<br />
Accounts receivable by <strong>Woolworths</strong> (Proprietary) <strong>Limited</strong> 68 181<br />
Accounts payable by <strong>Woolworths</strong> (Proprietary) <strong>Limited</strong> (68) (180)<br />
Nedglen Properties (Proprietary) <strong>Limited</strong><br />
Rental paid by <strong>Woolworths</strong> Development (Proprietary) <strong>Limited</strong>, a subsidiary of <strong>Woolworths</strong><br />
<strong>Holdings</strong> <strong>Limited</strong><br />
(2) (2)<br />
ASSOCIATE<br />
The following related party transactions and balances occurred between the group<br />
and the associate:<br />
Retail Risk Management Alliance Trust<br />
Insurance premium paid by <strong>Woolworths</strong> (Proprietary) <strong>Limited</strong> (30) (31)<br />
Interest paid by <strong>Woolworths</strong> (Proprietary) <strong>Limited</strong> – (2)<br />
Dividend received by <strong>Woolworths</strong> (Proprietary) <strong>Limited</strong> 1 1<br />
Key management personnel<br />
Key management personnel are those persons having authority and responsibility for planning, directing and controlling<br />
the activities of the group, directly or indirectly, including all directors, executive and non-executive, of <strong>Woolworths</strong> <strong>Holdings</strong><br />
<strong>Limited</strong> and <strong>Woolworths</strong> (Proprietary) <strong>Limited</strong>. Key management personnel has been defined as the board of directors of the<br />
holding company and the major operating subsidiary <strong>Woolworths</strong> (Proprietary) <strong>Limited</strong>, and the Chief executive officer of<br />
Country Road <strong>Limited</strong>.<br />
The definition of related parties include close family members of key management personnel. The group has not engaged in<br />
transactions with close family members of key management personnel during the financial period.<br />
102
<strong>2010</strong> 2009<br />
8. related party transactions (continued)<br />
Key management compensation<br />
Short-term employee benefits 69 46<br />
<strong>Woolworths</strong> <strong>Holdings</strong> <strong>Limited</strong> directors 64 26<br />
Other key management personnel 5 20<br />
Rm<br />
Rm<br />
Post-employment benefits 2 2<br />
<strong>Woolworths</strong> <strong>Holdings</strong> <strong>Limited</strong> directors 2 2<br />
IFRS 2 value of share-based payments expensed 11 5<br />
<strong>Woolworths</strong> <strong>Holdings</strong> <strong>Limited</strong> directors 11 5<br />
82 53<br />
Short-term employee benefits comprise salaries, directors’ fees and bonuses payable within<br />
twelve months of the end of the period.<br />
Post-employment benefits comprise expenses determined in terms of IAS 19: Employee Benefits<br />
in respect of the group’s retirement and healthcare funds.<br />
SHARE PURCHASE SCHEME LOANS AND INVESTMENTS<br />
Loans and investments at the beginning of the period 67 89<br />
Loans repaid during the period (6) (22)<br />
Loans and investments at the end of the period 61 67<br />
Details of the terms and conditions relating to these loans are disclosed in note 15.<br />
No bad or doubtful debts have been recognised in respect of loans granted to key<br />
management personnel (2009: nil).<br />
WOOLWORTHS CARD AND WOOLWORTHS VISA CREDIT CARD ACCOUNTS<br />
Balance outstanding at the beginning of the period 1 –<br />
<strong>Annual</strong> spend 2 3<br />
<strong>Annual</strong> repayments (1) (2)<br />
Balance outstanding at the end of the period 2 1<br />
Purchases made by key management personnel are at standard discounts granted to all employees of the company.<br />
Interest is charged on outstanding balances on the same terms and conditions applicable to all other card holders.<br />
No bad or doubtful debts have been recognised in respect of the <strong>Woolworths</strong> card and <strong>Woolworths</strong> Visa credit card<br />
accounts of key management personnel (2009: nil).<br />
POST-EMPLOYMENT BENEFIT PLAN<br />
Details of the Wooltru Group Retirement Fund, the Wooltru Healthcare Fund and funds for the benefit of Country Road <strong>Limited</strong><br />
employees are disclosed in note 25 to the annual financial statements.<br />
103
NOTES<br />
TO THE GROUP ANNUAL FINANCIAL STATEMENTS<br />
9. property, plant and equipment<br />
Land<br />
and<br />
buildings<br />
Rm<br />
Leasehold<br />
improvements<br />
Rm<br />
Furniture,<br />
fittings,<br />
equipment<br />
and motor<br />
vehicles<br />
Rm<br />
Computer<br />
equipment<br />
Rm<br />
2009<br />
Balance at June 2008<br />
Cost 603 216 2 015 630 3 464<br />
Accumulated depreciation – 43 1 107 504 1 654<br />
Net book value 603 173 908 126 1 810<br />
Current period movements:<br />
Additions 1 77 422 117 617<br />
Disposals/scrappings – cost (22) (22) (571) (240) (855)<br />
Disposals/scrappings – accumulated depreciation – 3 530 240 773<br />
Depreciation – (18) (252) (89) (359)<br />
Amount no longer consolidated due to disposal<br />
of controlling interest in subsidiaries – cost<br />
(refer note 36) – – (8) (17) (25)<br />
Amount no longer consolidated due to disposal of<br />
controlling interest in subsidiaries – accumulated<br />
depreciation (refer note 36) – – 6 11 17<br />
Foreign exchange rate differences – cost – (26) (38) (9) (73)<br />
Foreign exchange rate differences – accumulated<br />
depreciation – 8 18 6 32<br />
Balance at June 2009 582 195 1 015 145 1 937<br />
Made up as follows:<br />
Cost 582 245 1 820 481 3 128<br />
Accumulated depreciation – 50 805 336 1 191<br />
Net book value at June 2009 582 195 1 015 145 1 937<br />
Total<br />
Rm<br />
<strong>2010</strong><br />
Current period movements:<br />
Additions 3 44 405 48 500<br />
Disposals/scrappings – cost (1) (10) (132) (72) (215)<br />
Disposals/scrappings – accumulated depreciation – 4 66 65 135<br />
Depreciation – (22) (274) (79) (375)<br />
Foreign exchange rate differences – cost – 6 8 2 16<br />
Foreign exchange rate differences – accumulated<br />
depreciation – (2) (4) (1) (7)<br />
Balance at June <strong>2010</strong> 584 215 1 084 108 1 991<br />
Made up as follows:<br />
Cost 584 285 2 101 459 3 429<br />
Accumulated depreciation – 70 1 017 351 1 438<br />
Net book value at June <strong>2010</strong> 584 215 1 084 108 1 991<br />
104
9. property, plant and equipment (continued)<br />
The net carrying amounts of assets held under finance leases were as follows:<br />
<strong>2010</strong> 2009<br />
Motor vehicles 7 –<br />
Computer equipment 22 24<br />
Rm<br />
Rm<br />
Additions during the period include R8m (2009: R48m) of assets held under finance leases.<br />
The group’s land and buildings consist of retail stores, distribution centres and corporate owner-occupied properties.<br />
At 27 June <strong>2010</strong>, land and buildings were valued taking account of similar recent market transactions on arm’s length terms.<br />
The fair values were as follows:<br />
Fair value<br />
Rm<br />
Carrying<br />
value<br />
Retail stores <strong>2010</strong> 192 113<br />
Rm<br />
2009 193 113<br />
Distribution centres <strong>2010</strong> 739 394<br />
2009 729 393<br />
Corporate owner-occupied properties <strong>2010</strong> 143 77<br />
2009 144 76<br />
Land and buildings are valued externally every three years and annually by internal valuers. The most recent external<br />
valuation was performed in June 2009.<br />
No depreciation on buildings was recognised during the current or prior period as residual values exceed carrying values.<br />
Land is not depreciated.<br />
A register of land and buildings, containing the information required by paragraph 22(3) of Schedule 4 of the South African<br />
Companies Act (No. 61 of 1973), as amended, is available for inspection at the registered office of the company. A copy will be<br />
posted, upon request, by the group secretary.<br />
10. investment properties<br />
<strong>2010</strong> 2009<br />
Rm<br />
Rm<br />
Cost 121 121<br />
No depreciation was recognised on investment properties in the current or prior period as the residual values exceeded the<br />
carrying values of all properties classified as investment properties.<br />
At 27 June <strong>2010</strong> investment properties were valued by internal valuers at R200m (2009: R197m).<br />
Rental income and expense from investment properties<br />
Rental income from investment properties 15 14<br />
Direct operating expenses from investment properties that earned rental income<br />
during the period 6 6<br />
No restrictions exist on the sale of investment properties.<br />
Refer note 34 for disclosure on operating leases.<br />
105
NOTES<br />
TO THE GROUP ANNUAL FINANCIAL STATEMENTS<br />
11. intangible assets<br />
Computer<br />
Software<br />
Rm<br />
Goodwill<br />
Rm<br />
2009<br />
Balance at the beginning of the period<br />
Cost 607 23 630<br />
Accumulated amortisation 356 – 356<br />
Net book value at June 2008 251 23 274<br />
Current period movements:<br />
Additions 137 – 137<br />
Disposals/scrappings – cost (86) – (86)<br />
Disposals/scrappings – accumulated amortisation 74 – 74<br />
Amortisation (42) – (42)<br />
Amount no longer consolidated due to disposal of controlling interest in<br />
subsidiaries – cost (refer note 36) (19) – (19)<br />
Amount no longer consolidated due to disposal of controlling interest in<br />
subsidiaries – accumulated depreciation (refer note 36) 16 – 16<br />
Foreign exchange rate differences – cost (14) – (14)<br />
Foreign exchange rate differences – accumulated amortisation 11 – 11<br />
Balance at the end of the period 328 23 351<br />
Made up as follows:<br />
Cost 625 23 648<br />
Accumulated amortisation 297 – 297<br />
Net book value at June 2009 328 23 351<br />
Total<br />
Rm<br />
<strong>2010</strong><br />
Current period movements:<br />
Additions 107 – 107<br />
Disposals/scrappings – cost (54) – (54)<br />
Disposals/scrappings – accumulated amortisation 54 – 54<br />
Amortisation (67) – (67)<br />
Foreign exchange rate differences – cost 3 – 3<br />
Foreign exchange rate differences – accumulated amortisation (2) – (2)<br />
Balance at June <strong>2010</strong> 369 23 392<br />
Made up as follows:<br />
Cost 681 23 704<br />
Accumulated amortisation 312 – 312<br />
Net book value at June <strong>2010</strong> 369 23 392<br />
Goodwill<br />
The carrying value of goodwill comprises:<br />
Goodwill arising on acquisition of Virtual Market Place (Proprietary) <strong>Limited</strong><br />
(1 April 2006) 13<br />
Repurchase of franchise business (27 March 2006) 10<br />
23<br />
106
11. intangible assets (continued)<br />
Goodwill is tested for impairment by calculating the value in use of the cash-generating unit or units to which the goodwill<br />
is allocated.<br />
The cash flows generated by Virtual Market Place (Proprietary) <strong>Limited</strong> are based on the customer loyalty created by<br />
Participation in the MySchool programme and the brand awareness that the programme generates.<br />
The franchise business generates cash flows that are largely independent from the cash inflows of other assets and thus<br />
comprises a cash-generating unit.<br />
The recoverable amounts of the repurchased franchise business is based on value in use calculations. These calculations use<br />
cash flow projections based on historical information and financial budgets approved by management covering<br />
a two-year period. Cash flows beyond this period are extrapolated using estimated growth in sales and costs based on<br />
historical performance.<br />
The projected cash flows are discounted to their present value using the weighted average cost of capital. This was 11.2% in<br />
the current period (2009: 12.0%).<br />
12. investment in associate<br />
<strong>Woolworths</strong> <strong>Holdings</strong> <strong>Limited</strong> is a beneficiary of Retail Risk Management Alliance Trust and, in terms of the trust deed,<br />
companies can appoint trustees and are entitled to vote according to the three-year average percentage of premium<br />
contribution per beneficiary. During <strong>2010</strong>, the group contributed 28.0% (2009: 28.0%) of total premium.<br />
Retail Risk Management Alliance Trust also holds an investment in Unison Risk Management Alliance (Proprietary) <strong>Limited</strong> that<br />
provides insurance broking services.<br />
The following amounts represent the group’s share of the assets and liabilities, and income and profit of the associate:<br />
<strong>2010</strong> 2009<br />
Rm<br />
Rm<br />
Total assets 58 55<br />
Total liabilities (18) (20)<br />
Net assets 40 35<br />
Total revenue 26 31<br />
Net profit for the period 6 12<br />
R21m (2009: R29m) of the reserves in Retail Risk Management Alliance Trust and Unison Risk Management Alliance (Proprietary)<br />
<strong>Limited</strong> combined, are non-distributable in terms of the short-term Insurance Act, and protocols governing the trust. This amount<br />
is revised on an annual basis.<br />
There are no contingent liabilities relating to the group’s interest in the associate, and no contingent liabilities of the<br />
associate itself.<br />
107
NOTES<br />
TO THE GROUP ANNUAL FINANCIAL STATEMENTS<br />
<strong>2010</strong> 2009<br />
13. prepaid employment costs<br />
Balance at the beginning of the period 37 46<br />
Prepayment arising from share loans granted during the period – 2<br />
Unwinding of prepayment on loans repaid during the period (2) (5)<br />
Current employment costs released to the statement of comprehensive income (included<br />
in note 3.5) (6) (6)<br />
Balance at the end of the period 29 37<br />
Rm<br />
Rm<br />
Details of loans granted in terms of the share purchase scheme participants loans<br />
are included in note 15.<br />
14. participation in export partnerships<br />
Balance at the beginning of the period 65 66<br />
Payments received relating to the current period (1) (1)<br />
Current portion included in trade and other receivables (refer note 18) (2) (1)<br />
Notional interest accrued for the period 1 1<br />
Balance at the end of the period 63 65<br />
The group participates as a partner in a number of container export partnerships. The partnerships sold containers in terms of<br />
long-term suspensive purchase and credit sale agreements.<br />
Participation in export partnerships is measured at amortised cost using the effective interest rate method. Amortised cost is<br />
the group’s cost of original participation less principal subsequent repayments received, plus the cumulative amortisation<br />
of the difference between the initial amount and the maturity amount, less any writedown for impairment or uncollectability.<br />
Any impairment to the participation in export partnerships would result in a corresponding reduction in the related deferred<br />
taxation liability and thus there would be no impact on the statement of cash flows or the net profit of the group.<br />
Due to the terms and conditions attached to the participation in export partnerships it is not practicable within constraints of<br />
timeliness or cost to determine their fair values.<br />
The amount outstanding is considered to be neither past due nor impaired. Refer note 29.3 for details of the group’s credit risk<br />
management policies.<br />
108
<strong>2010</strong> 2009<br />
15. other loans<br />
Housing and other employee loans 14 9<br />
Balance at the beginning of the period 9 24<br />
Loans granted/(repaid) during the period 4 (16)<br />
Current portion included in trade and other receivables (refer note 18) – (1)<br />
Interest accrued for the period (included in note 2) 1 2<br />
Share purchase scheme participant loans and investments 81 116<br />
Balance at the beginning of the period 116 129<br />
Loans repaid during the period (41) (19)<br />
Notional interest accrued for the period (included in note 2) 6 6<br />
Other – 1<br />
Rm<br />
Rm<br />
95 126<br />
Housing loans bear interest at prime less 2.0% (2009: prime less 2.0%). The carrying values of the housing loans approximate<br />
fair value. Housing loans are required to be repaid on termination of employment.<br />
Loans to the directors in respect of their indirect holdings in the share purchase scheme bear interest at market-related rates<br />
and are secured by shares in <strong>Woolworths</strong> <strong>Holdings</strong> <strong>Limited</strong>. Loans to directors and other employees participating directly in<br />
the share purchase scheme are interest-free and are secured by shares in <strong>Woolworths</strong> <strong>Holdings</strong> <strong>Limited</strong>. The loans are repaid<br />
when participants take delivery of shares, over a period not exceeding 10 years.<br />
The fair value of share purchase loans amounted to R81m (2009: R116m) at the <strong>report</strong>ing date. The fair values are calculated by<br />
discounting the future cash flows arising from settlement of the loans over the expected period of repayment using marketrelated<br />
interest rates.<br />
Other loans are not considered to be past due or impaired. The credit risk management policies of the group are discussed<br />
in note 29.3.<br />
109
NOTES<br />
TO THE GROUP ANNUAL FINANCIAL STATEMENTS<br />
16. deferred tax<br />
The movement in the deferred tax account is as follows:<br />
<strong>2010</strong> 2009<br />
Balance at the beginning of the period 165 227<br />
Amount credited/(debited) to profit or loss 47 (52)<br />
Property, plant and equipment (26) (10)<br />
Prepayments 7 (7)<br />
Working capital and other provisions 48 (47)<br />
Export partnerships 2 1<br />
Post-retirement medical benefit liability 6 7<br />
Secondary tax on companies – (2)<br />
Share-based payments 16 –<br />
Other (6) 6<br />
Amounts (debited)/credited directly in other comprehensive income<br />
Financial instrument revaluation reserve adjustment (14) 20<br />
Amounts credited directly in equity<br />
Foreign currency translation reserve adjustment (1) (8)<br />
Share-based payment reserve 43 –<br />
Amount no longer consolidated due to disposal of controlling interest in subsidiary<br />
(refer note 36) – (22)<br />
Balance at the end of the period 240 165<br />
Deferred tax liability (87) (65)<br />
Deferred tax asset 327 230<br />
Net deferred tax asset 240 165<br />
Comprising:<br />
Property, plant and equipment (107) (81)<br />
Prepayments (19) (26)<br />
Working capital and other provisions 284 236<br />
Export partnerships (63) (65)<br />
Post-retirement medical benefit liability 82 76<br />
Share-based payments 59 –<br />
Other 4 25<br />
Rm<br />
Rm<br />
240 165<br />
Deferred tax has been calculated at the standard corporate tax rate as at the <strong>report</strong>ing date as management expect to<br />
recover the carrying value of assets and settle the carrying value of liabilities through use. The deferred tax asset relating<br />
to STC credits is calculated using the STC rate.<br />
Deferred tax assets are raised after due consideration of future taxable income.<br />
17. inventories<br />
Merchandise 1 738 1 749<br />
Provision for shrinkage, obsolescence and markdown of inventory (73) (42)<br />
Consumables 4 7<br />
Raw materials 7 9<br />
1 676 1 723<br />
Inventories carried at net realisable value included above 224 179<br />
110
<strong>2010</strong> 2009<br />
18. trade and other receivables<br />
Trade and other receivables 795 779<br />
Provision for impairment (36) (34)<br />
Trade and other receivables – net 759 745<br />
Movements in the provision for impairment of<br />
trade and other receivables were as follows:<br />
Balance at the beginning of the period 34 12<br />
Charge for the period 11 33<br />
Amounts written off (7) (11)<br />
Unused amounts reversed (2) –<br />
Balance at the end of the period 36 34<br />
Rm<br />
Rm<br />
Trade and other receivables are interest-free unless overdue, and have payment terms ranging from seven days<br />
to 60 days.<br />
The provision for impairment of trade and other receivables is recognised when there is objective evidence obtained<br />
during the collection process such as inability to recover long overdue accounts and liquidity problems experienced<br />
by the debtors that indicate that the receivables may not be recoverable.<br />
The carrying value of trade and other receivables is considered to approximate fair value.<br />
The creation and release of provisions for impaired receivables has been included in other operating costs in the<br />
statement of comprehensive income up to the date of disposal.<br />
At the end of the period, the ageing analysis of receivables is as follows:<br />
Total<br />
Neither past<br />
due nor<br />
impaired<br />
< 90 days<br />
delinquent<br />
Past due but not impaired<br />
90-120 days<br />
delinquent<br />
>120 days<br />
delinquent<br />
<strong>2010</strong><br />
Trade and other receivables 571 534 37 – –<br />
2009<br />
Trade and other receivables 640 543 94 2 1<br />
The ageing analysis above does not include the ageing of non-financial assets included in trade and other<br />
receivables. Refer note 29.5 for the analysis of trade and other receivables.<br />
The group does not hold any collateral as security.<br />
For detailed information regarding the credit quality of financial assets which are neither past due nor impaired,<br />
refer note 29.3.<br />
111
NOTES<br />
TO THE GROUP ANNUAL FINANCIAL STATEMENTS<br />
<strong>2010</strong> 2009<br />
Assets<br />
Rm<br />
Liabilities<br />
Rm<br />
Assets<br />
Rm<br />
Liabilities<br />
Rm<br />
19. derivative financial instruments<br />
Interest rate swaps and collars held as hedging<br />
instruments – cash flow hedges – 20 – 16<br />
Forward exchange contracts held as hedging<br />
instruments – cash flow hedges 14 13 6 63<br />
Forward exchange contracts – not hedge accounted 4 2 – 79<br />
Inflation swap instruments – not hedge accounted 2 – – –<br />
20 35 6 158<br />
Derivatives mature as follows:<br />
Within 12 months 19 20 6 142<br />
After 12 months 1 15 – 16<br />
20 35 6 158<br />
Interest rate swaps<br />
The notional principal amount of the outstanding interest rate swap contracts at 27 June <strong>2010</strong> was R1 000m (2009: R1 000m).<br />
Gains and losses on calculating the fair value of the interest rate swaps are recognised in other comprehensive income. The<br />
swaps are reset every three months. The next reset date is 8 September <strong>2010</strong>. Interest rate swap contracts are measured at fair<br />
value. Fair value is determined by discounting future cash flows using prevailing market interest rates. The valuation of interest<br />
rate swaps is performed by external experts.<br />
Forward exchange contracts<br />
The notional principal amount of the outstanding contracts at 27 June <strong>2010</strong> amounts to R1 055m (2009: R1 351m). The related<br />
cash flows are expected to occur on the maturity dates of these contracts between one and twelve months. Refer note 29.4.<br />
Gains and losses on forward exchange contracts held as hedging instruments in designated and effective hedging<br />
relationships are recognised in other comprehensive income. Gains and losses on remaining contracts not hedge accounted<br />
are recognised directly in the statement of comprehensive income. Forward contracts are measured at fair value which is<br />
calculated by reference to forward exchange rates for contracts with similar maturity profiles at period end.<br />
Inflation swaps<br />
The notional principal amount of the outstanding inflation swap contracts at 27 June <strong>2010</strong> was R72m (2009: R69m). Gains and<br />
losses on the inflation swap contracts are recognised directly in the statement of comprehensive income. The future cash flows<br />
on these swap contracts are expected to occur within three years. These swap contracts are measured at fair value which is<br />
determined by reference to the net settlements using appropriate valuation techniques.<br />
These derivative instruments are considered to be neither past due nor impaired.<br />
The maximum exposure to credit risk at the <strong>report</strong>ing date is the fair value of the above-mentioned derivative instrument assets.<br />
112
<strong>2010</strong> 2009<br />
R’000 R’000<br />
20. ordinary share capital<br />
Authorised<br />
1 410 600 000 (2009: 1 410 600 000) ordinary shares of 0.15 cents each 2 116 2 116<br />
89 400 000 (2009: 89 400 000) convertible, redeemable, non-cumulative participating<br />
preference shares of 0.15 cents each 134 134<br />
2 250 2 250<br />
Issued<br />
759 464 119 (2009: 774 731 831) ordinary shares of 0.15 cents each 1 138 1 161<br />
88 267 306 (2009: 88 267 306) unlisted, convertible, redeemable, non-cumulative participating<br />
preference shares of 0.15 cents each 132 132<br />
1 270 1 293<br />
RECONCILIATION OF VALUE OF ORDINARY SHARES IN ISSUE<br />
Balance at the beginning of the period 1 161 1 193<br />
6 172 402 (2009: 5 595 343) ordinary shares issued in terms of the share incentive scheme 9 8<br />
40 497 604 (2009: nil) ordinary shares issued to <strong>Woolworths</strong> (Proprietary) <strong>Limited</strong> 61 –<br />
17 378 892 (2009: 26 384 969) ordinary shares were purchased from the market by subsidiary,<br />
E-Com Investments 16 (Proprietary) <strong>Limited</strong> (26) (40)<br />
4 061 222 (2009: nil) ordinary shares were purchased from the market by subsidiary, <strong>Woolworths</strong><br />
(Proprietary) <strong>Limited</strong> (6) –<br />
40 497 604 (2009: nil) ordinary shares repurchased by subsidiary, <strong>Woolworths</strong> (Proprietary) <strong>Limited</strong> (61) –<br />
Balance at the end of the period 1 138 1 161<br />
Reconciliation of number of ordinary shares in issue<br />
Number of shares<br />
<strong>2010</strong> 2009<br />
Balance at the beginning of the period 774 731 831 795 521 457<br />
Shares issued 46 670 006 5 595 343<br />
Shares repurchased by subsidiaries (61 937 718) (26 384 969)<br />
Balance at the end of the period 759 464 119 774 731 831<br />
During the period, nil (2009: 86 871 694) shares amounting to Rnil (2009: R891m) were repurchased from subsidiary,<br />
E-Com Investments 16 (Proprietary) <strong>Limited</strong> and cancelled.<br />
17 378 892 (2009: 26 384 969) shares amounting to R323m (2009: R317m) were repurchased from the market by<br />
E-Com Investments 16 (Proprietary) <strong>Limited</strong> and are held as treasury shares by the group.<br />
4 061 222 (2009: nil) shares amounting to R87m (2009: Rnil) were repurchased from the market by<br />
<strong>Woolworths</strong> (Proprietary) <strong>Limited</strong> and are held as treasury shares by the group.<br />
During the period, two specific share issues for cash were made to <strong>Woolworths</strong> (Proprietary) <strong>Limited</strong>, as follows:<br />
Subscription<br />
price<br />
R<br />
Purchase<br />
price<br />
Rm<br />
Number<br />
Date issued<br />
of shares<br />
30 September 2009 29 497 604 14.56 429<br />
26 March <strong>2010</strong> 11 000 000 17.24 190<br />
40 497 604 619<br />
For more information on the group’s capital management policy, refer note 30.<br />
113
NOTES<br />
TO THE GROUP ANNUAL FINANCIAL STATEMENTS<br />
20. ordinary share capital (continued)<br />
Share incentive schemes<br />
Executive incentive scheme<br />
The group operates a share purchase scheme as well as a share option scheme, details of which are given in the<br />
remuneration <strong>report</strong>.<br />
Shares and share options granted in terms of the executive incentive scheme meet the definition of equity-settled sharebased<br />
payments. The terms and conditions of the schemes are detailed in the remuneration committee section of the<br />
corporate governance <strong>report</strong>. The options vest in tranches of 20.0% per annum and expire 10 years after grant date. The<br />
options were valued using a binomial model and assumes an option life of 10 years. Other valuation assumptions include<br />
volatility set at historic trend levels, a dividend yield of 5.0% and a risk-free interest rate based on the zero-coupon yield of<br />
SA government bonds with a term consistent with the option life.<br />
Shares granted in terms of the executive incentive scheme were granted at a discount to market value up to 1 January 2004.<br />
These shares also meet the definition of share-based payments and are valued at intrinsic value. The shares vest in tranches<br />
of 20.0% per annum.<br />
Number of shares<br />
<strong>2010</strong> 2009<br />
Shares held by participants<br />
Balance at the beginning of the period 17 897 461 23 168 825<br />
Issued 262 528 1 361 215<br />
Sold (5 559 111) (6 410 918)<br />
Transferred to trust stock and shares released from the scheme (1 027) (221 661)<br />
Balance at the end of the period 12 599 851 17 897 461<br />
Market value at the end of the period (rands) 318 902 229 230 161 348<br />
Percentage of shares vested 82% 77%<br />
Weighted average issue price (rands) 3.31 7.03<br />
Weighted average market price per share traded (rands) 16.72 10.65<br />
Number of participants on management share scheme 69 85<br />
Options granted to participants<br />
Balance at the beginning of the period 16 285 863 22 926 841<br />
Granted – 326 395<br />
Exercised (6 212 930) (5 535 130)<br />
Forfeited and expired (182 861) (1 432 243)<br />
Balance at the end of the period 9 890 072 16 285 863<br />
Percentage of options vested at the end of the period 77% 66%<br />
Weighted average exercise price of options granted during the period (rands) – 8.81<br />
Weighted average exercise price of options outstanding at the end of the period (rands) 9.95 9.09<br />
Weighted average market price per share traded (rands) 20.16 11.87<br />
Number of participants on management option scheme 153 195<br />
114
20. ordinary share capital (continued)<br />
Number of share<br />
options outstanding<br />
Period of offer* <strong>2010</strong> 2009<br />
Original<br />
exercise<br />
price<br />
Current<br />
exercise<br />
price**<br />
Fair value<br />
at grant<br />
date***<br />
23 July 1999 and 23 July 2009 – 43 095 3.80 2.83 –<br />
29 September 1999 and 29 September 2009 – 59 860 3.77 2.80 –<br />
21 December 1999 and 21 December 2009 – 81 825 3.84 2.86 –<br />
10 March 2000 and 10 March <strong>2010</strong> – 6 201 3.51 2.53 –<br />
25 April 2000 and 25 April <strong>2010</strong> – 12 405 3.21 2.23 –<br />
25 May 2000 and 1 August <strong>2010</strong> 209 184 221 2.70 1.72 –<br />
30 June 2000 and 30 June <strong>2010</strong> 6 667 54 069 3.00 2.02 –<br />
27 October 2000 and 1 January 2011 398 291 1 007 584 2.77 1.79 –<br />
1 February 2001 and 1 February 2011 15 601 22 268 2.82 1.84 –<br />
1 March 2001 and 1 March 2011 2 800 41 467 2.82 1.83 –<br />
1 April 2001 and 1 June 2011 140 931 196 107 3.03 2.04 –<br />
1 July 2001 and 1 September 2011 160 850 250 117 3.33 2.34 –<br />
1 October 2001 and 1 October 2011 10 211 14 667 3.59 2.60 –<br />
1 November 2001 and 1 December 2011 50 357 260 965 3.59 2.59 –<br />
1 January 2002 and 1 January 2012 168 496 270 934 3.46 2.46 –<br />
1 April 2002 and 1 May 2012 4 562 50 766 3.43 2.43 –<br />
4 April 2002 and 1 November 2012 67 671 267 596 3.98 2.97 –<br />
20 May 2002 and 20 May 2012 253 032 393 610 3.78 2.77 –<br />
1 August 2002 and 26 August 2012 295 647 618 780 3.98 2.98 –<br />
1 December 2002 and 1 December 2012 – 19 524 4.38 3.36 2.20<br />
1 January 2003 and 1 January 2013 87 459 109 071 4.42 3.39 2.14<br />
1 February 2003 and 1 February 2013 32 657 32 657 4.49 3.46 1.84<br />
12 August 2003 and 22 August 2013 432 698 822 187 5.16 4.10 2.88<br />
22 September 2003 and 22 September 2013 300 347 300 347 5.76 4.66 2.31<br />
1 October 2003 and 1 November 2013 28 612 130 024 6.10 4.98 2.26<br />
1 January 2004 and 1 January 2014 – 9 106 6.43 5.28 2.69<br />
1 January 2004 and 1 January 2014 31 860 31 860 7.28 6.06 2.93<br />
1 February 2004 and 1 February 2014 159 310 159 310 7.25 6.03 2.67<br />
2 March 2004 and 2 March 2014 65 197 159 804 6.84 5.65 2.46<br />
1 April 2004 and 1 April 2014 1 826 47 826 7.33 6.10 2.63<br />
1 June 2004 and 1 June 2014 – 25 426 7.13 5.91 2.71<br />
1 December 2004 and 1 December 2014 727 868 1 089 011 10.59 9.06 3.55<br />
29 March 2005 and 29 March 2015 273 013 198 909 10.18 8.66 3.44<br />
Balance carried forward to page 116 3 716 172 6 971 599<br />
* The period of offer refers to the total life of the options. Options not exercised at the end of the period of offer expire.<br />
** The original exercise price has been adjusted to take into account the effect of the special dividend paid to ordinary<br />
shareholders in December 2008.<br />
*** Fair value of options prior to the IFRS 2 effective date of 7 November 2002 has not been determined.<br />
115
NOTES<br />
TO THE GROUP ANNUAL FINANCIAL STATEMENTS<br />
20. ordinary share capital (continued)<br />
Number of share<br />
options outstanding<br />
Period of offer* <strong>2010</strong> 2009<br />
Balance brought forward from page 115 3 716 172 6 971 599<br />
Original<br />
exercise<br />
price<br />
Current<br />
exercise<br />
price**<br />
Fair value<br />
at grant<br />
date***<br />
1 May 2005 and 4 May 2015 292 922 401 536 9.73 8.24 3.15<br />
1 July 2005 and 1 July 2015 254 908 402 631 10.33 8.80 3.30<br />
1 August 2005 and 1 August 2015 63 516 133 987 11.58 9.92 3.73<br />
24 August 2005 and 24 August 2015 533 213 841 709 11.31 9.66 3.66<br />
1 September 2005 and 1 September 2015 140 858 184 238 11.64 9.96 3.67<br />
1 November 2005 and 1 November 2015 261 010 484 787 12.45 10.68 4.11<br />
3 January 2006 and 3 January 2016 52 805 264 025 14.11 12.16 4.43<br />
1 April 2006 and 1 April 2016 116 242 116 242 16.33 14.15 5.16<br />
1 May 2006 and 1 May 2016 54 433 74 716 16.56 14.35 5.27<br />
23 August 2006 and 23 August 2016 1 188 467 1 766 537 13.30 11.42 4.25<br />
1 September 2006 and 1 September 2016 25 665 38 497 13.17 11.31 4.10<br />
1 October 2006 and 1 October 2016 18 476 46 187 13.58 11.68 4.54<br />
4 October 2006 and 4 October 2016 291 758 583 516 13.71 11.80 4.64<br />
1 November 2006 and 1 November 2016 190 453 274 076 15.56 13.46 5.21<br />
14 November 2006 and 14 November 2016 308 027 192 906 15.74 13.61 5.06<br />
1 December 2006 and 1 December 2016 734 652 1 784 652 16.81 14.58 5.23<br />
15 February 2007 and 15 February 2017 413 181 490 708 20.35 17.75 6.57<br />
1 March 2007 and 1 March 2017 350 461 350 461 20.35 17.75 6.47<br />
1 April 2007 and 1 April 2017 31 390 31 390 21.53 18.78 7.07<br />
20 April 2007 and 20 April 2017 22 872 22 872 22.03 19.22 7.09<br />
15 May 2007 and 15 May 2017 207 095 207 095 24.13 21.11 7.08<br />
1 June 2007 and 1 June 2017 295 101 295 101 22.92 20.00 7.17<br />
17 October 2008 and 17 October 2018 326 395 326 395 10.57 8.81 1.59<br />
9 890 072 16 285 863<br />
* The period of offer refers to the total life of the options. Options not exercised at the end of the period of offer expire.<br />
** The original exercise price has been adjusted to take into account the effect of the special dividend paid to ordinary<br />
shareholders in December 2008.<br />
*** Fair value of options prior to the IFRS 2 effective date of 7 November 2002 has not been determined.<br />
116
20. ordinary share capital (continued)<br />
<strong>Woolworths</strong> share appreciation rights scheme<br />
The share appreciation rights scheme provides executives with the opportunity to acquire shares of <strong>Woolworths</strong> <strong>Holdings</strong><br />
<strong>Limited</strong> through the grant of conditional share appreciation rights. These constitute rights to receive shares equal in value<br />
to the increase in the <strong>Woolworths</strong> <strong>Holdings</strong> <strong>Limited</strong> share price between the price on the grant date of the instruments<br />
and the price on the date on which they are exercised. Vesting of the share appreciation rights is subject to performance<br />
conditions as determined by the board of directors on an annual basis in respect of each new grant. The performance<br />
condition applied to grants is that the group’s headline earnings per share should increase by a cumulative 6.0% above<br />
inflation over a three-year period. If the performance condition is not met at the end of three years, retesting of the<br />
condition will be performed in year four and five against targets of growth in headline earnings per share exceeding<br />
cumulative inflation by 8.0% and 10.0% respectively.<br />
The share appreciation rights offered in terms of the scheme have the substance of an option and meet the definition of<br />
an equity-settled share-based payment.<br />
The share appreciation rights are valued using a binomial option pricing model, assuming a life of seven years. Other<br />
valuation assumptions include volatility set at historic trend levels, a continuous dividend yield of 7.3% and a risk-free<br />
interest rate based on the zero-coupon yield of SA government bonds with a term consistent with the life of the rights.<br />
Number of rights<br />
<strong>2010</strong> 2009<br />
Rights granted to participants<br />
Balance at the beginning of the period 18 108 112 7 986 544<br />
Granted 9 879 516 11 621 496<br />
Forfeited (1 911 573) (1 499 928)<br />
Balance at the end of the period 26 076 055 18 108 112<br />
Cumulative percentage of bonus shares vested at the end of the period – –<br />
Weighted average grant price of rights outstanding (rands) 12.38 10.51<br />
Number of participants on share appreciation rights scheme 362 306<br />
Period of offer<br />
Number of<br />
rights<br />
<strong>2010</strong><br />
Number of<br />
rights<br />
2009<br />
Original<br />
exercise<br />
price<br />
Current<br />
exercise<br />
price*<br />
Fair value<br />
at grant<br />
date<br />
16 April 2008 and 16 April 2013 6 296 117 6 990 076 11.95 10.26 2.78<br />
21 August 2008 and 21 August 2013 8 433 995 9 357 353 11.94 10.24 2.42<br />
19 February 2009 and 19 February 2014 1 629 681 1 760 683 12.95 12.95 2.54<br />
21 August 2009 and 27 August 2014 7 793 019 – 15.00 15.00 3.42<br />
18 February <strong>2010</strong> and 18 February 2015 1 409 489 – 19.74 19.74 5.21<br />
* The original exercise price has been adjusted to take into account the effect of the special dividend paid to ordinary<br />
shareholders in December 2008.<br />
117
NOTES<br />
TO THE GROUP ANNUAL FINANCIAL STATEMENTS<br />
20. ordinary share capital (continued)<br />
<strong>Woolworths</strong> long-term incentive plan<br />
The long-term incentive plan provides executives with the opportunity to acquire <strong>Woolworths</strong> <strong>Holdings</strong> <strong>Limited</strong><br />
shares by way of conditional awards of shares which are subject to the fulfilment of predetermined performance<br />
conditions covering a three-year period. The performance conditions applicable to this scheme are related to growth<br />
in headline earnings per share and the group’s total shareholder return (TSR) relative to the TSR of a peer group of<br />
24 companies listed on the JSE.<br />
No vesting occurs unless the real headline earnings per share growth of the group equals or exceeds 5.0% (2.0% for<br />
grants after April 2008) over the three-year period, while 100.0% vesting will occur if real headline earnings growth over<br />
the period equals or exceeds 13.0% (10.0% for grants after April 2008). In addition, no awards vest if the group’s TSR falls<br />
within the lower quartile when compared to the comparator group, while full vesting occurs if TSR falls within the upper<br />
quartile. These awards are based on the full value of <strong>Woolworths</strong> shares at that time plus an additional number of<br />
shares equal in value to the distributions that a participant would have earned if he had been the owner of the shares.<br />
Linear vesting occurs between the threshold level and full level of vesting for these two performance conditions.<br />
The long-term incentive plan constitutes an equity-settled share-based payment.<br />
The conditional awards are valued using a Monte Carlo simulation model, assuming a life of three years. Other<br />
valuation assumptions include volatility set at historic trend levels, a dividend yield of 6.4% and a risk-free interest rate<br />
based on the zero-coupon yield of SA government bonds with a term consistent with the life of the awards.<br />
Number of awards<br />
<strong>2010</strong> 2009<br />
Awards granted to participants<br />
Balance at the beginning of the period 3 444 033 1 259 425<br />
Granted 1 290 503 2 005 848<br />
Granted due to repricing* – 257 551<br />
Forfeited – (78 791)<br />
Balance at the end of the period 4 734 536 3 444 033<br />
Cumulative percentage of bonus shares vested at the end of the period – –<br />
Weighted average grant price of awards outstanding (rands) 12.81 11.99<br />
Number of participants on long-term incentive plan 24 22<br />
Period of offer<br />
Number of<br />
awards<br />
<strong>2010</strong><br />
Number of<br />
awards<br />
2009<br />
Exercise<br />
price<br />
Fair value<br />
at grant<br />
date<br />
16 April 2008 and 16 April 2013 1 178 616 1 467 014 11.95 8.41<br />
21 August 2008 and 21 August 2013 1 482 255 1 810 069 11.94 9.83<br />
19 February 2009 and 19 February 2014 166 950 166 950 12.95 12.00<br />
27 August 2009 and 27 August 2014 1 126 670 – 15.00 19.37<br />
* Additional awards have been granted to take into account the effect of the special dividend paid to the ordinary<br />
shareholders in December 2008.<br />
118
20. ordinary share capital (continued)<br />
<strong>Woolworths</strong> deferred bonus plan<br />
The deferred bonus plan allows selected executives to acquire <strong>Woolworths</strong> <strong>Holdings</strong> shares at the ruling market price<br />
out of a portion of their declared short-term performance bonus. A matching award (consisting of an equal number of<br />
<strong>Woolworths</strong> <strong>Holdings</strong> <strong>Limited</strong> shares) will be made to the participant after a three-year period on the condition that the<br />
participant remains in the employment of the group and retains the bonus shares over the period.<br />
The matching award is one <strong>Woolworths</strong> share for each share held plus an additional number of shares equal in value<br />
to distributions that a participant would have earned if he had been the owner of the matching shares from date of<br />
grant to date of vesting. The bonus shares meet the definition of an equity-settled share-based payment.<br />
Number of shares<br />
<strong>2010</strong> 2009<br />
Bonus shares granted to participants<br />
Balance at the beginning of the period 172 411 172 411<br />
Granted 152 709 –<br />
Balance at the end of the period 325 120 172 411<br />
Cumulative percentage of bonus shares vested at the end of the period – –<br />
Weighted average fair value of awards granted during the period (rands) 15.67 12.50<br />
Weighted average fair value of awards outstanding (rands) 13.96 12.50<br />
Number of participants on deferred bonus plan 5 5<br />
The fair value is measured on the closing share price of <strong>Woolworths</strong> <strong>Holdings</strong> <strong>Limited</strong> at date of acquisition of the<br />
shares by the participants of the scheme.<br />
119
NOTES<br />
TO THE GROUP ANNUAL FINANCIAL STATEMENTS<br />
20. ordinary share capital (continued)<br />
RESTRICTED SHARE PLAN<br />
The group operates a restricted share plan, details of which are given in the Remuneration Report. The ownership of these<br />
shares vests with <strong>Woolworths</strong> (Proprietary) <strong>Limited</strong> until service conditions are met by the employees.<br />
Shares granted in terms of the restricted share plan meet the definition of an equity-settled share-based payment. The<br />
terms and conditions of the scheme are detailed in the remuneration committee section of the corporate governance<br />
<strong>report</strong>. In terms of the plan, the group agreed to purchase equity instruments to the value of R87m in the current period<br />
for the benefit of the participants. The number of equity instruments granted was therefore the cumulative number of<br />
instruments purchased until the R87m target was met. The participants will be entitled to the dividends and voting rights on<br />
the shares from grant date and the vesting will be staggered over a three to five-year period.<br />
Vesting in respect of the three grants issued in the current year occurs as follows:<br />
Completed years of service subsequent to the effective date<br />
1 January<br />
<strong>2010</strong> and<br />
1 January<br />
2015<br />
percentage<br />
vested<br />
19 May <strong>2010</strong><br />
and<br />
19 May 2015<br />
percentage<br />
vested<br />
19 May <strong>2010</strong><br />
and<br />
19 May 2013<br />
percentage<br />
vested<br />
0-2 – – –<br />
3 33% 50% 100%<br />
4 33% 25% –<br />
5 34% 25% –<br />
Number of shares<br />
<strong>2010</strong> 2009<br />
Shares granted in terms of the restricted share plan<br />
Balance at the beginning of the period – –<br />
Issued 4 046 093 –<br />
Balance at the end of the period 4 046 093 –<br />
Market value at 27 June (rands) 25.20 –<br />
Percentage of shares vested at 27 June – –<br />
Weighted average price of shares purchased (rands) 21.45 –<br />
Number of participants 25 –<br />
Period of offer<br />
Number of<br />
shares<br />
<strong>2010</strong><br />
Number of<br />
shares<br />
2009<br />
Exercise<br />
price<br />
Fair value<br />
at grant date<br />
1 January <strong>2010</strong> and 1 January 2015 1 184 000 – – 16.89<br />
19 May <strong>2010</strong> and 19 May 2013 550 414 – – 23.34<br />
19 May <strong>2010</strong> and 19 May 2015 2 311 679 – – 23.34<br />
120
20. ordinary share capital (continued)<br />
Black economic empowerment scheme<br />
In 2008, the group’s Black Economic Empowerment scheme, in terms of which convertible, redeemable non-cumulative<br />
participating preference shares were issued to qualifying employees of the group, became effective.<br />
The beneficial ownership of the shares, including the voting and distribution rights, resides with the participants of the shares<br />
from the date of inception.<br />
The preference shares offered in terms of the scheme have the substance of an option and meet the definition of an equitysettled<br />
share-based payment. The terms and conditions of the scheme are detailed in the corporate governance <strong>report</strong>.<br />
The preference shares are convertible into ordinary shares to the extent that the growth in the <strong>Woolworths</strong> <strong>Holdings</strong> <strong>Limited</strong><br />
share price exceeds a predetermined hurdle rate at the end of the scheme. The preference shares are valued using the<br />
Black-Scholes model, assuming a life of eight years. In performing the valuation, the cost of the distribution stream attached<br />
to the scheme will be added to the option costs, as a traditional share option does not receive distributions. Other valuation<br />
assumptions include volatility set at historic trend levels, a dividend yield of 4.2%, a risk-free interest rate based on the zerocoupon<br />
yield of SA Government bonds with a term consistent with the life of the instrument. Staff retention rates are a key<br />
assumption and have been modelled, based on historical experience, per category of employees participating in the scheme,<br />
namely executive, management and broad-based employees.<br />
Number of shares<br />
<strong>2010</strong> 2009<br />
Shares held by participants<br />
Balance at the beginning of the period 88 267 306 88 267 306<br />
Issued – –<br />
Forfeited – –<br />
Early conversions – –<br />
Balance at the end of the period 88 267 306 88 267 306<br />
Percentage of shares vested at the end of the period – –<br />
Weighted average fair value of instruments (rands) 2.76 2.76<br />
Number of participants on share scheme 8 706 9 744<br />
Vesting occurs over an eight-year period as follows:<br />
Adjustment<br />
Completed years of service subsequent to the effective date<br />
percentage<br />
0-2 –<br />
3 16%<br />
4 23%<br />
5 33%<br />
6 48%<br />
7 69%<br />
8 100%<br />
Directors’ interest in shares<br />
Details of directors beneficial and non-beneficial interests in the shares of the company are disclosed in the directors’ <strong>report</strong>.<br />
Shares and share options granted to executive directors are set out in the remuneration <strong>report</strong> on pages 68 to 71 .<br />
121
NOTES<br />
TO THE GROUP ANNUAL FINANCIAL STATEMENTS<br />
<strong>2010</strong> 2009<br />
21. share premium<br />
Balance at the beginning of the period 142 116<br />
Share issues in terms of the share incentive scheme 47 26<br />
Share issues to <strong>Woolworths</strong> (Proprietary) <strong>Limited</strong> 619 –<br />
Distribution to shareholders (747) –<br />
Balance at the end of the period 61 142<br />
Rm<br />
Rm<br />
22. reserves<br />
Non-distributable reserve<br />
Foreign currency translation reserve 218 207<br />
Distributable reserves<br />
Share-based payment reserve<br />
Balance at the beginning of the period 203 133<br />
Share-based payments arising from the group’s share incentive schemes 149 70<br />
Shares 5 –<br />
Share options and other 33 23<br />
Black Economic Empowerment preference shares 68 47<br />
Deferred tax on share-based payments credited directly in equity 43 –<br />
Balance at the end of the period 352 203<br />
Financial instrument revaluation reserve<br />
Interest rate and foreign exchange derivative instruments (10) (45)<br />
Retained profit 4 079 2 834<br />
Company 434 95<br />
Arising on consolidation of subsidiaries 3 645 2 739<br />
4 421 2 992<br />
Nature and purpose of reserves<br />
Foreign currency translation reserve<br />
This reserve is used to record exchange differences arising from the translation of the results of foreign subsidiaries.<br />
Share-based payment reserve<br />
This reserve records the fair value of the vested portion of shares or share options (determined at grant date) granted in<br />
terms of the group’s share-based payment schemes.<br />
Refer note 20 for further details of the relevant schemes.<br />
Financial instrument revaluation reserve<br />
This reserve records the effective portion of the fair value movement on hedging instruments which are part of effective<br />
cash flow hedges.<br />
Retained profit<br />
Retained profit records the cumulative net profit or loss made by the group after deducting distributions to<br />
shareholders and other utilisations of the reserve.<br />
122
<strong>2010</strong> 2009<br />
23. interest-bearing borrowings<br />
Non-current – unsecured<br />
Floating rate loan maturing on 30 November <strong>2010</strong> – Jibar plus 1.65% – 1 000<br />
Floating rate loan maturing on 6 December 2012 – prime less 3.5% 500 500<br />
Finance lease liabilities (refer note 35) 21 32<br />
521 1 532<br />
Current – unsecured<br />
Floating rate loan maturing on 30 November <strong>2010</strong> – Jibar plus 1.65% 1 000 –<br />
Floating rate loan maturing on 19 July <strong>2010</strong> – 5.66% 20 –<br />
Finance lease liabilities (refer note 35) 14 15<br />
Rm<br />
Rm<br />
1 034 15<br />
Interest-bearing borrowings bear interest at variable, market-determined rates. These borrowings are measured at amortised<br />
cost which approximates fair value. Refer note 29.2.<br />
Interest on prime and Jibar-linked borrowings is payable on a quarterly basis. Interest on other loans is payable monthly.<br />
There have been no defaults or breaches of principal interest or redemption terms during the current or prior period.<br />
The finance lease liabilities are measured at amortised cost at an average effective rate of 20.8% (2009: 20.5%). Maturity period<br />
varies between one and five years (refer note 35). The fair value of the finance lease liabilities is estimated by discounting<br />
future cash flows using a market-related interest rate applicable to the group. The fair value of the finance lease liabilities<br />
amounted to R24m (2009: R38m) at the end of the period.<br />
Refer to the group’s liquidity risk management policies in note 29.4.<br />
24. trade and other payables<br />
Non-current<br />
Current<br />
Operating lease accrual 447 457<br />
447 457<br />
Trade payables 1 345 1 584<br />
Other payables 1 250 783<br />
Operating lease accrual 13 6<br />
2 608 2 373<br />
Trade and other payables are interest-free and have payment terms of up to 30 days.<br />
The carrying value of trade and other payables approximates the fair value.<br />
123
NOTES<br />
TO THE GROUP ANNUAL FINANCIAL STATEMENTS<br />
25. retirement benefit information<br />
<strong>Woolworths</strong> permanent employees under the age of 60 are contributory members of the Wooltru Group Retirement Fund.<br />
Certain employees, in addition to belonging to the Wooltru Group Retirement Fund, are contributory members of other<br />
retirement funds. All funds are defined-contribution funds and are registered under the Pension Funds Act of 1956, as<br />
amended. Actuarial valuations are carried out every three years for the Wooltru Retirement Fund and the other retirement<br />
funds in which <strong>Woolworths</strong> participates. The latest valuations of the Wooltru Group Retirement Fund as at 28 February 2008<br />
and the other funds as at 31 December 2007, confirmed that the funds were in a sound financial position.<br />
Country Road <strong>Limited</strong> provides superannuation benefits for various categories of employees in Australia. All funds are<br />
defined-contribution funds which are administered externally and provide for benefits for death, total disability, retirement<br />
and resignation. All benefits are provided on an accumulation of contributions basis and accordingly no actuarial<br />
assessment is required. Contributions vary from employee to employee as determined by various awards and negotiated<br />
conditions of employment. Future company contributions required to meet the superannuation guarantee charge and<br />
contributions under awards are legally enforceable.<br />
Total group contributions are charged to income as incurred and amounted to R186m (2009: R168m).<br />
<strong>Woolworths</strong> subsidises a portion of the medical benefit contributions of retired employees. The group values its accrued and<br />
future liability in respect of post-retirement medical benefit contributions annually in June. The liability was actuarially valued<br />
based on the healthcare benefits currently provided to staff using appropriate mortality and withdrawal assumptions.<br />
For the purposes of the valuation it was assumed that investment returns would be nil (2009: 10.7%). The discount rate used<br />
to value the liability at 27 June <strong>2010</strong> is 9.1% (2009: 9.0%) per annum.<br />
At 27 June <strong>2010</strong>, the accrued liability amounted to R292m (2009: R272m) in respect of those current and retired members of<br />
staff who participate in the Wooltru Healthcare Fund, the group’s in-house medical benefit scheme. At that date, <strong>Woolworths</strong><br />
had not funded the liability. Employees who joined the healthcare fund after 1 November 2000 are not entitled to receive<br />
post-retirement healthcare benefits.<br />
The funding status of Wooltru Healthcare Fund determined in terms of IAS 19 is as follows:<br />
<strong>2010</strong> 2009<br />
Rm<br />
Rm<br />
Funding liability 294 262<br />
Funding deficit 294 262<br />
Unrecognised actuarial gain (2) 10<br />
Net obligation 292 272<br />
Reconciliation:<br />
Net obligation at the beginning of the period 272 251<br />
Net movement charged to employment cost in the statement of comprehensive income<br />
(refer note 3.5) 30 33<br />
Current service cost 6 7<br />
Interest on obligation 24 26<br />
Expected return on assets – –<br />
Contribution paid (10) (8)<br />
Amount no longer consolidated due to disposal of controlling interest in subsidiaries* – (4)<br />
Net obligation at the end of the period 292 272<br />
Funding liability at the beginning of the period 262 247<br />
Interest cost 24 27<br />
Current service cost 6 7<br />
Contributions (10) (10)<br />
Amount no longer consolidated due to disposal of controlling interest in subsidiaries* – (4)<br />
Actuarial loss/(gain) 12 (5)<br />
Funding liability at the end of the period 294 262<br />
Fair value of plan assets at the beginning of the period – 1<br />
Expected returns – –<br />
Contributions – (1)<br />
Actuarial loss – –<br />
– –<br />
124
<strong>2010</strong><br />
Rm<br />
2009<br />
Rm<br />
2008<br />
Rm<br />
2007<br />
Rm<br />
2006<br />
Rm<br />
25. retirement benefit information<br />
(continued)<br />
Funding liability 294 262 247 230 202<br />
Fair value of assets – – 1 9 13<br />
Funding deficit 294 262 246 221 189<br />
Actuarial loss/(gain) on funding liability 13 (5) 1 8 (9)<br />
Actuarial (loss)/gain on plan assets – – (1) 2 3<br />
A one percentage point increase or decrease in the assumed medical inflation rate would have the following effect:<br />
<strong>2010</strong><br />
Medical inflation assumption 7.5% 6.5% 8.5%<br />
Service cost for the period ended June <strong>2010</strong> 6 5 8<br />
Interest cost for the period ended June <strong>2010</strong> 24 20 28<br />
Medical inflation assumption 7.5% 6.5% 8.5%<br />
Accrued liability at June <strong>2010</strong> 294 256 342<br />
2009<br />
Medical inflation assumption 7.5% 6.5% 8.5%<br />
Service cost for the period ended June 2009 7 5 8<br />
Interest cost for the period ended June 2009 27 23 31<br />
Medical inflation assumption 7.5% 6.5% 8.5%<br />
Accrued liability at June 2009 262 226 305<br />
The group anticipates making contributions amounting to R12m in the next financial period.<br />
* From 1 October 2008, due to the disposal of the controlling interest in WFS, the net post-retirement medical benefits liability<br />
for WFS is no longer included in the group obligation. The obligation relating to the employees of WFS is for the account of<br />
the joint venture.<br />
125
NOTES<br />
TO THE GROUP ANNUAL FINANCIAL STATEMENTS<br />
26. provisions<br />
Leave pay<br />
Rm<br />
Provision for<br />
onerous<br />
lease<br />
commitments<br />
Rm<br />
Employee<br />
benefits<br />
Rm<br />
Balance at the beginning of<br />
the period 140 34 76 – 250 213<br />
Raised 48 12 14 34 108 110<br />
Released – (3) – – (3) (3)<br />
Utilised (30) (9) (68) – (107) (67)<br />
Amount no longer consolidated due<br />
to the disposal of controlling interest<br />
in subsidiaries (refer note 36) – – – – – (3)<br />
Balance at the end of the period 158 34 22 34 248 250<br />
Other<br />
Rm<br />
Total<br />
<strong>2010</strong><br />
Rm<br />
Total<br />
2009<br />
Rm<br />
Leave pay<br />
The leave pay provision is calculated using the estimated number of leave days due to the employees as at the end of the<br />
financial period. The leave pay provision will unwind as employees utilise their leave entitlement.<br />
Provision for onerous lease commitments<br />
The provision for onerous lease commitments is calculated based on the present value of the unavoidable costs in fulfilling<br />
lease commitments, net of income receivable from the lease. The onerous lease commitments provision reverses as the lease<br />
term runs down or if conditions change to the extent that the lease is no longer onerous.<br />
Employee benefits<br />
The employee benefits provision consists primarily of Australian long-service leave entitlements. This provision is calculated<br />
based on the service period worked by each employee and probability assumptions are applied to determine the likelihood<br />
that an employee will eventually qualify for the entitlement. The provision unwinds as eligible employees redeem their<br />
entitlement or when the balance owing to an employee is paid out on termination of employment.<br />
OTHER<br />
The other provision consists of a restructuring provision and a provision for sales returns.<br />
<strong>2010</strong> 2009<br />
Rm<br />
Rm<br />
27. capital commitments<br />
Commitments in respect of capital expenditure not accrued at the <strong>report</strong>ing date<br />
Contracted for 183 144<br />
Not contracted for 603 480<br />
786 624<br />
This expenditure on items of a capital nature will be financed by cash generated from the group’s activities and from available<br />
borrowing facilities.<br />
126
28. contingent liabilities<br />
Various group companies are parties to legal disputes and investigations which arise in the ordinary course of business.<br />
Whilst the outcome of some of these matters cannot readily be foreseen, the directors do not expect the outcomes to have<br />
a material financial effect.<br />
29. financial risk management<br />
Exposure to credit, interest rate, currency and liquidity risks arises in the normal course of business. It is the group’s objective<br />
to minimise its exposure to the various financial risks through its risk management policies and procedures.<br />
The group attempts to manage financial risk where this involves activities in which it has appropriate competencies.<br />
To achieve this, the group’s treasury function is responsible for managing funding and the group’s financial risks within<br />
predetermined parameters.<br />
The group’s overall treasury policy is reviewed and approved by the <strong>Woolworths</strong> <strong>Holdings</strong> <strong>Limited</strong> board. The policy specifies<br />
the hedging level parameters, dealing limits (in terms of size and duration), the types of instruments that may be used,<br />
authorised counterparties and procedures for settling and recording transactions.<br />
In addition, a treasury committee <strong>report</strong>s regularly to the board on the implementation of treasury policies, focusing in<br />
particular on the amount of exposure to financial risk; the extent to which this risk is covered; the implications of expected<br />
future movement in market interest rates; as well as whether there are any deviations from treasury policy and the<br />
performance against budgets. Financial services credit risk is managed by a credit risk committee attended by two directors<br />
of the <strong>Woolworths</strong> <strong>Holdings</strong> <strong>Limited</strong> board.<br />
29.1 Foreign currency management<br />
The group is exposed to foreign exchange risk arising from various currency exposures, primarily with respect to<br />
the US dollar and the Australian dollar. Foreign exchange risk arises from commercial transactions, recognised assets<br />
and liabilities and net investments in foreign operations. It is the group’s policy to fully cover all committed exposures.<br />
Transactional foreign exchange risk<br />
The group has transactional currency exposures arising from the acquisition of goods and services in currencies other<br />
than the functional currency. It is the group’s policy that business units entering into such transactions must cover all<br />
such exposures with forward exchange contracts to hedge the risk of fluctuation in the foreign currency exchange rate<br />
(refer to the accounting policy note on hedge accounting).<br />
Forward exchange contracts at 27 June <strong>2010</strong> are summarised below. These amounts represent the net rand equivalent<br />
of group commitments to purchase and sell foreign currencies.<br />
Contract<br />
foreign<br />
currency<br />
amount<br />
Rand<br />
equivalent<br />
Rm<br />
Average<br />
rate<br />
R<br />
Fair-value<br />
adjustment<br />
Rm<br />
<strong>2010</strong><br />
Forward exchange contract<br />
US dollar 128 1 003 7.81 5<br />
British pound 2 27 11.52 –<br />
Euro 2 26 10.73 (3)<br />
1 056 2<br />
2009<br />
Forward exchange contract<br />
US dollar 145 1 311 9.02 (135)<br />
British pound 2 23 13.43 –<br />
Euro 1 16 11.83 (1)<br />
1 350 (136)<br />
127
NOTES<br />
TO THE GROUP ANNUAL FINANCIAL STATEMENTS<br />
29. financial risk management (continued)<br />
29.1 Foreign currency management (continued)<br />
Transactional foreign exchange risk (continued)<br />
At 27 June <strong>2010</strong>, the group held 305 (2009: 256) forward exchange contracts designated as hedges of expected future<br />
purchases from suppliers outside South Africa for which the group has firm commitments. Of these, 92 (2009: 126) are<br />
designated cash flow hedges in an effective hedging relationship.<br />
The cash flow hedges resulted in a net unrealised gain of R1m (2009: gain of R56m) with a related deferred tax<br />
asset/(liability) of R0.3m (2009: liability R17m) which was included in other comprehensive income in respect of<br />
these contracts.<br />
The remaining 213 (2009: 130) forward exchange contracts are not designated as cash flow hedges. During the period,<br />
a gain amounting to R2m (2009: loss of R79m) was recognised in the statement of comprehensive income in respect<br />
of these forward exchange contracts.<br />
The following exchange rates applied during the period:<br />
Average rate<br />
Closing rate<br />
<strong>2010</strong> 2009 <strong>2010</strong> 2009<br />
US dollar/R 7.61 9.05 7.60 7.90<br />
Australian dollar/R 6.71 6.67 6.63 6.42<br />
A reasonably possible change in the group’s material transactional foreign currencies, with all other variables being<br />
equal, will increase or decrease the profit before tax and equity of the group.<br />
In the table below, the sensitivity of the group’s exposure to foreign currency risk is estimated by assessing the impact<br />
that a reasonably possible movement over the next 12 months in foreign exchange rates would have had on the profits<br />
and equity of the group at the <strong>report</strong>ing date.<br />
Movement in<br />
foreign<br />
exchange<br />
rate<br />
Decrease/<br />
(increase)<br />
on profit<br />
before tax<br />
Rm<br />
Decrease/<br />
(increase)<br />
on equity<br />
Rm<br />
US dollar<br />
<strong>2010</strong><br />
Foreign creditors +5% 4 3<br />
-5% (4) (4)<br />
Forward exchange contracts +5% (3) (28)<br />
-5% 3 31<br />
2009<br />
Foreign creditors +10% 11 (8)<br />
-10% (10) 7<br />
Forward exchange contracts +10% (46) (101)<br />
-10% 46 89<br />
128
29. financial risk management (continued)<br />
29.1 Foreign currency management (continued)<br />
Transactional foreign exchange risk (continued)<br />
Translational foreign exchange risk<br />
Net investments in foreign subsidiaries<br />
The group has investments in foreign subsidiaries whose net assets (including cash) are exposed to foreign currency<br />
translation risk. This risk is not hedged.<br />
<strong>2010</strong> 2009<br />
Rm<br />
Rm<br />
The group has unhedged interests in foreign subsidiaries of:<br />
US dollar 473 434<br />
Euro (500) (532)<br />
Australian dollar 209 12<br />
A reasonably possible change in the group’s material translational foreign currencies, with all other variables being<br />
equal, will increase or decrease the profits or equity of the group.<br />
The sensitivity of the group to such changes is presented in the table below. Reasonably possible changes over the next<br />
12 months in the group’s material translational foreign currencies will result in movements in other comprehensive income<br />
observed in the foreign currency translation reserve.<br />
Movement in<br />
foreign<br />
exchange<br />
rate<br />
Decrease/<br />
(increase)<br />
in other<br />
comprehensive<br />
income<br />
Rm<br />
<strong>2010</strong><br />
US dollar +5% (24)<br />
-5% 24<br />
Euro +5% 25<br />
-5% (25)<br />
Australian dollar +5% (1)<br />
-5% 1<br />
2009<br />
US dollar +10% (43)<br />
-10% 43<br />
Euro +10% 53<br />
-10% (53)<br />
Australian dollar +10% (1)<br />
-10% 1<br />
129
NOTES<br />
TO THE GROUP ANNUAL FINANCIAL STATEMENTS<br />
29. financial risk management (continued)<br />
29.1 Foreign currency management (continued)<br />
Transactional foreign exchange risk (continued)<br />
Foreign cash<br />
The group has exposure to foreign currency translation risk through cash balances in currencies other than the South<br />
African rand. This risk is not hedged. Refer note 33.5.<br />
<strong>2010</strong> 2009<br />
Rm<br />
Rm<br />
Foreign cash balances are concentrated in the following major currencies:<br />
US dollar 12 13<br />
Australian dollar 71 166<br />
83 179<br />
The sensitivity of the group’s equity to changes in foreign cash balances resulting from a reasonably possible change in<br />
material foreign currencies in which the group transacts is presented below.<br />
Movement<br />
in foreign<br />
exchange<br />
rate<br />
Decrease/<br />
(increase)<br />
in other<br />
comprehensive<br />
income<br />
Rm<br />
<strong>2010</strong><br />
US dollar +5% (1)<br />
-5% 1<br />
Australian dollar +5% (4)<br />
-5% 4<br />
2009<br />
US dollar +10% (1)<br />
-10% 1<br />
Australian dollar +10% (17)<br />
-10% 17<br />
29.2 Interest rate management<br />
The group’s interest rate risk arises from interest-bearing borrowings, cash and cash equivalents, and prior to the<br />
transaction mentioned in note 36, financial service assets.<br />
Borrowings issued at floating rates expose the group to cash flow interest rate risk, while fixed rate borrowings<br />
expose the group to fair value interest rate risk. As part of the process of managing the group’s fixed and floating<br />
rate borrowings mix, the interest rate characteristics of new borrowings and refinancing of existing borrowings<br />
are positioned according to expected movements in interest rates.<br />
In order to hedge the group’s exposure to the cash flow interest rate risk, the group uses derivative instruments such<br />
as interest rate swaps and collars.<br />
The group is also exposed to the cash flow interest rate risk from its floating rate cash and cash equivalents. The cash<br />
flow interest rate sensitivity of the cash and cash equivalents is based on period-end cash balances.<br />
130
29. financial risk management (continued)<br />
29.2 Interest rate management (continued)<br />
The sensitivity of the group’s profits and equity to its exposure to interest rate risk from borrowings is presented below.<br />
The analysis considers the impact of a reasonably possible change over the next 12 months in 3-month Jibar, with all<br />
other variables held constant. At the <strong>report</strong>ing date, 3-month Jibar is 6.6% (2009: 7.6%).<br />
Movement in<br />
basis points<br />
Decrease/<br />
(increase)<br />
on profit<br />
before tax<br />
Rm<br />
Decrease/<br />
(increase)<br />
in other<br />
comprehensive<br />
income<br />
Rm<br />
<strong>2010</strong><br />
Floating rate loans +50 5 4<br />
-50 (5) (4)<br />
Interest rate derivatives +50 – (3)<br />
-50 – 3<br />
2009<br />
Floating rate loans +50 – –<br />
-100 (1) (1)<br />
Interest rate derivatives +50 – (6)<br />
-100 – 11<br />
Reasonably possible changes in the prime interest rate will also impact the group’s profits and equity. The sensitivity of<br />
the group’s exposure to this variable is presented below.<br />
<strong>2010</strong><br />
Other floating rate loans +50 3 2<br />
-50 (3) (2)<br />
Cash and cash equivalents +50 14 10<br />
-50 (14) (10)<br />
2009<br />
Other floating rate loans +50 – –<br />
-100 (1) –<br />
Cash and cash equivalents +50 (12) (9)<br />
-100 24 17<br />
As at the <strong>report</strong>ing date, the prime interest rate is 10.0% (2009: 11.0%).<br />
131
NOTES<br />
TO THE GROUP ANNUAL FINANCIAL STATEMENTS<br />
29. financial risk management (continued)<br />
29.2 Interest rate management (continued)<br />
The interest rate pricing profile at 27 June <strong>2010</strong> is summarised as follows:<br />
Rm<br />
<strong>2010</strong> 2009<br />
Effective<br />
interest<br />
rate<br />
% Rm<br />
Effective<br />
interest<br />
rate<br />
%<br />
Local interest-bearing borrowings<br />
Floating rate 1 500 8.1 1 500 12.1<br />
% of total borrowings 98.7 100.0<br />
Foreign interest-bearing borrowings 20 –<br />
Floating rate loan maturing on 19 July <strong>2010</strong> – 5.7% 1.3% –<br />
The fair values of the financial instruments at 27 June <strong>2010</strong> are included in note 19. These fair values are supported by<br />
observable current market transactions in similar instruments.<br />
The interest rate swaps and collars are designated as cash flow hedges. These hedges were assessed to be highly<br />
effective resulting in a net unrealised loss of R20m (2009: loss of R15m) being recognised in equity. The related deferred<br />
tax charged to equity amounted to R6m (2009: R4m).<br />
The carrying amounts of the group’s financial liabilities that are exposed to interest rate risk are as follows:<br />
On demand < 3 months 3-12 months 1-5 years > 5 years<br />
Rm Rm Rm Rm Rm<br />
<strong>2010</strong><br />
Floating rate<br />
Loan bearing interest at 3-month Jibar<br />
plus 1.7% – – 1 000 – –<br />
Loan bearing interest at prime less 3.5% – – – 500 –<br />
Floating rate loan maturing on<br />
19 July <strong>2010</strong> – 5.7% – 20 – – –<br />
Interest rate swaps and collars – – 5 15 –<br />
2009<br />
Floating rate<br />
Loan bearing interest at 3-month Jibar<br />
plus 1.7% – – – 1 000 –<br />
Loan bearing interest at prime less 3.5% – – – 500 –<br />
Interest rate swaps and collars – – – 15 –<br />
132
29. financial risk management (continued)<br />
29.3 Credit risk management<br />
Credit risk arises from cash and cash equivalents, trade and other receivables and derivative financial instruments,<br />
as well as credit exposure to the group’s participation in export partnerships and other loans. The group’s maximum<br />
exposure to credit risk is equal to the carrying amount of these classes of assets. Refer note 29.5.<br />
The group only deposits short-term cash surpluses and enters into derivative contracts with major banks of high-quality<br />
credit standing.<br />
Trencor <strong>Limited</strong> has materially warranted certain important cash flow aspects of the group’s participation in export<br />
partnerships, thus the credit quality of this receivable is considered to be high.<br />
Trade and other receivables consist mainly of franchise and property-related debtors. Rigorous credit-granting<br />
procedures are applied to assess the credit quality of the customer, taking into account its financial position, credit<br />
rating and other factors.<br />
Other loans include housing loans to employees and share purchase loans to directors of the group. Security of housing<br />
loans is required, while share purchase loans are secured by shares in <strong>Woolworths</strong> <strong>Holdings</strong> <strong>Limited</strong>.<br />
The holding company is exposed to credit risk mainly through amounts owing by subsidiaries and by its participation<br />
in export partnerships.<br />
Credit quality of financial assets<br />
The credit quality of financial assets that are neither past due nor impaired can be assessed by reference to external<br />
credit ratings (if available) or to historical information about counterparty default rates:<br />
<strong>2010</strong> 2009<br />
Rating Rm Rating Rm<br />
Financial assets<br />
Participation in export partnerships High grade 63 High grade 65<br />
Other loans High grade 95 High grade 126<br />
Cash and cash equivalents High grade 2 917 High grade 2 391<br />
Derivative financial instruments High grade 20 High grade 6<br />
Trade and other receivables High grade 534 High grade 543<br />
Ratings<br />
High grade – debtors are considered to have low credit risk when they have high-quality credit standing or a guarantee<br />
on the amount owing is provided.<br />
133
NOTES<br />
TO THE GROUP ANNUAL FINANCIAL STATEMENTS<br />
29. financial risk management (continued)<br />
29.4 Liquidity management<br />
Liquidity risk management includes maintaining sufficient cash and cash equivalents, the availability of funding from<br />
adequate banking facilities ranging from overnight to 364-day facilities and the ability to close out market positions.<br />
The group has minimised its liquidity risk as shown by its substantial undrawn banking facilities.<br />
<strong>2010</strong> 2009<br />
Rm<br />
Rm<br />
Banking facilities<br />
Total banking facilities 2 463 3 477<br />
Less: Drawn down portion (20) –<br />
Total undrawn banking facilities 2 443 3 477<br />
All facilities and any security provided must be approved by the board.<br />
The group’s policy is to maintain appropriate committed and uncommitted banking facilities.<br />
The undiscounted cash flows of the group’s borrowings, payables and derivative financial liabilities fall into the<br />
following maturity profiles:<br />
On demand < 3 months 3-12 months 1-5 years > 5 years<br />
Rm Rm Rm Rm Rm<br />
<strong>2010</strong><br />
Interest-bearing borrowings – 20 1014 521 –<br />
Forward exchange contracts – 20 – 15 –<br />
Trade and other payables – 2 418 – – –<br />
2009<br />
Interest-bearing borrowings – – 16 1 532 –<br />
Forward exchange contracts – 50 92 – –<br />
Trade and other payables – 2 266 – – –<br />
Borrowing capacity<br />
In terms of the company’s Articles of Association, there is no limit on the group’s authority to raise interest-bearing debt.<br />
134
29. financial risk management (continued)<br />
29.5 Financial instruments by category<br />
The accounting policies for financial instruments have been applied to the line items below:<br />
Loans and<br />
receivables<br />
Rm<br />
Financial<br />
assets at<br />
fair value<br />
through<br />
profit or loss<br />
Rm<br />
Derivatives<br />
used as<br />
hedging<br />
instruments<br />
Rm<br />
Nonfinancial<br />
assets<br />
Rm<br />
<strong>2010</strong><br />
Assets as per statement of financial<br />
position<br />
Participation in export partnerships 63 – – – 63<br />
Other loans 95 – – – 95<br />
Trade and other receivables 571 – – 188 759<br />
Derivative financial instruments – – 20 – 20<br />
Cash 2 917 – – – 2 917<br />
Total 3 646 – 20 188 3 854<br />
Total<br />
Rm<br />
Financial<br />
liabilities at<br />
amortised<br />
cost<br />
Rm<br />
Financial<br />
liabilities at<br />
fair value<br />
through<br />
profit or loss<br />
Rm<br />
Derivatives<br />
used as<br />
hedging<br />
instruments<br />
Rm<br />
Nonfinancial<br />
liabilities<br />
Rm<br />
Liabilities as per statement of financial<br />
position<br />
Interest-bearing borrowings 1 555 – – – 1 555<br />
Trade and other payables 2 418 – – 190 2 608<br />
Derivative financial instruments – – 35 – 35<br />
Total 3 973 – 35 190 4 198<br />
Total<br />
Rm<br />
135
NOTES<br />
TO THE GROUP ANNUAL FINANCIAL STATEMENTS<br />
29. financial risk management (continued)<br />
29.5 Financial instruments by category (continued)<br />
The accounting policies for financial instruments have been applied to the line items below:<br />
Loans and<br />
receivables<br />
Rm<br />
Financial<br />
assets at<br />
fair value<br />
through<br />
profit or loss<br />
Rm<br />
Derivatives<br />
used as<br />
hedging<br />
instruments<br />
Rm<br />
Nonfinancial<br />
assets<br />
Rm<br />
2009<br />
Assets as per statement of financial position<br />
Participation in export partnerships 65 – – – 65<br />
Other loans 126 – – – 126<br />
Trade and other receivables 640 – – 105 745<br />
Derivative financial instruments – – 6 – 6<br />
Cash 2 391 – – – 2 391<br />
Total 3 222 – 6 105 3 333<br />
Total<br />
Rm<br />
Financial<br />
liabilities at<br />
amortised<br />
cost<br />
Rm<br />
Financial<br />
liabilities at<br />
fair value<br />
through<br />
profit or loss<br />
Rm<br />
Derivatives<br />
used as<br />
hedging<br />
instruments<br />
Rm<br />
Nonfinancial<br />
liabilities<br />
Rm<br />
Liabilities as per statement of financial position<br />
Interest-bearing borrowings 1 547 – – – 1 547<br />
Trade and other payables 2 266 – – 107 2 373<br />
Derivative financial instruments – 79 78 – 157<br />
Total 3 813 79 78 107 4 077<br />
Total<br />
Rm<br />
The maximum exposure to credit risk at the <strong>report</strong>ing date is the carrying value of each class of receivable mentioned<br />
above.<br />
136
29. financial risk management (continued)<br />
29.6 Gains and losses on financial instruments<br />
The table below summarises the gains and (losses) on financial instruments:<br />
Fair value<br />
movement<br />
Rm<br />
Investment<br />
income<br />
Rm<br />
Interest<br />
expense<br />
Rm<br />
Impairment<br />
loss<br />
Rm<br />
<strong>2010</strong><br />
Loans and receivables – 175 – (4) 171<br />
Financial liabilities at amortised cost – – 151 – 151<br />
Financial instruments at fair value through<br />
profit or loss 2 – – – 2<br />
Derivatives used as hedging instruments 54 – – – 54<br />
Total 56 175 151 (4) 378<br />
Total<br />
Rm<br />
2009<br />
Loans and receivables – 184 – (22) 162<br />
Financial liabilities at amortised cost – – 281 – 281<br />
Financial instruments at fair value through<br />
profit or loss (79) – – – (79)<br />
Derivatives used as hedging instruments (71) – – – (71)<br />
Total (150) 184 281 (22) 293<br />
All financial instruments at fair value through profit or loss of the group are classified as held for trading.<br />
The R380m gain in the prior period on disposal of a controlling interest in WFS (refer note 36) includes the profit or loss on<br />
disposal of financial instruments. The group has not allocated any amount to this note.<br />
137
NOTES<br />
TO THE GROUP ANNUAL FINANCIAL STATEMENTS<br />
29. financial risk management (continued)<br />
29.7 Fair value of financial instruments<br />
The Group uses a three-level hierarchy to prioritise the inputs used in measuring fair value. The levels within the<br />
hierarchy are described below with level 1 having the highest priority and level 3 having the lowest.<br />
Level 1 – quoted prices (unadjusted) in active markets for identical assets or liabilities.<br />
Level 2 – inputs other than quoted prices included within Level 1 that are observable for the asset or liability, either<br />
directly (i.e. as prices) or indirectly (i.e. derived from prices).<br />
Level 3 – inputs for the assets or liabilities that are not based on observable market data (unobservable inputs).<br />
Set out below is a comparison by category of carrying amounts and fair values of all of the group’s financial instruments:<br />
Fair value Carrying amount Fair value<br />
measurement <strong>2010</strong> 2009 <strong>2010</strong> 2009<br />
using Rm Rm Rm Rm<br />
Financial assets<br />
Participation in export<br />
partnerships (note 14) 63 65 63 65<br />
Other loans (note 15) 95 126 95 126<br />
Trade and other receivables (note 18) 571 640 571 640<br />
Derivative financial instruments (note 19) 20 6 20 6<br />
Forward exchange<br />
contracts Level 2 18 6 18 6<br />
Inflation swap instrumentsnot<br />
hedge accounted Level 2 2 – 2 –<br />
Cash (note 33) 2 917 2 391 2 917 2 391<br />
Financial liabilities<br />
Interest-bearing borrowings (note 23) 1 555 1 547 1 544 1 538<br />
Trade and other payables (note 24) 2 418 2 266 2 418 2 266<br />
Derivative financial instruments (note 19) 35 157 35 157<br />
Forward exchange<br />
contracts Level 2 20 142 20 142<br />
Interest rate swaps and<br />
collars Level 2 15 15 15 15<br />
Fair-value information for other financial instruments not carried at fair value is provided in the respective notes<br />
to these financial statements.<br />
138
30. management of capital<br />
Prior to the disposal of a controlling interest in WFS, the group’s strategy was to maintain a debt ratio of between 80.0% and<br />
85.0% for the financial services segment.<br />
Group strategy is now to maintain a broadly neutral net debt position.<br />
The group considers share capital (refer note 20), share premium (refer note 21), non-distributable and distributable reserves<br />
(refer note 22) as capital. Management has made progress in meeting the following objectives:<br />
– to provide an adequate return to shareholders;<br />
– to safeguard <strong>Woolworths</strong>’ ability to continue as a going concern;<br />
– to be flexible and take advantage of opportunities that are expected to provide an adequate return to shareholders; and<br />
– to use excess cash to buy back shares in order to maximise shareholder value by enhancing both earnings per share<br />
and return on equity.<br />
The management of capital is reviewed by the board of directors on a quarterly basis. The group will manage the overall<br />
capital structure through payments to shareholders and share repurchases.<br />
The group manages its capital structure and makes adjustments to it in light of changes in economic conditions and the needs<br />
of the group. The group monitors capital using return on equity (ROE).<br />
The group’s policy is to keep ratios in line with annual targets.<br />
<strong>2010</strong> 2009<br />
Return on equity 39.4% 26.3%<br />
The group ensures that it complies with the liquidity and solvency requirements for any share repurchase or dividend payment<br />
per Companies Act.<br />
Debt covenants, which exist on long-term borrowings, are monitored by management on an ongoing basis. There has been<br />
no breach of any covenants during the year.<br />
139
NOTES<br />
TO THE GROUP ANNUAL FINANCIAL STATEMENTS<br />
31. comparative figures<br />
RECLASSIFICATIONS OF COMPARATIVE FIGURES<br />
Investment income has been separately disclosed from other revenue and is excluded from operating profit.<br />
This reclassification had no impact on <strong>report</strong>ed results.<br />
<strong>2010</strong> 2009<br />
32. distributions to shareholders<br />
Ordinary shareholders:<br />
Distribution no. 22 of 49.5 cents per share was declared on 20 August 2008 and paid on<br />
15 September 2008 – 437<br />
Less: Distribution received on treasury shares – (43)<br />
Distribution no. 23 of 94.0 cents per share was declared on 19 November 2008 and paid on<br />
15 December 2008 – 832<br />
Less: Distribution received on treasury shares – (82)<br />
Distribution no. 24 of 31.5 cents per share was declared on 19 February 2009 and paid on<br />
16 March 2009 – 252<br />
Less: Distribution received on treasury shares – (5)<br />
Distribution no. 25 of 53.5 cents per share was declared on 26 August 2009 and paid on<br />
28 September 2009 429 –<br />
Less: Distribution received on treasury shares (14) –<br />
Distribution no. 26 of 38.0 cents per share was declared on 17 February <strong>2010</strong> and paid on<br />
6 April <strong>2010</strong> 318 –<br />
Less: Distribution received on treasury shares (26) –<br />
Rm<br />
Rm<br />
Preference shareholders:<br />
Distribution no. 3 of 7.9 cents per share was declared on 20 August 2008 and paid on<br />
15 September 2008 – 7<br />
Less: Distribution accruing to the holding company – (2)<br />
Distribution no. 4 of 5.0 cents per share was declared on 19 February 2009 and paid on<br />
16 March 2009 – 4<br />
Less: Distribution accruing to the holding company – (1)<br />
Distribution no. 5 of 12.3 cents per share was declared on 26 August 2009 and paid on<br />
28 September 2009 11 –<br />
Less: Distribution accruing to the holding company (5) –<br />
Distribution no. 6 of 8.7 cents per share was declared on 17 February <strong>2010</strong> and paid on<br />
6 April <strong>2010</strong> 8 –<br />
Less: Distribution accruing to the holding company (3) –<br />
Total net distributions paid 718 1 399<br />
Distribution no. 27 of 67.0 cents per share was declared to ordinary shareholders on 25 August <strong>2010</strong>.<br />
Distribution no. 7 of 22.1 cents per share was declared to preference shareholders on 25 August <strong>2010</strong>.<br />
140
<strong>2010</strong> 2009<br />
33. cash flow information<br />
33.1 Cash flow from trading<br />
Profit before exceptional item 1 759 1 426<br />
Earnings from associate (6) (12)<br />
Earnings from joint ventures (75) (58)<br />
Depreciation and amortisation 442 401<br />
Interest paid 151 281<br />
Interest received (175) (557)<br />
Loss on sale of property, plant and equipment 24 4<br />
Movement in working capital and other provisions 26 27<br />
Post-retirement medical benefit provision 30 25<br />
Prepaid employment cost 6 6<br />
Share-based payments 106 70<br />
Operating lease accrual (3) 4<br />
Unrealised foreign exchange (profits)/losses (65) 35<br />
Net inflow from trading 2 220 1 652<br />
33.2 Working capital movements<br />
Inventories 24 (361)<br />
Trade and other receivables 26 (216)<br />
Trade and other payables 165 644<br />
Net inflow 215 67<br />
33.3 Tax paid<br />
Normal and foreign tax<br />
Amounts (owing)/receivable at the beginning of the period (107) 47<br />
Amounts charged to statement of comprehensive income (538) (356)<br />
Foreign currency translation reserve (1) 4<br />
Amount no longer consolidated due to disposal of controlling interest<br />
in subsidiary (refer note 36) – (34)<br />
Amounts owing at the end of the period 279 107<br />
Cash amounts paid (367) (232)<br />
Secondary tax on companies<br />
Amounts charged to statement of comprehensive income – (138)<br />
Total tax paid (367) (370)<br />
33.4 DISTRIBUTION paid to shareholders<br />
Normal distribution to shareholders (725) (655)<br />
Special dividend to shareholders – (750)<br />
Amounts charged to statement of changes in equity and paid (725) (1 405)<br />
33.5 Cash and cash equivalents<br />
Cash<br />
Interest earning<br />
Local – variable at interest rates of 4.0% to 5.0% (2009: 2.0% to 9.5%) 352 160<br />
Local – dividend account at an interest rate of 4.0% to 5.0% (2009: 2.0% to 9.5%) 41 39<br />
Foreign – variable at interest rates of 0.1% to 0.2% (2009: 0.1% to 6.8%) Refer note 29.1. 83 179<br />
Short-term interest-bearing deposits – variable at interest rates of 6.3% to 9.8%<br />
(2009: 7.0% to 7.3%) maturing between 1 to 3 months 2 441 2 013<br />
Cash and cash equivalents 2 917 2 391<br />
Rm<br />
Rm<br />
The carrying value of cash and cash equivalents is considered to approximate the fair value.<br />
141
NOTES<br />
TO THE GROUP ANNUAL FINANCIAL STATEMENTS<br />
34. operating leases<br />
The group has entered into various operating lease agreements on premises. Leased premises are contracted for remaining<br />
periods of between one and 12 years with further renewal options thereafter.<br />
The commitments disclosed below comprise the minimum payments as well as additional contingent payments based on<br />
expected turnover levels.<br />
<strong>2010</strong> 2009<br />
Rm<br />
Rm<br />
34.1 Operating lease commitments<br />
Land and buildings:<br />
<strong>2010</strong>/11 1 034 930<br />
2011/12 to 2014/15 3 078 3 426<br />
Thereafter 2 040 1 580<br />
34.2 Future minimum sub-lease payments expected to be received from<br />
franchisees and other tenants under non-cancellable operating leases as<br />
principal lessor at the end of the period<br />
Land and buildings:<br />
<strong>2010</strong>/11 21 25<br />
2011/12 to 2014/15 47 57<br />
Thereafter 23 11<br />
34.3 Future minimum sub-lease payments expected to be received from<br />
franchisees and other tenants under non-cancellable operating leases as<br />
sub-lessor at the end of the period<br />
Land and buildings:<br />
<strong>2010</strong>/11 21 18<br />
2011/12 to 2014/15 18 30<br />
Thereafter 1 2<br />
40 50<br />
The operating lease accrual of R460m (2009: R463m) represents the difference between the cash flow impact and<br />
statement of comprehensive income impact of the above leases (refer note 24).<br />
Contingent rent payable is calculated based on turnover level. The amount recognised in the statement of<br />
comprehensive income was R80m (2009: R62m).<br />
The total minimum lease payments recognised in the statement of comprehensive income during the period amounts<br />
to R1 054m (2009: R969m).<br />
The total minimum lease payments received during the period amount to R46m (2009: R53m).<br />
142
35. finance leases<br />
The group has entered into finance leases for various items of vehicles and computer equipment. These leases have terms of<br />
renewal between three and five years. Future minimum lease payments under finance leases together with the present value<br />
of the net minimum lease payments are as follows:<br />
Minimum<br />
payments<br />
<strong>2010</strong> 2009<br />
Present value<br />
of payments<br />
Minimum<br />
payments<br />
Present value<br />
of payments<br />
Rm Rm Rm Rm<br />
Within one year 17 14 17 15<br />
Between one and five years 23 21 32 32<br />
Total minimum lease payments 40 35 49 47<br />
Less amounts representing finance charges (5) – (2) –<br />
Present value of minimum lease payments 35 35 47 47<br />
143
NOTES<br />
TO THE GROUP ANNUAL FINANCIAL STATEMENTS<br />
36. disposal group<br />
On 1 October 2008, <strong>Woolworths</strong> Financial Services (Proprietary) <strong>Limited</strong> issued shares to Absa Bank <strong>Limited</strong> to the value of<br />
R875m resulting in the dilution of the group’s shareholding to 50% less one share and a net profit on disposal of a controlling<br />
interest, of R380m.<br />
The carrying value of assets and liabilities of WFS at the transaction date were as follows:<br />
<strong>2010</strong> 2009<br />
Loans to customers – 1 008<br />
<strong>Woolworths</strong> card debtors – 3 461<br />
Credit card receivables – 950<br />
Property, plant and equipment – 8<br />
Intangible assets – 3<br />
Cash – 535<br />
Other receivables and deferred tax – 185<br />
Assets – 6 150<br />
Interest-bearing borrowings – (2 179)<br />
Other payables, deferred tax and provisions – (3 019)<br />
Liabilities – (5 198)<br />
Rm<br />
Rm<br />
Net asset value on disposal of controlling interest – 952<br />
The net profit on disposal is as follows:<br />
Proceeds – 875<br />
Additional consideration received – 29<br />
Net asset value of WFS disposed – (476)<br />
– 428<br />
Costs incurred on disposal of interest in WFS – (48)<br />
Net profit on disposal of controlling interest – 380<br />
The difference between the net asset value at disposal and net assets classified as held for sale is mainly due to the<br />
intercompany loan amount having been settled by the joint venture partner.<br />
144
37. investment in joint ventures<br />
The group has the following interest in joint ventures:<br />
Name of the joint venture<br />
% interest<br />
held<br />
Nature of business<br />
<strong>Woolworths</strong> Financial Services (Proprietary) <strong>Limited</strong> 50.0% The company provides financial services<br />
to <strong>Woolworths</strong> customers.<br />
Nedglen Property Development (Proprietary) <strong>Limited</strong> 30.0% The company is involved in property<br />
development and investment.<br />
The following amounts represent the group’s share of the aggregate amount of the assets and liabilities, and income and<br />
expenses of the joint ventures:<br />
<strong>2010</strong> 2009<br />
Rm<br />
Rm<br />
Assets<br />
Current assets 2 866 3 065<br />
Non-current assets 77 63<br />
2 943 3 128<br />
Liabilities<br />
Current liabilities (71) (171)<br />
Non-current liabilities (2 298) (2 423)<br />
(2 369) (2 594)<br />
Net asset value 574 534<br />
Income 801 670<br />
Expenses (726) (612)<br />
Profit after tax 75 58<br />
Share of the capital commitment of the joint ventures are as follows:<br />
<strong>Woolworths</strong> Financial Services (Proprietary) <strong>Limited</strong> – 16<br />
Nedglen Property Development (Proprietary) <strong>Limited</strong> – –<br />
There are no contingent liabilities relating to the group’s interest in the joint venture, and no contingent liabilities of the<br />
venture itself.<br />
38. events after the REPORTING date<br />
No event material to the understanding of these financial statements has occurred between the end of the financial period<br />
and the date of approval.<br />
145
NOTES<br />
TO THE GROUP ANNUAL FINANCIAL STATEMENTS<br />
39. segmental information<br />
39.1 segmentation based on nature of business and retail chain<br />
Total<br />
Rm<br />
Intragroup<br />
Rm<br />
Clothing<br />
and<br />
General<br />
Merchandise<br />
Rm<br />
<strong>2010</strong><br />
SA Retail<br />
Food<br />
Rm<br />
Logistics<br />
Rm<br />
Country<br />
Road<br />
Rm<br />
Treasury<br />
Rm<br />
<strong>Woolworths</strong><br />
Financial<br />
Services<br />
Rm<br />
Operating results<br />
Revenue 23 663 (43) 8 274 12 292 417 2 548 175 –<br />
Turnover 23 393 – 8 253 12 227 417 2 496 – –<br />
Cost of sales 15 735 (77) 4 943 9 389 417 1 063 – –<br />
Abnormal foreign<br />
exchange related gain* 79 – 79 – – – – –<br />
Gross profit 7 737 77 3 389 2 838 – 1 433 – –<br />
Other revenue 95 (43) 21 65 – 52 – –<br />
Expenses 6 178 34 2 321 2 461 – 1 362 – –<br />
Abnormal foreign<br />
exchange related loss* – – – – – – – –<br />
Segmental operating profit 1 654 – 1 089 442 – 123 – –<br />
Investment income 175 – – – – – 175 –<br />
Interest paid (151) – – – – (4) (147) –<br />
<strong>Woolworths</strong> Financial<br />
Services joint venture 75 – – – – – – 75<br />
Earnings from associate<br />
and property joint venture 6 – 3 3 – – – –<br />
Profit before tax and<br />
exceptional item 1 759 – 1 092 445 – 119 28 75<br />
Return on equity 39.4%<br />
The group’s revenues from external customers for each product and service segment is disclosed in note 2. The costs to<br />
provide information for each product and service of the group is excessive and is therefore not disclosed.<br />
Revenues arise from direct sales to a broad base of public customers. There are no customers that individually contribute<br />
10% or more to revenue of the group.<br />
Country Road represents the group’s results of its Australian subsidiary and is not South African results.<br />
* An unrealised foreign exchange loss relating to the SA Retail segment of R79m (R57m after tax) on the marking-to-market<br />
of foreign exchange contracts was incurred at 28 June 2009. A subsequent gain of R79m (R57m after tax) is included in<br />
gross profit in the current period.<br />
146
2009<br />
SA Retail<br />
Total<br />
Rm<br />
Intragroup<br />
Rm<br />
Clothing<br />
and<br />
General<br />
Merchandise<br />
Rm<br />
Food<br />
Rm<br />
Logistics<br />
Rm<br />
Country<br />
Road<br />
Rm<br />
Treasury<br />
Rm<br />
<strong>Woolworths</strong><br />
Financial<br />
Services<br />
Rm<br />
21 922 (20) 7 461 11 184 387 2 252 184 474<br />
21 175 – 7 423 11 126 387 2 235 – 4<br />
14 501 (69) 4 692 8 616 387 875 – –<br />
– – – – – – – –<br />
6 674 69 2 731 2 510 – 1 360 – 4<br />
563 (20) 38 58 – 17 – 470<br />
5 705 49 1 996 2 167 – 1 237 – 256<br />
79 – 79 – – – – –<br />
1 453 – 694 401 – 140 – 218<br />
184 – – – – – 184 –<br />
(281) – – – – (1) (134) (146)<br />
57 – – – – – – 57<br />
13 – 7 6 – – – –<br />
1 426 – 701 407 – 139 50 129<br />
26.3%<br />
147
NOTES<br />
TO THE GROUP ANNUAL FINANCIAL STATEMENTS<br />
39. segmental information (continued)<br />
39.1 segmentation based on nature of business and retail chain (continued)<br />
Total<br />
Rm<br />
Intragroup<br />
Rm<br />
SA<br />
Retail<br />
Rm<br />
<strong>2010</strong><br />
Retail<br />
Country<br />
Road<br />
Rm<br />
Treasury<br />
Rm<br />
<strong>Woolworths</strong><br />
Financial<br />
Services<br />
Rm<br />
STATEMENTS OF FINANCIAL POSITION<br />
Property, plant and equipment,<br />
investment property, intangible assets<br />
and loans 2 691 – 2 317 374 – –<br />
Inventories 1 676 – 1 416 260 – –<br />
Trade and other receivables and<br />
derivative financial assets 779 – 707 72 – –<br />
Cash 2 917 – 459 16 2 442 –<br />
Segment assets 8 063 – 4 899 722 2 442 –<br />
Investment in joint ventures 574 – 1 – – 573<br />
Investment in associate 40 – 40 – – –<br />
Tax and deferred tax assets 333 – 267 66 – –<br />
Total assets 9 010 – 5 207 788 2 442 573<br />
Trade and other payables and<br />
provisions 3 630 – 3 355 275 – –<br />
Borrowings 1 555 – 35 20 1 500 –<br />
Segment liabilities 5 185 – 3 390 295 1 500 –<br />
Tax and deferred tax liabilities 372 – 366 6 – –<br />
Total liabilities 5 557 – 3 756 301 1 500 –<br />
Debt ratio 17.3%<br />
Depreciation 442 – 366 76 – –<br />
Share-based payment expense 106 – – – – –<br />
Capital expenditure – gross additions 607 – 460 147 – –<br />
Capital commitments 786 – 652 134 – –<br />
Shareholding 100.0% 87.9% 50.0%<br />
148
2009<br />
Retail<br />
Total<br />
Rm<br />
Intragroup<br />
Rm<br />
SA<br />
Retail<br />
Rm<br />
Country<br />
Road<br />
Rm<br />
Treasury<br />
Rm<br />
<strong>Woolworths</strong><br />
Financial<br />
Services<br />
Rm<br />
2 637 – 2 333 304 – –<br />
1 723 – 1 474 249 – –<br />
751 – 715 36 – –<br />
2 391 – 213 165 2 013 –<br />
7 502 – 4 735 754 2 013 –<br />
534 – 1 – – 533<br />
35 – 35 – – –<br />
234 – 152 82 – –<br />
8 305 – 4 923 836 2 013 533<br />
3 557 – 3 183 374 – –<br />
1 500 – – – 1 500 –<br />
5 057 – 3 183 374 1 500 –<br />
176 – 122 54 – –<br />
5 233 – 3 305 428 1 500 –<br />
18.1%<br />
401 – 343 57 – 1<br />
70 – – – – –<br />
754 – 611 143 – –<br />
624 – 473 151 – –<br />
100.0% 87.9% 50.0%<br />
149
NOTES<br />
TO THE GROUP ANNUAL FINANCIAL STATEMENTS<br />
39. segmental information (continued)<br />
39.2 segmentation based on geographic location of customers and assets<br />
Revenue<br />
Total<br />
Rm<br />
Intragroup<br />
Rm<br />
Clothing<br />
and<br />
general<br />
merchandise<br />
Rm<br />
<strong>2010</strong><br />
SA Retail<br />
Food<br />
Rm<br />
Logistics<br />
Rm<br />
Country<br />
Road<br />
Rm<br />
Treasury<br />
Rm<br />
<strong>Woolworths</strong><br />
Financial<br />
Services<br />
Rm<br />
South Africa 20 831 (43) 8 062 12 220 417 – 175 –<br />
BLNS* 204 – 143 61 – – – –<br />
Rest of Africa &<br />
Middle East 80 – 69 11 – – – –<br />
Australasia 2 548 – – – – 2 548 – –<br />
23 663 (43) 8 274 12 292 417 2 548 175 –<br />
Turnover – based on<br />
location of end user/<br />
customers<br />
South Africa 20 613 – 8 041 12 155 417 – – –<br />
BLNS* 204 – 143 61 – – – –<br />
Rest of Africa &<br />
Middle East 80 – 69 11 – – – –<br />
Australasia 2 496 – – – – 2 496 – –<br />
23 393 – 8 253 12 227 417 2 496 – –<br />
Total<br />
Rm<br />
Intragroup<br />
Rm<br />
SA<br />
Retail<br />
Rm<br />
Country<br />
Road<br />
Rm<br />
Treasury<br />
Rm<br />
<strong>Woolworths</strong><br />
Financial<br />
Services<br />
Rm<br />
Total assets – based on<br />
location of assets<br />
South Africa 7 955 – 4 940 – 2 442 573<br />
Australasia 722 – – 722 – –<br />
– 4 940 722 2 442 573<br />
Tax and deferred tax<br />
assets<br />
333<br />
9 010<br />
Capital expenditure (gross)<br />
– based on location of<br />
assets<br />
South Africa 460 – 460 – – –<br />
Australasia 147 – – 147 – –<br />
607 – 460 147 – –<br />
* Botswana, Lesotho, Namibia and Swaziland<br />
150
2009<br />
SA Retail<br />
Total<br />
Rm<br />
Intragroup<br />
Rm<br />
Clothing<br />
and<br />
general<br />
merchandise<br />
Rm<br />
Food<br />
Rm<br />
Logistics<br />
Rm<br />
Country<br />
Road<br />
Rm<br />
Treasury<br />
Rm<br />
<strong>Woolworths</strong><br />
Financial<br />
Services<br />
Rm<br />
19 381 (20) 7 241 11 115 387 – 184 474<br />
195 – 138 57 – – – –<br />
94 – 82 12 – – – –<br />
2 252 – – – – 2 252 – –<br />
21 922 (20) 7 461 11 184 387 2 252 184 474<br />
18 651 – 7 203 11 057 387 – – 4<br />
195 – 138 57 – – – –<br />
94 – 82 12 – – – –<br />
2 235 – – – – 2 235 – –<br />
21 175 – 7 423 11 126 387 2 235 – 4<br />
Total<br />
Rm<br />
Intragroup<br />
Rm<br />
SA<br />
Retail<br />
Rm<br />
Country<br />
Road<br />
Rm<br />
Treasury<br />
Rm<br />
<strong>Woolworths</strong><br />
Financial<br />
Services<br />
Rm<br />
7 317 – 4 771 – 2 013 533<br />
754 – – 754 – –<br />
– 4 771 754 2 013 533<br />
234<br />
8 305<br />
610 – 610 – – –<br />
143 – – 143 – –<br />
753 – 610 143 – –<br />
151
COMPANY STATEMENT OF COMPREHENSIVE INCOME<br />
52 weeks 52 weeks<br />
to 27 June<br />
<strong>2010</strong><br />
to 28 June<br />
2009<br />
Note Rm Rm<br />
Revenue 2 44 2 724<br />
Expenses 3 2<br />
Other operating cost 3 2<br />
Profit before exceptional items 3 41 2 722<br />
Exceptional items 4 318 (318)<br />
Profit before tax 359 2 404<br />
Tax 5 1 139<br />
Profit for the period 358 2 265<br />
Total comprehensive income for the period 358 2 265<br />
Profit attibutable to:<br />
Shareholders of the parent 358 2 265<br />
Total comprehensive income attributable to:<br />
Shareholders of the parent 358 2 265<br />
152
COMPANY STATEMENT OF FINANCIAL POSITION<br />
at 27 June <strong>2010</strong> at 28 June 2009<br />
Note Rm Rm<br />
ASSETS<br />
Non-current assets 779 451<br />
Interest in subsidiaries 8 754 424<br />
Participation in export partnerships 9 25 27<br />
Current assets 161 161<br />
Trade and other receivables 11 1 –<br />
Tax – 3<br />
Amounts owing by subsidiaries 8 119 118<br />
Cash 19.5 41 40<br />
Total assets 940 612<br />
EQUITY AND LIABILITIES<br />
Equity attributable to shareholders of the parent 496 238<br />
Share capital 12 1 1<br />
Share premium 13 61 142<br />
Preference share capital 12 – –<br />
Retained profit 434 95<br />
Total shareholders’ interest 496 238<br />
Non-current liabilities 25 27<br />
Deferred tax 10 25 27<br />
Current liabilities 419 347<br />
Trade and other payables 14 5 3<br />
Tax 1 –<br />
Amounts owing to subsidiaries 8 413 344<br />
Total equity and liabilities 940 612<br />
153
company statement of changes in equity<br />
Share<br />
capital<br />
Share<br />
premium<br />
Preference<br />
share capital<br />
Retained<br />
profit<br />
Total<br />
Equity<br />
Note Rm Rm Rm Rm Rm<br />
Shareholders’ interest at the beginning<br />
of the period 1 116 – 195 312<br />
Total comprehensive income for the period – – – 2 265 2 265<br />
Issue of ordinary shares 12 & 13 – 26 – – 26<br />
Repurchase of shares 12 & 13 – – – (829) (829)<br />
Share repurchase costs – – – (4) (4)<br />
Distributions paid to shareholders 19.4 – – – (1 532) (1 532)<br />
Shareholders’ interest at 28 June 2009 1 142 – 95 238<br />
Total comprehensive income for the period – – – 358 358<br />
Issue of ordinary shares 12 & 13 – 666 – – 666<br />
Distributions paid to shareholders 19.4 – (747) – (19) (766)<br />
Shareholders’ interest at 27 June <strong>2010</strong> 1 61 – 434 496<br />
154
company statement of cash flows<br />
52 weeks 52 weeks<br />
to 27 June<br />
<strong>2010</strong><br />
to 28 June<br />
2009<br />
Note Rm Rm<br />
Cash flow from operating activities<br />
Cash inflow/(outflow) from trading 19.1 10 (2)<br />
Working capital movements 19.2 1 4<br />
Cash generated by operating activities 11 2<br />
Interest received 2 2<br />
Tax refund/(paid) 19.3 1 (152)<br />
Cash generated by/(utilised in) operations 14 (148)<br />
Dividends received 29 2 721<br />
Distributions paid to shareholders 19.4 (766) (701)<br />
Net cash (outflow)/inflow from operating activities (723) 1 872<br />
Cash flow from investing activities<br />
Repayment of loans by subsidiaries 57 130<br />
Investment in subsidiary 8 – (340)<br />
Participation in export partnerships 1 1<br />
Net cash inflow/(outflow) from investing activities 58 (209)<br />
Cash flow from financing activities<br />
Shares issued 666 26<br />
Repurchase of shares – (829)<br />
Special dividend to shareholders 19.4 – (832)<br />
Share repurchase costs – (4)<br />
Net cash inflow/(outflow) from financing activities 666 (1 639)<br />
Increase in cash and cash equivalents 1 24<br />
Net cash and cash equivalents at the beginning of the period 40 16<br />
Net cash and cash equivalents at the end of the period 19.5 41 40<br />
155
NOTES<br />
TO THE COMPANY ANNUAL FINANCIAL STATEMENTS<br />
<strong>2010</strong> 2009<br />
2. revenue<br />
Interest received 15 3<br />
Dividends received 29 2 721<br />
Rm<br />
Rm<br />
44 2 724<br />
3. profit before exceptional items includes:<br />
3.1 Auditors’ remuneration:<br />
Audit fee 3 2<br />
current period 3 2<br />
4. exceptional items<br />
<strong>2010</strong> Rm<br />
Reversal of impairment of investment in:<br />
E-Com Investments 16 (Proprietary) <strong>Limited</strong> 318<br />
The reversal of the provision for impairment against the company’s investment in E-Com<br />
Investments 16 (Proprietary) <strong>Limited</strong> was based on an assessment of the fair value of the<br />
underlying net assets at the period end.<br />
2009 Rm<br />
Impairment of investment in:<br />
E-Com Investments 16 (Proprietary) <strong>Limited</strong> (318)<br />
The provision for impairment against the company’s investment in E-Com Investments 16 (Proprietary) <strong>Limited</strong> is based on an<br />
assessment of fair value of the underlying net assets at the period end.<br />
156
5. tax<br />
Current period<br />
South Africa<br />
<strong>2010</strong> 2009<br />
Normal tax 3 2<br />
Deferred tax relating to the origination and reversal of temporary differences (note 10) (2) (1)<br />
Secondary tax on companies – 138<br />
Rm<br />
Rm<br />
1 139<br />
<strong>2010</strong> 2009<br />
% %<br />
The rate of tax on profit is reconciled as follows:<br />
Standard rate 28.0 28.0<br />
Exempt income (2.2) (31.7)<br />
Secondary tax on companies – 5.8<br />
Effective rate before exceptional items 25.8 2.1<br />
Exceptional items (25.8) 3.7<br />
Effective tax rate – 5.8<br />
157
NOTES<br />
TO THE COMPANY ANNUAL FINANCIAL STATEMENTS<br />
6. directors’ emoluments<br />
Emoluments paid to directors of <strong>Woolworths</strong> <strong>Holdings</strong> <strong>Limited</strong> in connection with the carrying on of the affairs of the company<br />
and its subsidiaries:<br />
Executive directors:<br />
<strong>2010</strong> 2009<br />
Fees 1 –<br />
Remuneration 12 11<br />
Retirement, medical, accident and death benefits 2 2<br />
Performance bonus 23 4<br />
Sign on bonus 8 –<br />
Loss of office and retention payments 10 –<br />
Other benefits 1 –<br />
Interest-free loan benefit 5 8<br />
Non-executive directors:<br />
Rm<br />
Rm<br />
62 25<br />
Fees 4 3<br />
4 3<br />
Directors’ emoluments are paid by <strong>Woolworths</strong> (Proprietary) <strong>Limited</strong> and Country Road <strong>Limited</strong>.<br />
Details of the directors’ emoluments are provided in the corporate governance <strong>report</strong> on pages 65 to 67.<br />
66 28<br />
7. related party transactions<br />
The nature of transactions between the company and subsidiaries of the group mainly comprise dividend received.<br />
The following related party transactions occurred during the period:<br />
<strong>Woolworths</strong> <strong>Holdings</strong> <strong>Limited</strong><br />
Dividend received from subsidiary companies:<br />
<strong>Woolworths</strong> (Proprietary) <strong>Limited</strong> 19 1 664<br />
<strong>Woolworths</strong> Employee Share Ownership Trust 10 2<br />
E-Com Investments 16 (Proprietary) <strong>Limited</strong> – 957<br />
<strong>Woolworths</strong> International <strong>Holdings</strong> <strong>Limited</strong> – 98<br />
29 2 721<br />
Interest received from subsidiary companies:<br />
E-Com Investments 16 (Proprietary) <strong>Limited</strong> 13 –<br />
Dividend paid to subsidiary companies on treasury shares held by the subsidiaries 41 130<br />
Key management personnel<br />
Key management personnel are those persons having authority and responsibility for planning, directing and controlling the<br />
activities of the company, directly or indirectly, including all directors, executive and non-executive, of <strong>Woolworths</strong> <strong>Holdings</strong><br />
<strong>Limited</strong>. Key management personnel has been defined as the board of directors of the company. The definition of related<br />
parties include close family members of key management personnel. The company has not engaged in transactions with<br />
close family members of key management personnel during the financial period.<br />
158
7. related party transactions (continued)<br />
<strong>2010</strong> 2009<br />
Rm<br />
Rm<br />
Key management compensation<br />
Short-term employee benefits 64 26<br />
Post-employment benefits 2 2<br />
66 28<br />
Short-term employee benefits comprise salaries, directors’ fees and bonuses payable within 12 months of the end of<br />
the period. Post-employment benefits comprise expenses determined in terms of IAS 19: Employee Benefits in respect<br />
of the group’s retirement and healthcare funds.<br />
Share purchase scheme loans and investments (at cost)<br />
Loans and investments at the beginning of the period 63 88<br />
Loans granted during the period – 1<br />
Loans repaid during the period (2) (26)<br />
Loans and investments at the end of the period 61 63<br />
Details of the terms and conditions relating to these loans are disclosed in note 15 of the group annual financial statements.<br />
No bad or doubtful debts have been recognised in respect of loans granted to key management personnel (2009: nil).<br />
<strong>Woolworths</strong> card and <strong>Woolworths</strong> Visa credit card accounts<br />
Balance outstanding at the beginning of the period 1 –<br />
<strong>Annual</strong> spend 2 3<br />
<strong>Annual</strong> repayments (1) (2)<br />
Balance outstanding at the end of the period 2 1<br />
Purchases made by key management personnel are at standard discounts granted to all employees of the company.<br />
Interest is charged on outstanding balances on the same terms and conditions applicable to all other card holders.<br />
No bad or doubtful debts have been recognised in respect of the <strong>Woolworths</strong> card and <strong>Woolworths</strong> Visa credit card<br />
accounts of key management personnel (2009: nil).<br />
Post-employment benefit plan<br />
Details of the Wooltru Group Retirement Fund, the Wooltru Healthcare Fund and funds for the benefit of Country Road<br />
employees are disclosed in note 25 of the group annual financial statements.<br />
159
NOTES<br />
TO THE COMPANY ANNUAL FINANCIAL STATEMENTS<br />
<strong>2010</strong> 2009<br />
8. interest in subsidiaries<br />
Ordinary shares 401 401<br />
Cost 401 401<br />
Preference shares – investment in E-Com Investments 16 (Proprietary) <strong>Limited</strong> 353 22<br />
Rm<br />
Rm<br />
Cost 353 340<br />
Investment in equity 230 230<br />
Loan receivable 123 110<br />
Provision for impairment – (318)<br />
Investment in equity – (230)<br />
Loan receivable – (88)<br />
Amounts owing (to)/by subsidiaries<br />
<strong>Woolworths</strong> (Proprietary) <strong>Limited</strong> (412) (344)<br />
E-Com Investments 16 (Proprietary) <strong>Limited</strong> 119 118<br />
<strong>Woolworths</strong> Employee Share Ownership Trust (1) –<br />
Total net interest 460 197<br />
Movements in the provision for impairment of shares in subsidiaries were as follows:<br />
Balance at the beginning of the period 318 –<br />
Investment in equity 230 –<br />
Loan receivable 88 –<br />
Charge for the period – 318<br />
Investment in equity – 230<br />
Loan receivable – 88<br />
Amount reversed during the period (318) –<br />
Investment in equity (230) –<br />
Loan receivable (88) –<br />
Balance at the end of the period – 318<br />
Movements in the provision for impairment of loans to iSentials (Proprietary) <strong>Limited</strong> were<br />
as follows:<br />
Balance at the beginning of the period – 22<br />
Amounts reversed – (22)<br />
Balance at the end of the period – –<br />
Shares in subsidiaries are stated at cost less provision for impairment, if any.<br />
The investment in preference shares of E-Com Investments 16 (Proprietary) <strong>Limited</strong> (’E-Com’) entitles the company to<br />
a cumulative dividend equal to 50% of the dividend declared and paid by E-Com on the ordinary shares from time to time.<br />
In addition, the preference shares is redeemable in full by E-Com 10 years after the issue date.<br />
The investment in preference shares of E-Com is a compound financial instrument in terms of IAS 32, and the cost is therefore<br />
split between equity and loan receivable. The loan receivable component is determined as the net present value of the<br />
investment discounted using an interest rate of 12.0%.<br />
160
8. interest in subsidiaries (CONTINUED)<br />
The recoverable amount of the investment is determined to be the net asset value of E-Com at the end of the period. The total<br />
impairment loss in the prior period was allocated to the equity component first and the balancing amount was attributable to<br />
loan receivable.<br />
Investments in and loans to subsidiaries are considered to be impaired when it is unlikely that the initial investment cost will be<br />
recovered or that the loan granted will be repaid.<br />
The loans to and from the other subsidiaries are unsecured, interest-free and are repayable on demand. The carrying values of<br />
loans to and from subsidiaries that have not been impaired, approximate their fair values.<br />
The company’s maximum exposure to the credit risk of the loans to subsidiaries are their carrying values. The amount owing<br />
by subsidiaries in <strong>2010</strong> is considered to be neither past due nor impaired. Refer note 16.1 for details of the company’s credit risk<br />
management policies.<br />
Refer Annexure 1 for the company’s interest in subsidiaries.<br />
<strong>2010</strong> 2009<br />
Rm<br />
Rm<br />
9. participation in export partnerships<br />
Balance at the beginning of the period 27 27<br />
Payments received relating to the current period (1) (1)<br />
Current portion included in trade and other receivables (refer note 11) (1) –<br />
Notional interest accrued for the period – 1<br />
Balance at the end of the period 25 27<br />
The company participates as a partner in a number of container export partnerships. The partnerships sold containers in<br />
terms of long-term suspensive purchase and credit sale agreements.<br />
Participation in export partnerships is measured at amortised cost using the effective interest rate method. Amortised cost is<br />
the company’s cost of original participation less principal subsequent repayments received, plus the cumulative amortisation<br />
of the difference between the initial amount and the maturity amount, less any writedown for impairment or uncollectability.<br />
Any impairment to the participation in export partnerships would result in a corresponding reduction in the related deferred<br />
taxation liability and thus there would be no impact on the cash flow statement or the net profit of the company.<br />
Due to the terms and conditions attaching to the participation in export partnerships it is not practicable within constraints of<br />
timeliness or cost to determine their fair values.<br />
The amount outstanding is considered to be neither past due nor impaired. Refer note 16.1 for details of the company’s credit<br />
risk management policies.<br />
<strong>2010</strong> 2009<br />
Rm<br />
Rm<br />
10. deferred tax<br />
The movement in the deferred tax account is as follows:<br />
Balance at the beginning of the period (27) (28)<br />
Amount credited to the statement of comprehensive income 2 1<br />
Export partnerships 2 1<br />
Balance at the end of the period (25) (27)<br />
Comprising:<br />
Export partnerships (25) (27)<br />
(25) (27)<br />
Deferred tax has been calculated at the standard corporate tax rate as at the <strong>report</strong>ing date as management expect<br />
to recover the carrying values of assets and settle the carrying value of liabilities through use. The deferred tax asset<br />
relating to STC credits is calculated using the STC rate.<br />
161
NOTES<br />
TO THE COMPANY ANNUAL FINANCIAL STATEMENTS<br />
<strong>2010</strong> 2009<br />
11. trade and other receivables<br />
Trade and other receivables 1 –<br />
Rm<br />
Rm<br />
1 –<br />
Trade and other receivables consist of the current portion of participation in export partnerships. The balance is neither past<br />
due nor impaired.<br />
The carrying value of trade and other receivables is considered to approximate fair value.<br />
The maximum exposure to credit risk at the <strong>report</strong>ing date is the carrying value of each class of receivable mentioned above.<br />
The company does not hold any collateral as security. For detailed information regarding the credit quality of financial assets<br />
which are neither past due nor impaired, refer note 16.1.<br />
<strong>2010</strong> 2009<br />
R’000 R’000<br />
12. ordinary and preference share capital<br />
Authorised<br />
1 410 600 000 (2009: 1 410 600 000) ordinary shares of 0.15 cents each 2 116 2 116<br />
89 400 000 (2009: 89 400 000) convertible, redeemable, non-cumulative participating<br />
preference shares of 0.15 cents each. 134 134<br />
2 250 2 250<br />
Issued<br />
847 786 806 (2009: 801 116 800) ordinary shares of 0.15 cents each 1 272 1 202<br />
88 267 306 (2009: 88 267 306) preference shares of 0.15 cents each 132 132<br />
1 404 1 334<br />
Reconciliation of value of ordinary shares in issue:<br />
Balance at the beginning of the period 1 202 1 324<br />
6 172 402 (2009: 5 595 343) ordinary shares issued 9 8<br />
40 497 604 (2009: nil) ordinary shares issued to <strong>Woolworths</strong> (Proprietary) <strong>Limited</strong> 61 –<br />
Nil (2009: 86 871 694) ordinary shares repurchased and cancelled – (130)<br />
1 272 1 202<br />
Number of shares<br />
<strong>2010</strong> 2009<br />
Reconciliation of number of ordinary shares in issue:<br />
Balance at the beginning of the period 801 116 800 882 393 151<br />
Shares issued 46 670 006 5 595 343<br />
Shares repurchased and cancelled – (86 871 694)<br />
847 786 806 801 116 800<br />
162
12. ordinary and preference share capital (CONTINUED)<br />
During the period, 6 172 402 (2009: 5 595 343) shares were issued in terms of the share incentive schemes.<br />
During the period, two specific share issues for cash were made to <strong>Woolworths</strong> (Proprietary) <strong>Limited</strong>, as follows:<br />
Date issued<br />
Number<br />
of shares<br />
Subscription<br />
price<br />
R<br />
Purchase<br />
price<br />
Rm<br />
30 September 2009 29 497 604 14.56 429<br />
26 March <strong>2010</strong> 11 000 000 17.24 190<br />
40 497 604 619<br />
<strong>2010</strong> 2009<br />
R’000 R’000<br />
Reconciliation of value of preference shares in issue:<br />
Balance at the beginning of the period 132 132<br />
Nil (2009: nil) preference shares issued – –<br />
Nil (2009: nil) shares converted to ordinary shares – –<br />
132 132<br />
Number of shares<br />
<strong>2010</strong> 2008<br />
Reconciliation of number of preference shares in issue:<br />
Balance at the beginning of the period 88 267 306 88 267 306<br />
Nil (2009: nil) preference shares issued – –<br />
Shares converted to ordinary shares – –<br />
88 267 306 88 267 306<br />
For more information on the company’s capital management policy, refer note 16.<br />
<strong>2010</strong> 2009<br />
Rm<br />
Rm<br />
13. share premium<br />
Balance at the beginning of the period 142 116<br />
Share issues in terms of the share incentive scheme 47 26<br />
Share issues to <strong>Woolworths</strong> (Proprietary) <strong>Limited</strong> 619 –<br />
Distribution to shareholders (747) –<br />
Balance at the end of the period 61 142<br />
14. trade and other payables<br />
Other payables 5 3<br />
5 3<br />
Trade and other payables mainly includes audit fee accrual and dividends payable to shareholders. The carrying value of<br />
trade and other payables approximates the fair value.<br />
These balances are payable on demand.<br />
15. contingent liabilities<br />
The company provides sureties for the banking facilities (refer note 29.4 to the group financial statements) and lease<br />
obligations of certain subsidiaries. In the opinion of the directors, the possibility of loss arising therefrom is remote.<br />
163
NOTES<br />
TO THE COMPANY ANNUAL FINANCIAL STATEMENTS<br />
16. financial risk management<br />
Exposure to credit, liquidity and interest rate risks arises in the normal course of business. It is the company’s objective to<br />
minimise its exposure to the various financial risks through its risk management policies and procedures. The company<br />
attempts to manage financial risk where this involves activities in which it has appropriate competencies. To achieve this,<br />
the company’s treasury function is responsible for managing funding and the company’s financial risks within predetermined<br />
parameters. The company’s overall treasury policy is reviewed and approved by the <strong>Woolworths</strong> <strong>Holdings</strong> <strong>Limited</strong> board.<br />
The policy specifies the dealing limits (in terms of size and duration), the types of instruments that may be used, authorised<br />
counterparties and procedures for settling and recording transactions.<br />
In addition, a treasury committee <strong>report</strong>s regularly to the board on the implementation of treasury policies, focusing in<br />
particular on the amount of exposure to financial risk; the extent to which this risk is covered; the implications of expected<br />
future movement in market interest rates; as well as whether there are any deviations from treasury policy and performance<br />
against budgets.<br />
16.1 Credit risk management<br />
Credit risk arises from cash and cash equivalents, participation in export partnerships, amounts owing by subsidiaries<br />
and trade and other receivables. The company’s maximum exposure to credit risk is equal to the carrying amount of<br />
these classes of assets.<br />
The company only deposits short-term cash surpluses with major banks of high quality credit standing. Trencor <strong>Limited</strong><br />
has materially warranted certain important cash flow aspects of the company’s participation in export partnerships,<br />
thus the credit quality of this receivable is considered to be high. Trade and other receivables consist mainly of interest<br />
receivable from Trencor <strong>Limited</strong>. Refer note 8 for details of amounts owing by subsidiaries.<br />
Credit quality of financial assets<br />
The credit quality of financial assets that are neither past due nor impaired are assessed to be of high grade.<br />
<strong>2010</strong> 2009<br />
Rm<br />
Rm<br />
Financial assets<br />
Amounts owing by subsidiaries 119 118<br />
Participation in export partnerships 25 27<br />
Cash and cash equivalents 41 40<br />
Trade and other receivables 1 –<br />
Preference share loan in E-Com Investments 16 (Proprietary) <strong>Limited</strong> 123 22<br />
16.2 Liquidity management<br />
Liquidity risk management includes maintaining sufficient cash and cash equivalents. In terms of the company’s Articles<br />
of Association, there is no limit on the company’s authority to raise interest-bearing debt.<br />
The undiscounted cash flows of the company’s borrowings and payables fall into the following maturity profiles:<br />
<strong>2010</strong> 2009<br />
Maturity Rm Rm<br />
Amounts owing to subsidiaries on demand 413 344<br />
Trade and other payables on demand 5 4<br />
164
16. financial risk management (continued)<br />
16.3 Interest rate management<br />
The company’s interest rate risk arises from interest-bearing cash balances.<br />
The company manages its exposure to interest rate risk by ensuring that it invests its cash in the banks which offer the<br />
most favourable interest rate.<br />
The sensitivity of the company’s profits and equity to its exposure to interest rate risk is presented below. The analysis<br />
considers the impact of a reasonably possible change over the next 12 months in the prime rate, with all other variables<br />
held constant.<br />
Movement in<br />
basis points<br />
(Increase)/<br />
decrease<br />
on profit<br />
before tax<br />
R’000<br />
(Increase)/<br />
decrease<br />
on equity<br />
R’000<br />
<strong>2010</strong><br />
Cash +50 (205) (148)<br />
-50 205 148<br />
2009<br />
Cash +50 200 144<br />
-100 400 288<br />
16.4 Financial instruments by category<br />
The accounting policies for financial instruments have been applied to the line items below:<br />
<strong>2010</strong> 2009<br />
Rm<br />
Rm<br />
Loans and receivables<br />
Participation in export partnerships 25 27<br />
Amounts owing by subsidiaries 119 118<br />
Trade and other receivables 1 –<br />
Cash 41 40<br />
Preference share loan in E-Com Investments 16 (Proprietary) <strong>Limited</strong> 123 22<br />
309 207<br />
Financial liabilities at amortised cost<br />
Amounts owing to subsidiaries 413 344<br />
Trade and other payables 5 3<br />
418 347<br />
16.5 Gains and losses on financial instruments<br />
The table below summarises the gains and (losses) on financial instruments.<br />
Interest<br />
income<br />
Rm<br />
Impairment<br />
loss<br />
Rm<br />
Reversal of<br />
impairment<br />
loss<br />
Rm<br />
<strong>2010</strong><br />
Loans and receivables 2 – – 2<br />
Preference share in E-Com Investments 16 (Proprietary)<br />
<strong>Limited</strong><br />
loan receivable 13 – 88 101<br />
2009<br />
Loans and receivables 3 – – 3<br />
Preference share in E-Com Investments 16 (Proprietary)<br />
<strong>Limited</strong><br />
loan receivable – (88) – (88)<br />
Total<br />
Rm<br />
165
NOTES<br />
TO THE COMPANY ANNUAL FINANCIAL STATEMENTS<br />
17. management of capital<br />
The company considers the management of capital with reference to the group policy. Refer note 30 of the group annual<br />
financial statements.<br />
<strong>2010</strong> 2009<br />
18. distributions to shareholders<br />
Ordinary shareholders:<br />
Distribution no. 22 of 49.5 cents per share was declared on 20 August 2008 and paid on<br />
15 September 2008 – 437<br />
Distribution no. 23 of 94.0 cents per share was declared on 19 November 2008 and paid on<br />
15 December 2008 – 832<br />
Distribution no. 24 of 31.5 cents per share was declared on 19 February 2009 and paid on<br />
16 March 2009 – 252<br />
Distribution no. 25 of 53.5 cents per share was declared on 26 August 2009 and paid on<br />
28 September 2009 429 –<br />
Distribution no. 26 of 38.0 cents per share was declared on 17 February <strong>2010</strong> and paid on<br />
6 April <strong>2010</strong> 318 –<br />
Rm<br />
Rm<br />
Preference shareholders:<br />
Distribution no. 3 of 7.9 cents per share was declared on 20 August 2008 and paid on<br />
15 September 2008 – 7<br />
Distribution no. 4 of 5.0 cents per share was declared on 19 February 2009 and paid on<br />
16 March 2009 – 4<br />
Distribution no. 5 of 12.3 cents per share was declared on 26 August 2009 and paid on<br />
28 September 2009 11 –<br />
Distribution no. 6 of 8.7 cents per share was declared on 17 February <strong>2010</strong> and paid on<br />
6 April <strong>2010</strong> 8 –<br />
Total distributions paid 766 1 532<br />
Distribution no. 27 of 67.0 cents per share was declared to ordinary shareholders on 25 August <strong>2010</strong>.<br />
Distribution no. 7 of 22.1 cents per share was declared to preference shareholders on 25 August <strong>2010</strong>.<br />
166
<strong>2010</strong> 2009<br />
19. cash flow information<br />
19.1 Cash flow from trading<br />
Profit before exceptional item 41 2 722<br />
Interest received (15) (3)<br />
Movement in working capital and other provisions 13 –<br />
Dividends received (29) (2 721)<br />
Net inflow/(outflow) from trading 10 (2)<br />
Rm<br />
Rm<br />
19.2 Working capital movements<br />
Trade and other receivables (1) 2<br />
Trade and other payables 2 2<br />
Net inflow 1 4<br />
19.3 Tax paid<br />
Normal and foreign tax<br />
Amounts receivable/(owing) at the beginning of the period 3 (9)<br />
Amounts charged to statement of comprehensive income (3) (2)<br />
Amounts owing/(receivable) at the end of the period 1 (3)<br />
Cash amounts received/(paid) 1 (14)<br />
Secondary tax on companies<br />
Amounts charged to statement of comprehensive income – (138)<br />
Total tax paid 1 (152)<br />
19.4 Distributions to shareholders<br />
Normal distribution to shareholders (766) (701)<br />
Special dividend to shareholders – (831)<br />
Amounts charged to statement of changes in equity and paid (766) (1 532)<br />
19.5 Cash and cash equivalents<br />
Cash<br />
Interest earning<br />
Local – dividend account at an interest rate of 4.0% to 5.0% (2009: 2.0% to 9.5%) 41 40<br />
Cash and cash equivalents 41 40<br />
The carrying value of cash and cash equivalents is considered to approximate the fair value.<br />
20. events after the REPORTING date<br />
No event material to the understanding of these financial statements has occurred between the end of the financial period<br />
and the date of approval.<br />
167
annexure 1<br />
Carrying<br />
value of<br />
shares<br />
Rm<br />
<strong>2010</strong> 2009<br />
% Holding Carrying<br />
value of<br />
shares<br />
Rm<br />
% Holding<br />
Interest in subsidiaries<br />
Directly held 631 401<br />
<strong>Woolworths</strong> (Proprietary) <strong>Limited</strong> R 1 – 100 – 100<br />
<strong>Woolworths</strong> Developments (Proprietary) <strong>Limited</strong> P 1 – 100 – 100<br />
<strong>Woolworths</strong> Computer Services (Proprietary) <strong>Limited</strong>* D 1 – 100 – 100<br />
<strong>Woolworths</strong> International <strong>Holdings</strong> <strong>Limited</strong> H 5 401 100 401 100<br />
E-Com Investments 16 (Proprietary) <strong>Limited</strong> H 1 230 100 – 100<br />
The <strong>Woolworths</strong> <strong>Holdings</strong> Share Trust** – – – –<br />
The <strong>Woolworths</strong> Employee Share Ownership Trust** – – – –<br />
Indirectly held<br />
<strong>Woolworths</strong> International (SA) (Proprietary) <strong>Limited</strong> D 1 100 100<br />
<strong>Woolworths</strong> (Namibia) (Proprietary) <strong>Limited</strong> D 2 100 100<br />
<strong>Woolworths</strong> (Lesotho) (Proprietary) <strong>Limited</strong>* D 3 100 100<br />
<strong>Woolworths</strong> (Swaziland) (Proprietary) <strong>Limited</strong>* D 4 100 100<br />
Highway <strong>Holdings</strong> N.V. H 6 100 100<br />
<strong>Woolworths</strong> International <strong>Limited</strong> I 5 100 100<br />
<strong>Woolworths</strong> International (Australia) (Proprietary) <strong>Limited</strong> H 7 100 100<br />
<strong>Woolworths</strong> Worldwide <strong>Limited</strong> H 5 100 100<br />
The <strong>Woolworths</strong> Trust*** H 5 – –<br />
WSM Operations Holding Company <strong>Limited</strong> D 5 100 100<br />
Country Road <strong>Limited</strong> R 7 88 88<br />
Country Road Clothing (Proprietary) <strong>Limited</strong> R 7 88 88<br />
Country Road Ventures (Proprietary) <strong>Limited</strong> R 7 88 88<br />
Country Road Clothing (NZ) <strong>Limited</strong> R 8 88 88<br />
Country Road Properties (Proprietary) <strong>Limited</strong> P 7 88 88<br />
Country Road International (Proprietary) <strong>Limited</strong> H 7 88 88<br />
Country Road (Hong Kong) <strong>Limited</strong> R 9 88 88<br />
Country Road Australia <strong>Limited</strong> R 5 88 88<br />
Universal Product Networks (Proprietary) <strong>Limited</strong> L 1 100 100<br />
inthebag (Proprietary) <strong>Limited</strong> D 1 100 100<br />
Virtual Market Place (Proprietary) <strong>Limited</strong>**** R 1 100 100<br />
The <strong>Woolworths</strong> Trust (Charitable Trust)** 1 – –<br />
Interest in joint ventures<br />
<strong>Woolworths</strong> Financial Services (Proprietary) <strong>Limited</strong> F 1 50% – 1 share 50% – 1 share<br />
Nedglen Property Developments (Proprietary) <strong>Limited</strong> P 1 30 30<br />
631 401<br />
Amounts owing by/(to) subsidiaries<br />
<strong>Woolworths</strong> (Proprietary) <strong>Limited</strong> (412) (344)<br />
E-Com Investments 16 (Proprietary) <strong>Limited</strong> 242 140<br />
<strong>Woolworths</strong> Employee Share Ownership Trust (1) –<br />
Total interest 460 197<br />
168
Nature of business<br />
R: Retailing P: Property development F: Financial services I: Import/export D: Dormant<br />
L: Logistics H: Holding<br />
Country of incorporation<br />
1: South Africa 2: Namibia 3: Lesotho 4: Swaziland 5: Guernsey 6: Belgium 7: Australia<br />
8: New Zealand 9: Hong Kong 10: United Kingdom<br />
* Deregistration in process.<br />
** The <strong>Woolworths</strong> <strong>Holdings</strong> Share Trust, <strong>Woolworths</strong> Employee Share Ownership Trust and The <strong>Woolworths</strong> Trust<br />
(Charitable Trust) are included as subsidiaries based on the interpretation guidance SIC 12 (AC 412).<br />
*** The <strong>Woolworths</strong> Trust is an intermediate holding entity for <strong>Woolworths</strong> Worldwide <strong>Limited</strong> (Guernsey). <strong>Woolworths</strong> <strong>Holdings</strong><br />
<strong>Limited</strong> is a beneficiary of the trust.<br />
**** Virtual Market Place (Proprietary) <strong>Limited</strong> is a virtual community development company that creates partnerships between<br />
businesses and supporters for the benefit of broad-based educational institutions.<br />
The aggregate profit/(losses) after tax of subsidiaries attributable to the company are:<br />
<strong>2010</strong> 2009<br />
Rm<br />
Rm<br />
Profits 1 341 1 917<br />
Losses (8) (1)<br />
1 333 1 916<br />
169
glossary of terms<br />
amortised cost<br />
The amount at which a financial asset<br />
or financial liability is measured at<br />
initial recognition, minus principal<br />
repayments, plus or minus the<br />
cumulative amortisation using the<br />
effective interest rate method of any<br />
difference between that initial amount<br />
and the maturity amount, and minus<br />
any reduction for impairment or<br />
uncollectibility.<br />
actuarial gains or losses<br />
Actuarial gains or losses comprise:<br />
1. experience adjustments (the<br />
effects of differences between<br />
the previous actuarial assumptions<br />
and what has actually occurred);<br />
and<br />
2. the effects of changes in actuarial<br />
assumptions.<br />
black-scholes model<br />
A valuation equation that assumes<br />
the price of the underlying asset<br />
changes continuously through to<br />
the option’s expiration date by a<br />
statistical process known as geometric<br />
Brownian motion.<br />
binomial option pricing model<br />
A valuation equation that assumes the<br />
price of the underlying asset changes<br />
through a series of discrete upward or<br />
downward movements.<br />
business segment<br />
A distinguishable component of an<br />
entity that is engaged in providing<br />
an individual product or service or<br />
a group of related products or services<br />
that is subject to risks and returns<br />
that are different from those of other<br />
business segments.<br />
cash and cash equivalents<br />
Cash comprises cash on hand<br />
and demand deposits. Cash<br />
equivalents are short-term highly<br />
liquid investments that are readily<br />
convertible to known amounts<br />
of cash and which are subject<br />
to an insignificant risk of change<br />
in value.<br />
cash flow hedge<br />
A hedge of the exposure to variability in<br />
cash flows that:<br />
1. is attributable to a particular<br />
risk associated with a recognised<br />
asset or liability or a highly<br />
probable forecast transaction; and<br />
2. could affect profit or loss.<br />
cash-generating unit<br />
The smallest identifiable group of<br />
assets that generates cash inflows that<br />
are largely independent of the cash<br />
inflows from other assets or groups<br />
of assets.<br />
company<br />
<strong>Woolworths</strong> <strong>Holdings</strong> <strong>Limited</strong> – a legally<br />
incorporated business entity registered<br />
in terms of the Companies Act 61 of 1973<br />
in South Africa, as amended.<br />
consolidated financial<br />
statements<br />
The financial results of the group<br />
presented as those of a single<br />
economic entity.<br />
contingent liability<br />
1. A possible obligation that arises<br />
from past events and whose<br />
existence will be confirmed<br />
only by the occurrence or nonoccurrence<br />
of one or more uncertain<br />
future events not wholly within the<br />
control of an entity.<br />
2. A present obligation that arises<br />
from past events but is not<br />
recognised because:<br />
2.1 it is not probable that<br />
an outflow of resources<br />
embodying economic benefits<br />
will be required to settle the<br />
obligation; or<br />
2.2 the amount of the obligation<br />
cannot be measured with<br />
sufficient reliability.<br />
control<br />
The power to govern the financial and<br />
operating policies of an entity so as to<br />
obtain benefits from its activities.<br />
credit risk<br />
The risk that one party to a financial<br />
instrument will cause a financial loss for<br />
the other party by failing to discharge<br />
an obligation.<br />
currency risk<br />
The risk that the fair value or future<br />
cash flows of a financial instrument<br />
will fluctuate because of changes in<br />
foreign exchange rates.<br />
deferred bonus plan<br />
The deferred bonus plan allows eligible<br />
employees to acquire <strong>Woolworths</strong><br />
<strong>Holdings</strong> shares at the ruling market<br />
price out of a portion of their declared<br />
short-term performance bonus.<br />
A matching award of <strong>Woolworths</strong><br />
shares will be made to the participant<br />
after a period of three years on the<br />
condition that the participant remains<br />
in the employ of the employer company<br />
and retains the bonus share over<br />
the period.<br />
defined-benefit plan<br />
Post-employment benefit plans other<br />
than defined-contribution plans.<br />
defined-contribution plan<br />
Post-employment benefit plans under<br />
which an entity pays fixed contributions<br />
into a separate fund, and in respect of<br />
which the entity will have no legal or<br />
constructive obligation to pay further<br />
contributions if the fund does not hold<br />
sufficient assets to pay all employee<br />
benefits relating to employee service in<br />
the current and prior periods.<br />
deferred tax assets<br />
The amount of income taxes<br />
recoverable in future periods in<br />
respectof:<br />
1. deductible temporary differences;<br />
2. the carryforward of unused tax<br />
losses; and<br />
3. the carryforward of unused tax<br />
credits.<br />
deferred tax liabilities<br />
The amounts of income tax payable<br />
in future periods in respect of taxable<br />
temporary differences.<br />
derivative<br />
A financial instrument or other<br />
contract with all three of the following<br />
characteristics:<br />
1. its value changes in response to<br />
the change in a specified interest<br />
rate, financial instrument price,<br />
commodity price, foreign exchange<br />
rate, index of prices or rates, credit<br />
rating or credit index, or other<br />
variable, provided in the case of<br />
170
a non-financial variable that the<br />
variable is not specific to a party<br />
to the contract (sometimes called<br />
the ’underlying’);<br />
2. it requires no initial net<br />
investment or an initial net<br />
investment that is smaller than<br />
would be required for other<br />
types of contracts that would<br />
be expected to have a similar<br />
response to changes in, market<br />
factors; and<br />
3. it is settled at a future date.<br />
dilution<br />
A reduction in earnings per share or<br />
an increase in loss per share resulting<br />
from the assumption that convertible<br />
instruments are converted, that<br />
options or warrants are exercised,<br />
or that ordinary shares are issued<br />
upon the satisfaction of specified<br />
conditions.<br />
disposal group<br />
A group of assets to be disposed of,<br />
by sale or otherwise, together as<br />
a group in a single transaction, and<br />
liabilities directly associated with those<br />
assets that will be transferred in the<br />
transaction.<br />
equity-settled share-based<br />
payment transaction<br />
A share-based payment transaction<br />
in which the entity receives goods or<br />
services as consideration for equity<br />
instruments of the entity (including<br />
shares or share options).<br />
fair value<br />
The amount for which an asset<br />
could be exchanged or a liability<br />
settled, between knowledgeable,<br />
willing parties in an arm’s length<br />
transaction.<br />
financial asset<br />
Any asset that is:<br />
1. cash;<br />
2. an equity instrument of another<br />
entity;<br />
3. a contractual right:<br />
3.1 to receive cash or another<br />
financial asset from another<br />
entity; or<br />
3.2 to exchange financial<br />
assets or financial liabilities<br />
with another entity under<br />
conditions that are potentially<br />
favourable to the entity; or<br />
4. a contract that will or may be<br />
settled in the entity’s own equity<br />
instruments and is:<br />
4.1 a non-derivative for which the<br />
entity is or may be obliged<br />
to receive a variable number<br />
of the entity’s own equity<br />
instruments; or<br />
4.2 a derivative that will or may<br />
be settled other than by the<br />
exchange of a fixed amount<br />
of cash or another financial<br />
asset for a fixed number of the<br />
entity’s own equity instruments.<br />
For this purpose, the entity’s<br />
own equity instruments do<br />
not include instruments that<br />
are themselves contracts<br />
for the future receipt or<br />
delivery of the entity’s own<br />
equity instruments.<br />
financial asset or financial<br />
liability at fair value through<br />
profit or loss<br />
A financial asset or financial liability<br />
that meets either of the following<br />
conditions:<br />
1. it is classified as held for trading.<br />
A financial asset or financial<br />
liability is classified as held for<br />
trading if it is:<br />
1.1 acquired or incurred<br />
principally for the purpose of<br />
selling or repurchasing it in the<br />
near term;<br />
1.2 that forms part of a portfolio<br />
of identified financial<br />
instruments that are managed<br />
together and for which there<br />
is evidence of a recent actual<br />
pattern of short-term profittaking;<br />
or<br />
1.3 that is a derivative (except<br />
for a derivative that is a<br />
financial guarantee contract<br />
or a designated and effective<br />
hedging instrument).<br />
2. Upon initial recognition it is<br />
designated by the entity as at fair<br />
value through profit or loss. An entity<br />
may use this designation only when<br />
permitted or when doing so results<br />
in more relevant information,<br />
because either:<br />
2.1 it eliminates or significantly<br />
reduces a measurement or<br />
recognition inconsistency that<br />
would otherwise arise from<br />
measuring assets or liabilities<br />
or recognising the gains and<br />
losses on them on different<br />
bases; or<br />
2.2 a group of financial<br />
assets, financial liabilities<br />
or both is managed<br />
and its performance is<br />
evaluated on a fair value<br />
basis, in accordance<br />
with a documented risk<br />
management or investment<br />
strategy, and information<br />
about the group is provided<br />
internally on that basis to<br />
the entity’s key management<br />
personnel.<br />
financial instrument<br />
Any contract that gives rise to<br />
a financial asset of one entity and<br />
a financial liability or equity instrument<br />
of another entity.<br />
financial liability<br />
Any liability that is:<br />
1. a contractual obligation:<br />
1.1 to deliver cash or another<br />
financial asset to another<br />
entity; or<br />
1.2 to exchange financial<br />
assets or financial liabilities<br />
with another entity under<br />
conditions that are potentially<br />
unfavourable to the entity; or<br />
2. a contract that will or may be<br />
settled in the entity’s own equity<br />
instruments and is:<br />
2.1 a non-derivative for which the<br />
entity is or may be obliged<br />
to deliver a variable number<br />
of the entity’s own equity<br />
instruments; or<br />
2.2 a derivative that will or<br />
may be settled other than<br />
by the exchange of a fixed<br />
amount of cash or another<br />
financial asset for a fixed<br />
number of the entity’s own<br />
equity instruments. For this<br />
purpose the entity’s own<br />
equity instruments do not<br />
include instruments that are<br />
themselves contracts for the<br />
future receipt or delivery<br />
of the entity’s own equity<br />
instruments.<br />
171
glossary of terms<br />
firm commitment<br />
A binding agreement for the exchange<br />
of a specified quantity of resources at<br />
a specified price on a specified future<br />
date or dates.<br />
forecast transaction<br />
An uncommitted but anticipated future<br />
transaction.<br />
functional currency<br />
The currency of the primary economic<br />
environment in which the entity<br />
operates.<br />
geographical segment<br />
A distinguishable component of an<br />
entity that is engaged in providing<br />
products or services within a particular<br />
economic environment and that is<br />
subject to risks and returns that are<br />
different from those of components<br />
operating in other economic<br />
environments.<br />
Good Business Journey<br />
The <strong>Woolworths</strong> Good business<br />
journey (GBJ) is a comprehensive<br />
five-year plan announced in<br />
April 2007. Incorporating a<br />
series of challenging targets<br />
and commitments centred on<br />
four key priorities – accelerating<br />
transformation, driving social<br />
development, enhancing<br />
<strong>Woolworths</strong>’ environmental focus<br />
and addressing climate change –<br />
it is <strong>Woolworths</strong> ongoing plan to<br />
make a difference in its communities,<br />
the country and the world.<br />
grant date<br />
The date at which the entity<br />
and another party (including an<br />
employee) agree to a share-based<br />
payment arrangement, being when<br />
the entity and the counterparty<br />
have a shared understanding of<br />
the terms and conditions of the<br />
arrangement. At grant date the<br />
entity confers on the counterparty<br />
the right to cash, other assets, or<br />
equity instruments of the entity,<br />
provided the specified vesting<br />
conditions, if any, are met. If that<br />
agreement is subject to an approval<br />
process, grant date is the date when<br />
that approval is obtained.<br />
group<br />
The group comprises <strong>Woolworths</strong><br />
<strong>Holdings</strong> <strong>Limited</strong> and all its subsidiaries,<br />
joint ventures and associate.<br />
hedging instrument<br />
A designated derivative or, for<br />
a hedge of the risk of changes in<br />
foreign currency exchange rates only,<br />
a designated non-derivative financial<br />
asset or non-derivative financial<br />
liability, whose fair value or cash flows<br />
are expected to offset changes in the<br />
fair value or cash flows of a designated<br />
hedged item.<br />
hedged item<br />
A liability or highly probable forecast<br />
transaction that exposes the entity to<br />
risk of changes in fair value or future<br />
cash flows and is designated as<br />
being hedged.<br />
hedge effectiveness<br />
The degree to which changes in the fair<br />
value or cash flows of the hedged item<br />
that are attributable to a hedged risk<br />
are offset by changes in the fair value<br />
or cash flows of the hedging instrument.<br />
held for trading financial<br />
instrument<br />
See financial asset or financial liability<br />
at fair value through profit or loss.<br />
intangible asset<br />
An identifiable non-monetary asset<br />
without physical substance.<br />
interest rate risk<br />
The risk that the fair value or future<br />
cash flows of a financial instrument will<br />
fluctuate because of changes in market<br />
interest rates.<br />
intrinsic value<br />
The difference between the fair value<br />
of the shares to which the counterparty<br />
has the (conditional or unconditional)<br />
right to subscribe or which it has the<br />
right to receive, and the price (if any) the<br />
counterparty is (or will be) required to<br />
pay for those shares.<br />
liquidity risk<br />
The risk that the entity will encounter<br />
difficulty in meeting obligations<br />
associated with financial liabilities.<br />
loans and receivables<br />
Non-derivative financial assets with<br />
fixed or determinable payments that<br />
are not quoted in an active market,<br />
other than:<br />
1. those that the entity intends to<br />
sell immediately or in the near term,<br />
which shall be classified as<br />
held-for-trading, and those that<br />
the entity upon initial recognition<br />
designates as at fair value through<br />
profit or loss;<br />
2. those that the entity upon initial<br />
recognition designates as<br />
available-for-sale; or<br />
3. those for which the holder may not<br />
recover substantially all of its initial<br />
investment, other than because of<br />
credit deterioration, and which shall<br />
be classified as available-for-sale.<br />
long-term incentive plan<br />
The long-term incentive plan provides<br />
eligible employees with the opportunity<br />
to acquire <strong>Woolworths</strong> <strong>Holdings</strong><br />
<strong>Limited</strong> shares by way of conditional<br />
awards of shares which are subject<br />
to the fulfilment of predetermined<br />
performance conditions covering<br />
a three-year period.<br />
minority interest<br />
The portion of the profit or loss<br />
and the net assets of a subsidiary<br />
attributable to equity interest that are<br />
not owned, directly or indirectly through<br />
subsidiaries, by the parent.<br />
monetary items<br />
Units of currency held and assets and<br />
liabilities to be received or paid in<br />
a fixed or determinable number of units<br />
of currency.<br />
Monte Carlo simulation<br />
method<br />
A method that is used to evaluate the<br />
probabilities of different gains or losses<br />
being realised over a future period. It is<br />
based on the generation of multiple<br />
trials to determine the expected value<br />
of a random variable.<br />
onerous contract<br />
A contract in which the unavoidable<br />
cost of meeting the obligation under the<br />
contract exceed the economic benefits<br />
expected to be received under it.<br />
172
Operating lease accrual<br />
Represents the difference between<br />
the cash flow impact and the<br />
amount charged to the statement of<br />
comprehensive income in respect of<br />
operating leases.<br />
past due<br />
A financial asset is past due when<br />
a counterparty has failed to make<br />
a payment when contractually due.<br />
present value<br />
A current estimate of the present<br />
discounted value of the future net cash<br />
flows in the normal course of business.<br />
reasonably possible change<br />
in risk variable<br />
Reasonably possible change in risk<br />
variable refers to most likely change in<br />
the risk variable, during the next annual<br />
period, which is judged relative to the<br />
economic environments in which the<br />
entity operates, and does not include<br />
’worst case’ scenarios.<br />
related party<br />
A party is related to an entity if:<br />
1. directly, or indirectly through one or<br />
more intermediaries, the party:<br />
1.1 controls, is controlled by, or<br />
is under common control<br />
with, the entity (this includes<br />
parents, subsidiaries and<br />
fellow subsidiaries);<br />
1.2 has an interest in the entity<br />
that gives it significant<br />
influence over the entity; or<br />
1.3 has joint control over the<br />
entity;<br />
2. the party is an associate of the<br />
entity;<br />
3. the party is a joint venture in which<br />
the entity is a venturer;<br />
4. the party is a member of the key<br />
management personnel of the entity<br />
or its parent;<br />
5. the party is a close family member<br />
of any individual referred to in (1) or<br />
(4) above;<br />
6. the party is an entity that is<br />
controlled, jointly controlled or<br />
significantly influenced by, or for<br />
which significant voting power in<br />
such entity resides with, directly or<br />
indirectly, any individual referred<br />
to in (4) or (5) above; or<br />
7. the party is a post-employment<br />
benefit plan for the benefit of<br />
employees of the entity, or of any<br />
entity that is a related party of<br />
the entity.<br />
Reporting date<br />
The last day of the financial period.<br />
Restricted share plan<br />
The restricted share plan gives eligible<br />
employees the rights to receive<br />
<strong>Woolworths</strong> <strong>Holdings</strong> <strong>Limited</strong> shares,<br />
subject to the satisfaction of certain<br />
service conditions within a specific<br />
time period.<br />
segment assets<br />
Those operating assets that are<br />
employed by a segment in its operating<br />
activities and that either are directly<br />
attributable to the segment or can<br />
be allocated to the segment on a<br />
reasonable basis. Segment assets<br />
exclude income tax assets, as well as<br />
investments, where the resulting income<br />
arising from the investments is excluded<br />
from segment results.<br />
segment expense<br />
Expense resulting from the operating<br />
activities of a segment that is directly<br />
attributable to the segment and the<br />
relevant portion of an expense that can<br />
be allocated on a reasonable basis to<br />
the segment. Segment expense does<br />
not include:<br />
1. interest, including interest incurred<br />
on advances or loans from other<br />
segments;<br />
2. losses on sales of investments;<br />
3. an entity’s share of losses of<br />
associates, joint ventures, or other<br />
investments accounted for under the<br />
equity method;<br />
4. income tax expense; and<br />
5. general administrative expenses,<br />
head office expenses, and other<br />
expenses that arise at the entity<br />
level and relate to the entity as<br />
a whole.<br />
segment result<br />
Segment revenue less segment expense<br />
before any adjustments for minority<br />
interest.<br />
segment revenue<br />
Revenue <strong>report</strong>ed in the entity’s<br />
statement of comprehensive income<br />
that is directly attributable to a segment<br />
and the relevant portion of entity<br />
revenue that can be allocated on a<br />
reasonable basis to a segment.<br />
Segment revenue does not include:<br />
1. interest or dividend income unless<br />
the segment’s operations are<br />
primarily of a financial nature; or<br />
2. gains on sales of investments or<br />
gains on extinguishment of debt<br />
unless the segment’s operations are<br />
primarily of a finance nature.<br />
share appreciation<br />
rights scheme<br />
This scheme gives eligible employees<br />
the rights to receive <strong>Woolworths</strong><br />
<strong>Holdings</strong> <strong>Limited</strong> shares equal to the<br />
value of the difference between the<br />
exercise price and the grant price,<br />
subject to the satisfaction of certain<br />
performance conditions within a<br />
specified period.<br />
share-based payment<br />
transaction<br />
A transaction in which the entity receives<br />
goods or services as consideration for<br />
equity instruments of the entity (including<br />
shares or share options), or acquires<br />
goods or services by incurring liabilities<br />
to the supplier of those goods or services<br />
for amounts that are based on the price<br />
of the entity’s shares or other equity<br />
instruments of the entity.<br />
share option<br />
A contract that gives the holder the right,<br />
but not the obligation, to subscribe<br />
to the entity’s shares at a fixed or<br />
determinable price for a specific period<br />
of time.<br />
subsidiary<br />
An entity over which the group has<br />
the power to govern the financial and<br />
operating policies so as to obtain<br />
benefits from its activities.<br />
treasury shares<br />
An entity’s own equity instruments, held<br />
by the entity or other members of the<br />
consolidated group.<br />
vest<br />
To become an entitlement. Under<br />
a share-based payment arrangement,<br />
a counterparty’s right to receive cash,<br />
or other assets, or equity instruments of<br />
the entity vests upon satisfaction of any<br />
specified vesting conditions.<br />
173
shareholder information<br />
174 shareholder calendar<br />
174 administration<br />
175 analysis of shareholders<br />
176 chairman’s letter to shareholders<br />
178 notice of annual general meeting<br />
181 form of proxy<br />
shareholder calendar<br />
Financial year end<br />
Reporting<br />
annual results announcement<br />
annual <strong>report</strong><br />
annual general meeting<br />
interim results and <strong>report</strong><br />
June<br />
August<br />
September<br />
November<br />
February<br />
Dividend declared<br />
final for the period ended June <strong>2010</strong><br />
interim for the period ended December <strong>2010</strong><br />
Dividend payable<br />
final for the period ended June <strong>2010</strong><br />
interim for the period ended December <strong>2010</strong><br />
August<br />
February<br />
September<br />
March<br />
administration<br />
group secretary<br />
Cherrie Lowe<br />
registered office<br />
<strong>Woolworths</strong> House<br />
93 Longmarket Street<br />
Cape Town<br />
8001<br />
Postal address<br />
PO Box 680<br />
Cape Town<br />
8000<br />
Telephone (+27 21) 407 9111<br />
Customer information www.woolworths.co.za<br />
Investor relations www.woolworthsholdings.co.za<br />
joint auditors<br />
Ernst & Young Inc. and SAB & T Inc.<br />
bankers<br />
The Standard Bank of South Africa <strong>Limited</strong><br />
transfer secretaries<br />
Computershare Investor Services (Proprietary) <strong>Limited</strong><br />
70 Marshall Street<br />
Johannesburg<br />
2001<br />
Postal address<br />
PO Box 61051<br />
Marshalltown<br />
2107<br />
Telephone (+27 11) 370 5000<br />
Facsimile (+27 11) 370 5487<br />
E-mail woolworths@computershare.co.za<br />
sponsor<br />
Rand Merchant Bank (A division of FirstRand Bank <strong>Limited</strong>)<br />
1 Merchant Place<br />
Cnr Fredman Drive and Rivonia Road<br />
Sandton, 2196<br />
Postal address<br />
PO Box 786273<br />
Sandton, 2146<br />
Telephone (+27 11) 282 8000<br />
Facsimile (+27 11) 282 8008<br />
E-mail sponsorteam@rmb.co.za<br />
depository for global depository receipts<br />
The Bank of New York<br />
Shareholder Relations Department<br />
Church Street Station<br />
PO Box 11258<br />
New York, NY 10286-1258<br />
United States of America<br />
UK<br />
Telephone +44 (0) 20 7964 6089<br />
Facsimilee +44 (0) 20 7964 6024<br />
E-mail mlewis@bankofny.com<br />
USA<br />
Telephone +1 212 815 2077<br />
Facsimilee +1 212 571 3050<br />
E-mail jpaltrowitz@bankofny.com<br />
company registration number<br />
1929/001986/06<br />
country of incorporation<br />
South Africa<br />
174
analysis of shareholders<br />
ordinary shareholder spread<br />
Pursuant to the JSE Listings Requirements and to the best knowledge of the directors, after reasonable enquiry, the spread of share<br />
holders at 27 June <strong>2010</strong> was as follows:<br />
Shareholder spread<br />
Number of<br />
shareholders<br />
% of total<br />
Number<br />
of shares<br />
% of total<br />
1 – 1 000 shares 5 594 45.12 2 028 528 0.24<br />
1 001 – 10 000 shares 4 869 39.27 18 271 427 2.16<br />
10 001 – 100 000 shares 1 409 11.37 44 583 789 5.26<br />
100 001 – 1 000 000 shares 413 3.33 127 367 128 15.02<br />
1 000 000 shares and over 113 0.91 655 535 934 77.32<br />
12 398 100.00 847 786 806 100.00<br />
Public and non-public<br />
Number of<br />
shareholders<br />
% of total<br />
Number<br />
of shares<br />
% of<br />
issued capital<br />
Public shareholders 12 385 99.89 734 017 681 86.58<br />
Non-public shareholders:<br />
Directors and their associates 10 0.08 17 386 928 2.05<br />
E-Com Investments 16 (Pty) Ltd 1 0.01 43 763 861 5.16<br />
<strong>Woolworths</strong> (Pty) Ltd 1 0.01 40 497 604 4.78<br />
<strong>Woolworths</strong> <strong>Holdings</strong> Share Trust 1 0.01 12 120 732 1.43<br />
12 398 100.00 847 786 806 100.00<br />
Geographical distribution<br />
Number<br />
of shares<br />
% of total<br />
South Africa 637 327 068 75.17<br />
United Kingdom 26 702 937 3.15<br />
United States of America 116 739 477 13.77<br />
Other 67 017 324 7.91<br />
847 786 806 100.00<br />
Major shareholders<br />
According to the company’s register of shareholders, read in conjunction with the company’s register of disclosure of beneficial<br />
interests made by registered shareholders acting in a nominee capacity, the following shareholders held directly and indirectly<br />
beneficially in excess of 5% of any class of the issued share capital at 27 June <strong>2010</strong>.<br />
Beneficial shareholders Shares held % of total<br />
Government Employees Pension Fund 147 771 821 17.43<br />
Liberty Life Association of Africa 49 037 862 5.78<br />
E-Com Investments 16 (Pty) Ltd 43 763 861 5.16<br />
240 573 544 28.37<br />
175
chairman’s letter to shareholders<br />
I invite you to attend the annual<br />
general meeting of <strong>Woolworths</strong><br />
<strong>Holdings</strong> <strong>Limited</strong>.<br />
Dear Shareholder<br />
I invite you to attend the annual<br />
general meeting of <strong>Woolworths</strong><br />
<strong>Holdings</strong> <strong>Limited</strong> to be held at<br />
09:00 in the Auditorium, 1st Floor,<br />
<strong>Woolworths</strong> House, 93 Longmarket<br />
Street, Cape Town, 8001, on Thursday,<br />
18 November <strong>2010</strong>.<br />
I encourage you to attend and vote<br />
your shares at the annual general<br />
meeting as this is your opportunity<br />
to meet and question members of<br />
the board.<br />
explanatory notes<br />
on resolutions<br />
Ordinary resolution 1 –<br />
Adoption of the annual<br />
financial statements<br />
Receive and consider for adoption the<br />
Group and Company audited annual<br />
financial statements for the year ended<br />
27 June <strong>2010</strong>.<br />
Ordinary resolution 2 –<br />
Re‐appointment of auditors<br />
Authorise the company to appoint our<br />
current joint auditors Ernst & Young<br />
Incorporated for the 2011 financial year.<br />
Ordinary resolution 3 – Increase<br />
in the remuneration for the<br />
non-executive directors<br />
Approve the non-executive directors’<br />
fees for the 2011 financial year.<br />
The fees reflect the substantial<br />
increase in legal, regulatory oversight<br />
requirements, the increased risk<br />
being assumed and time spent by<br />
non-executive directors.<br />
ordinary resolutions 4 to 8 –<br />
re‐election of directors<br />
In terms of articles 14.2 and 15 of the<br />
articles of association of the company<br />
new additions to the board and at least<br />
one-third of the board are required<br />
to retire each year. Retiring directors<br />
are those who have been in office the<br />
longest since their re-election.<br />
A review of the performance and an<br />
evaluation of independence have been<br />
carried out on those directors who are<br />
retiring by rotation. I am satisfied that,<br />
based on those reviews, I am able to<br />
recommend their re-election.<br />
Chris Nissen, Sindi Zilwa and Norman<br />
Thomson are required to retire by<br />
rotation at the annual general meeting<br />
and, being eligible, offer themselves<br />
for re‐election.<br />
In terms of the articles of association,<br />
Ian Moir and Tom Boardman are<br />
required to retire at the annual general<br />
meeting following their appointment<br />
between annual general meetings.<br />
A brief curriculum vitae of each director<br />
seeking re-election may be found in the<br />
notice of the annual general meeting<br />
on page 178.<br />
ordinary resolution 9 – general<br />
authority to make payments<br />
to shareholders<br />
Authorise the company as a general<br />
authority to make payments to its<br />
shareholders from the company’s share<br />
capital and/or share premium, from<br />
time to time, in terms of section 90 of<br />
the Companies Act, (No. 61 of 1973), as<br />
amended and in terms of the JSE <strong>Limited</strong><br />
(JSE) Listings Requirements.<br />
special resolution – general<br />
authority to repurchase shares<br />
Authorise the directors, through a general<br />
authority, to allow the company and/or its<br />
subsidiaries to repurchase the company’s<br />
shares during the course of the year.<br />
The company will publish an<br />
announcement complying with<br />
the JSE Listings Requirements if and<br />
when an initial and successive 3%<br />
tranche(s) of its shares have been<br />
repurchased in terms of this<br />
general authority.<br />
At the time of repurchase, the<br />
company’s sponsor will provide<br />
a letter to the JSE, regarding the<br />
directors’ statement as to the adequacy<br />
of the Group’s working capital, in terms<br />
of this general authority.<br />
Ordinary resolution<br />
10 – Amendments to the<br />
<strong>Woolworths</strong> Share<br />
Trust Deed<br />
Authorise the directors and Group<br />
secretary to register the proposed<br />
amendments to the <strong>Woolworths</strong><br />
Share Trust Deed. The amendments<br />
proposed, align the <strong>Woolworths</strong><br />
Share Trust Deed with the<br />
requirements of schedule 14 to the JSE<br />
<strong>Limited</strong> Listings Requirements (JSE).<br />
The JSE requires <strong>Woolworths</strong> to<br />
specify the maximum number of<br />
ordinary shares in the company<br />
available to be used for the purposes<br />
of the various share incentive<br />
176
schemes established in terms of<br />
the Trust Deed. <strong>Woolworths</strong> has<br />
previously had authority from its<br />
shareholders to utilise 15% of the<br />
issued ordinary share capital of the<br />
company for its share schemes. It now<br />
wishes to convert the percentage to<br />
a maximum number of 127 000 000<br />
(one hundred and twenty seven<br />
million) which equates to 15% of the<br />
current issued share capital in order<br />
to be compliant with the JSE. As the<br />
company has made allocations<br />
under the previous authority, the<br />
potential share dilutionary impact<br />
on shareholders is limited to 7.5%,<br />
being the number of shares not yet<br />
allocated as at 27 June <strong>2010</strong>. With<br />
respect to the maximum number of<br />
ordinary shares in the company to<br />
which any single participant under<br />
the various schemes established<br />
in terms of the Trust Deed shall be<br />
entitled, the company wishes to<br />
convert the current rolling 1.5% of the<br />
issued ordinary share capital to a<br />
fixed maximum number of 12 700 000<br />
(currently 1.5% of the issued ordinary<br />
share capital of the company).<br />
Where, however, shares are<br />
purchased on the market for the<br />
purposes of the schemes, those<br />
shares will not be taken into account<br />
for the purpose of determining the<br />
maximum limit and will not have any<br />
dilutionary impact on shareholders.<br />
Certain other amendments, none of<br />
which are material, are being made<br />
to the Trust Deed to ensure that it<br />
coincides with the manner in which<br />
the schemes are being implemented<br />
by the company.<br />
Ordinary resolution 11 – specific<br />
authority to the directors<br />
to issue ordinary shares for<br />
the purposes of the incentive<br />
schemes adopted by the<br />
company from time to time<br />
Authorise the directors to allot and issue<br />
such number of shares required for<br />
the purpose of the share schemes. It is<br />
noted that the number is limited to those<br />
shares that have not yet been issued<br />
by the directors under the previous<br />
authority. This number is not expected<br />
to exceed 7.5% of the issued ordinary<br />
share capital.<br />
Ordinary resolution 12<br />
– Authority to sign all<br />
documents required<br />
Authorise the directors and Group<br />
secretary to implement ordinary<br />
resolutions nine, ten and eleven and<br />
the special resolution.<br />
litigation statement<br />
In terms of section 11.26 of the JSE<br />
Listings Requirements, the directors,<br />
whose names are given on pages 12<br />
and 13 of the annual <strong>report</strong> of which<br />
this letter forms part, are not aware of<br />
any legal or arbitration proceedings,<br />
including proceedings that are<br />
pending or threatened, that may have<br />
or have had in the recent past, being<br />
at least within the previous twelve<br />
months, a material effect on the group’s<br />
financial position.<br />
directors’ responsibility<br />
statement<br />
The directors, whose names are<br />
given on pages 12 and 13 of the<br />
annual <strong>report</strong>, collectively and<br />
individually accept full responsibility<br />
for the accuracy of the information<br />
pertaining to the resolutions in the<br />
notice of the annual general meeting<br />
on page 178 and certify that to<br />
the best of their knowledge and<br />
belief there are no facts that have<br />
been omitted which would make<br />
any statements false or misleading<br />
and that all reasonable enquiries<br />
to ascertain such facts have been<br />
made and that the abovementioned<br />
resolutions contain all information<br />
required by law and the JSE Listings<br />
Requirements.<br />
material change<br />
Other than the facts and developments<br />
<strong>report</strong>ed on in the annual <strong>report</strong>,<br />
there have been no material changes<br />
in the affairs or financial position of<br />
the company and its subsidiaries since<br />
the date of signature of the audit <strong>report</strong><br />
and the date of the notice of annual<br />
general meeting.<br />
attendance at annual<br />
general meeting<br />
I look forward to welcoming you<br />
to the annual general meeting.<br />
If you are unable to attend, I urge<br />
you to complete the proxy form in<br />
accordance with the instructions<br />
set out in the notice of the annual<br />
general meeting.<br />
Buddy Hawton<br />
Chairman<br />
30 September <strong>2010</strong><br />
177
notice of annual general meeting<br />
Notice is hereby given that the <strong>2010</strong><br />
annual general meeting of shareholders<br />
of the company will be held at 09:00 in<br />
the Auditorium, 1st Floor, <strong>Woolworths</strong><br />
House, 93 Longmarket Street, Cape Town,<br />
8001, on Thursday, 18 November <strong>2010</strong> to<br />
consider and if thought fit, to pass with<br />
or without amendment the following<br />
ordinary and special resolutions:<br />
1. Ordinary resolution number 1 –<br />
Adoption of the annual financial<br />
statements<br />
”Resolved as an ordinary resolution<br />
that the annual financial statements<br />
of the company and the Group<br />
annual financial statements for the<br />
year ended 27 June <strong>2010</strong>, be and are<br />
hereby approved.”<br />
2. Ordinary resolution number 2 –<br />
Re‐appointment of auditors<br />
“Resolved as an ordinary resolution<br />
that Ernst & Young Inc. and SAB&T Inc.<br />
be and are hereby re-appointed as<br />
the joint auditors of the company<br />
until the conclusion of the next<br />
annual general meeting of the<br />
company.”<br />
3. Ordinary resolution number 3 –<br />
Increase in the remuneration for the<br />
non-executive directors<br />
”Resolved as an ordinary resolution<br />
that the remuneration to be paid to<br />
non-executive directors for the year<br />
commencing 1 July <strong>2010</strong>, details of<br />
which are contained in the corporate<br />
governance section of the annual<br />
<strong>report</strong> of the company <strong>2010</strong>, be and<br />
are hereby approved.”<br />
4. Ordinary resolution number 4 –<br />
Re‐election of director<br />
”Resolved as an ordinary resolution<br />
that Mr Andrew Christoffel<br />
Nissen, who retires by rotation in<br />
accordance with the articles of<br />
association and, being eligible,<br />
offers himself for re‐election,<br />
be and is hereby re‐elected as<br />
a director.”<br />
Brief curriculum vitae<br />
Age 52<br />
BA Hons, MA<br />
Other directorships include:<br />
Boschendal (Chairman), JCI, Sea<br />
Harvest Corporation (Chairman) and<br />
the Standard Bank Group.<br />
Chris has been extremely involved<br />
in the development and upliftment<br />
of communities both as a Minister<br />
in the Presbyterian Church and<br />
as a community leader, serving in<br />
a number of capacities. He has<br />
executive experience in a number<br />
of industries and as a non-executive<br />
director has proactively led<br />
transformation at a number of listed<br />
companies. He joined the board<br />
in 2004.<br />
5. Ordinary resolution number 5 –<br />
Re‐election of director<br />
“Resolved as an ordinary resolution<br />
that Ms Sindi Victoria Zilwa, who<br />
retires by rotation in accordance<br />
with the articles of association<br />
and, being eligible, offers herself<br />
for re‐election, be and is hereby<br />
re‐elected as a director.”<br />
Brief curriculum vitae<br />
Age 43<br />
BCompt (Hons), CTA, CA(SA),<br />
Advanced Taxation Certificate<br />
Other directorships include: ACSA<br />
(Chairman), Aspen Pharmacare<br />
<strong>Holdings</strong>, Discovery <strong>Holdings</strong>, Strate<br />
and Institute of Directors.<br />
Sindi became the second black<br />
female chartered accountant in<br />
South Africa in 1990 and is the<br />
Chief executive officer of Nkonki.<br />
Her previous directorships include<br />
the Transkei National Buildings<br />
Society, the South African Mint,<br />
WIPHOLD, Telkom, Primedia and<br />
Ethos Private Equity. She was the<br />
Chairman of the BUSA Standing<br />
committee on Transformation,<br />
a board member of the<br />
Independent Regulator Board for<br />
Auditors and a member of the<br />
GAAP Monitoring Panel. She joined<br />
the board in 2002.<br />
6. Ordinary resolution number 6 –<br />
Re‐election of director<br />
”Resolved as an ordinary<br />
resolution that Mr Norman William<br />
Thomson, who retires by rotation<br />
in accordance with the articles of<br />
association and, being eligible,<br />
offers himself for re‐election,<br />
be and is hereby re‐elected as<br />
a director.”<br />
Brief curriculum vitae<br />
Age 59<br />
BCom (Hons), CA(SA)<br />
Other directorships include: Country<br />
Road <strong>Limited</strong>.<br />
Norman joined <strong>Woolworths</strong> in<br />
1991 in a logistics capacity and<br />
introduced the integrated supply<br />
chain management systems. He was<br />
appointed to the board in 2001<br />
and was responsible for corporate<br />
stores, franchise and distribution<br />
and became Group finance director<br />
in 2002.<br />
7. Ordinary resolution number 7 –<br />
Re‐election of director<br />
“Resolved as an ordinary resolution<br />
that Mr Ian Moir who retires in<br />
accordance with the articles of<br />
association and, being eligible,<br />
offers himself for re‐election,<br />
be and is hereby re‐elected as<br />
a director.<br />
Brief curriculum vitae<br />
Age 51<br />
MBA, MA (Econ)<br />
Ian was previously the Chief<br />
executive officer of Country Road<br />
and prior to that an Executive<br />
director and Chief operating officer<br />
of Woolmark. He was appointed<br />
to the board in January <strong>2010</strong> as the<br />
Managing director retail and Group<br />
chief executive officer elect.<br />
8. Ordinary resolution number 8 –<br />
Re‐election of director<br />
“Resolved as an ordinary resolution<br />
that Mr Tom Boardman who retires<br />
in accordance with the articles of<br />
association and, being eligible,<br />
offers himself for re-election, be and<br />
is hereby re-elected as a director.”<br />
Brief curriculum vitae<br />
Age 60<br />
BCom, CA(SA)<br />
Other directorships include:<br />
Nedbank Group and Mutual &<br />
Federal Insurance.<br />
Tom was previously the Chief<br />
executive officer of Nedbank and<br />
was formerly the Chief executive<br />
officer of BoE. He is a nonexecutive<br />
director of the World<br />
Wildlife Fund South Africa and<br />
serves as a trustee in a number of<br />
charitable foundations.<br />
9. Ordinary resolution number 9 –<br />
General authority to make payments<br />
to shareholders<br />
“Resolved as an ordinary resolution<br />
that the company be and is hereby<br />
granted a general authority in<br />
terms of the Listings Requirements of<br />
the JSE <strong>Limited</strong> (JSE) authorising the<br />
directors to make payments to its<br />
shareholders, from the company’s<br />
share capital or share premium, in<br />
lieu of a dividend from time to time in<br />
terms of section 90 of the Companies<br />
Act, (61 of 1973), as amended and<br />
to make distributions in terms of<br />
section 46 of the Companies Act,<br />
2008 (71 of 2008), in such amount and<br />
in such form as the directors may<br />
in their discretion from time to time<br />
determine, provided that:<br />
9.1 such general authority shall<br />
be valid only until the next<br />
annual general meeting of<br />
the company or the expiry of<br />
a period of 15 months from<br />
the date of this resolution,<br />
whichever occurs first;<br />
9.2 such payment may not, in the<br />
aggregate, exceed 20% of<br />
the company’s issued share<br />
capital, including reserves, but<br />
excluding minority interests<br />
and revaluations of assets<br />
and intangible assets that<br />
are not supported by a<br />
178
valuation of an independent<br />
professional expert acceptable<br />
to the JSE, prepared within<br />
the last six months, in any<br />
one financial year, measured<br />
as at the beginning of such<br />
financial year;<br />
9.3 such payments shall be made<br />
pro rata to all shareholders;<br />
and<br />
9.4 such general authority shall not<br />
be required for the declaration<br />
and payment of, or preclude<br />
the company or the directors<br />
from declaring and paying<br />
dividends.”<br />
The directors may utilise the authority in<br />
terms of ordinary resolution number 9 in<br />
order to make payments to shareholders<br />
(other than payments of cash dividends<br />
paid out of retained income, scrip<br />
dividends or capitalisation issues, for<br />
which no authority is required in terms<br />
of the Listings Requirements of the JSE),<br />
if and when deemed appropriate<br />
by the directors. Announcements<br />
complying with Schedule 24 of<br />
the Listings Requirements of the JSE, will<br />
be published on SENS and in the press<br />
setting out the financial effects of any<br />
payment under the general authority,<br />
prior to such payment being effected.<br />
10. Special resolution – General<br />
authority to repurchase shares<br />
“Resolved as a special resolution<br />
that the company be and is hereby<br />
granted a general authority<br />
authorising the acquisition by the<br />
company and/or its subsidiaries<br />
of shares issued by the company,<br />
on such terms and conditions as<br />
the directors may deem fit, and<br />
in terms of sections 85 and 89 of<br />
the Companies Act, (61 of 1973),<br />
as amended, section 48 of the<br />
Companies Act, 2008 (71 of 2008), the<br />
company’s articles of association<br />
and the Listings Requirements of<br />
the JSE; provided that:<br />
10.1 such acquisitions shall be<br />
implemented through the<br />
order book operated by<br />
the JSE trading system and<br />
done without any prior<br />
understanding or arrangement<br />
between the company and the<br />
counter party, <strong>report</strong>ed trades<br />
being prohibited;<br />
10.2 such general authority shall<br />
be valid only until the next<br />
annual general meeting of<br />
the company or the expiry of<br />
a period of 15 months from<br />
the date of this resolution,<br />
whichever occurs first;<br />
10.3 such acquisitions may not<br />
be made at a price greater<br />
than 10% above the weighted<br />
average of the market value<br />
for the shares on the JSE for the<br />
five business days immediately<br />
preceding the date on<br />
which the transaction for the<br />
acquisition is effected;<br />
10.4 when the company has<br />
cumulatively repurchased<br />
3% of the initial number (the<br />
number of that class of shares<br />
in issue at the time that this<br />
general authority is granted)<br />
of the relevant class of shares,<br />
and for each 3% in aggregate<br />
of the initial number of that<br />
class acquired thereafter, a<br />
press announcement must be<br />
made containing the details<br />
required in terms of the Listings<br />
Requirements of the JSE in<br />
respect of such acquisitions;<br />
10.5 no repurchase of shares shall<br />
be effected during a prohibited<br />
period as contemplated in<br />
the Listings Requirements<br />
of the JSE unless they have<br />
in place a repurchase<br />
programme where the date<br />
and quantities of securities to<br />
be traded during the relevant<br />
period are fixed (not subject<br />
to any variation) and full<br />
details of the programme<br />
have been disclosed in an<br />
announcement over SENS prior<br />
to the commencement of the<br />
prohibited period;<br />
10.6 the company only appoints<br />
one agent to effect any<br />
acquisitions on its behalf;<br />
10.7 the aggregate of such<br />
acquisitions may not, in any<br />
one financial year, exceed 20%<br />
of the company’s issued share<br />
capital of that class as at the<br />
date of grant of this general<br />
authority; and<br />
10.8 the aggregate of such<br />
acquisitions held by<br />
subsidiaries of the company<br />
may not exceed 10% of the<br />
company’s issued share capital<br />
at any one time”.<br />
11. Ordinary resolution number 10 –<br />
Amendments to the <strong>Woolworths</strong><br />
Share Trust Deed<br />
“Resolved as an ordinary resolution<br />
that the amendments to the<br />
<strong>Woolworths</strong> <strong>Holdings</strong> Share Trust<br />
Deed (Trust Deed), as highlighted<br />
in the conformed copy of the Trust<br />
Deed tabled at the annual general<br />
meeting at which this resolution will<br />
be considered and initialled by the<br />
chairman of such meeting for the<br />
purposes of identification, be and<br />
they are hereby approved.”<br />
In order to be effective for the<br />
purposes of the Listings Requirements<br />
of the JSE <strong>Limited</strong>, this resolution<br />
must be approved by a 75% majority<br />
of the votes cast in favour of such<br />
resolution by all shareholders<br />
present or represented by proxy<br />
at the annual general meeting,<br />
excluding all the votes attaching<br />
to all equity securities owned or<br />
controlled by persons who are<br />
existing participants in the scheme.<br />
Only the equity securities which<br />
have been acquired in terms of<br />
the relevant scheme and may be<br />
impacted by the changes will be<br />
excluded from the said vote.<br />
A copy of the conformed copy<br />
of the trust deed reflecting the<br />
proposed amendments is available<br />
for inspection by the shareholders<br />
of the company at the company’s<br />
principle place of business,<br />
<strong>Woolworths</strong> House, 93 Longmarket<br />
Street, Cape Town, 8001 and at<br />
Rand Merchant Bank, a division of<br />
FirstRand Bank <strong>Limited</strong>, Corner Rivonia<br />
Road and Fredman Drive, Sandton,<br />
2146, during normal business<br />
hours from 30 September <strong>2010</strong> to<br />
18 November <strong>2010</strong>.<br />
12. Ordinary resolution number 11 –<br />
Specific authority to the directors<br />
to issue ordinary shares for the<br />
purposes of the incentive schemes<br />
adopted by the company from<br />
time to time<br />
“Resolved as an ordinary resolution<br />
that, subject to ordinary resolution<br />
number 10 being passed, 127 000 000<br />
ordinary shares of 0.15 cent each<br />
in the authorised but unissued<br />
share capital of the company be<br />
and they are placed under the<br />
control of the directors as a specific<br />
authority and instruction to issue<br />
such shares in accordance with the<br />
provisions of any incentive schemes<br />
adopted by the company from time<br />
to time, including, but not limited<br />
to, the existing scheme and the<br />
new schemes established in terms<br />
of The <strong>Woolworths</strong> <strong>Holdings</strong> Share<br />
Trust Deed, such specific authority<br />
and instruction superseding any<br />
prior specific authorities and<br />
instructions granted to the directors<br />
of the company to issue shares<br />
for the purposes of any incentive<br />
schemes adopted by the company<br />
except to the extent that such<br />
authorities have, at the date of the<br />
passing of this resolution, been<br />
utilised by the directors.”<br />
13. Ordinary resolution number 12 –<br />
Authority to sign all documents<br />
required<br />
“Resolved as an ordinary resolution<br />
that each of the directors and<br />
the Group secretary be and he<br />
or she is hereby authorised and<br />
empowered to do all such things<br />
and sign all such documents and<br />
procure the doing of all such<br />
things and the signature of all such<br />
179
notice of annual general meeting<br />
CONTINUED<br />
documents as may be necessary or<br />
incidental to give effect to ordinary<br />
resolutions numbered 9, 10 and 11<br />
and the special resolution to be<br />
proposed at the annual general<br />
meeting at which this resolution will<br />
be proposed.”<br />
The reasons for and the effects of<br />
ordinary resolutions numbered 9, 10<br />
and 11 and the special resolution:<br />
The reason for proposing ordinary<br />
resolution number 9 is to provide a<br />
general authority in terms of the Listings<br />
Requirements of the JSE, to allow<br />
the company to make payments to<br />
shareholders (other than payments of<br />
cash dividends paid out of retained<br />
income, scrip dividends or capitalisation<br />
issues for which no authority is required<br />
in terms of the Listings Requirements of the<br />
JSE), if and when deemed appropriate by<br />
the directors.<br />
The reason for proposing ordinary<br />
resolution number 10 is to ensure that<br />
the <strong>Woolworths</strong> <strong>Holdings</strong> Share Trust<br />
Deed complies with the amended<br />
requirements of Schedule 14 to the<br />
Listings Requirements of the JSE (Listings<br />
Requirements). As required by the revised<br />
Listings Requirements, the maximum<br />
number of ordinary shares in the<br />
company available in the aggregate<br />
for the purposes of the various schemes<br />
established in terms of the Trust Deed is<br />
now a fixed number of 127 000 000 shares<br />
(15% of the current issued ordinary share<br />
capital of the company) as opposed to<br />
15% of the issued ordinary share capital<br />
of the company from time to time and<br />
the maximum number of ordinary shares<br />
in the company to which any single<br />
participant under the various schemes<br />
established in terms of the Trust Deed<br />
shall be entitled will not in the aggregate<br />
exceed a fixed number of 12 700 000<br />
(1.5% of the current issued ordinary share<br />
capital of the company) as opposed to<br />
1.5% of the issued ordinary share capital<br />
of the company from time to time. Where,<br />
however, shares are purchased on the<br />
market for the purposes of the schemes,<br />
such shares will not be taken into<br />
account for the purpose of determining<br />
the limit of 127 000 000 shares. Currently,<br />
60 000 000 ordinary shares have been<br />
allocated in terms of the various incentive<br />
schemes and the balance of 67 000<br />
000 ordinary shares is anticipated to<br />
be sufficient for the requirements of the<br />
schemes for the ensuing 5 years. Certain<br />
other amendments, none of which are<br />
material, are being made to the Trust<br />
Deed to ensure that it coincides with<br />
the manner in which the schemes are<br />
being implemented by the company.<br />
In particular, it should be noted that<br />
decisions of the directors, insofar as<br />
they relate to the schemes, have been<br />
delegated by the directors to the<br />
Remuneration committee of the company,<br />
the members of which comprise nonexecutive<br />
directors who are, accordingly,<br />
not beneficiaries or participants under the<br />
schemes.<br />
The reason for proposing ordinary<br />
resolution number 11 is to place<br />
127 000 000 ordinary shares in the<br />
authorised but unissued share capital<br />
of the company (approximately 15% of<br />
the issued ordinary share capital of the<br />
company as at 27 June <strong>2010</strong>) under the<br />
control of the directors of the company<br />
as a specific authority and instruction<br />
to the directors to issue such shares for<br />
the purposes of any incentive schemes<br />
which may be adopted by the company<br />
from time to time. This revised authority is<br />
required in order to ensure compliance<br />
with the amended provisions of Schedule<br />
14 of the Listings Requirements of the JSE.<br />
The reason for and the effect of the<br />
special resolution, if passed and<br />
becoming effective, is to provide a<br />
general approval and authority in terms<br />
of Sections 85 and 89 of the Companies<br />
Act, (61 of 1973) as amended, the<br />
Companies Act, 2008 (71 of 2008) and<br />
the Listings Requirements of the JSE for<br />
the acquisition by the company and/<br />
or its subsidiaries of shares issued by<br />
the company.<br />
The directors consider that such general<br />
authority should be put in place in order<br />
to repurchase the company’s shares<br />
should an opportunity to do so, which is<br />
in the best interests of the company and<br />
its shareholders, present itself during<br />
the year.<br />
The directors will, if and when a decision<br />
is made to make a payment pursuant to<br />
the authority granted in terms of ordinary<br />
resolution number 9 or to repurchase<br />
shares pursuant to the authority granted<br />
in terms of the special resolution, be<br />
required to be satisfied, after having<br />
considered the effects of the payment or<br />
repurchase of shares, as the case may<br />
be, that for a period of 12 months after<br />
the date of the notice of the payment or<br />
repurchase:<br />
• the company and the group will<br />
be able, in the ordinary course of<br />
business, to pay its debts;<br />
• the assets of the company and the<br />
group, fairly valued in accordance<br />
with International Financial Reporting<br />
Standards, will exceed the liabilities of<br />
the company and the group;<br />
• the company and the group’s ordinary<br />
share capital, reserves and available<br />
working capital will be adequate for<br />
ordinary business purposes; and<br />
• upon entering the market to proceed<br />
with the repayment or repurchase,<br />
the company’s sponsor has confirmed<br />
the adequacy of the company’s and<br />
the group’s working capital for the<br />
purposes of undertaking the payment<br />
or repurchase of shares, as the case<br />
may be, in accordance with the<br />
Listings Requirements of the JSE.<br />
Voting<br />
Any ordinary shareholder who holds<br />
certificated ordinary shares in the<br />
company or who holds dematerialised<br />
ordinary shares in the company through<br />
a Central Securities Depository Participant<br />
(CSDP) or broker and who has selected<br />
“own name” registration and any<br />
preference shareholder, may attend,<br />
speak and vote at the annual general<br />
meeting or may appoint any other person<br />
or persons (none of whom need be a<br />
shareholder) as a proxy or proxies, to<br />
attend, speak and vote or abstain from<br />
voting at the annual general meeting<br />
or at any adjournment thereof, in such<br />
ordinary or preference shareholder’s<br />
stead. A proxy form is enclosed for<br />
use by such ordinary and preference<br />
shareholders. Such proxy form, duly<br />
completed, must be forwarded to reach<br />
the transfer secretaries of the company,<br />
Computershare Investor Services<br />
(Proprietary) <strong>Limited</strong>, 70 Marshall Street,<br />
Johannesburg, 2001 or be posted to them<br />
at PO Box 61051, Marshalltown, 2107, to be<br />
received, in either case, by no later than<br />
09:00 on Tuesday, 16 November <strong>2010</strong>.<br />
Any ordinary shareholder who holds<br />
dematerialised ordinary shares in<br />
the company and has not selected<br />
“own name” registration, should contact<br />
his CSDP or broker in the manner and<br />
time stipulated in such shareholder’s<br />
agreement with his CSDP or broker:<br />
• to furnish him with such shareholder’s<br />
voting instruction; and<br />
• in the event that such shareholder<br />
wishes to attend the annual general<br />
meeting, to obtain the necessary<br />
authority to do so.<br />
The Trustees of The <strong>Woolworths</strong> Employee<br />
Share Ownership Trust (Trust), as the owner<br />
of the unlisted convertible, redeemable,<br />
non-cumulative, participating preference<br />
shares in the company, will consult with<br />
the beneficiaries under the Trust on the<br />
resolutions which will be considered<br />
at the annual general meeting in order to<br />
ascertain the views of such beneficiaries<br />
on the manner in which the Trust should<br />
exercise its voting rights, as preference<br />
shareholder, in respect of such resolutions.<br />
On a show of hands, every shareholder,<br />
present in person or represented by proxy,<br />
shall have one vote only. On a poll, every<br />
shareholder, present in person or by<br />
proxy, shall have one vote for every share<br />
held or represented.<br />
By order of the board<br />
CL Lowe<br />
Group secretary<br />
Cape Town<br />
30 September <strong>2010</strong><br />
180
form of proxy<br />
WOOLWORTHS<br />
HOLDINGS<br />
WHLLIMITED<br />
(Incorporated in the Republic of South Africa)<br />
(Registration number: 1929/001986/06)<br />
Share code: WHL ISIN number: ZAE000063863<br />
(“<strong>Woolworths</strong>” or “the company”)<br />
For use only by:<br />
• holders of certificated ordinary shares in the company;<br />
• holders of dematerialised ordinary shares in the company held through a Central Securities Depository Participant (CSDP)<br />
or broker and who have selected “own name” registration; and<br />
• the holder of the convertible, redeemable, non-cumulative participating preference shares in the company (preference<br />
shares),<br />
at the annual general meeting of shareholders of the company to be held in the Auditorium, 1st Floor <strong>Woolworths</strong> House,<br />
93 Longmarket Street, Cape Town, 8001 at 09:00 on Thursday, 18 November <strong>2010</strong> and at any adjournment thereof (“the annual<br />
general meeting”).<br />
If you are a shareholder referred to above, and are entitled to attend and vote at the annual general meeting, you can<br />
appoint a proxy or proxies to attend, vote and speak in your stead at the annual general meeting. A proxy need not be<br />
a shareholder of the company.<br />
If you are an ordinary shareholder and have dematerialised your ordinary shares through a CSDP (and have not selected<br />
“own name” registration in the sub-register maintained by a CSDP), do not complete this form of proxy but instruct your CSDP<br />
to issue you with the necessary authority to attend the annual general meeting, or if you do not wish to attend, provide<br />
your CSDP with your voting instructions in terms of your custody agreement entered into with it.<br />
I/We (full names in block letters)<br />
of (address)<br />
being a holder/s of<br />
appoint (see note 1)<br />
ordinary/preference shares in the company (delete whichever is inapplicable), hereby<br />
1. of failing him/her,<br />
2. of failing him/her,<br />
3. the Chairman of the annual general meeting, as my/our proxy to attend, speak and on a poll to vote or abstain from voting on<br />
my/our behalf, as indicated below, at the annual general meeting and/or at any adjournment thereof:<br />
Resolution For Against Abstain<br />
Ordinary resolution 1 – adoption of the annual financial statements<br />
Ordinary resolution 2 – re-appointment of joint auditors<br />
Ordinary resolution 3 – increase in the remuneration for the non-executive directors<br />
Ordinary resolution 4 – re-election of AC Nissen as a director<br />
Ordinary resolution 5 – re-election of SV Zilwa as a director<br />
Ordinary resolution 6 – re-election of NW Thomson as a director<br />
Ordinary resolution 7 – re-election of I Moir as a director<br />
Ordinary resolution 8 – re-election of T Boardman as a director<br />
Ordinary resolution 9 – general authority to make payments to shareholders<br />
Special resolution – general authority to repurchase shares<br />
Ordinary resolution 10 – amendments to the <strong>Woolworths</strong> <strong>Holdings</strong> Share Trust Deed<br />
Ordinary resolution 11 – specific authority to the directors to issue ordinary shares for the<br />
purposes of the incentive schemes adopted by the company from time to time<br />
Ordinary resolution 12 – authority to sign all documents required<br />
* Insert an “X” in the relevant spaces above according to how you wish your votes to be cast. However, if you wish to cast your<br />
votes in respect of a lesser number of shares than you own in the company, insert the number of shares which you desire to<br />
vote (see note 2).<br />
Signed at this day of <strong>2010</strong><br />
Signature<br />
Assisted by me (if applicable)<br />
Please read the notes on the reverse side hereof.<br />
181
instructions for proxy form<br />
Notes:<br />
1. A shareholder is entitled to appoint one or more proxies (none of whom need be a shareholder of the company) to<br />
attend, speak and vote or abstain from voting in the place of that shareholder at the annual general meeting.<br />
2. A shareholder may therefore insert the name of a proxy or the names of two alternative proxies of the shareholder’s<br />
choice in the space provided, with or without deleting the words “the Chairman of the company or failing him the<br />
Chairman of the annual general meeting”. The person whose name appears first on the proxy form and who is present<br />
at the annual general meeting, will be entitled to act as proxy to the exclusion of those whose names follow.<br />
3. A shareholder’s instructions to the proxy must be indicated by the insertion of an “X” in the appropriate box. Failure to<br />
comply with the above will be deemed to authorise the Chairman of the company or failing him the Chairman of the<br />
annual general meeting, if he is the authorised proxy, to vote in favour of resolutions at the annual general meeting,<br />
or any other proxy to vote or abstain from voting at the annual general meeting as he deems fit, in respect of the<br />
shareholder’s total holding.<br />
4. The completion and lodging of this form of proxy will not preclude a shareholder from attending the annual general<br />
meeting and speaking and voting in person thereat to the exclusion of any proxy appointed in terms hereof, should<br />
such shareholder wish to do so.<br />
5. In case of joint holders, the vote of the most senior who tenders a vote, whether in person or by proxy, will be accepted<br />
to the exclusion of the votes of the other joint holders, for which purpose seniority will be determined by the order in<br />
which the names appear on the company’s register of shareholders in respect of the joint holding.<br />
6. The Chairman of the annual general meeting may reject or accept any form of proxy which is completed and/or<br />
received otherwise than in accordance with these notes.<br />
7. Documentary evidence establishing the authority of a person signing this form of proxy in a representative capacity<br />
must be attached to this form of proxy unless previously recorded by the company’s transfer secretaries or waived by<br />
the Chairman of the annual general meeting.<br />
8. Any alteration or correction to this form of proxy must be initialled by the signatory/ies, other than the deletion<br />
of signatories.<br />
9. Forms of proxy must be lodged with or posted to the company, c/o Computershare Investor Services (Proprietary)<br />
<strong>Limited</strong>, 70 Marshall Street, Johannesburg, 2001 (PO Box 61051, Marshalltown, 2107), to be received by no later than<br />
09:00 on Tuesday, 16 November <strong>2010</strong>.<br />
182
www.woolworthsholdings.co.za<br />
THIS ANNUAL REPORT IS THE FIRST DOCUMENT TO BE PRINTED ON SAPPI’S MASUGA PAPER,<br />
WHICH IS MADE WITH 90% SUGAR CANE WASTE SOURCED FROM PREVIOUSLY DISADVANTAGED<br />
LOCAL SUPPLIERS, AND 10% WOOD FIBRE FROM SUSTAINABLE FORESTS. IT SUPPORTS OUR<br />
GOOD BUSINESS JOURNEY GOALS OF PROTECTING THE ENVIRONMENT AND<br />
EMPOWERING OUR PEOPLE.<br />
MASUGA IS PRODUCED AT SAPPI’S STANGER MILL IN KWAZULU-NATAL.<br />
s w e e t p a p e r<br />
by