Automated QT Interval Analysis on Diagnostic ... - PhysioNet
Automated QT Interval Analysis on Diagnostic ... - PhysioNet
Automated QT Interval Analysis on Diagnostic ... - PhysioNet
You also want an ePaper? Increase the reach of your titles
YUMPU automatically turns print PDFs into web optimized ePapers that Google loves.
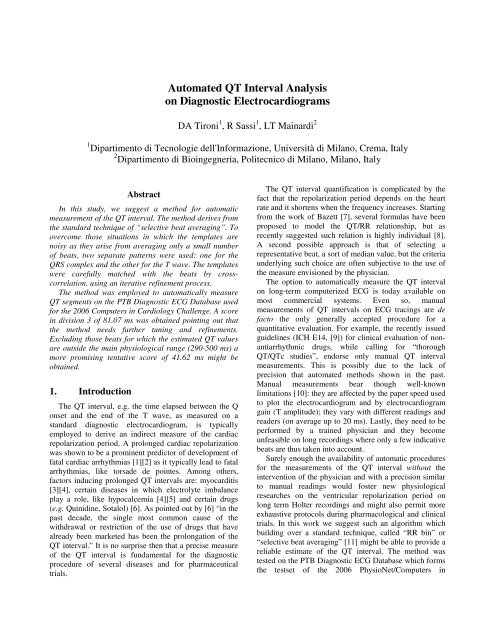
<str<strong>on</strong>g>Automated</str<strong>on</strong>g> <str<strong>on</strong>g>QT</str<strong>on</strong>g> <str<strong>on</strong>g>Interval</str<strong>on</strong>g> <str<strong>on</strong>g>Analysis</str<strong>on</strong>g><br />
<strong>on</strong> <strong>Diagnostic</strong> Electrocardiograms<br />
DA Tir<strong>on</strong>i 1 , R Sassi 1 , LT Mainardi 2<br />
1 Dipartimento di Tecnologie dell'Informazi<strong>on</strong>e, Università di Milano, Crema, Italy<br />
2 Dipartimento di Bioingegneria, Politecnico di Milano, Milano, Italy<br />
Abstract<br />
In this study, we suggest a method for automatic<br />
measurement of the <str<strong>on</strong>g>QT</str<strong>on</strong>g> interval. The method derives from<br />
the standard technique of “selective beat averaging”. To<br />
overcome those situati<strong>on</strong>s in which the templates are<br />
noisy as they arise from averaging <strong>on</strong>ly a small number<br />
of beats, two separate patterns were used: <strong>on</strong>e for the<br />
QRS complex and the other for the T wave. The templates<br />
were carefully matched with the beats by crosscorrelati<strong>on</strong>,<br />
using an iterative refinement process.<br />
The method was employed to automatically measure<br />
<str<strong>on</strong>g>QT</str<strong>on</strong>g> segments <strong>on</strong> the PTB <strong>Diagnostic</strong> ECG Database used<br />
for the 2006 Computers in Cardiology Challenge. A score<br />
in divisi<strong>on</strong> 3 of 81.07 ms was obtained pointing out that<br />
the method needs further tuning and refinements.<br />
Excluding those beats for which the estimated <str<strong>on</strong>g>QT</str<strong>on</strong>g> values<br />
are outside the main physiological range (290-500 ms) a<br />
more promising tentative score of 41.62 ms might be<br />
obtained.<br />
1. Introducti<strong>on</strong><br />
The <str<strong>on</strong>g>QT</str<strong>on</strong>g> interval, e.g. the time elapsed between the Q<br />
<strong>on</strong>set and the end of the T wave, as measured <strong>on</strong> a<br />
standard diagnostic electrocardiogram, is typically<br />
employed to derive an indirect measure of the cardiac<br />
repolarizati<strong>on</strong> period. A prol<strong>on</strong>ged cardiac repolarizati<strong>on</strong><br />
was shown to be a prominent predictor of development of<br />
fatal cardiac arrhythmias [1][2] as it typically lead to fatal<br />
arrhythmias, like torsade de pointes. Am<strong>on</strong>g others,<br />
factors inducing prol<strong>on</strong>ged <str<strong>on</strong>g>QT</str<strong>on</strong>g> intervals are: myocarditis<br />
[3][4], certain diseases in which electrolyte imbalance<br />
play a role, like hypocalcemia [4][5] and certain drugs<br />
(e.g. Quinidine, Sotalol) [6]. As pointed out by [6] “in the<br />
past decade, the single most comm<strong>on</strong> cause of the<br />
withdrawal or restricti<strong>on</strong> of the use of drugs that have<br />
already been marketed has been the prol<strong>on</strong>gati<strong>on</strong> of the<br />
<str<strong>on</strong>g>QT</str<strong>on</strong>g> interval.” It is no surprise then that a precise measure<br />
of the <str<strong>on</strong>g>QT</str<strong>on</strong>g> interval is fundamental for the diagnostic<br />
procedure of several diseases and for pharmaceutical<br />
trials.<br />
The <str<strong>on</strong>g>QT</str<strong>on</strong>g> interval quantificati<strong>on</strong> is complicated by the<br />
fact that the repolarizati<strong>on</strong> period depends <strong>on</strong> the heart<br />
rate and it shortens when the frequency increases. Starting<br />
from the work of Bazett [7], several formulas have been<br />
proposed to model the <str<strong>on</strong>g>QT</str<strong>on</strong>g>/RR relati<strong>on</strong>ship, but as<br />
recently suggested such relati<strong>on</strong> is highly individual [8].<br />
A sec<strong>on</strong>d possible approach is that of selecting a<br />
representative beat, a sort of median value, but the criteria<br />
underlying such choice are often subjective to the use of<br />
the measure envisi<strong>on</strong>ed by the physician.<br />
The opti<strong>on</strong> to automatically measure the <str<strong>on</strong>g>QT</str<strong>on</strong>g> interval<br />
<strong>on</strong> l<strong>on</strong>g-term computerized ECG is today available <strong>on</strong><br />
most commercial systems. Even so, manual<br />
measurements of <str<strong>on</strong>g>QT</str<strong>on</strong>g> intervals <strong>on</strong> ECG tracings are de<br />
facto the <strong>on</strong>ly generally accepted procedure for a<br />
quantitative evaluati<strong>on</strong>. For example, the recently issued<br />
guidelines (ICH E14, [9]) for clinical evaluati<strong>on</strong> of n<strong>on</strong>antiarrhythmic<br />
drugs, while calling for “thorough<br />
<str<strong>on</strong>g>QT</str<strong>on</strong>g>/<str<strong>on</strong>g>QT</str<strong>on</strong>g>c studies”, endorse <strong>on</strong>ly manual <str<strong>on</strong>g>QT</str<strong>on</strong>g> interval<br />
measurements. This is possibly due to the lack of<br />
precisi<strong>on</strong> that automated methods shown in the past.<br />
Manual measurements bear though well-known<br />
limitati<strong>on</strong>s [10]: they are affected by the paper speed used<br />
to plot the electrocardiogram and by electrocardiogram<br />
gain (T amplitude); they vary with different readings and<br />
readers (<strong>on</strong> average up to 20 ms). Lastly, they need to be<br />
performed by a trained physician and they become<br />
unfeasible <strong>on</strong> l<strong>on</strong>g recordings where <strong>on</strong>ly a few indicative<br />
beats are thus taken into account.<br />
Surely enough the availability of automatic procedures<br />
for the measurements of the <str<strong>on</strong>g>QT</str<strong>on</strong>g> interval without the<br />
interventi<strong>on</strong> of the physician and with a precisi<strong>on</strong> similar<br />
to manual readings would foster new physiological<br />
researches <strong>on</strong> the ventricular repolarizati<strong>on</strong> period <strong>on</strong><br />
l<strong>on</strong>g term Holter recordings and might also permit more<br />
exhaustive protocols during pharmacological and clinical<br />
trials. In this work we suggest such an algorithm which<br />
building over a standard technique, called “RR bin” or<br />
“selective beat averaging” [11] might be able to provide a<br />
reliable estimate of the <str<strong>on</strong>g>QT</str<strong>on</strong>g> interval. The method was<br />
tested <strong>on</strong> the PTB <strong>Diagnostic</strong> ECG Database which forms<br />
the testset of the 2006 <strong>PhysioNet</strong>/Computers in
Cardiology Challenge [12]. The database c<strong>on</strong>sists of 549<br />
recordings of a couple of minutes each, collected from<br />
294 subjects. For each record the 12 c<strong>on</strong>venti<strong>on</strong>al leads<br />
and the 3 XYZ leads had been made available.<br />
2. Methods<br />
2.1. Preprocessing<br />
The dataset did not c<strong>on</strong>tain annotati<strong>on</strong>s. Thus, each<br />
record was firstly processed for QRS detecti<strong>on</strong> using the<br />
freely available software ECGPUWAVE [13]. The<br />
routine also provided an estimate of the waveforms’<br />
boundaries which were used as starting point of the<br />
method described below. The choice was made just for<br />
c<strong>on</strong>venience (the code was faster) and it could have been<br />
completely avoided using a fixed <str<strong>on</strong>g>QT</str<strong>on</strong>g> initial guess.<br />
2.2. <str<strong>on</strong>g>QT</str<strong>on</strong>g> measurement<br />
The ECG signal was first high-pass filtered to remove<br />
major baseline wander (5 th order Butterworth filter, cut<br />
off frequency 0.5 Hz).<br />
Then local average patterns were built subject to the<br />
c<strong>on</strong>diti<strong>on</strong> that the RR interval between successive beats<br />
did n<strong>on</strong> change more than a specified threshold. In fact,<br />
as previously outlined, the <str<strong>on</strong>g>QT</str<strong>on</strong>g> interval changes with the<br />
heart rate; more importantly the <str<strong>on</strong>g>QT</str<strong>on</strong>g> length needs to adapt<br />
to the new pace when it changes and the process takes<br />
time. Building average patterns using <strong>on</strong>ly beats which<br />
are about at the same distance, it ensures that the <str<strong>on</strong>g>QT</str<strong>on</strong>g><br />
measures might be taken in a porti<strong>on</strong> of the ECG where<br />
<str<strong>on</strong>g>QT</str<strong>on</strong>g> adaptati<strong>on</strong> already occurred (and measures are thus<br />
reproducible). Specifically the local patterns were built<br />
through successive refinement in an iterative process.<br />
First, within each ECG recording the groups of beat for<br />
which |RR i+1 -RR i |
of beats bel<strong>on</strong>ging to each group). The iterative process<br />
was ended when the number of adjustments in a cycle<br />
was small or the number of cycles exceeded a threshold.<br />
To speed up the refinement process, instead of using a<br />
first T end guess located 500 ms from the Q start, we also<br />
employed the <str<strong>on</strong>g>QT</str<strong>on</strong>g> estimate provided by ECGPWAVE as<br />
specified in secti<strong>on</strong> 2.1. A couple of local average<br />
patterns obtained from a group of four beats are shown in<br />
figure 1.<br />
Once adjusted the positi<strong>on</strong> of the two c<strong>on</strong>venti<strong>on</strong>al<br />
points with respect to the average patterns and thus<br />
obtained patterns which reflected the morphology of each<br />
group more carefully, the Q <strong>on</strong>set and T offset were<br />
measured <strong>on</strong> the patterns themselves. The idea is that the<br />
averaging process reduces the intensity of the noise,<br />
which is in first approximati<strong>on</strong> uncorrelated with the<br />
ECG signal, ensuring more precise measures. The<br />
isoelectric level was identified following the standard EN<br />
60601-2-51:2005-06 as having durati<strong>on</strong> of more than 6<br />
ms and amplitudes not exceeding 20 µV for at least three<br />
samples. The Q <strong>on</strong>set was located at the end of the<br />
isoelectric level preceding the QRS complex. The T offset<br />
was instead detected using the Lepeschkin & Surawicz<br />
method [14] as the point at the intersecti<strong>on</strong> of the<br />
isoelectric level and the tangent of maximum slope to the<br />
T complex. The tangents were built using a local least<br />
squares approximati<strong>on</strong> <strong>on</strong> short windows of 20 ms.<br />
Finally, individual <str<strong>on</strong>g>QT</str<strong>on</strong>g> measures might be obtained for<br />
each beat of the family adjusting the c<strong>on</strong>venti<strong>on</strong>al Q start<br />
and T end points, as used to build the average patterns,<br />
with the offsets they show with respect to the patterns’ Q<br />
<str<strong>on</strong>g>QT</str<strong>on</strong>g> (ms)<br />
400<br />
350<br />
300<br />
250<br />
200<br />
740 760 780 800 820<br />
RR (ms)<br />
Figure 2. <str<strong>on</strong>g>QT</str<strong>on</strong>g>/RR relati<strong>on</strong>ship for recording s0398lre.<br />
Each point in the figure was obtained measuring the <str<strong>on</strong>g>QT</str<strong>on</strong>g><br />
interval for the first beat of each group of similar beats,<br />
while the RR value was averaged within each group. The<br />
dashed line is the least squared linear interpolant.<br />
<strong>on</strong>set and T offset. For example, if the T offset was<br />
detected <strong>on</strong> the average pattern to be 15 ms in fr<strong>on</strong>t of the<br />
T start points <strong>on</strong> which the beats were aligned, each of the<br />
T start points might be moved of 15ms leading to an<br />
estimate of each T offset.<br />
3. Results<br />
The method was employed to automatically measure<br />
<str<strong>on</strong>g>QT</str<strong>on</strong>g> segments <strong>on</strong> the 549 diagnostic ECG recordings<br />
which c<strong>on</strong>stitute the PTB <strong>Diagnostic</strong> ECG Database used<br />
for the 2006 Computers in Cardiology Challenge. The<br />
measures were performed <strong>on</strong> lead II, as required for the<br />
challenge. Moreover, it was required to provide a <str<strong>on</strong>g>QT</str<strong>on</strong>g><br />
measurement for the first “representative beat” of the<br />
recording. We c<strong>on</strong>sidered as “representative” the first<br />
beat of the first group of beats. In fact, if entering a group<br />
at the end of the refinement process such beat was<br />
guaranteed to be at least similar to a number of beat<br />
following it.<br />
Due to low signal quality (2 cases) or to a high heart<br />
rate variability within the recording (which reduced the<br />
possibility to have groups of at least 2 beats with |RR i+1 -<br />
RR i |
situati<strong>on</strong>s in which the patterns arise from averaging <strong>on</strong>ly<br />
a small number of beats, such as when, in short ECG<br />
segments, the noise level is not negligible, the heart rate<br />
variability high or many ectopic beats are present. In<br />
those situati<strong>on</strong>s taking the measures <strong>on</strong> the average<br />
patters is of little help unless we are able to increase the<br />
number of beats in the group. Therefore, the use of two<br />
separate patterns possibly increases the number of<br />
recording <strong>on</strong> which effectively using the technique.<br />
Unfortunately, the technique we suggested proved<br />
capable of automatically refining the positi<strong>on</strong>s of Q<br />
<strong>on</strong>sets and T offsets in <strong>on</strong>ly a fracti<strong>on</strong> of the total<br />
recordings (about 87%). When the recordings were highly<br />
corrupted by noise or the initial guess for the end of the T<br />
wave was misplaced, often the algorithm ended up<br />
misleadingly providing an estimate of the end of the P<br />
wave of the following beat (thus furnishing estimates for<br />
the <str<strong>on</strong>g>QT</str<strong>on</strong>g> interval far outside the physiological range).<br />
Obviously, for the sake of the competiti<strong>on</strong>, we could have<br />
substituted all the <str<strong>on</strong>g>QT</str<strong>on</strong>g> we knew were outside the<br />
physiological range (e.g. <str<strong>on</strong>g>QT</str<strong>on</strong>g>500 ms)<br />
with a comm<strong>on</strong> physiologically-reas<strong>on</strong>able value, let’s<br />
say 400 ms. As we verified after the competiti<strong>on</strong> was<br />
ended and the “gold standard” scores published, doing so<br />
our hypothetical score would have been of 44.63 ms,<br />
much closer to what we c<strong>on</strong>sider the true performances of<br />
our algorithm (see previous secti<strong>on</strong>). Nevertheless, we<br />
c<strong>on</strong>sidered that such substituti<strong>on</strong>, meaningful <strong>on</strong>ly for the<br />
competiti<strong>on</strong>, would have been of any scientific interest<br />
and we rather avoided it.<br />
The method we suggested needs surely further work<br />
and a fine tuning. A multi-lead approach might be a<br />
possible improvement: applying the method <strong>on</strong> more than<br />
a lead could help to resolve those situati<strong>on</strong>s in which the<br />
<str<strong>on</strong>g>QT</str<strong>on</strong>g> value computed <strong>on</strong> the lead II was outside the<br />
physiological range. Also, a rough refinement of the<br />
initial guess for “T end” might help.<br />
No matter how the method we proposed scored, we<br />
feel that the overall competiti<strong>on</strong> showed that it might be<br />
possible in the future to accept automated methods am<strong>on</strong>g<br />
those trusted to measure the <str<strong>on</strong>g>QT</str<strong>on</strong>g> interval from ECG<br />
recording, thus also ensuring a higher repeatability of<br />
measurements than today.<br />
Acknowledgements<br />
The authors thank the organizers of the challenge for<br />
the effort shown in organizing the competiti<strong>on</strong>.<br />
References<br />
[1] de Bruyne MC, Hoes AW, Kors JA, Hofman A, van<br />
Bemmel JH, Grobbee DE. Prol<strong>on</strong>ged <str<strong>on</strong>g>QT</str<strong>on</strong>g> interval predicts<br />
cardiac and all-cause mortality in the elderly - The<br />
Rotterdam Study. European Heart Journal 1999;20:278–<br />
284.<br />
[2] M<strong>on</strong>tanez A, Ruskin JN, Hebert PR, Lamas GA,<br />
Hennekens CH. Prol<strong>on</strong>ged <str<strong>on</strong>g>QT</str<strong>on</strong>g>c <str<strong>on</strong>g>Interval</str<strong>on</strong>g> and Risks of Total<br />
and Cardiovascular Mortality and Sudden Death in the<br />
General Populati<strong>on</strong>. Aech Intern Med 2004;164:943-948.<br />
[3] Gittleman IW, Thorner MC, Griffith GC. The Q-T interval<br />
of the electrocardiogram in acute myocarditis in adults,<br />
with autopsy correlati<strong>on</strong>. Am Heart J. 1951;41:78-90.<br />
[4] Lepeschkin E, Surawicz B. The measurement of the Q-T<br />
interval of the electrocardiogram. Circulati<strong>on</strong>;1952;6:378-<br />
388.<br />
[5] Hoffman JIE, Lister G. The implicati<strong>on</strong>s of a relati<strong>on</strong>ship<br />
between prol<strong>on</strong>ged <str<strong>on</strong>g>QT</str<strong>on</strong>g> interval and the Sudden Infant<br />
Death Syndrome. Pediatrics 1999;103:815-817.<br />
[6] Roden DM. Drug-Induced Prol<strong>on</strong>gati<strong>on</strong> of the <str<strong>on</strong>g>QT</str<strong>on</strong>g> <str<strong>on</strong>g>Interval</str<strong>on</strong>g>.<br />
N Engl J Med 2004;350:1013-1022.<br />
[7] Bazett HC. An analysis of the time-relati<strong>on</strong>s of<br />
electrocardiograms. Heart 1920;7:353-370.<br />
[8] Malik M, Färbom P, Batchvarov V, Hnatkova K, Camm<br />
AJ. Relati<strong>on</strong> between <str<strong>on</strong>g>QT</str<strong>on</strong>g> and RR intervals is highly<br />
individual am<strong>on</strong>g healthy subjects: implicati<strong>on</strong>s for heart<br />
rate correcti<strong>on</strong> of the <str<strong>on</strong>g>QT</str<strong>on</strong>g> interval. Heart 2002;87:220-228.<br />
[9] ICH. E14 Clinical Evaluati<strong>on</strong> of <str<strong>on</strong>g>QT</str<strong>on</strong>g>/<str<strong>on</strong>g>QT</str<strong>on</strong>g>c <str<strong>on</strong>g>Interval</str<strong>on</strong>g> Prol<strong>on</strong>gati<strong>on</strong><br />
and Proarrhythmic Potential for N<strong>on</strong>-Antiarrhythmic<br />
Drugs. 2005. http://www.fda.gov/cber/gdlns/iche14qtc.htm<br />
[10] Murray A, McLaughlin NB, Bourke JP, Doig JC, Furniss<br />
SS, Campbell RW. Errors in manual measurement of <str<strong>on</strong>g>QT</str<strong>on</strong>g><br />
intervals. Br. Heart J. 1994;71:386-390.<br />
[11] Badilini F, Mais<strong>on</strong>-Blanche P, Childers R, Coumel P. <str<strong>on</strong>g>QT</str<strong>on</strong>g><br />
interval analysis <strong>on</strong> ambulatory electrocardiogram<br />
recordings: a selective beat averaging approach. Med Biol<br />
Eng Comput. 1999;37:71-9.<br />
[12] Moody GB, Koch H, Steinhoff U. The <strong>PhysioNet</strong> /<br />
Computers in Cardiology Challenge 2006: <str<strong>on</strong>g>QT</str<strong>on</strong>g> <str<strong>on</strong>g>Interval</str<strong>on</strong>g><br />
Measurement. Computers in Cardiology (33) 2006.<br />
[13] Laguna P, Jané R, Bogatell E, Anglada DV.<br />
ECGPUWAVE, freely available from www.physi<strong>on</strong>et.org.<br />
[14] Lepeschkin E, Surawicz B. The measurement of the Q-T<br />
interval of the electrocardiogram. Circulati<strong>on</strong> 1952;6:378-<br />
388.<br />
Address for corresp<strong>on</strong>dence<br />
Roberto Sassi<br />
Dipartimento di Tecnologie dell'Informazi<strong>on</strong>e<br />
Università degli Studi di Milano<br />
via Bramante 65, 26013 Crema (CR) Italy<br />
E-mail address: sassi@dti.unimi.it


