Reliance Industries - Motilal Oswal
Reliance Industries - Motilal Oswal
Reliance Industries - Motilal Oswal

You also want an ePaper? Increase the reach of your titles
YUMPU automatically turns print PDFs into web optimized ePapers that Google loves.
BSE Sensex<br />
S&P CNX<br />
18,745 5,689<br />
Bloomberg<br />
RIL IN<br />
Equity Shares (m) 3,228.0<br />
M. Cap. (INR b)/(USD b) 2,598/47.7<br />
52-Week Range (INR) 955/674<br />
1, 6, 12 Rel. Perf. (%) -1/-1/-2<br />
Financials & Valuation (INR b)<br />
Y/E March 2013E 2014E 2015E<br />
Sales 3,603 3,653 3,608<br />
EBITDA 308 302 323<br />
Adj. PAT 210 218 232<br />
Adj. EPS (INR) 71.9 74.2 78.7<br />
EPS Gr. (%) 4.8 3.9 6.3<br />
BV/Sh.(INR) 619 682 747<br />
RoE (%) 12.3 11.7 11.3<br />
RoCE (%) 11.7 11.3 11.2<br />
Payout (%) 16.1 16.4 16.2<br />
Valuations<br />
P/E (x) 12.4 11.9 11.2<br />
P/BV (x) 1.3 1.2 1.1<br />
EV/EBITDA (x) 8.6 8.7 8.1<br />
Div. Yield (%) 1.1 1.2 1.2<br />
17 April 2013<br />
4QFY13 Results Update | Sector: Oil & Gas<br />
<strong>Reliance</strong> <strong>Industries</strong><br />
CMP: INR805 TP: INR867 Neutral<br />
<strong>Reliance</strong> <strong>Industries</strong>' (RIL) EBIT for 4QFY13 was INR59.2b (+23% YoY, -5% QoQ),<br />
lower than our estimate of INR65.8b, primarily due to lower than expected<br />
petchem EBIT. However, PAT was in-line at INR55.9b (+32% YoY, +2% QoQ; our<br />
estimate was INR55b), led by lower depreciation at INR22.4b (v/s our estimate<br />
of INR23.4b) and higher other income at INR22.4b (v/s our estimate of INR18.8b).<br />
• Refining - GRM in-line; EBIT impacted by higher opex/lower throughput:<br />
GRM was USD10.1/bbl (+33% YoY, +5% QoQ; v/s estimate of USD10/bbl).<br />
Refining EBIT at INR35.2b (v/s estimate of INR37.7b) was impacted by 8%<br />
QoQ decline in throughput to 16.1mmt, led by CDU maintenance shutdown<br />
and higher opex.<br />
• Petchem - Below estimates led by lower volumes: Petchem EBIT was INR19b,<br />
down 13% YoY and 2% QoQ, despite higher QoQ individual product spreads.<br />
EBIT margin was 8.6% against 8.8% in 3QFY13. The management indicated<br />
that lower petchem EBIT is due to lower volumes. We believe it could also be<br />
due to adverse sales mix.<br />
• E&P - meaningful upside 3-4 years away: KG-D6 production averaged<br />
19.2mmscmd (v/s 24mmscmd in 3QFY13) and production is expected to<br />
stabilize post the workover well drilling / booster compressors, expected in<br />
early FY15. RIL, along with BP has proposed development of additional 4tcf of<br />
gas with an investment of USD5b. If government approvals are received on<br />
time, these new development projects (R-series, satellite fields, etc) will<br />
start production in 3-4 years. Further, NEC- 25 production start is now expected<br />
in mid-2019.<br />
Valuation and view: In FY14/FY15, we model (a) GRM at USD9/bbl, (b) KG-D6 gas<br />
price at USD4.2/7/mmbtu, and (c) KG-D6 gas volumes at 13/15mmscmd. While<br />
turnaround in the Retail business (EBITDA of INR780m in FY13 v/s loss of INR3.4b<br />
in FY12) is positive, any meaningful earnings addition is expected only in FY16/<br />
17, when its large projects (pet coke gasification/off-gas cracker) commission.<br />
Core business outlook (90% of earnings) remains subdued and we expect RoE to<br />
hover at ~12%. The stock trades at 11.2x FY15E adjusted EPS and at an EV of 8.1x<br />
FY15E EBITDA. Our SOTP-based target price is INR867. Maintain Neutral.<br />
Harshad Borawake (HarshadBorawake@<strong>Motilal</strong><strong>Oswal</strong>.com); +91 22 3982 5432<br />
Kunal Gupta (Kunal.Gupta@<strong>Motilal</strong><strong>Oswal</strong>.com); +91 22 3982 5445<br />
Investors are advised to refer through disclosures made at the end of the Research Report.
<strong>Reliance</strong> <strong>Industries</strong><br />
Segment-wise performance<br />
FY12 FY13 4QFY13 (%)<br />
1Q 2Q 3Q 4Q 1Q 2Q 3Q 4Q YoY QoQ<br />
Segmental Revenues (INR b)<br />
Petochem 184 211 198 214 218 221 221 222 3.5 0.5<br />
Refining 737 681 767 762 854 839 866 779 2.2 -10.1<br />
Oil & Gas 39 36 28 26 25 23 19 16 -38.8 -16.9<br />
Others 2 5 2 3 2 2 2 4 38.1 104.0<br />
Total 962 932 996 1,005 1,100 1,084 1,108 1,020 1.5 -7.9<br />
Segmental EBIT<br />
Petrochem 22 24 22 22 18 17 19 19 -12.8 -2.2<br />
Refining 32 31 17 17 22 35 36 35 107.5 -2.6<br />
Oil & Gas 15 15 13 10 10 9 6 5 -51.6 -22.0<br />
Others 0 0 0 0 0 0 1 0 585.7 -37.7<br />
Total 69 70 51 48 49 62 62 59 22.7 -4.8<br />
Segmental EBIT Margin (%)<br />
Petrochemicals 12 11 11 10 8 8 9 9 -15.8 -2.6<br />
Refining 4 5 2 2 3 4 4 5 103.1 8.3<br />
Oil & Gas 38 43 46 36 39 38 31 29 -21.0 -6.2<br />
Others 3 2 4 3 0 5 44 13 396.6 -69.4<br />
Total 7 8 5 5 4 6 6 6 20.9 3.5<br />
Operating Metrics<br />
Refining (USD/bbl)<br />
RIL GRM 10.3 10.1 6.8 7.6 7.6 9.5 9.6 10.1 32.9 5.2<br />
Singapore GRM 8.6 9.1 7.9 7.5 6.7 9.1 6.5 8.7 16.0 33.8<br />
Premium 1.7 1.0 -1.1 0.1 0.9 0.4 3.1 1.4 n.a. -54.8<br />
Refinery Thr’ put (mmt) 17.0 17.1 17.2 16.3 17.3 17.6 17.5 16.1 -1.2 -8.0<br />
Utilization (%) 109.7 110.3 111.0 105.2 111.6 113.5 112.9 103.9 -1.2 -8.0<br />
Petrochemicals<br />
Total producton (mmt) 5.5 5.7 5.5 5.5 5.6 5.5 5.5 5.4 -1.8 -1.8<br />
Polymer (‘000 MT) 1,091 1,134 1,146 1,084 1,101 1,101 1,098 1,100 1.5 0.2<br />
Polyester (‘000 MT) 411 414 415 422 415 420 365 430 1.9 17.8<br />
Polyester Interm. (‘000 MT) 1,212 1,188 1,200 1,200 1,203 1,197 1,200 1,170 -2.5 -2.5<br />
E&P<br />
Gross Oil Production (kbd)<br />
PMT 33.0 30.4 29.3 26.8 26.4 25.0 23.9 20.4 -23.8 -14.5<br />
Yemen 4.3 4.3 4.3 3.9 5.0 5.0 - - n.a. n.a.<br />
KG-D6 11.7 15.2 15.2 13.2 10.4 10.3 7.6 7.8 -41.0 2.2<br />
Total 49.0 49.9 48.9 43.9 41.8 40.3 31.5 28.2 -35.7 -10.5<br />
Gross Gas Production (mmscmd)<br />
PMT 11.8 11.5 10.9 10.8 9.9 9.3 8.9 7.6 -29.3 -14.7<br />
KG-D6 48.6 45.3 41.0 35.5 33.0 28.5 24.0 19.2 -45.9 -20.1<br />
Total 60.4 56.8 51.9 46.2 42.9 37.8 32.9 26.8 -42.0 -18.6<br />
Gross Oil +Gas (mmboe) 40.3 38.2 35.2 31.4 29.2 26.1 22.4 18.5 -41.2 -17.6<br />
Net Gas Production (mmscmd) 30.0 26.1 18.3 16.2 14.9 13.2 11.3 9.2 -43.3 -19.0<br />
RIL's share in KG-D6 at 60% from Sept-12 (earlier 90%)<br />
Source: Company, MOSL<br />
17 April 2013 2
<strong>Reliance</strong> <strong>Industries</strong><br />
Other highlights<br />
• D,D&A was down 9% QoQ to INR22b, driven by lower E&P depletion, led by lower<br />
production.<br />
• Other income was higher QoQ at INR22b due to higher cash balance and profit on<br />
sale of investments.<br />
• Net interest outgo was INR7b (v/s INR7.7b in 4QFY12, INR8.1b in 3QFY13) post<br />
interest capitalization of INR2.2b (v/s INR0.7b in 3QFY13).<br />
• Effective tax rate was 21.5% (v/s 22% in 4QFY12 and 19.7% in 3QFY13).<br />
• Gross debt stood at INR724b and cash/cash equivalents at INR830b, translating<br />
into net cash of INR105b (v/s net cash of INR87b in 3QFY13) on a standalone basis.<br />
However, on consolidated basis, the company has net debt of INR240b (gross<br />
debt: INR1,070b; cash: INR830b).<br />
Update on new projects<br />
• Polyester expansion: Capacity to start commissioning from FY14.<br />
• Petcoke gasification: Procurement of long lead items is ongoing; could be<br />
completed in 36 months. Management expects GRM addition of USD2.5/bbl.<br />
• Off-gas cracker: Technology suppliers, project management and EPC contractors<br />
finalized; likely to commission by 2016/17.<br />
Reconciling standalone and consolidated EBITDA (INR b)<br />
FY12 FY13 Abs. Chg. % Remarks<br />
RIL (Standalone EBITDA) 398.1 387.9 (10.3) Decline in E&P production and weakness<br />
in petchems, partially offset by higher GRM’s<br />
RHUSA (Shale Gas) 9.4 21.1 11.7 Average Production increased 93% YoY from 5.9 mmscmd in<br />
4QFY12 to 11.9 mmscmd in 4QFY13<br />
Recron Malaysia 1.5 (0.9) (2.4) Swing in profitability is surprising with reference to the<br />
headline polyester margins<br />
GAPCO 2.5 1.4 (1.1)<br />
<strong>Reliance</strong> Retail (3.4) 0.8 4.2 Crossed INR100b in sales, turned EBITDA<br />
positive for the first time<br />
Others (1.1) (1.1) 0.0<br />
Total 407.0 409.1 2.1<br />
* Includes interest income Source: Company, MOSL<br />
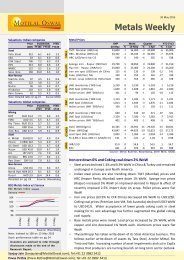
Profit on sale of investments boosts<br />
E&P EBIT share continues to decline (%) other income in 4QFY13 Net cash of INR105b on balance sheet<br />
Source: Company, MOSL<br />
17 April 2013 3
<strong>Reliance</strong> <strong>Industries</strong><br />
Refining: GRM at USD10.1/bbl; premium to Singapore at USD1.4/bbl;<br />
Throughput impacted by shutdown<br />
• Refinery EBIT contribution to overall EBIT increased to 59% in 4QFY13, led by higher<br />
GRM (v/s 35% in 4QFY12 and 58% in 3QFY13).<br />
• RIL's 4QFY13 GRM at USD10.1/bbl was marginally higher than our estimate of<br />
USD10/bbl and was up 33% YoY and 5% QoQ. RIL reported USD1.4/bbl premium to<br />
Singapore GRM (v/s premium of USD0.1/bbl in 4QFY12 and USD3.1/bbl in 3QFY13).<br />
The QoQ premium decline was partly led by higher LNG costs.<br />
• YoY increase in GRM was led by (1) higher auto fuel cracks, and (2) higher Arab<br />
light-heavy differential (USD4.5/bbl in 4QFY13 against USD4/bbl in 3QFY13).<br />
• Refinery utilization at 104% was significantly higher than global peers. Throughput<br />
was down QoQ at 16.1mmt (v/s our estimate of 16.5mmt) due to planned 3-week<br />
shutdown of 1 CDU during 4QFY13 in its SEZ refinery.<br />
• Apart from the CDU shutdown impact refining EBIT was impacted by higher opex<br />
at USD3.5/bbl in 4QFY13 v/s USD3.1/bbl in 3QFY13. RIL increased CDU capacity by<br />
~3% (~1.5mmt) through debottlenecking.<br />
• PDVSA, Venezuela will supply 300-400kbpd of crude to RIL's refinery (24-32% of<br />
capacity) as per the agreement.<br />
• Refining outlook: We expect GRMs to remain range-bound in the medium term<br />
due to (a) weak global oil demand (0.8mmbbl/d in 2013), and (b) additional refining<br />
capacity of >1mmbbl/d coming up with almost nil refinery closures in the last 8-9<br />
months. Resistance by European governments to shut down uneconomical<br />
refineries has contributed to the lower overall utilization, impacting margins.<br />
While the medium-term GRM outlook remains subdued, we expect GRMs to be<br />
volatile (occasional spurts) due to occasional bunching up of shutdowns. We model<br />
GRM of USD9/bbl in FY14/15 for RIL.<br />
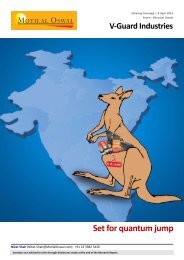
Refining EBIT lower QoQ 4QFY13 GRM at USD10.1/bbl; Refinery utilization lower due to CDU<br />
due to shutdown premium of USD1.4/bbl maintenance shutdown<br />
Source: Company, MOSL<br />
17 April 2013 4
<strong>Reliance</strong> <strong>Industries</strong><br />
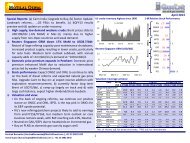
Meaningful jump in gasoline cracks Arab light-heavy spread up Auto-fuel cracks decline towards second<br />
on QoQ basis (USD/bbl) USD0.5/bbl QoQ (USD/bbl) half of March 2013 (USD/bbl)<br />
Source: Company, MOSL<br />
Petchem: EBIT below estimate despite higher headline spreads; expect<br />
margins to improve in medium term<br />
• RIL's 4QFY13 petchem EBIT margin was 8.6% (v/s 10.2%/8.8% in 4QFY12/3QFY13).<br />
• While overall domestic market demand was up, RIL's sales volumes were lower<br />
QoQ. On a YoY basis, domestic polymer demand was up 12% (13% in PP, 10% in<br />
HDPE/LLDPE, 19% in LDPE and 14% in PVC), while polyester demand was up 5%<br />
(4.4% in POY, 4.2% in PSF and 9.8% in PET).<br />
• Commissioning of new polyester capacities over the next 2-3 years will add to<br />
earnings. The off-gas cracker commissioning in 2016/17 will be a big earnings<br />
booster for the company.<br />
• Petchem outlook: We believe polymer margins have bottomed out but anticipate<br />
slow recovery. In the medium term, we expect margins to improve, as demand<br />
growth is likely to be higher than incremental capacity additions.<br />
Petchem EBIT margin down,<br />
Individual petchem spreads<br />
partly due to adverse sales mix improve QoQ (INR/kg) Petchem volumes decline QoQ (mmt)<br />
Source: Company, MOSL<br />
E&P: KG-D6 production at 19mmscmd in 4QFY13 v/s 24mmscmd in 3QFY13;<br />
Next production growth 3-4 years away; government approvals critical<br />
• RIL's 4QFY13 E&P EBIT contribution was the lowest in the last 15 quarters, led by<br />
lower KG-D6 volumes. EBIT was INR4.6b (v/s INR9.5b in 4QFY12 and INR5.9b in<br />
3QFY13). The significant QoQ decline was led by lower KG-D6 production and higher<br />
D,D&A charge. RIL's E&P EBIT is now down to pre-KG-D6 levels.<br />
17 April 2013 5
<strong>Reliance</strong> <strong>Industries</strong><br />
• KG-D6 gross volumes averaged 19mmsmcd in 4QFY13 (v/s 36mmscmd in 4QFY12<br />
and 24mmscmd in 3QFY13).<br />
• RIL is pursuing various plans with DGH to stem the current production decline as<br />
well as to start production from new fields.<br />
• Shale gas volumes encouraging: RIL's share of production stood at 31bcfe in 4QFY13<br />
(+12% QoQ and +99% YoY). Its revenue share (not accounted in standalone) was<br />
USD193m (v/s USD173m in 3QFY13) and EBITDA share was USD155m (v/s USD123m<br />
in 3QFY13) as against its cumulative investment of USD5.7b.<br />
Work program update<br />
• RIL, along with BP has proposed development of additional 4tcf of gas with an<br />
investment of USD5b. If government approvals are received on time, these new<br />
development projects (R-series, satellite fields, etc) will start production in 3-4<br />
years.<br />
• Clarity on gas price will also be critical for additional investment decisions.<br />
• Further, NEC-25 production start is now expected in mid-2019.<br />
• According to media articles, the MJ1 well in KG-D6 (drilling ongoing) has found<br />
hydrocarbons. The management is likely to issue an update on the same within a<br />
month.<br />
Update on RIL's key E&P blocks: DGH approval/gas pricing critical for future development<br />
Block<br />
Update / Planned Work Program<br />
KG-D6<br />
Base management of current Fields<br />
- D1/D3 RFDP submitted for workover wells; side track campaigns<br />
and MEG upgrade<br />
- D26 RFDP approved; to drill new well to maximize gas recovery<br />
- Compressor to maximize recovery from all the above<br />
(D1, D3, D26) fields<br />
New projects to exploit new reserves<br />
- Development plan submitted for R-Series<br />
- DoC review for D29, D30, D31 (Satellite) being pursued with MC<br />
Well MJ1 targeting upsides in existing production area underway<br />
NEC-25 (NEC-OSN-97/2) - Integrated block development plan for D-32, D-40, D-9 and D-10<br />
discoveries submitted to MC. Has proposed phased development<br />
- First gas by mid-2019 subject to timely approvals<br />
CY-D6 (CY-PR-DWN-2001/3) - Appraisal program for discovery D53 reviewed by MC.<br />
- 3D acquisition completed and appraisal well drilled;<br />
results under evaluation<br />
CY-D5 (CY-DWN-2001/2 ) - DoC for D35 (A1) discovery submitted in March 2010;<br />
await DGH approval.<br />
- Plan to drill additional exploratory location in FY14<br />
KG-V-D3 (KG-DWN-2003/1) - Revised DoC for D39 / D41 submitted in April 2012;<br />
await DGH approval.<br />
- Phase 1 valid up to Dec’14; new well locations are being identified<br />
CB-10 (CB-ONN-2003/1) - DoC for 8 discoveries submitted August 2011; await DGH approval<br />
CBM blocks<br />
Sonhat (North): Relinquished block due to poor prospectivity<br />
Sohagpur East & West: Expect first gas in FY15 subject to gas price<br />
approval; Extension for development phase granted<br />
up to Oct-Dec-14<br />
*MC: Management Committee<br />
Source: Company, MOSL<br />
17 April 2013 6
<strong>Reliance</strong> <strong>Industries</strong><br />
KG-D6 current and planned project schematic<br />
Source: Company<br />
Lower production led to lower E&P KG-D6 gross production averaged Net hydrocarbon production at<br />
EBIT margin (%) 19.2mmscmd in 4QFY13 9.2mmboe<br />
Shale gas capex at USD470m; RIL's production share More wells drilled with focus on<br />
USD5.7b till date (including carry) increased 12% QoQ liquid-rich area<br />
17 April 2013 7
<strong>Reliance</strong> <strong>Industries</strong><br />
Organized retail: Turns EBITDA positive; sales up 42% YoY to INR108b<br />
• RIL has invested ~INR100b till date in the Retail business. Of its total Retail sales,<br />
~65% is contributed by 13m loyalty customers.<br />
• Its FY13 revenue grew 42% to INR108b (v/s INR73.6b in FY12), driven by same store<br />
sales (SSS) growth of 7-18% across formats.<br />
• Retail EBITDA was positive in FY13 at INR780m v/s loss of INR3.4b in FY12.<br />
• RIL currently operates 1,466 stores (184 new stores in FY13) in 129 cities and has an<br />
area of 9msf.<br />
RIL's Retail business presence across India<br />
Strong sales growth traction across categories<br />
Source: Company<br />
17 April 2013 8
<strong>Reliance</strong> <strong>Industries</strong><br />
Standalone and Consolidated Profit & Loss<br />
Standalone<br />
Consolidated<br />
FY11 FY12 FY13 FY11 FY12 FY13<br />
P&L (INR b)<br />
Net Sales 2,482 3,299 3,603 2,658 3,585 3,971<br />
EBITDA 381 336 308 390 348 330<br />
Depreciation 136 114 95 141 124 112<br />
EBIT 245 222 213 248 224 218<br />
Interest Expenses 23 27 30 24 29 35<br />
Other Income 31 62 80 26 61 78<br />
Exceptional items - - - -9 -3 -<br />
PBT 252 258 263 241 253 262<br />
Tax 50 57 53 48 57 53<br />
PAT 203 200 210 193 196 208<br />
Share of profit from assoc. - - - -1 1 1<br />
Minority Interest - - - 0 0 0<br />
PAT after share of associates<br />
& minority interest 203 200 210 193 197 209<br />
Source: Company, MOSL<br />
Standalone and Consolidated Balance Sheet<br />
Standalone Consolidated<br />
FY11 FY12 FY13 FY11 FY12 FY13<br />
Balance Sheet (INR b)<br />
Share Capital 33 33 32 30 30 29<br />
Reserves and Surplus 1,483 1,628 1,768 1,511 1,665 1,791<br />
Minority Interest - - - 8 8 9<br />
Debt 634 586 545 800 826 893<br />
Deferred tax liability 116 121 122 111 116 116<br />
Total Liabilities 2,265 2,368 2,467 2,460 2,644 2,839<br />
Fixed Assets 1,549 1,215 1,289 1,863 1,642 1,834<br />
Investments 377 540 525 216 386 428<br />
Inventories 298 360 427 385 467 546<br />
Trade receivables 174 184 119 157 169 98<br />
Cash and bank balances 271 396 495 301 407 505<br />
Loans and advances 175 254 325 127 165 195<br />
Other Current Assets 2 2 5 26 36 18<br />
Curr. Assets, L & Adv. 921 1,197 1,371 996 1,244 1,361<br />
Trade payables 348 403 458 361 404 497<br />
Other current liabilities 187 137 216 205 176 237<br />
Provisions 46 43 43 50 48 51<br />
Non-Current Liabilities 582 583 718 616 627 784<br />
Total Assets 2,265 2,368 2,467 2,460 2,644 2,839<br />
Source: Company, MOSL<br />
17 April 2013 9
<strong>Reliance</strong> <strong>Industries</strong><br />
Valuation and view<br />
• In FY14/FY15, we model (a) GRM at USD9/bbl, (b) KG-D6 gas price at USD4.2/7/<br />
mmbtu, and (c) KG-D6 gas volumes at 13/15mmscmd.<br />
• While turnaround in the Retail business (EBITDA of INR780m in FY13 v/s loss of<br />
INR3.4b in FY12) is positive, any meaningful earnings addition is expected only in<br />
FY16/17, when its large projects (pet coke gasification/off-gas cracker) commission.<br />
Core business outlook (90% of earnings) remains subdued and we expect RoE to<br />
hover at ~12%.<br />
• The stock trades at 11.2x FY15E adjusted EPS and at an EV of 8.1x FY15E EBITDA. Our<br />
SOTP-based target price is INR867. Maintain Neutral.<br />
• Key things to watch: (1) DGH approvals for its E&P program, (2) Clarity on its E&P<br />
arbitration and 7-year income tax holiday for KG-D6 gas (we model tax holiday),<br />
(3) Margin trend in Refining and Petchem, (4) Developments on USD12b capex<br />
plan, and (5) Updates on its BWA and Retail forays.<br />
RIL: Key assumptions<br />
Key Metrics FY09 FY10 FY11 FY12 FY13E FY14E FY15E<br />
Exchange Rate (INR/USD) 45.8 47.5 45.6 47.9 54.5 54.0 53.0<br />
Refining<br />
Capacity (mmt) 33.0 62.0 62.0 62.0 62.0 62.0 62.0<br />
Production (mmt) 32.0 60.6 66.5 67.6 69.1 69.2 69.2<br />
Capacity Utilization (%) 97 98 107 109 111 112 112<br />
GRM (USD/bbl)<br />
Blended GRM 12.3 6.9 8.7 8.4 9.2 9.0 9.0<br />
Singapore GRM 5.8 3.6 5.2 8.3 7.9 7.5 7.5<br />
Premuim to Singapore 6.5 3.3 3.5 0.1 1.3 1.5 1.5<br />
E&P<br />
Gas Production (mmscmd) 39.8 56.2 42.6 26.5 13.0 15.0<br />
Oil Production (kbd) 10.7 18.9 13.8 8.8 6.5 6.0<br />
Pricing<br />
Brent Oil (USD/bbl) 84.8 69.7 86.5 114.5 110.6 110.0 110.0<br />
Wellhead Gas Price (USD/mmbtu) 4.2 4.2 4.2 4.2 4.2 7.0<br />
EPS 49.6 49.6 62.0 61.3 65.0 67.5 71.6<br />
EPS (ex Treasury) 55.0 54.8 68.4 67.7 71.9 74.6 79.1<br />
Source: Company, MOSL<br />
RIL: Segmental EBIT break-up<br />
FY09 FY10 FY11 FY12 FY13E FY14E FY15E<br />
Segmental EBIT (INR b)<br />
Refining 96 60 92 97 131 126 125<br />
Petrochemicals 69 86 93 90 70 86 101<br />
E&P 23 55 67 53 30 19 29<br />
Total 188 200 252 239 231 231 256<br />
Segmental EBIT share (%)<br />
Refining 51 30 36 40 57 55 49<br />
Petchem 37 43 37 38 30 37 40<br />
E&P 12 27 27 22 13 8 11<br />
Total 100 100 100 100 100 100 100<br />
Source: Company, MOSL<br />
17 April 2013 10
<strong>Reliance</strong> <strong>Industries</strong><br />
RIL: Sum-of-the-parts valuation<br />
Business USD b INR b Adj. INR/sh Remarks/Methodology<br />
Core business 32 1,746 598<br />
Refining 19 1,026 352 EV @6x FY15E EBITDA, implied USD1126/Nelson complexity bpd<br />
Petchem 13 720 246 Core business EV @6x FY15E EBITDA<br />
E&P Initiatives 9 502 172 Includes KG-D6, NEC-25, CBM, KG-III-6 and Yemen block<br />
KG - D6 Gas (KG Basin) 4 198 68 DCF; 60% stake; Plateau of 40mmscmd in FY18; 6tcf cumulative; 4tcf<br />
remaining<br />
KG - D6 MA1 Oil (KG Basin) 0 17 6 DCF; 60% stake; 43mmbbls recovery; (LT Brent - USD95/bbl)<br />
NEC - 25 (Mahanadi basin) 1 37 13 DCF; 60% stake; OGIP of 3tcf, prodn likely in 2019<br />
KG-DWN-2003/1 (D3) 1 28 9 Prospective resources of 695mmboe as per Hardy; RIL (60%)<br />
Sohagpur East & West (CBM) 1 46 16 DCF; 100% stake; OGIP of 3.65 TCF, assumed 50% recovery<br />
PMT 1 74 25 Currently producing; EV @3x FY15E EBITDA<br />
Investment in Shale Gas 2 104 35 JV with Atlas, Pioneer & Carrizo; valued at 2x equity investment<br />
Investments 3 162 55 Includes <strong>Reliance</strong> Retail, RGTIL, RIIL and SEZ<br />
Investments in RGTIL, RIIL 0 24 8 At book value<br />
Investments in BWA 1 48 16 BWA Foray<br />
Investment in SEZ 0 21 7 Valued at 0.5x equity investment<br />
<strong>Reliance</strong> Retail 1 69 23 100% subsidiary of RIL; 0.7x equity investment<br />
Less: Net Debt/ (Cash) -2 -125 -42<br />
Total Base Value 46 2,535 867 Based on fully diluted equity shares of 2,920m (excl 309m treasury shares)<br />
Source: MOSL<br />
17 April 2013 11
<strong>Reliance</strong> <strong>Industries</strong><br />
<strong>Reliance</strong> <strong>Industries</strong>: an investment profile<br />
Company description<br />
<strong>Reliance</strong> <strong>Industries</strong> (RIL), a Fortune 500 company, is<br />
India's largest private sector entity, with turnover of<br />
USD66.8b and net profit of USD3.9b. Over the years RIL<br />
has grown through backward integration in energy chain<br />
(textiles, petchem, refining and E&P) and is now moving<br />
into new areas like organized retail and BWA. It operates<br />
one of the largest refining capacity of 1.24mmbbl/d at a<br />
single location and is the largest producer of polyester<br />
fibre and yarn.<br />
Key investment arguments<br />
E&P upside now seem back-ended: Post the reserve<br />
downgrade by RIL and its JV partners, growth from E&P<br />
segment seems to be limited in medium term. Delays in<br />
approvals of development plans for satellite fields and<br />
NEC-25 is further adding to uncertainty. RIL is the largest<br />
exploration acreage holder in the private sector in India.<br />
Post its world-scale gas discovery in 2002 in KG-D6; it has<br />
reported more than 50 discoveries. Global major BP's<br />
stake purchase in RIL's NELP blocks is expected to help<br />
in tackling production issues in KG-D6. It should also help<br />
RIL to enhance chances of new discoveries and obtain<br />
higher recovery from its E&P acreage.<br />
new refinery start-ups impacting global utilization/<br />
margins will continue to weigh heavy on the RIL's<br />
refining margin performance. We expect marginal<br />
premium to benchmark Singapore refining margins to<br />
continue in near term.<br />
Petrochemicals - expect margins to improve: We believe<br />
polymer margins have bottomed out but anticipate slow<br />
recovery. In the medium term, we expect margins to<br />
improve, as demand growth is likely to be higher than<br />
incremental capacity additions.<br />
Key investment risks<br />
• Further delays in the KG-D6 gas volume ramp up.<br />
• Our estimates could be adversely affected by lower<br />
than expected refining and petchem margins.<br />
Recent developments<br />
• RIL has started drilling MJ1 well in KG-D6 block.<br />
Management will update on the results of drilling in<br />
a month's time.<br />
• RIL submitted FDP for R-series field in January 2013.<br />
• RIL has de-bottlenecked refining capacity at its SEZ<br />
refinery resulting in a ~3% increase in capacity.<br />
Refining - challenging times ahead: We expect the<br />
margins to remain range bound over due to uncertain<br />
global economic environment (particularly Europe), and<br />
Valuation and view<br />
The stock trades at 11.2x FY15E adjusted EPS and at an<br />
EV of 8.1x FY15E EBITDA. Our SOTP-based target price is<br />
INR867. Maintain Neutral.<br />
Target Price and Recommendation<br />
Current Target Upside Reco.<br />
Price (INR) Price (INR) (%)<br />
805 867 7.7 Neutral<br />
EPS: MOSL forecast v/s consensus (INR)<br />
MOSL Consensus Variation<br />
Forecast Forecast (%)<br />
FY14 67.1 69.8 -3.9<br />
FY15 71.2 74.6 -4.5<br />
Stock performance (1 year)<br />
Shareholding Pattern (%)<br />
Dec-12 Sep-12 Dec-11<br />
Promoter 45.4 45.3 44.8<br />
Domestic Inst 10.8 10.8 11.3<br />
Foreign 21.9 21.8 21.2<br />
Others 21.9 22.1 22.7<br />
17 April 2013 12
<strong>Reliance</strong> <strong>Industries</strong><br />
Financials and Valuation<br />
17 April 2013 13
Disclosures<br />
This report is for personal information of the authorized recipient and does not construe to be any investment, legal or taxation advice to you. This research report does not constitute an offer, invitation or inducement<br />
to invest in securities or other investments and <strong>Motilal</strong> <strong>Oswal</strong> Securities Limited (hereinafter referred as MOSt) is not soliciting any action based upon it. This report is not for public distribution and has been<br />
furnished to you solely for your information and should not be reproduced or redistributed to any other person in any form.<br />
Unauthorized disclosure, use, dissemination or copying (either whole or partial) of this information, is prohibited. The person accessing this information specifically agrees to exempt MOSt or any of its affiliates<br />
or employees from, any and all responsibility/liability arising from such misuse and agrees not to hold MOSt or any of its affiliates or employees responsible for any such misuse and further agrees to hold MOSt<br />
or any of its affiliates or employees free and harmless from all losses, costs, damages, expenses that may be suffered by the person accessing this information due to any errors and delays.<br />
The information contained herein is based on publicly available data or other sources believed to be reliable. While we would endeavour to update the information herein on reasonable basis, MOSt and/or its<br />
affiliates are under no obligation to update the information. Also there may be regulatory, compliance, or other reasons that may prevent MOSt and/or its affiliates from doing so. MOSt or any of its affiliates or<br />
employees shall not be in any way responsible and liable for any loss or damage that may arise to any person from any inadvertent error in the information contained in this report . MOSt or any of its affiliates<br />
or employees do not provide, at any time, any express or implied warranty of any kind, regarding any matter pertaining to this report, including without limitation the implied warranties of merchantability, fitness<br />
for a particular purpose, and non-infringement. The recipients of this report should rely on their own investigations.<br />
This report is intended for distribution to institutional investors. Recipients who are not institutional investors should seek advice of their independent financial advisor prior to taking any investment decision<br />
based on this report or for any necessary explanation of its contents.<br />
MOSt and/or its affiliates and/or employees may have interests/positions, financial or otherwise in the securities mentioned in this report. To enhance transparency, MOSt has incorporated a Disclosure of Interest<br />
Statement in this document. This should, however, not be treated as endorsement of the views expressed in the report.<br />
Disclosure of Interest Statement<br />
<strong>Reliance</strong> <strong>Industries</strong><br />
1. Analyst ownership of the stock No<br />
2. Group/Directors ownership of the stock No<br />
3. Broking relationship with company covered No<br />
4. Investment Banking relationship with company covered No<br />
Analyst Certification<br />
The views expressed in this research report accurately reflect the personal views of the analyst(s) about the subject securities or issues, and no part of the compensation of the research analyst(s) was, is, or<br />
will be directly or indirectly related to the specific recommendations and views expressed by research analyst(s) in this report. The research analysts, strategists, or research associates principally responsible<br />
for preparation of MOSt research receive compensation based upon various factors, including quality of research, investor client feedback, stock picking, competitive factors and firm revenues.<br />
Regional Disclosures (outside India)<br />
This report is not directed or intended for distribution to or use by any person or entity resident in a state, country or any jurisdiction, where such distribution, publication, availability or use would be contrary to<br />
law, regulation or which would subject MOSt & its group companies to registration or licensing requirements within such jurisdictions.<br />
For U.K.<br />
This report is intended for distribution only to persons having professional experience in matters relating to investments as described in Article 19 of the Financial Services and Markets Act 2000 (Financial<br />
Promotion) Order 2005 (referred to as "investment professionals"). This document must not be acted on or relied on by persons who are not investment professionals. Any investment or investment activity to<br />
which this document relates is only available to investment professionals and will be engaged in only with such persons.<br />
For U.S.<br />
<strong>Motilal</strong> <strong>Oswal</strong> Securities Limited (MOSL) is not a registered broker - dealer under the U.S. Securities Exchange Act of 1934, as amended (the"1934 act") and under applicable state laws in the United States.<br />
In addition MOSL is not a registered investment adviser under the U.S. Investment Advisers Act of 1940, as amended (the "Advisers Act" and together with the 1934 Act, the "Acts), and under applicable state<br />
laws in the United States. Accordingly, in the absence of specific exemption under the Acts, any brokerage and investment services provided by MOSL, including the products and services described herein<br />
are not available to or intended for U.S. persons.<br />
This report is intended for distribution only to "Major Institutional Investors" as defined by Rule 15a-6(b)(4) of the Exchange Act and interpretations thereof by SEC (henceforth referred to as "major institutional<br />
investors"). This document must not be acted on or relied on by persons who are not major institutional investors. Any investment or investment activity to which this document relates is only available to major<br />
institutional investors and will be engaged in only with major institutional investors. In reliance on the exemption from registration provided by Rule 15a-6 of the U.S. Securities Exchange Act of 1934, as amended<br />
(the "Exchange Act") and interpretations thereof by the U.S. Securities and Exchange Commission ("SEC") in order to conduct business with Institutional Investors based in the U.S., MOSL has entered into<br />
a chaperoning agreement with a U.S. registered broker-dealer, <strong>Motilal</strong> <strong>Oswal</strong> Securities International Private Limited. ("MOSIPL"). Any business interaction pursuant to this report will have to be executed within<br />
the provisions of this chaperoning agreement.<br />
The Research Analysts contributing to the report may not be registered /qualified as research analyst with FINRA. Such research analyst may not be associated persons of the U.S. registered broker-dealer,<br />
MOSIPL, and therefore, may not be subject to NASD rule 2711 and NYSE Rule 472 restrictions on communication with a subject company, public appearances and trading securities held by a research analyst<br />
account.<br />
For Singapore<br />
<strong>Motilal</strong> <strong>Oswal</strong> Capital Markets Singapore Pte Limited is acting as an exempt financial advisor under section 23(1)(f) of the Financial Advisers Act(FAA) read with regulation 17(1)(d) of the Financial Advisors<br />
Regulations and is a subsidiary of <strong>Motilal</strong> <strong>Oswal</strong> Securities Limited in India. This research is distributed in Singapore by <strong>Motilal</strong> <strong>Oswal</strong> Capital Markets Singapore Pte Limited and it is only directed in Singapore<br />
to accredited investors, as defined in the Financial Advisers Regulations and the Securities and Futures Act (Chapter 289), as amended from time to time.<br />
In respect of any matter arising from or in connection with the research you could contact the following representatives of <strong>Motilal</strong> <strong>Oswal</strong> Capital Markets Singapore Pte Limited:<br />
Nihar Oza<br />
Kadambari Balachandran<br />
Email: niharoza.sg@motilaloswal.com<br />
Email : kadambari.balachandran@motilaloswal.com<br />
Contact: (+65) 68189232 Contact: (+65) 68189233 / 65249115<br />
Office address: 21 (Suite 31), 16 Collyer Quay, Singapore 049318<br />
<strong>Motilal</strong> <strong>Oswal</strong> Securities Ltd<br />
<strong>Motilal</strong> <strong>Oswal</strong> Tower, Level 9, Sayani Road, Prabhadevi, Mumbai 400 025<br />
Phone: +91 22 3982 5500 E-mail: reports@motilaloswal.com

![Electronic Contract Note [ECN] â DECLARATION (VOLUNTARY) To ...](https://img.yumpu.com/48604692/1/158x260/electronic-contract-note-ecn-a-declaration-voluntary-to-.jpg?quality=85)