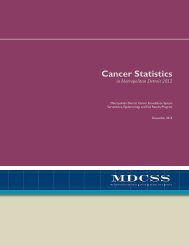
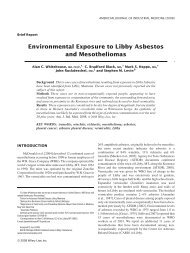
<strong>Cancer</strong> in the Arab and Chaldean American Population in the Metropolitan Detroit Area Julie J. Ruterbusch, MPH and Kendra Schwartz, MD, MSPH (Principal Investigator) 20 The Detroit metropolitan area is home to one of the largest populations of people of Arab and Chaldean descent in the United States. Although Arab Americans are one of the fastest growing immigrant groups in this country, they are currently not recognized as a minority group by the government. In fact, people of Arab ancestry are often listed as Caucasians in census data and medical research databases. Thus, the cancer disease burden in the Arab community is unknown. To help address this problem, we have systematically compiled a database of Arab and Chaldean surnames. 1 We began the process of collecting Arab/Chaldean surnames using the Michigan Department of Community Health’s birth and death records. These records list the country of origin and we flagged surnames from the following countries and territories: Algeria, Bahrain, Djibouti, Egypt, Ethiopia, the Gaza Strip, Iraq, Jordan, Kuwait, Labanon, Libya, Morocco, North Africa, Oman, Palestine, Qatar, Saudi Arabia, Somalia, Sudan, Syria, Tunisia, United Arab Emirates, Yemen, and the Western Sahara. By working with several Arab and Chaldean community organizations, such as the Arab Community Center for Economic and Social Services, the Arab American and Chaldean Council, and the National Arab American Medical Association, we were able to obtain surnames (with no other identifiers) from their member lists. We also abstracted metropolitan Detroit telephone directories for both first and surnames. Our surname list has gone through rigorous reviews for accuracy and quality control measures indicate a 89.5% sensitivity at identifying Arab ancestry in the general public and a 100% negative predictive value when used to identify non-Arab names in the SEER registry. This surname database has been linked to the SEER population cancer registry to identify individuals who are likely of Arab descent. In 2004, there were 475 people with an Arab or Chaldean surname diagnosed with an invasive cancer in the Detroit metropolitan area. Using the entire cancer database from 1973-2004, we compared the ratio of specific cancer sites to all cancer sites between Arab/ Chaldean Americans and Caucasians. As a population group, Arab/ Chaldean Americans have a higher proportion of leukemia, multiple myeloma, gallbladder, liver, kidney, bladder, thyroid, and stomach cancer. They also have a lower proportion of melanoma, other cancers of the skin, esophagus, and oral cavity. In the table, these values are presented as proportional incidence ratios. A value over 1 indicates a greater proportion of that specific cancer among Arab/ Chaldean Americans, after adjusting for age. On the third Friday of every month, we meet in the morning to present and discuss current research issues related to the cancer burden in Arab Americans. All those interested in working in this area are invited to attend these meetings. For further information please contact Julie Ruterbusch (ruterbus@med.wayne.edu). Table 1 - <strong>Cancer</strong> cases identified by the Arab/Chaldean surname database from MDCSS for 1973-2004 Male Female <strong>Cancer</strong> site Obs PIR CI Obs PIR CI Bones & Joints 21 1.13 0.70 - 1.73 18 1.33 0.79 - 2.11 Brain 114 1.12 0.93 - 1.35 85 1.10 0.88 - 1.36 Breast 18 1.65 0.98 - 2.61 1499 1.04 0.99 - 1.09 Cervix Uteri - - - 131 0.85 0.71 - 1.01 Colorectal 618 1.01 0.93 - 1.09 476 0.90 0.82 - 0.99 Corpus Uteri - - - 319 0.98 0.88 - 1.10 Esophagus 45 0.66 0.48 - 0.88 18 0.84 0.50 - 1.33 Gallbladder 13 1.46 0.78 - 2.50 31 1.53 1.04 - 2.17 Hodgkin’s 77 1.17 0.92 - 1.46 69 1.24 0.96 - 1.57 Lymphoma Kidney 202 1.33 1.15 - 1.53 91 1.01 0.81 - 1.24 Larynx 96 0.93 0.75 - 1.14 21 0.96 0.59 - 1.46 Leukemia 214 1.16 1.01 - 1.33 144 1.08 0.91 - 1.27 Liver 67 1.66 1.29 - 2.11 27 1.39 0.91 - 2.02 Lung & Bronchus 904 0.96 0.90 - 1.03 493 0.93 0.85 - 1.01 Multiple Myeloma 75 1.42 1.12 - 1.78 46 1.04 0.76 - 1.38 Non-Hodgkin’s 197 1.02 0.89 - 1.18 177 1.10 0.94 - 1.27 Lymphoma Oral Cavity 146 0.74 0.62 - 0.87 82 0.94 0.75 - 1.17 Ovary - - - 200 1.04 0.90 - 1.19 Pancreas 137 1.14 0.96 - 1.35 99 0.94 0.77 - 1.15 Prostate 1338 1.03 0.97 - 1.08 - - - Skin 72 0.48 0.38 - 0.60 67 0.63 0.49 - 0.80 Skin – Melanoma 90 0.53 0.43 - 0.66 99 0.68 0.55 - 0.83 Stomach 137 1.11 0.93 - 1.32 88 1.30 1.04 - 1.60 Thyroid 46 1.06 0.77 - 1.41 171 1.35 1.16 - 1.57 Ureter 16 1.71 0.98 - 2.78 9 2.07 0.95 - 3.93 Urinary Bladder 309 1.15 1.03 - 1.29 81 0.98 0.78 - 1.21 Obs - Observed number of cases PIR - Proportional incidence ratio (O/E) CI - Confidence Interval Significantly lower proportion Significantly higher proportion Reference: 1. Schwartz KL, Kulwicki A, Weiss LK, Fakhouri H, Sakr W, Kau G, et al. <strong>Cancer</strong> among Arab Americans in the metropolitan Detroit area. Ethn Dis 2004;14(1):141-6.
Arab American <strong>Cancer</strong> Cases, 1973-2004 Tri-County Area Estimated Numbers of Arab American <strong>Cancer</strong> Cases, 1973-2004 Tri-County Area Oakland Macomb 21 Wayne Legend County City Census Tract Total Cases 120 to 160 80 to 119 40 to 79 1 to 39 0 Source: MDCSS © WSU/Department of Family Medicine & Public Health Sciences July, 2007/jcb © WSU/Department of Family Medicine & Public Health Sciences July, 2007/jcb