- Page 3 and 4:
Table of Contents Acronyms ........
- Page 5 and 6:
Acronyms ADEQ - Arizona Department
- Page 7 and 8:
Section 1 - Introduction This Storm
- Page 9 and 10:
conducting activities with the pote
- Page 11 and 12:
Section 2 - Pollution Prevention Te
- Page 13 and 14:
Section 3 - Site Description This s
- Page 15 and 16:
Figure 3 depicts the storm drain sy
- Page 17 and 18:
Section 4 - Summary of Potential Po
- Page 19 and 20:
permission from COPAD to conduct th
- Page 21 and 22:
of stormwater pollution for the sto
- Page 23 and 24:
Activities Pollutants AVE Maintenan
- Page 25 and 26:
8. Uncontaminated groundwater or sp
- Page 27 and 28:
Section 5 - Description of Control
- Page 29 and 30:
A current listing of construction p
- Page 31 and 32:
Section 6 - Schedules and Procedure
- Page 33 and 34:
The annual training consists of a M
- Page 35 and 36:
more than 14 days is required to ad
- Page 37 and 38:
In some instances, follow up inspec
- Page 39 and 40:
Section 7 - Reporting and Recordkee
- Page 41 and 42:
Section 8 - Signature Requirements
- Page 43 and 44:
Section 9 - SWPPP Modifications As
- Page 45 and 46:
Section 10 - SWPPP Availability As
- Page 47:
Tables
- Page 50 and 51:
Table 2.1 Pollution Prevention Team
- Page 52 and 53:
Table 2.1 Pollution Prevention Team
- Page 54 and 55:
Table 2.1 Pollution Prevention Team
- Page 57 and 58:
Table 4.1 Tenant's Industrial Activ
- Page 59 and 60:
Table 4.1 Tenant's Industrial Activ
- Page 61 and 62:
Table 4.1 Tenant's Industrial Activ
- Page 63:
Figures Figures are not included wi
- Page 68 and 69:
AZPDES MULTI-SECTOR GENERAL PERMIT
- Page 70 and 71:
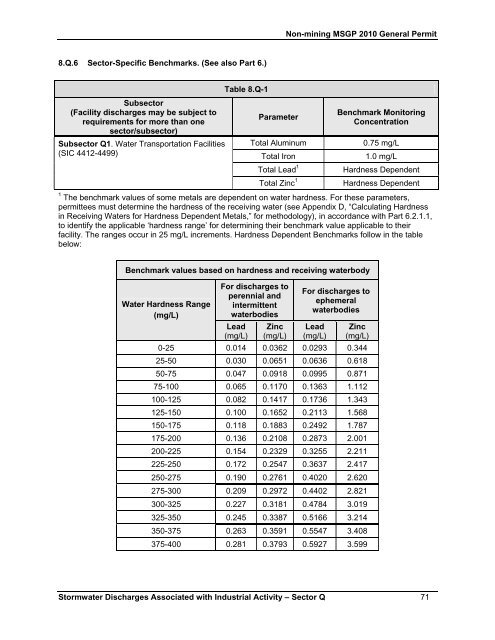
Non-mining MSGP 2010 General Permit
- Page 72 and 73:
Non-mining MSGP 2010 General Permit
- Page 74 and 75:
Non-mining MSGP 2010 General Permit
- Page 76 and 77:
Non-mining MSGP 2010 General Permit
- Page 78 and 79:
Non-mining MSGP 2010 General Permit
- Page 80 and 81:
Non-mining MSGP 2010 General Permit
- Page 82 and 83:
Non-mining MSGP 2010 General Permit
- Page 84 and 85:
Non-mining MSGP 2010 General Permit
- Page 86 and 87:
Non-mining MSGP 2010 General Permit
- Page 88 and 89:
Non-mining MSGP 2010 General Permit
- Page 90 and 91: Non-mining MSGP 2010 General Permit
- Page 92 and 93: Non-mining MSGP 2010 General Permit
- Page 94 and 95: Non-mining MSGP 2010 General Permit
- Page 96 and 97: Non-mining MSGP 2010 General Permit
- Page 98 and 99: Non-mining MSGP 2010 General Permit
- Page 100 and 101: Non-mining MSGP 2010 General Permit
- Page 102 and 103: Non-mining MSGP 2010 General Permit
- Page 104 and 105: Non-mining MSGP 2010 General Permit
- Page 106 and 107: Non-mining MSGP 2010 General Permit
- Page 108 and 109: Non-mining MSGP 2010 General Permit
- Page 110 and 111: Non-mining MSGP 2010 General Permit
- Page 112 and 113: Non-mining MSGP 2010 General Permit
- Page 114 and 115: Non-mining MSGP 2010 General Permit
- Page 116 and 117: Non-mining MSGP 2010 General Permit
- Page 118 and 119: Non-mining MSGP 2010 General Permit
- Page 120 and 121: Non-mining MSGP 2010 General Permit
- Page 122 and 123: Part 8 - Sector-Specific Requiremen
- Page 124 and 125: Non-mining MSGP 2010 General Permit
- Page 126 and 127: Part 8 - Sector-Specific Requiremen
- Page 128 and 129: Part 8 - Sector-Specific Requiremen
- Page 130 and 131: Non-mining MSGP 2010 General Permit
- Page 132 and 133: Non-mining MSGP 2010 General Permit
- Page 134 and 135: Non-mining MSGP 2010 General Permit
- Page 136 and 137: Non-mining MSGP 2010 General Permit
- Page 138 and 139: Non-mining MSGP 2010 General Permit
- Page 142 and 143: Non-mining MSGP 2010 General Permit
- Page 144 and 145: Non-mining MSGP 2010 General Permit
- Page 146 and 147: Non-mining MSGP 2010 General Permit
- Page 148 and 149: Non-mining MSGP 2010 General Permit
- Page 150 and 151: Non-mining MSGP 2010 General Permit
- Page 152 and 153: Non-mining MSGP 2010 General Permit
- Page 154 and 155: Non-mining MSGP 2010 General Permit
- Page 156 and 157: Non-mining MSGP 2010 General Permit
- Page 158 and 159: Non-mining MSGP 2010 General Permit
- Page 160 and 161: Non-mining MSGP 2010 General Permit
- Page 162 and 163: Non-mining MSGP 2010 General Permit
- Page 164 and 165: Non-mining MSGP 2010 General Permit
- Page 166 and 167: Non-Mining MSGP 2010 General Permit
- Page 168 and 169: Non-Mining MSGP 2010 General Permit
- Page 170 and 171: Non-Mining MSGP 2010 General Permit
- Page 172 and 173: Non-Mining MSGP 2010 General Permit
- Page 174 and 175: Non-Mining MSGP 2010 General Permit
- Page 176 and 177: Non-Mining MSGP 2010 General Permit
- Page 178 and 179: Non-Mining MSGP 2010 General Permit
- Page 180 and 181: Non-Mining MSGP 2010 General Permit
- Page 182 and 183: Non-Mining MSGP 2010 General Permit
- Page 184 and 185: Non-Mining MSGP 2010 General Permit
- Page 186 and 187: Non-Mining MSGP 2010 General Permit
- Page 188 and 189: Non-Mining MSGP 2010 General Permit
- Page 191 and 192:
AZMSG2010-002 ● AZMSG2010-003 NOT
- Page 193:
NOI for Coverage under AZPDES Permi
- Page 196 and 197:
term (with approximate dates) in wh
- Page 199 and 200:
Targeted Activities: • General Fa
- Page 201:
CM 2.0 Aircraft, Vehicle and Equipm
- Page 205:
CM 4.0 Aircraft, Vehicle and Equipm
- Page 208 and 209:
CM 5.0 Material Storage Areas Spill
- Page 211:
Targeted Activities: • Building a
- Page 214 and 215:
CM 8.0 Waste Handling and Disposal
- Page 216 and 217:
CM 9.0 Oil Water Separators and Lav
- Page 219:
CM 11.0 Aircraft Deicing Targeted A
- Page 223 and 224:
nVT PHOENIX DEER VALLEY AIRPORT PBX
- Page 225 and 226:
nVT PHOENIX DEER VALLEY AIRPORT PBX
- Page 227 and 228:
IIVY PHOENIX DEER VALLEY AIRPORT PB
- Page 229:
DVT PHOENIX DEER VALLEY AIRPORT PNX
- Page 233 and 234:
Spill Report Year: 2011 Airport: Ph
- Page 235 and 236:
Spill Report Year: 2012 Airport: Ph
- Page 237 and 238:
Spill Report Year: 2012 Airport: Ph
- Page 239 and 240:
Spill Report Year: 2012 Airport: Ph
- Page 241 and 242:
Spill Report Year: 2013 Airport: Ph
- Page 243 and 244:
Spill Report Year: 2013 Airport: Ph
- Page 245 and 246:
Spill Report Year: 2013 Airport: Ph
- Page 247 and 248:
Spill Report Year: 2013 Airport: Ph
- Page 249 and 250:
Spill Report Year: 2013 Airport: Ph
- Page 251 and 252:
Spill Report Year: 2013 Airport: Ph
- Page 253:
Attachment 6.0 - Spill Response Pla
- Page 257:
Attachment 7.0 - Annual Training At
- Page 301 and 302:
CITY OF PHOENIX AVIATION DEPARTMENT
- Page 303 and 304:
CM - MATERIAL STORAGE AREAS ( 5) Ac
- Page 305:
INSPECTION SUMMARY Compliance Items
- Page 308 and 309:
Activity Specific CMs CM - AVE MAIN
- Page 310 and 311:
Activity Specific CMs CM - WASTE HA
- Page 313 and 314:
CITY OF PHOENIX AVIATION DEPARTMENT
- Page 315 and 316:
Activity Specific CMs CM - FUEL SYS
- Page 317 and 318:
CITY OF PHOENIX AVIATION DEPARTMENT
- Page 319 and 320:
Activity Specific CMs CM - WASTE HA
- Page 321 and 322:
CITY OF PHOENIX AVIATION DEPARTMENT
- Page 323:
INSPECTION SUMMARY Compliance Items
- Page 327:
SKY HARBOR (PHX) Visual Inspection
- Page 330 and 331:
Page 2 of 3 Discharges Associated w
- Page 333:
Attachment 10.0 - Comprehensive Fac
- Page 336 and 337:
CM - DOCUMENTATION (1, 2, 3,4, 5, 6
- Page 338 and 339:
Activity Specific CMs CM - AVE STOR
- Page 340 and 341:
Activity Specific CMs CM - OWS (9)
- Page 343 and 344:
CITY OF PHOENIX AVIATION DEPARTMENT
- Page 345 and 346:
CM - GENERAL (1) Activity Specific
- Page 347 and 348:
Activity Specific CMs CM - FUEL SYS
- Page 349 and 350:
CITY OF PHOENIX AVIATION DEPARTMENT
- Page 351 and 352:
CM - GENERAL (1) Activity Specific
- Page 353 and 354:
Activity Specific CMs CM - FUEL SYS
- Page 355 and 356:
CITY OF PHOENIX AVIATION DEPARTMENT
- Page 357 and 358:
Activity Specific CMs CM - AVE STOR
- Page 359:
INSPECTION SUMMARY Activity Specifi
- Page 362 and 363:
CM - DOCUMENTATION (1, 2, 3, 4, 5,
- Page 364 and 365:
INSPECTION SUMMARY Activity Specifi
- Page 367:
NOTICE OF STORM WATER VIOLATION INS
- Page 370 and 371:
CITY OF PHOENIX AVIATION DEPARTMENT
- Page 372 and 373:
Revised 4/22/99 C:\Documents and Se
- Page 374 and 375:
4) The effect of the enforcement ac
- Page 376 and 377:
If a NPDES Co-permittee fails to co
- Page 378 and 379:
EXHIBIT “A” STORM WATER CIVIL P
- Page 380 and 381:
AIRFIELD DRIVER PERMIT NUMBER DATE
- Page 382 and 383:
AVIATION DEPARTMENT STORM WATER IMP
- Page 384 and 385:
3.3 Pre-Meeting. Aviation Departmen
- Page 386 and 387:
To: [David Cavazos] Deputy Aviation
- Page 388 and 389:
During the meeting, you will be giv
- Page 390 and 391:
During the time period of through ,
- Page 392 and 393:
It is hereby requested that [Compan
- Page 394 and 395:
) If this incident results in a cha
- Page 397:
Corrective Action Report As require
- Page 401 and 402:
Final Letter Report Salt River Road
- Page 403 and 404:
City of Phoenix January 28, 2013 Pa
- Page 405 and 406:
City of Phoenix January 28, 2013 Pa
- Page 407:
ATTACHMENT A FIGURE
- Page 412 and 413:
Analytical Report 449518 for Four C
- Page 414 and 415:
CASE NARRATIVE Client Name: Four Co
- Page 416 and 417:
Sample Cross Reference 449518 Four
- Page 418 and 419:
Certificate of Analytical Results 4
- Page 420 and 421:
Certificate of Analytical Results 4
- Page 422 and 423:
Certificate of Analytical Results 4
- Page 424 and 425:
Certificate of Analytical Results 4
- Page 426 and 427:
Certificate of Analytical Results 4
- Page 428 and 429:
Certificate of Analytical Results 4
- Page 430 and 431:
Certificate of Analytical Results 4
- Page 432 and 433:
Certificate of Analytical Results 4
- Page 434 and 435:
Certificate of Analytical Results 4
- Page 436 and 437:
QC Summary 449518 Four Corners Envi
- Page 438 and 439:
QC Summary 449518 Four Corners Envi
- Page 440 and 441:
QC Summary 449518 Four Corners Envi
- Page 442 and 443:
QC Summary 449518 Four Corners Envi
- Page 444 and 445:
QC Summary 449518 Four Corners Envi
- Page 446 and 447:
Page 35 of 36 Final 1.001
- Page 448 and 449:
Analytical Report 449519 for Four C
- Page 450 and 451:
CASE NARRATIVE Client Name: Four Co
- Page 452 and 453:
Sample Cross Reference 449519 Four
- Page 454 and 455:
Certificate of Analytical Results 4
- Page 456 and 457:
Certificate of Analytical Results 4
- Page 458 and 459:
Certificate of Analytical Results 4
- Page 460 and 461:
Certificate of Analytical Results 4
- Page 462 and 463:
QC Summary 449519 Four Corners Envi
- Page 464 and 465:
QC Summary 449519 Four Corners Envi
- Page 466 and 467:
QC Summary 449519 Four Corners Envi
- Page 468 and 469:
QC Summary 449519 Four Corners Envi
- Page 470 and 471:
Page 23 of 24 Final 1.001
- Page 473 and 474:
Analytical Report 449521 for Four C
- Page 475 and 476:
CASE NARRATIVE Client Name: Four Co
- Page 477 and 478:
Sample Cross Reference 449521 Four
- Page 479 and 480:
Certificate of Analytical Results 4
- Page 481 and 482:
Certificate of Analytical Results 4
- Page 483 and 484:
QC Summary 449521 Four Corners Envi
- Page 485 and 486:
QC Summary 449521 Four Corners Envi
- Page 487 and 488:
QC Summary 449521 Four Corners Envi
- Page 489 and 490:
Page 17 of 18 Final 1.001
- Page 491:
ATTACHMENT C TABLES
- Page 495:
Table 2 Total Petroleum Hydrocarbon
- Page 499:
Table 4 Total Metals Analytical Dat
- Page 503 and 504:
LAVATORY WASTE RELEASE RESPONSE REP
- Page 505 and 506:
COPAD - Sky Harbor Airport Lavatory
- Page 507 and 508:
COPAD - Sky Harbor Airport Lavatory
- Page 509 and 510:
COPAD - Sky Harbor Airport Lavatory
- Page 511 and 512:
COPAD - Sky Harbor Airport Lavatory
- Page 513 and 514:
COPAD - Sky Harbor Airport Lavatory
- Page 515 and 516:
Corrective Action Report As require
- Page 517 and 518:
SWPPP - Photo Log Corrective Action
- Page 519:
SWPPP - Photo Log Corrective Action
- Page 522 and 523:
Analytical Report 466648 for Four C
- Page 524 and 525:
CASE NARRATIVE Client Name: Four Co
- Page 526 and 527:
Sample Cross Reference 466648 Four
- Page 528 and 529:
Certificate of Analytical Results 4
- Page 530 and 531:
Certificate of Analytical Results 4
- Page 532 and 533:
Certificate of Analytical Results 4
- Page 534 and 535:
QC Summary 466648 Four Corners Envi
- Page 536 and 537:
QC Summary 466648 Four Corners Envi
- Page 538 and 539:
QC Summary 466648 Four Corners Envi
- Page 540 and 541:
Page 19 of 19 Final 1.000
- Page 542 and 543:
23-JUL-13 Project Manager: Greg Doz
- Page 544 and 545:
Flagging Criteria Arizona Flags All
- Page 546 and 547:
Certificate of Analytical Results 4
- Page 548 and 549:
Certificate of Analytical Results 4
- Page 550 and 551:
Certificate of Analytical Results 4
- Page 552 and 553:
QC Summary 466647 Four Corners Envi
- Page 554 and 555:
QC Summary 466647 Four Corners Envi
- Page 556 and 557:
QC Summary 466647 Four Corners Envi
- Page 558 and 559:
Page 18 of 19 Final 1.001
- Page 561 and 562:
Corrective Action Report As require
- Page 563 and 564:
3 Description: Salt River at Outfal
- Page 565 and 566:
7 Description: Storm drain inlet at
- Page 567:
11 Description: Area south of wash
- Page 633:
Attachment 14.0 - Signatory Authori
- Page 641:
Attachment 15.0 - SWPPP Modificatio