XRD Line Profile Analysis COMMISSION ON POWDER DIFFRACTION
XRD Line Profile Analysis COMMISSION ON POWDER DIFFRACTION
XRD Line Profile Analysis COMMISSION ON POWDER DIFFRACTION

You also want an ePaper? Increase the reach of your titles
YUMPU automatically turns print PDFs into web optimized ePapers that Google loves.
CPD Chairman’s message, Robert Dinnebier 2<br />
Editor’s message , Paolo Scardi 3<br />
XIX Conference on Applied Crystallography,<br />
Krakow (Poland), 1-4.09.03 4<br />
SSPD’03, Stara Lesna (Slovakia), 14-19.09.03 5<br />
WWW sites related to Powder Diffraction 7<br />
IUCr Commission on Powder Diffraction 7<br />
Powder Diffraction <strong>Line</strong> <strong>Profile</strong> <strong>Analysis</strong>:<br />
Whole Powder Pattern Modelling for the study of Anti -<br />
Phase Domains<br />
P. Scardi & M. Leoni 8<br />
Bayesian/Maximum entropy analysis of nanocrystallite -<br />
broadened line profiles<br />
N. Armstrong, W. Kalceff, J. P. Cline<br />
& J.Bonevich 10<br />
Report on the Size-Strain Round Robin<br />
D. Balzar & N. C. Popa 14<br />
Dislocation density tensor for diffraction line analysis<br />
H. Bougrab, K. Inal, M. Berveiller 16<br />
The Correlation between <strong>Line</strong> Broadening and the Elastic<br />
Properties of Crystals<br />
T. Ungár & G. Tichy 19<br />
Surface relaxation in nano-sized powders<br />
M. Leoni & P. Scardi 21<br />
ISSN 1591-9552<br />
<strong>COMMISSI<strong>ON</strong></strong> <strong>ON</strong> <strong>POWDER</strong> DIFFRACTI<strong>ON</strong><br />
INTERNATI<strong>ON</strong>AL UNI<strong>ON</strong> OF CRYSTALLOGRAPHY<br />
http://www.iucr.org/iucr-top/comm/cpd/<br />
NEWSLETTER No. 28, December 2002<br />
http://www.iucr.org/iucr-top/comm/cpd/Newsletters/<br />
IN THIS ISSUE<br />
<strong>XRD</strong> <strong>Line</strong> <strong>Profile</strong> <strong>Analysis</strong><br />
(Paolo Scardi, Editor)<br />
Powder diffraction pattern of stacking faulted crystal<br />
E. Estevez-Rams, B. Aragon-Fernandez, H. Fuess 23<br />
News from the ICDD 26<br />
ECM-21, Durban (South Africa), 24 -29.08.03 28<br />
Computer Corner, L M D Cranswick 31<br />
Meeting and Schools 36<br />
What’s On 37<br />
Contact names for advertisers 38<br />
How to receive the CPD Newsletter 38<br />
Calls for contributions to CPD Newsletter 29 38
2<br />
CPD Chairman’s Message<br />
As the new chairman of the commission on powder diffraction, it is my pleasure to express my deepest thanks to the previous<br />
chairman, Paolo Scardi who has put in a tremendous amount of highly successful work in the commission, and in particular<br />
regarding the improvement of our newsletter which has considerably increased in size, quality and the number of subscribers.<br />
Support was given to a variety of conferences, schools and workshops and several projects such as the development of Rietveld<br />
guidelines, the QPA -, and the size-strain round robin were accomplished. For the next three years, Paolo will act as a consultant<br />
to the CPD and his shared knowledge and experience will be of great help for the entire commission. I will try my best<br />
to continue the work in the tradition of the previous chairman.<br />
I would like to cordially welcome our new members, Miguel Delgado, Camden Hubbard, Ian Madsen and Norberto Masciocchi.<br />
Following our tradition, they all will be guest editors of upcoming CPD newsletters. In turn, several members have left the<br />
CPD and I am grateful to Sen Gupta, Robert Von Dreele, Helmar Fjellvåg for their valuable contributions during the past triennium.<br />
The newsletter has now reached a size, which creates some logistical and financial problems. In an attempt to keep production<br />
costs as low as possible, this will be the first newsletter which is printed and distributed from Venezuela. Special thanks to<br />
Miguel Delgado who voluntarily offered his help in this matter. Paolo has almost finished his task to transfer all CPD Newsletters<br />
from paper to electronic format, which will be made available online and distributed on CD-ROMs soon.<br />
New round robins and the development of new powder diffraction standards are necessary for the benefit of the entire community.<br />
In addition to the ongoing round robins, one of the tasks in progress is the development of an organic standard for Rietveld<br />
refinement.<br />
In general, I am pleased to see that powder diffraction is becoming more and more popular. This accelerated activity is visible<br />
in a number of ways. One certainly is the increasing demand for synchrotron beamtime for powder diffraction. A quick check<br />
on the NSLS website reveals that there are currently 11 Beamlines mainly or partly dedicated to powder diffraction and there<br />
will soon be a consortium of powder beamlines for the benefit of the user. A large upgrade at the ESRF took place last year<br />
with the movement of Andy Fitch’s high resolution powder beamline from a bending magnet (BM16) to the much more powerful<br />
insertion device ID31 with state of the art equipment, and at the APS, at least 5 beamlines are mentioned at which powder<br />
diffraction experiments are possible. In particular, the use of high energy beamlines for powder diffraction is becoming more<br />
and more popular due to the many advantages for experiments in transmission geometry.<br />
For this year, we are looking forward to the ECM21 which will, for the first time, take place in South Africa. There will be at<br />
least 6 microsymposia containing the word “powder diffraction” in the title, again reflecting the large public interest in this<br />
field.<br />
Recent important developments in powder diffraction deal with microstructural effects, nano -materials, maximum entropy, and<br />
the use of the pair distribution function, just to name a few. Some of these “hot” topics are addressed in the current newsletter,<br />
edited by Paolo Scardi.<br />
I am looking forward to an exciting time in an active commission.<br />
CPD projects<br />
Robert Dinnebier<br />
QUANTITATIVE PHASE ANALYSIS ROUND ROBIN<br />
The first part of the study is reported in a publication by I.C. Madsen et al. (J. Appl. Cryst. 34 (2001) 409-426), distributed as a<br />
free offprint together with the CPD Newsletter No 25. The second part was published afterwards by N.V.Y. Scarlett et al. (J.<br />
Appl. Cryst. 35 (2002) 383-400). The reprint was distributed with the previous Newsletter (No 27). Readers can refer to these<br />
papers for an exhaustive discussion on the outcomes of the QPA Round Robin .<br />
First and second (enclosed) parts can be freely downloaded from the CPD web-site (http://www.iucr.org/iucr-top/comm/cpd/),<br />
where additional information and original data files can be found. We wish to thank again the IUCr Editorial Office for giving<br />
us permission to include the reprint from the Journal of Applied Crystallography (JAC) in the Newsletter and for allowing free<br />
downloading of offprints from the Web.<br />
SIZE-S TRAIN ROUND ROBIN<br />
The preliminary report and analysis of results are still available at http://www.boulder.nist.gov/div853/balzar, CPD and CCP14<br />
Web-sites. A paper has been recently submitted for publication on the Journal of Applied Crystallography . The present issue<br />
includes a summary of this work, presented by D. Balzar and N.C. Popa.
From the Editor of Newsletter 28<br />
Since the introduction of the Scherrer formula in 1918, the study of diffraction line profiles (frequently referred to as <strong>Line</strong><br />
<strong>Profile</strong> <strong>Analysis</strong>) has become an important research field in Powder Diffraction. After the fundamental contributions of Wilson<br />
and Warren in the ‘40s and ‘50s, important developments have been produced in the ’60 s by the school of Krivoglaz and by<br />
Wilkens. Since those early days, applications of LPA in scientific and technological studies have increased steadily, even if the<br />
methodology did not basically evolved in the last forty years.<br />
In more recent years we are assisting to a renaissance in this field, mostly driven by the availability of fast computers (as in so<br />
many other disciplines), but also due to the growing awareness that a better modelling of diffraction line profiles is possible on<br />
the basis of a deeper understanding of the various mechanisms responsible for line broadening. Moreover, better statistical<br />
approaches are being devised for line profile modelling, as well as methods for the modelling of the whole powder diffraction<br />
pattern. In the present issue of the CPD Newsletter some of these innovations and current activity in LPA are briefly present,<br />
including a short report on the CPD Size-Strain Round Robin.<br />
Even if not exhaustive, this collection of short scientific articles can be considered as a good basis to stimulate reader’s<br />
curiosity to further readings. It is worth reminding here that a further help to assess the state of the art in LPA should be given<br />
by the book produced after the Size-Strain III conference (Trento (I); Dec. 2001), which is now close to the published by<br />
Springer-Verlag under the title: “Diffraction <strong>Analysis</strong> of the Microstructure of Materials” (edited by P. Scardi and E.J.<br />
Mittemeijer).<br />
Methods, results and opinions expressed by the various authors contributing to this Newsletter can be quite different, even<br />
conflicting in some cases. This is not totally unintentional: authors were selected trying to present a variety of approaches and<br />
different views of LPA. Unlike typical scientific journals and textbooks, where an orthodox view of scientific disciplines is<br />
usually proposed, the CPD Newsletter can present a different point of view. T he Newsletter provides a Forum where new ideas<br />
can be freely confronted and judged, with the further advantage of a rather short editorial process (i.e., rapid publication and<br />
distribution). I hope readers as well as future Editors will share this opinion on the role of the CPD Newsletter as a free space<br />
for open discussion and fast communication of developments concerning Powder Diffraction .<br />
The editing of the present issue is the last act after a long and fruitful personal involvement in the CPD. It is a particular<br />
pleasure for me to quit after producing a Newsletter so deeply related to my main research interests, and I look forward to<br />
future opportunity to collaborate again with the CPD/IUCr.<br />
I like to conclude this brief introduction to the present issue reportin g the text of a letter I recently received from Nils O.<br />
Ersson , from Uppsala, Sweden. Beyond the specific case proposed by Nils (I hope he will receive some useful answer through<br />
the Newsletter), this letter perfectly illustrates a typical paradox of our times. As we would say in Italy, the risk is , when<br />
changing the water in a bathtub, to through away the baby together with the dirty water. Is Progress running always in the<br />
correct direction?<br />
~ ~ ~ ~ ~ ~<br />
Paolo Scardi<br />
Professor Paolo Scardi Uppsala 2003-01-07<br />
Università di Trento<br />
Concerning Film material for X-ray Cameras.<br />
Dear Professor Scardi!<br />
This is a problem I should have tried to discuss with you at your stay at Uppsala at the EPDIC-8 conference, as it was a problem<br />
already at that time.<br />
We are extensively using the Guinier cameras, built during the time Professor Gunnar Hägg still was active. As the geometry<br />
not permits the use of double coated emulsion layers on the film base, we in the “early days” had to remove one layer from a<br />
standard, commercial X-ray film. It was a great advantage when the Swedish factory CEA made a high sensitive, single coated<br />
film (the REFLEX -15 film, much by the aid from Professor S. Abrahamsson).<br />
A few years ago CEA was bought by AGFA and all production in Sweden was stopped, including the REFLEX -15. I have<br />
tried to find other film brands, making single-coated films. There are, of course, a number of them, intended for medical use.<br />
Films for mammographical use have a very low background, but show serious drawbacks (I compare to REFLEX -15): They<br />
3
have a sensitivity for X-ray radiation of only 20% but show a much higher sensitivity to normal day -light , so they are much<br />
more difficult to handle at exposure and in darkroom. (Still they are to recommend in some cases, e.g. for recording data for<br />
Rietveld refinement)<br />
So far I have tried AGFA CURIX and KODAK BIOMAX MR films, as well as a film from CEA (no longer available). They<br />
all behave as described. At the moment we use REFLEX-15 that still are in store, but they give a background that is far too<br />
high to be accepted – besides the number of films in the store is rapidly decreasing.<br />
This is of course not a problem only for our laboratory, but for all users of the Guinier technique. The problem is most serious<br />
for labs in poor universities, where diffractometers not are used (I have an example: The Eritrean Asmara University, to which<br />
we sent a Guinier camera equipment two years ago).<br />
The demand of this type of films is very small, but I think that still one of the large factories could try to use the concept for the<br />
REFLEX -15. This film was much more expensive than the standard doublecoated, medical films, but was still affordable as so<br />
little was used for each exposure. (A 18x24 cm film at a price of 4 € was cut to 11 film strips for our cameras.)<br />
The best way to convince a big firm like AGFA or KODAK must be if there is a demand from an international organisation,<br />
and of these the IUCr Powder Committee of course is the expert one. This is why I send this request to you! I hope you can<br />
help us, all of us users of the traditional, but very efficient Guinier Camera Technique!<br />
Sincerely yours<br />
Nils Olov Ersson<br />
Senior Research Engineer<br />
Mail: NOE@mkem.uu.se<br />
Materials Chemistry<br />
Ångström Laboratory<br />
Box 538<br />
SE-751 21 UPPSALA, Sweden<br />
4<br />
XIX C<strong>ON</strong>FERENCE <strong>ON</strong> APPLIED<br />
CRYSTALLOGRAPHY<br />
1 - 4 S EPTEMBER, 2003<br />
SUMMER SCHOOL<br />
<strong>ON</strong> POLYCRYSTALLINE STRUCTURE<br />
DETERMINATI<strong>ON</strong> BY DIRECT METHODS<br />
4 - 7 SEPTEMBER, 2003<br />
Kraków, Poland 2003<br />
International Committee<br />
Organising Committee<br />
Conference subject areas<br />
Secretariat<br />
Reply Form<br />
Important dates<br />
Venue<br />
Summer school<br />
Organising group<br />
Language<br />
Fees<br />
University of Silesia Committee of Crystallography,<br />
Committee of Material Science of Polish Academy of Sciences Dr Danuta Stróz<br />
For information, e-mail to: dana@us.edu.pl<br />
http://crystallography.us.edu.pl/
Structure Solution from Powder Diffraction Data<br />
SSPD'03<br />
September 14-19, 2003<br />
C<strong>ON</strong>GRESS CENTER ACADEMIA, STARA LESNA, S LOVAKIA<br />
The purpose of this conference is to assess the progress made in the theory and techniques of structure<br />
solution based on powder diffraction data and to point to areas where further work is needed.<br />
Special attention will be paid to structure prediction done by energy minimization, because its results<br />
are frequently checked by Rietveld refinement. It is believed that a combination of these two<br />
methods will in a near future become a standard tool.<br />
The scientific program will include both invited and contributed lectures, micro -symposia and<br />
poster sessions. A commercial exhibition will be also organized.<br />
The main topics of the conference are :<br />
1. optimal data collection strategies, autoindexing, space group determination,<br />
2. Patterson & direct methods,<br />
3. structure determination by global minimization methods,<br />
4. structure prediction & modeling,<br />
5. structure determination & refinement from neutron data,<br />
6. accuracy of structure solutions,<br />
7. influence of "real" structure,<br />
8. applications to pharmacology & biology,<br />
9. industrial applications,<br />
More information can be obtained from: www.sspd-03.sav.sk<br />
Dr. Lubo Smrcok, Organizing Committee Chairman<br />
Institute of Inorganic Chemistry<br />
Slovak Academy of Sciences<br />
Dubravska cesta<br />
SK-842 36 Bratislava<br />
Slovak Republic<br />
E-mail : uachsmrk@savba.sk<br />
5
WWW sites related to powder diffraction<br />
The Commission on Powder Diffraction (CPD): http://www.iucr.org/iucr-top/comm/cpd/<br />
The International Union of Crystallography (IUCr): http://www.iucr.org<br />
The International Centre for Diffraction Data (ICDD): http://www.icdd.com<br />
The International X-ray <strong>Analysis</strong> Society (IXAS): http://www.ixas.org<br />
CCP 14: http://www.ccp14.ac.uk/<br />
Submitting a proposal for neutron diffraction or Synchrotron Radiation X-ray Diffraction is possible at many Large Scale Facilities<br />
(LSF) in the world. It represents an important and frequently unique opportunity for powder diffraction experiments. A<br />
useful guide and information can be accessed through the following web -site, maintained by R.Dinnebier:<br />
http://www.pulverdiffraktometrie.de<br />
This list is far from being complete and needs input from users and readers of the Newsletter. Please, send comments directly<br />
to R. Dinnebier (r.dinnebier@fkf.mpg.de)<br />
THE IUCR <strong>COMMISSI<strong>ON</strong></strong> <strong>ON</strong> <strong>POWDER</strong> DIFFRACTI<strong>ON</strong> - TRIENNIUM 2002-2005<br />
Chairman: Dr R. E. Dinnebier (Robert)<br />
Max-Planck -Institut für Festkörperforschung,<br />
Heisenbergstrasse 1, D-70569 Stuttgart, Germany<br />
Tel ephone: +49 -711-689-1503 | Fax: +49-711-689-1502<br />
e-mail: r.dinnebier@fkf.mpg.de<br />
Secretary: Dr A. N. Fitch (Andy)<br />
ESRF, Grenoble France<br />
Tel ephone : +33 476 88 25 32 | Fax: +33 476 88 25 42<br />
e-mail: fitch@esrf.fr<br />
Dr R. Delhez (Rob)<br />
Laboratory of Materials Science, Delft University of Technology,<br />
Rotterdamseweg 137 2628 AL Delft, The Netherlands<br />
Tel ephone: +31 15 2782261 | Fax: +31 (15) 278 6730<br />
e-mail: R.Delhez@tnw.tudelft.nl<br />
Prof. N. Masciocchi (Norberto)<br />
Dipartimento di Scienze Chimiche, Fisiche e Matematiche,<br />
Università dell'Insubria,<br />
via Valleggio 11, 22100 Como (It aly)<br />
Telephone: +39 -031-326227 | Fax: +39-031-2386119<br />
e-mail: norberto.masciocchi@mail.co.uninsubria.it<br />
Dr C. R. Hubbard (Cam)<br />
Diffraction and Thermophysical Properties Group, MS<br />
6064, Bldg 4515, High Temperature Materials Laboratory,<br />
Metals & Ceramics Division, Oak Ridge National Laboratory,<br />
Oak Ridge, TN 37831-6064<br />
Telephone: 865-574-4472 | Fax: 865-574-3940<br />
e-mail: hubbardcr@ornl.gov<br />
Dr D. Balzar (Davor)<br />
Department of Physics & Astronomy<br />
University of Denver<br />
2112 E Wesley Ave, Denver, CO 80208-0202<br />
Telephone: 303 -871-2137 | Fax: 303-871-4405<br />
e-mail: balzar@du.edu<br />
Prof. G. J. Kruger (Gert)<br />
Department of Chemistry & Biochemistry, Rand Afrikaans<br />
University, P O Box 524, Aucklandpark, South Africa<br />
Tel ephone: +27 11 489 2368 | Fax: +27 11 489 2360<br />
e-mail: gjk@na.rau.ac.za<br />
Dr. I. Madsen (Ian )<br />
CSIRO Minerals<br />
Box 312, Clayton South 3169<br />
Victoria, Australia<br />
Telephone: +61 3 9545 8785 | Fax: +61 3 9562 8919<br />
e-mail; Ian.Madsen@csiro.au<br />
Prof. W. I. F. David (Bill)<br />
Rutherford Appleton Laboratory (CCLRC), Chilton, Oxon.<br />
OX11 OQX, United Kingdom<br />
Tel ephone: +44 1235 445179 | Fax: +44 1235 445383<br />
e-mail: bill.david@rl.ac.uk<br />
Prof. M. Delgado (Miguel)<br />
Laboratorio de Cristalografía, Departamento de Química,<br />
Núcleo Universitario Dr. Pedro Rincón Gutiérrez, Sector La<br />
Hechicera. Edif. "A". Nivel Patio. Universidad de Los Andes,<br />
Mérida, Venezuela<br />
Telephone: +58 274240-1372<br />
e-mail: miguel@ ciens.ula.ve<br />
------------------------------------------------------------------<br />
ICDD Representative<br />
Prof. R. L. Snyder (Bob)<br />
Department of Materials Science & Engineering, Georgia<br />
Institute of Technology , Columbus, 771 Ferst Dr. N.W., Atlanta,<br />
GA 30332-0245, USA;<br />
Telephone: +1 (404) 894-2888 | Fax: +1 (404) 894-2888<br />
e-mail: bob.snyder@mse.gatech.edu<br />
Consultants<br />
Prof. P. Scardi (Paolo)<br />
Dipartimento di Ingegneria dei Materiali e Tecnologie Industriali,<br />
Università di Trento, 38050 Mesiano (TN), Italy;<br />
Tel ephone: +39 0461 882417/67 | Fax: +39 (461) 881977<br />
e-mail: Paolo.Scardi@ing.unitn.it<br />
Dr F. Izumi (Fujio)<br />
National Institute for Research in Inorganic Materials<br />
1-1 Namiki, Tsukuba, Ibaraki 305-0044, Japan<br />
Telephone: +81 -298-51-3354 (ext. 511); FAX: +81-298-52-<br />
7449<br />
E-mail: izumi@nirim.go.jp<br />
7
8<br />
Whole Powder Pattern Modelling for the<br />
study of Anti-Phase Domains<br />
Paolo Scardi, Matteo Leoni<br />
Dipartimento di Ingegneria dei Materiali e Tecnologie<br />
Industriali, Università di Trento<br />
38050 via Mesiano 77, Trento, Italy<br />
Paolo.Scardi@ing.unitn.it<br />
INTRODUCTI<strong>ON</strong><br />
Anti-Phase Domains (APDs) are known to form in<br />
several intermetallic systems undergoing disorderorder<br />
transformations (e.g., Cu3Au [1]), but also in<br />
several ceramics (e.g., spinels [2], GaAs [3]) and<br />
quasicrystals [4].<br />
In the case of Cu3Au the high temperature (disordered)<br />
structure is fcc, whereas the ordered state is simple<br />
cubic (L12 structure). As a consequence of the lowering<br />
of symmetry, the disorder/order transformation in fcc<br />
phases is accompanied by the appearance in the<br />
diffraction pattern of the so -called superstructure<br />
reflections (Miller indices with mixed parity: 100, 110,<br />
210, …) in addition to the fundamental lines (Miller<br />
indices with the same parity: 111, 200, 220…).<br />
The intensity of the superstructure (s) lines is much<br />
weaker than that of the fundamental (f) ones, in that the<br />
structure factors are given respectively by [5]:<br />
F = f − f<br />
(1a)<br />
and<br />
s Au Cu<br />
F = f + 3 f<br />
(1b)<br />
f Au Cu<br />
where f Au and f Cu are the atomic scattering factors<br />
of gold and copper, respectively.<br />
Several mechanisms have been proposed for the<br />
formation of APDs. For instance, during the formation<br />
of an ordered phase from a disordered parent phase<br />
(like in the case of Cu3Au), the change from a random<br />
site occupation to an ordered disposition of Au and Cu<br />
atoms can start at different sites. When two ordered<br />
domains grow and finally meet, it is possible that they<br />
do not merge because the ordering process in the two<br />
domains started in non-equivalent Cu and Au sites. As<br />
a consequence APDs are formed.<br />
In principle Anti-Phase Boundaries (APBs), limiting<br />
different APDs, can occur along any direction. In<br />
Cu3Au, APBs tend mostly to form along {100} planes<br />
as conservative boundaries [6], i.e., in such a way to<br />
avoid gold atoms to come into contact.<br />
LINE BROADENING EFFECTS OF APDs<br />
The presence of APDs gives a line broadening with a<br />
specific hkl dependence, where only superstructure<br />
reflections are broadened. Wilson’s theory in 1943 [7]<br />
was the first attempt to describe this effect, leading to<br />
simple expressions for the integral breadth (β) of<br />
superstructure lines, which in the case of conservative<br />
boundaries along {100} planes in Cu3Au reads:<br />
β<br />
( s )<br />
hkl<br />
γ ( h + k )<br />
( 2<br />
+<br />
2<br />
+<br />
2)<br />
=<br />
d h k l<br />
where s is the reciprocal space variable, λ the<br />
wavelength, dhkl the interplanar distance and γ the APB<br />
probability. Integral breadth methods, however, have<br />
several limit ations (e.g., difficulties in measuring the<br />
integral breadth of overlapping profiles and in<br />
separating different line-broadening sources) which<br />
make it difficult to obtain reliable quantitative<br />
information.<br />
Whole Powder Pattern Modelling (WPPM) [8-10] is a<br />
viable solution to incorporate several line broadening<br />
models, related to different sources, in a single<br />
refinement procedure, without arbitrary assumptions on<br />
profile shape. Each diffraction profile I(s) can be<br />
described in terms of the Fourier Transform C(L) as:<br />
( ) ( )<br />
2<br />
( )e iLs π<br />
I s k s CL dL<br />
(2)<br />
= ∫ (3)<br />
where k(s) is a known function of s, including terms not<br />
related to the microstructure of the sample (e.g., the<br />
Lorentz-polarization factor,<br />
2<br />
F , etc.) . The advantage<br />
of this approach is that the convolution between the<br />
effects of different line broadening sources can be<br />
treated by multiplying the corresponding Fourier terms:<br />
IP S 2 πψ i⋅ ( L) 2 πi⋅φ( L) 2 πi⋅χ( L)<br />
( ) ( )<br />
C L = T L A ( L)<br />
< e >< e >< e > ....<br />
(4)<br />
where are explicitly considered (from left to rigth):<br />
instrumental broadening, domain size, dislocations, twin<br />
and deformation faults (expressions are reported in<br />
[10]), APDs. The Fourier term for the latter effect can<br />
be written as [7]:<br />
− 2γ(<br />
h+ k ) ⋅L<br />
2 2 2<br />
2 ( )<br />
( )<br />
e e hkl<br />
πχ i L d h + k + l<br />
< > = (5)<br />
in the case discussed before (cf. Eq.(2)).<br />
Analogous expressions hold for APDs delimited by<br />
differently oriented APBs [7,11]: in any case the FT for<br />
APDs is an exponential of the Fourier length, L, and the<br />
Intensity (a.u.)<br />
1.0<br />
0.8<br />
0.6<br />
0.4<br />
0.2<br />
0.0<br />
(100)<br />
(110)<br />
(112)<br />
-0.3 -0.2 -0.1 0.0<br />
s (Å<br />
0.1 0.2 0.3<br />
-1<br />
)<br />
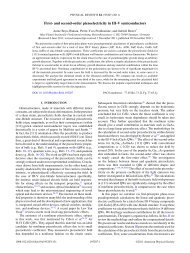
Fig. 1. <strong>Line</strong> profile of some superstructure reflections<br />
of Cu3Au with an APB probability of 5%.
intensity profile (I APD (s)) is a Lorentzian.<br />
For the case of Eq.(5) (conservative boundaries along<br />
{100} planes) the intensity profile is given by:<br />
( 2 2 2 )<br />
γ ( h + k )<br />
2<br />
− 1<br />
⎡ ⎛π⎞ ⎤<br />
hkl + + ⋅<br />
d h k l s<br />
APD I ( s) = k( s)<br />
⎢1+ ⎜ ⎟ ⎥<br />
⎢ ⎜ ⎟ ⎥<br />
⎣ ⎝ ⎠ ⎦<br />
(6)<br />
<strong>Line</strong> profiles according to Eq. (6) are shown in Fig. 1,<br />
for the case of an ordered Cu3Au phase with a 5% of<br />
APB probability. The three low-angle superstructure<br />
reflections ((100), (110), (112)) are shown, to highlight<br />
the specific hkl dependence of the line broadening effect<br />
of the APDs.<br />
WPPM ANALYSIS OF APDs IN Cu3Au<br />
The main advantage of using a WPPM approach is the<br />
possibility of including the effect of APDs in a more<br />
general modelling of the diffraction pattern, considering<br />
different APB models and their simultaneous effect<br />
[7,11].<br />
To test the proposed procedure we used data from the<br />
book of Warren (Fig. 12.9 in [5]), where the interesting<br />
case of conservative boundaries along {100} planes in<br />
Cu3Au is considered. A Cu3Au powder samp le was first<br />
disordered at 420°C for 2h, then annealed at 360°C for<br />
0.5h, in order to produce a long range order with APDs.<br />
A further treatment at 380°C for 50h led to a complete<br />
elimination of APDs. Given the long annealing time, the<br />
pattern of the latter specimen can be taken as a measure<br />
of the instrumental component. The results of the<br />
modelling is shown in Fig. 2a (fundamental reflections<br />
are not available from the data).<br />
Fig. 2b shows the WPPM result for the sample annealed<br />
0.5 h at 360°C, modelled by using an APB model of<br />
conservative boundaries along {100} planes. An APD<br />
probability γ{100}=4.2(2)% and average crystallite size<br />
24(5) nm were refined. The dislocation density is below<br />
the sensitivity (
can only be obtained by adding an additional (random)<br />
APB component, and including a size broadening effect<br />
[9]. The two contributions (APD and size broadening)<br />
are different owing to the specific selection rules of<br />
APD line broadening. The advantage of the WPPM<br />
approach is evident: line broadening sources can be<br />
compared and/or included in the same data modelling<br />
procedure, without using arbitrary assumptions on the<br />
profile shapes and extraction of line profile parameters.<br />
Further activity is currently in progress to study APDs<br />
in Cu3Au and similar L12 phases.<br />
REFERENCES<br />
[1] R.M. Fisher & M.J. Marcinkowski, Phil. Mag. 6<br />
(1961) 1385-1405.<br />
[2] Cheary, R.W. & Grimes, N.W. (1978). Acta Cryst.<br />
A34, 74-84.<br />
10<br />
Bayesian/Maximum entropy analysis of<br />
nanocrystallite-broadened line profiles<br />
N. Armstrong & W. Kalceff<br />
University of Technology Sydney,<br />
PO Box 123, Broadway, NSW 2007, AUSTRALIA<br />
J. P. Cline & J.Bonevich<br />
National Institute of Standards and Technology,<br />
Gaithersburg, Md 20899, USA<br />
Nicholas.Armstrong@uts.edu.au<br />
INTRODUCTI<strong>ON</strong><br />
We present the results of a combined<br />
Bayesian/Maximum Entropy (MaxEnt) method for<br />
analyzing size-broadened x-ray line profiles, to be<br />
used in the certification of a new NIST nanocrystallite<br />
part icle-size Standard Reference Material, SRM 1979<br />
(see [1, 2]). Novel features of our method include:<br />
• complete generality in removing instrumental<br />
broadening from the observed line-profiles<br />
• ability to determine average crystallite sizes, the<br />
distribution of sizes, and the average shape of<br />
crystallites<br />
• calculation of uncertainties in all derived<br />
quant ities.<br />
We have applied the new method to the CPD roundrobin<br />
CeO2 specimens [10] and compared the<br />
Bayesian/MaxEnt results with transmission electron<br />
microscopy data.<br />
NEED FOR A NIST NANOCRYSTALLITE SIZE<br />
SRM<br />
A NIST size SRM will address a significant shortfall<br />
in standards for analyzing the size, shape and<br />
distribution of nanocrystallites developed in the<br />
[3] M.K. Hudait & S.B. Krupanidhi, J. Appl.<br />
Phys. 89 (2001) 5972-5979<br />
[4] M. Heggen, M. Feuerbacher, P. Schall, K. Urban,<br />
R.Wang, Phys. Rev. B64 (2001) 014202-1 – 6.<br />
[5] B.E. Warren, “X-ray diffraction”, 2nd edition,<br />
Dover (New York), 1990 (1st edition, Addison<br />
Wesley, Reading, Mass., USA, 1969)<br />
[6] R. Kikuchi. & J.W. Cahn, Acta Metallurgica 27<br />
(1979) 1337-1353.<br />
[7] A.J.C. Wilson, Proc. Roy. Soc. London A181<br />
(1943) 360-368.<br />
[8] P. Scardi, Y.H. Dong, M. Leoni, Mat. Sci. Forum<br />
378-381 (2001) 132-141.<br />
[9] P. Scardi, M. Leoni, Acta Cryst. A57 (2001) 604.<br />
[10] P. Scardi, M. Leoni, Acta Cryst. A58 (2002) 190.<br />
[11] A.J.C. Wilson & L. Zsoldos, Proc. Roy. Soc.<br />
London A290 (1966) 508-514.<br />
nanotechnology industry. This SRM will enable any<br />
laboratory to assess its experimental and analy tical<br />
techniques for quantifying size-broadened x-ray<br />
profiles, and will complement electron microscopy<br />
techniques for analyzing nanocrystallites.<br />
The NIST size SRM will include two material<br />
specimens, with two different morphologies in the 10-<br />
60 nm size range. The first will be a cerium oxide<br />
(CeO2) specimen with a spherical morphology in the<br />
10-30 nm size range. This specimen will enable<br />
traditional and recently developed line broadening<br />
methods to be used to analyse size broadening [4-9].<br />
The second siz e SRM will be a zinc oxide (ZnO)<br />
specimen in the 30-80 nm crystallite size range. This<br />
specimen will be designed to have a hexagonal<br />
morphology [5, 9] and will require more complicated<br />
morphology and distribution models to be applied in<br />
order to quantify its size broadening.<br />
GENERAL OVERVIEW OF BAYESIAN/ MAXENT<br />
ANALYSIS<br />
In the realm of thermodynamics, entropy is a measure<br />
of the “randomness” of a system. In data analysis, on<br />
the other hand, the MaxEnt method has its origins in<br />
Information Theory, seeking to extract the “most<br />
random” solution under a given set of constraints [3].<br />
When we apply maximum entropy principles to a<br />
problem, the aim is to deduce as much information as<br />
the noise in the data will allow, while taking into<br />
account any limitations of the experiment; this<br />
produces the most general solution which assumes the<br />
least about information that is not available [12, 16]. A<br />
consequence of this approach is that it ensures no<br />
structure (i.e. detail) will appear in the solution unless<br />
there is evidence for it in the data.<br />
Having formulated a suitable entropy function, S,<br />
MaxEnt analysis of the particle size-broadened data<br />
uses Bayes’ theorem to combine the experimental data
with any hypotheses we may have about the solution<br />
(see [14]). To this end, we introduce Lagrangian<br />
multipliers to establish a compromise between<br />
maximizing the entropy function while minimizing χ 2 ,<br />
a parameter related to the difference between the<br />
model and fit [14, 16].<br />
Our method satisfies the important requirements that it<br />
should:<br />
• preserve the positivity and additivity of the<br />
distributions<br />
• make the least possible number of assumptions<br />
about the solution (e.g. profile shape and<br />
specimen broadening distribution)<br />
• incorporate all the available data (e.g. observed<br />
profile, instrument kernel, statistical noise and<br />
background characteristics)<br />
• test/include all available a priori information (e.g.<br />
TEM , SEM, AFM data and theoretical models)<br />
• quantify uncertainties in the results (i.e. give error<br />
bars).<br />
EXPERIMENTAL DETAILS & ANALYSIS<br />
<strong>XRD</strong> measurements<br />
Diffraction patterns were collected on a Siemens<br />
D500 1 diffractometer equipped with a focusing Ge<br />
incident beam monochromator, sample spinner and a<br />
scintillation detector. Copper Kα1 radiation was used.<br />
The divergence slit was 0.67°, while the receiving<br />
optics included a slit of 0.05° and 2° Soller slits. The<br />
instrument profile function was determined using a<br />
split-Pearson VII profile shape function fitted to 22<br />
reflections collected from SRM 660a (LaB6). The nonoverlapping<br />
lines for the CPD CeO 2 lines were<br />
collected to optimize the signal-to-background ratio.<br />
The non-overlapping lines included 111, 200, 220,<br />
400, 422, 511 and 531.<br />
As an example of the CeO 2 data collected, the<br />
observed 200 profile and the instrument profile are<br />
shown in Fig. 1, while Fig. 2 shows the observed<br />
profile before and after background estimation.<br />
TEM measurements<br />
A series of TEM micrographs of crystallites were<br />
taken at a fixed magnification of 200kX. The negatives<br />
of the micrographs were scanned and analysed by<br />
manually approximating some 853 crystallites with an<br />
oval.<br />
1 Certain commercial materials, equipment and software are<br />
identified in order to adequately specify the experimental procedure.<br />
Such identification does not imply a recommendation or<br />
endorsement by NIST, nor does it imply that the materials or<br />
equipment or software are necessarily the best available for the<br />
purpose.<br />
Fig. 1. Observed CeO 2 200 line (solid curve),<br />
instr ument profile (dotted peak) and background.<br />
Fig. 2. Observed CeO2 200 profile before (upper<br />
curve) and after (lower curve) background<br />
subtraction.<br />
<strong>Analysis</strong> of CPD CeO 2 round-robin data<br />
Preliminary analysis of the line profile data identified<br />
size broadening as being the dominant broadening<br />
component and determined the area- and volumeweighted<br />
diameters, using the approach of Krill &<br />
Birringer [4], while similar results were obtained<br />
using a Bayesian/Markov Chain Monte Carlo<br />
(MCMC) method (see [2]). Table 1 provides a<br />
summary of the experimental results from line profile<br />
analysis of the CPD CeO2 specimen. The results from<br />
this preliminary analysis became the non-uniform a<br />
priori info rmation for the full Bayesian/MaxEnt<br />
method.<br />
a<br />
(nm)<br />
V<br />
Krill &<br />
Birringer<br />
Bayes/<br />
MCMC<br />
Method<br />
Full<br />
Bayes/<br />
MaxEnt<br />
(uniform)<br />
Full<br />
Bayes/<br />
MaxEnt<br />
(non-un.)<br />
24.9(2) - - -<br />
(nm)<br />
29.6(3) - - -<br />
D 0 (nm) 16.5(6) 15.1(6) 14(1) 16.0(2)<br />
σ0 1.51(3) 1.55(2) 1.7(2) 1.49(1)<br />
<br />
(nm)<br />
17.9(7) 16.6(6) 16(2) 17.3(3)<br />
2<br />
(nm) 2<br />
53(7) 58.6(9) 100(70) 52(3)<br />
Table 1. Summary of size distribution results for the<br />
CPD CeO 2 specimen, for the various analysis methods<br />
used.<br />
11
The full Bayesian/MaxEnt method was used to<br />
determine the morphology and size distribution of the<br />
nanocrystallites from the CeO2 diffraction data. In this<br />
analysis, two models for size distributions are<br />
compared— a uniform distribution, D ∈[0, 60] nm,<br />
and a log-normal distribution, using the D0 and σ0<br />
from Table 1.<br />
Fig. 3 presents the Bayesian/MaxEnt results for the<br />
200 line of CeO2. In this figure the log-normal model<br />
and final Bayesian/MaxEnt distribution, with error<br />
bars, are shown. The error bars take into account the<br />
statistical noise and the uncertainty in determining the<br />
background level. In this analysis, the non -uniform a<br />
priori model was set equal to the log-normal model<br />
for the size distribution.<br />
Fig. 3. Size distribution and a priori model for the<br />
CPD round-robin CeO2 200 line.<br />
Fig. 4 shows the Bayesian/MaxEnt size distributions<br />
for the non-overlapping hkl lines; they are in close<br />
agreement with each other, suggesting that the size<br />
distribution closely resembles a log-normal<br />
distribution.<br />
Fig. 4. CPD round-robin CeO2 size-distributions for<br />
all non-overlapping lines, which including 111, 200,<br />
220, 400, 422,511 and 531.<br />
12<br />
Fig. 5. Bayesian/MaxEnt and TEM size distributions of<br />
the CPD round-robin CeO2 specimen. The TEM<br />
distr ibution was developed from 853 crystallites, while<br />
the Bayesian/MaxEnt distributions were determined<br />
from the non -overlapping profiles (see Fig 4).<br />
The final test for the Bayesian/MaxEnt size analysis<br />
comes in comparing the Bayesian/MaxEnt size<br />
distribution with a TEM -derived distribution. The<br />
techniques are independent of each other, but the x-ray<br />
analysis was able to provide more information than<br />
did the TEM analysis. This is highlighted by the<br />
results in Figs. 5 & 6, from which it can be seen that<br />
TEM could not resolve overlapping crystallites in the<br />
size range D ≤ 14 nm. However, for D >14 nm the<br />
agreement between the two distributions is very<br />
satisfactory. The difference between the x-ray and<br />
TEM size distributions, given in Fig 5, is due to<br />
difficulties in dispersing the CPD CeO 2 specimen.<br />
This comparison between the x-ray and TEM data<br />
illustrates the need for a nanocrystallite size SRM.<br />
Fig. 6 is a TEM micrograph showing that the CPD<br />
CeO2 crystallites have a near -spherical morphology. It<br />
also reveals that there is considerable overlap of<br />
crystallites, making it difficult to distinguish between<br />
smaller and large cry stallites.<br />
The main disadvantage of the (present)<br />
Bayesian/MaxEnt method is that it only takes into<br />
consideration size broadening contributions, requiring<br />
a relatively good understanding of the material<br />
specimen. However, the present method has<br />
established a basis for a generalized Bayesian/MaxEnt<br />
method that quantifies the size, stacking/twinning and<br />
dislocation broadening contributions, while taking into<br />
consider ation any suitable a priori information. In<br />
addition, the present method only analyses nonoverlapping<br />
line profiles; further improvements can be<br />
gained if the method were extended to whole pattern<br />
analysis, since this would reduce the likelihood of<br />
systematic errors from peak overlapping. A project is<br />
currently underway to develop a whole pattern<br />
method. It could also be argued that the need and use<br />
of a priori information is a disadvantage of the<br />
method; however, we argue that it is a strength, in that<br />
it tests the available a priori information in the light of<br />
experimental data. This in turn is the basis of scientific<br />
reasoning [14].
Fig. 6. TEM micrograph of the CPD round-robin<br />
CeO2 specimen used in this analysis. The crystallites<br />
have a near-spherical morphology, while overlapping<br />
of crystallites make it difficult to distinguish the<br />
boundaries between individual crystallites.<br />
C<strong>ON</strong>CLUSI<strong>ON</strong><br />
• The development of a NIST nanocrystallite size<br />
SRM will address a significant shortfall in the<br />
analysis of crystallite size using x-ray diffraction<br />
and electron microscopy techniques.<br />
• This SRM will have broad applications in the<br />
rap idly developing nanotechnology industry.<br />
• We have demonstrated that a full<br />
Bayesian/MaxEnt (quantitative) analysis can be<br />
used to determine the crystallite size distribution.<br />
This approach incorporates all the available<br />
inform ation and quantifies uncertainties in the<br />
solution; importantly, it makes no explicit<br />
assumptions about the shape of the profile or<br />
crystallite distributions.<br />
• The development of a whole pattern<br />
Bayesian/MaxEnt method is the next important<br />
development.<br />
• We expect this approach to form the basis of a<br />
more general method for separating size, strain<br />
and stacking fault/twinning effects.<br />
• Unlike existing techniques, our approach has<br />
determined the size distribution from a firstprinciples<br />
application of the underlying Physics,<br />
and without making any assumptions about the<br />
size distribution.<br />
• This study of CeO2 has found it to be suitable for<br />
a size SRM; it can be easily mass-produced in<br />
feedstock amounts in the required size range, and<br />
the manufacturing process developed results in<br />
negligible strain broadening.<br />
REFERENCES<br />
[1] N. Armstrong, W. Kalceff, J. P. Cline, and J.<br />
Bonevich. “Bayesian inference of nanoparticle<br />
broadened x-ray line profiles”. Submitted to J. Res.<br />
Nat. Inst. Stand. Techn., 2001 . Proceedings of<br />
Accuracy in Powder Diffraction III, 22-25 April<br />
2001, NIST, Gaithersburg, USA.<br />
[2] N. Armstrong, W. Kalceff, J. P. Cline, and J.<br />
Bonevich. “A Bayesian/Maximum Entropy method<br />
for certification of a nanocrystallite-size NIST<br />
Standard Reference Material” in Diffraction<br />
analysis of the microstructure of materials.<br />
Springer-Verlag, Berlin, 2003.<br />
[3] E. T. Jaynes. Phys. Rev., 106(4):620-630, 1957.<br />
[4] C. E. Krill and R. Birringer. Phil. Mag.,<br />
A77(3):621-640, 1998.<br />
[5] J. I. Langford. NIST Spec. Pub., 846 :110-126,<br />
1992.<br />
[6] J. I. Langford and D. Loüer. J. Appl. Cryst., 15:20 -<br />
26, 1982.<br />
[7] J. I. Langford and D. Loüer. Rep. Prog. Phys.,<br />
59:131-234, 1996.<br />
[8] J. I. Langford, D. Loüer, and P. Scardi. J. Appl.<br />
Cryst., 33:964-974, 2000.<br />
[9] J. I. Langford and A. J. C Wilson. J. Appl. Cryst.,<br />
11:102-113, 1978.<br />
[10] D. Loüer and N. Audebrand. University of<br />
Rennes. For details follow the links provided at<br />
www.iucr.org/iucrtop/comm/cpd/projects/index.ht<br />
ml, 2001.<br />
[11] P. Scardi and M. Leoni. J. Appl. Cryst., 32:671 -<br />
682, 1999.<br />
[12] D. S. Sivia. “Data <strong>Analysis</strong>: A Bayesian Tutorial”.<br />
Oxford Science Pub., Oxford, 1996.<br />
[13] J. Skilling and R. K. Bryan. Mon. Not. R. astr.<br />
Soc., 211 :111-124, 1984.<br />
13
14<br />
Report on the Size-Strain Round Robin<br />
Davor Balzar<br />
University of Denver and NIST, Denver, CO 80208,<br />
U.S.A.<br />
balzar@du.edu<br />
and<br />
Nicolae C. Popa<br />
Frank Laboratory of Neutron Physics, Joint Institute<br />
for Nuclear Research, 141980 Dubna, Russia<br />
INTRODUCTI<strong>ON</strong><br />
CPD-sponsored size-strain round robin was recently<br />
organized to provide a better insight into effects of<br />
crystallite size and lattice strain on diffraction line<br />
broadening, which is a vibrant field of modern powder<br />
diffraction [1]. The full motivation for the round robin<br />
was discussed earlier [2]. As line-broadening analysis<br />
is an inherently difficult field of powder diffraction<br />
and some previous size-strain round robin attempts had<br />
failed, it was decided to begin with a sample with a<br />
limited degree of line overlapping, isotropic<br />
broadening, and a simple sample microstructure.<br />
Measurements were taken at different diffraction<br />
facilities ("representative measurements") to study<br />
influence of measurement conditions (mainly<br />
instrument resolution, type of radiation, and instrument<br />
setup). Here, the aim is to give a short overview of<br />
specimen preparation, preliminary analysis of the<br />
measurements, and the results of the round robin, in<br />
which the participants have applied different methods<br />
of line-broadening analysis to the representative<br />
measurements. The complete results and a<br />
comprehensive review of the methods employed will<br />
be published elsewhere. A more extensive report on<br />
the round-robin results is posted at<br />
http://www.du.edu/~balzar.<br />
SAMPLE PREPARATI<strong>ON</strong><br />
Nanocrystalline CeO2 (ceria) was prepared from<br />
thermal treatment of hydrated ceria, according to the<br />
method reported in detail elsewhere [3]. Cerium<br />
sulfate, Ce(SO 4)2•4H 2O, was used as starting material.<br />
Hydrated ceria was precipitated at room temperature,<br />
under vigorous stirring, from the addition of 250 g of<br />
the Ce(IV) salt in 4 L of a 1M ammonia solution. The<br />
precursor so obtained consists of ultrafine hydrated<br />
cerium oxide CeO 2•xH2O, which has the crystal<br />
structure of ceria, and has been characterized by<br />
spherical crystallites of ~20 Å diameter, on average [3].<br />
This yellow colloidal hydrated ceria was washed with<br />
distilled water three times, with alcohol, filtrated and<br />
then dried at room temperature for three days. In order<br />
to have a sample without too large diffraction line<br />
broadening, the annealing temperature was selected to<br />
be 650 °C. The hydrated ceria was heated in a silica<br />
crucible with the heating rate of 120 °C h -1 until 650 °C<br />
and then kept for 45 hours at this temperature in order<br />
to ensure complete annealing. From this procedure 50 g<br />
of ceria were obtained (here designated as S1).<br />
Annealed ceria was used to characterize instrumental<br />
broadening. Commercially obtained ceria was annealed<br />
at different temperatures and times to achieve minimal<br />
line broadening without inducing growth of too large<br />
grains, which would be detrimental to counting<br />
statistics and shape of the diffraction-line profiles. An<br />
optimum behaviour was obtained with annealing at<br />
1300 °C for 3 h in air. Powder was slowly cooled<br />
overnight in the crucible. This sample is designated<br />
here as S2. The comparison between annealed ceria<br />
and an NIST SRM660 LaB6 powder, when used for<br />
correction of instrumental broadening, did not show<br />
significant changes (within a single standard deviation)<br />
in the final parameters of interest, that is, domain size<br />
and strain values.<br />
REPRESENTATIVE MEASUREMENTS<br />
Measurements were collected on both ceria samples at<br />
seven instruments:<br />
(i) University of Birmingham: a high-resolution x-ray<br />
laboratory setup with an incident-beam<br />
monochromator;<br />
(ii) University of Le Mans: a “common” x-ray<br />
laboratory setup;<br />
(iii) National Synchrotron Light Source (NSLS): 2nd -<br />
generation synchrotron, flat -plate geometry;<br />
(iv) European Synchrotron Radiation Facility (ESRF):<br />
3rd-generation synchrotron, capillary geometry;<br />
(v) NIST Center for Neutron Research (NCNR):<br />
constant-wavelength (CW) neutron source;<br />
(vi) Institute Laue-Langevin (ILL): CW neutron<br />
source;<br />
(vii) ISIS at the Rutherford-Appleton Laboratory:<br />
Time-of-flight (TOF) neutron source.<br />
Figure 1 compares instrument resolutions, ? d/d,<br />
calculated from the FWHM of instrumental standard<br />
profile (sample S2), as obtained by Rietveld refinement<br />
of line -profile parameters.<br />
Δd/d<br />
0.010<br />
0.008<br />
0.006<br />
0.004<br />
0.002<br />
0.000<br />
Le Mans<br />
NIST<br />
ILL<br />
Birmingham<br />
NSLS<br />
ESRF<br />
ISIS<br />
1.0 1.5 2.0 2.5 3.0<br />
d (Å)<br />
Fig. 1. Resolution function ? d/d as a function of<br />
interplanar spacing d for all instruments, as calculated<br />
from the FWHM, for the sample S2.<br />
In order to ensure the self-consistency of measurements<br />
before the round-robin data were made available to the<br />
round-robin participants, an analysis of all the<br />
measurements was carried out by three methods:<br />
Bayesian deconvolution followed by the Warren -
Averbach (WA) analysis of line broadening, an<br />
assumed physical model of lognormal size distribution<br />
of spherical crystallites (LNSDSC), and Rietveld<br />
refinement. Recommendations for refining profile<br />
parameters in Rietveld refinement and their<br />
interpretation through the physical parameters of<br />
interest (domain size and strain) are given elsewhere<br />
[4]. Both the WA and Rietveld approaches yielded a<br />
relatively small strain, as opposed to the LNSDSC<br />
method. On constraining the strain to zero, all three<br />
methods gave similar values of domain size (Table 1).<br />
The values given for the LNSDSC method correspond<br />
to the lognormal distribution with the average diameter<br />
(the first distribution moment) of spherical crystallites<br />
equal to approximately 183 Å with the distribution<br />
standard uncertainty of approximately 78 Å (an<br />
average over all data sets).<br />
LNSDSC<br />
(Å)<br />
WA<br />
(Å)<br />
Rietveld<br />
(Å)<br />
Birmingham 223 228 227<br />
Le Mans 229 226 224<br />
ESRF 229 224 219<br />
NSLS 228 229 224<br />
ILL 225 224 220<br />
NIST 232 230 216<br />
ISIS 231 240 224<br />
Table 1. Apparent volume-averaged domain size, as<br />
calculated by three methods (acronyms explained in<br />
text).<br />
ROUND ROBIN RESULTS<br />
The measurements and instructions were made<br />
available to the round-robin participants for download<br />
at the NIST Web site. 18 reports with results were<br />
received. To be able to compare the results, an attempt<br />
was made to scale all the reported quantities into<br />
groups of results that are consistently defined. An<br />
initial screening of results has eliminated 2 sets with<br />
clearly erroneous values of both domain size and strain.<br />
The results for the apparent volume-averaged domain<br />
size were clustered in two regions: below and above<br />
250 Å. The latter results had a much larger scatter,<br />
which can be explained by an oversimplified analytical<br />
model used for the size-broadened profile (a single<br />
Lorentzian function), although the size-broadened<br />
profile had a significant Gaussian component. This is<br />
inherent to the Lorentz-Lorentz and Lorentz-Gauss<br />
integral-breadth methods, and often a consequence of<br />
incomplete refinement of profile parameters in<br />
Rietveld refinement. For instance, the participants that<br />
did not refine the Gaussian size term (proportional to<br />
1/cos 2 ?) have obtained a larger value of domain size,<br />
as the corresponding line broadening was probably<br />
erroneously absorbed into another refined parameter.<br />
This has systematically shifted the averages toward the<br />
larger domain sizes (Figure 2 gives average results for<br />
different analysis methods). Conversely, the<br />
participants using double-Voigt methods (VV.1 [5]<br />
and VV.2 [6] in Fig. 2) obtained a lower value for<br />
domain-size.<br />
D V (Å)<br />
500<br />
400<br />
300<br />
200<br />
100<br />
MeanRietveld LL LG VV.1 VV.2 FP<br />
Method<br />
Fig. 2. Apparent volume-averaged domain size: The<br />
mean is an average over all results, LL is the Lorentz -<br />
Lorentz and LG is the Lorentz (size) -Gauss (strain)<br />
integral-breadth method, VV.1 and VV.2 are double-<br />
Voigt methods, FP is “Fundamental parameters”<br />
approach.<br />
C<strong>ON</strong>CLUSI<strong>ON</strong>S<br />
Round-robin results indicate that the ceria powder<br />
shows dominant domain-size related isotropic line<br />
broadening. The results obtained on instruments with<br />
different resolution do not vary significantly. The sizebroadened<br />
profile is not pure Lorentzian but has a<br />
strong Gaussian contribution. If the Gaussian<br />
contribution is neglected, erroneous results can be<br />
obtained, in particular in Rietveld refinement.<br />
ACKNOWLEDGEMENTS<br />
We thank the CPD for supporting the size-strain round<br />
robin. Daniel Louër and Nathalie Audebrand<br />
(University of Rennes) have prepared the S1 sample.<br />
All the round -robin participants and instrument<br />
scientists that provided measurements are gratefully<br />
acknowledged. Lachlan Cranswick is acknowledged<br />
for initiating the idea that led to the size-strain round<br />
robin. The help of Nita Dragoe with data conversion is<br />
appreciated.<br />
REFERENCES<br />
[1] J. I. Langford and D. Louër: Rep. Prog. Phys. 59<br />
(1996) 131-234.<br />
[2] D. Balzar: CPD Newsletter 21, p. 3.<br />
[3] N. Audebrand, J.-P. Auffrédic and D. Louër:<br />
Chem. Mater. 12 (2000) 1791-1799.<br />
[4] D. Balzar, N. Audebrand, M. R. Day mond, A.<br />
Fitch, A. Hewat, J. I. Langford, A. Le Bail, D.<br />
Louër, O. Masson, C. N. McCowan, N. C. Popa, P.<br />
W. Stephens and B. Toby: J. Appl. Cryst. (2003)<br />
submitted.<br />
[5] J. I. Langford: In Accuracy in Powder Diffraction,<br />
NBS Special Publication No. 567, pp. 255-269.<br />
[6] D. Balzar and H. Ledbetter: J. Appl. Cryst. 26<br />
(1993) 97 -103.<br />
15
16<br />
Dislocation density tensor for diffraction<br />
line analysis<br />
H. Bougrab * , K. Inal, M. Berveiller<br />
LPMM UMR CNRS 7554 - ENSAM<br />
4, rue Augustin Fresnel – 57078 Metz - France<br />
* hakim.bougrab@metz.ensam.fr<br />
INTRODUCTI<strong>ON</strong><br />
The present work deals with microstructure analysis of<br />
crystalline materials, especially concerning the role of<br />
dislocations. At this scale, the effect of dislocations on<br />
the crystals properties is associated basically with the<br />
local internal strain and stress fields. A dislocation<br />
elasticity theory is then a necessary prerequisite for the<br />
development of a quantitative analysis of dislocations.<br />
Several models based on the not ion of a continuous<br />
medium and elasticity theory, sometimes called the<br />
continuum theory of dislocations [1-4], were developed<br />
and applied to many cases, e.g.: single edge or screw<br />
dislocation, straight dislocations, interaction between<br />
two screw dislocations, dislocation cell, dislocation<br />
loops.<br />
Major advances in processing control or service life<br />
safety are facilitated by rapid feedback between<br />
properties and microstructure measurements. X-ray<br />
diffraction (<strong>XRD</strong>) is a non-destructive technique<br />
widely applied for the crystalline materials<br />
characterisation. <strong>XRD</strong> enables one to study<br />
dislocations microstructures, their spatial distribution<br />
and especially to determine their density. Starting from<br />
the scattered intensity, the Fourier coefficients of the<br />
diffraction line which characterize its broadening can<br />
be obtained. This broadening is due to the size of<br />
diffracting coherent domains, and to the lattice<br />
distortion heterogeneity (spatial positions of atoms)<br />
generated by imperfections, mainly dislocations [5 -11].<br />
In this work, dislocation analysis will be done at a scale<br />
where effect of dislocation groups prevails, so that it is<br />
important to take into account the strong interactions<br />
between dislocations. For this purpose, it will be<br />
developed a micromechanical approach [1, 12] at an<br />
intermediate scale, between random dislocations<br />
distributions and exact dislocations space positions.<br />
Furthermore, the proposed approach will not describe<br />
the setting in configuration of dislocations but it will<br />
consider a given configuration to calculate the exact<br />
associated fields in a deterministic way [12].<br />
CRYSTALLOGRAPHIC DISLOCATI<strong>ON</strong> DENSITY<br />
TENSOR<br />
In the following, it is show how the displacement ui<br />
and then the elastic distortion field βij for a given<br />
plastic strain ε * ij (or distortion β * ij) due to dislocations<br />
are determined. The resolution of this micromechanical<br />
problem is based on the knowledge of the three<br />
equations: of the equilibrium, behaviour and strain<br />
compatibility. It is also considered that the total strain<br />
εij is equal to the sum of the eij elastic and the<br />
plastic ε * ij ones. The equation of equilibrium allows<br />
one writing:<br />
*<br />
C u = C ε<br />
(1)<br />
ijkl<br />
k , lj ijkl kl , j<br />
where ui is the displacement vector, and Cijkl is the<br />
elasticity stiffness tensor. The displacement solution is<br />
thus related to the plastic strain distribution. Supposing<br />
that this strain is periodic and given by a Fourier<br />
integral, we obtain [1]:<br />
+¥<br />
*<br />
u ( x)<br />
- C ( x¢<br />
) G<br />
i<br />
-¥<br />
jlmn mn ij,<br />
l<br />
= ε ( x - x¢<br />
) dx¢<br />
(2)<br />
Gij(x-x’) is the Green’s function. Elastic distortion is<br />
related to total and plastic ones by βji=ui,j- β * ji and the<br />
plastic strain to distortion by ε * ij=(β * ij+ β * ji)/2.<br />
The plastic distortion is caused by the slip bi of the<br />
plane whose normal vector is nj [2]:<br />
*<br />
β ( ) = -b<br />
n δ ( S - x)<br />
(3)<br />
ij x i j<br />
where δ(S-x) is the one-dimensional Dirac delta<br />
function in the normal direction of S, being unbounded<br />
when x is on S and zero otherwise. Using Stoke’s<br />
theorem and introducing the permutation tensor ∈jnh,<br />
equations (2) and (3) allows one to write the elastic<br />
distortion in the form:<br />
β ( x ) = ˛ C b G , ( x - x¢<br />
) χ dl(<br />
x¢<br />
) (4)<br />
ji<br />
L<br />
jnh<br />
pqmn<br />
m<br />
ip q<br />
where χ is the direction of the dislocation line l, and dl<br />
is the dislocation line element. The dislocation density<br />
tensor αhm is defined by the xm-component of the total<br />
Burgers vector of dislocation threading the unit surface<br />
perpendicular to the xh-direction [1]:<br />
dl(<br />
x¢<br />
)<br />
α hm ( x¢ ) = bm<br />
χ h = bm<br />
dl h ( x¢<br />
) (5)<br />
dx¢<br />
The dislocation density tensor αhm(x), which<br />
characterizes the incompatibility of deformation at<br />
each point of the lattice network, was first introduced<br />
by Nye [1]. In the sense of general thermodynamics,<br />
the dislocation density is a state quantity, i.e. a quantity<br />
that, at least in principle, can be measured without<br />
knowing anything about previous times. It is very<br />
important to notice that the dislocation density tensor<br />
can give information on the nature of dislocations,<br />
because the diagonal components represent screw<br />
dislocations and the off-diagonal ones characterize the<br />
edge dislocations. Finally, introducing (5) into (4) the<br />
elastic distortion is given by:<br />
β ( x ) = ˛ C G ( x - x¢<br />
) ( x¢<br />
) dx¢<br />
, α<br />
(6)<br />
ij<br />
V<br />
jnh<br />
pqmn<br />
ip q<br />
Gij(x-x’) characterizes the specific spatial position<br />
interaction, in comparison with approaches using the<br />
principle of superposition of each single dislocation<br />
contribution [3, 6, 10, 13].<br />
DIFFRACTI<strong>ON</strong> LINE FOURIER COEFFICIENTS<br />
In previous section, we introduced the relation between<br />
distortion and dislocation density tensors. Now, we<br />
present the relation between distortion tensor and<br />
Fourier coefficients of the peak, providing to link<br />
between the dislocation density tensor to the Fourier<br />
coefficients.<br />
hm<br />
h
When two atoms ‘p’ and ‘q’ are moved of δRp and δRq<br />
compared to their initial positions R 0 p and R 0 q,<br />
introducing the Bragg centred variable s, the scattered<br />
intensity takes the following form:<br />
I<br />
N<br />
( ) = ( ) ( { - } ) R R s i<br />
n A f s<br />
0 0<br />
2<br />
( p , q ) = 1<br />
exp π (7)<br />
A(n)= represents the Fourier<br />
coefficients of the diffraction peak, g is the reciprocal<br />
space diffraction vector and n, the Fourier parameter.<br />
The scattered intensity shows that line broadening<br />
results from the distortion fields. The information on<br />
these fields is contained in the Fourier coefficients. It is<br />
noticed that only the components of displacements<br />
perpendicular to the diffracting planes contribute to the<br />
line broadening. Moreover, these coefficients result in<br />
fact from the average on the atoms pairs characterized<br />
by the same projection distance on the diffraction<br />
vector n.a (n.a=R 0 p-R 0 q is the periodicity distance in the<br />
diffraction vector direction). The displacement related<br />
to the initial position εn={δRp-δRq}/n.a is the projected<br />
distortion. The Fourier coefficients are now given by<br />
the following equation [14, 15]:<br />
A( n)<br />
= < exp ( 2π<br />
i g a nε<br />
n ) > (8)<br />
The symbol < > denotes the averaging over the crystal<br />
volume (summation over all p and q atoms corresponds<br />
to each n value). In a first approach, one considers only<br />
the symmetrical part of the exp onential.<br />
It was show that the Fourier coefficients are closely<br />
related to the distortion state of the microstructure.<br />
Knowing the latter by the micromechanics theory, one<br />
can calculate these coefficients by an averaging<br />
operation, in which, one varies the Fourier parameter<br />
by taking the corresponding distortion field projected<br />
on the diffraction vector:<br />
g β<br />
g<br />
i ij j<br />
ε n=<br />
(9)<br />
g 2<br />
n<br />
SINGLE EDGE DISLOCATI<strong>ON</strong> CASE<br />
To illustrate our approach, consider a crystal of infinite<br />
dimension, filled with a single edge dislocation. Let us<br />
examine the case of an edge dislocation in the<br />
crystalline lattice of iron (body -centred cubic crystal)<br />
defined by the Burgers vector b=[-111], the dislocation<br />
line l=[-11-2] and the normal of the glide plane<br />
n=[110] in the (x1=b, x2=n, x3=l) dislocation reference<br />
frame. Referring to the definition of the dislocation<br />
density tensor, this tensor takes the form of a Dirac’s<br />
delta function α31(x)=b.δ(x1).δ(x2) (b is the Burgers<br />
vector modulus) for the single dislocation considered<br />
(positioned at x1=x2=0). Knowing that, the integration<br />
of (6) is performed on the half plane (x1
Cpqmn .Gip,q and αhm. For isotropic materials, the first<br />
term is an analytical relation [1] so that the<br />
mathematical solution depends on the form of αhm. The<br />
case of an Uniform Dislocation Distribution (UDD),<br />
where αhm(x / ) is kept constant, is now considered.<br />
The considered uniform configuration is based on the<br />
single edge dislocation of the previous section. In the<br />
dislocation-reference frame, the dislocation density<br />
tensor αij takes the form:<br />
⎛ 0 0 0⎞<br />
⎜ ⎟ with b1<br />
αij=<br />
0 0 0 α ij=<br />
α 31=<br />
δ(<br />
x2)<br />
⎜ ⎟<br />
H<br />
⎝α<br />
31 0 0⎠<br />
H is the average distance between dislocations (in x1<br />
direction). b1 is the Burgers vector component in x1<br />
direction (in the dislocation reference frame).<br />
Distortion field components are deduced from<br />
integration of:<br />
β x ) = α ˛ C G ( x - x¢<br />
) dx¢<br />
(10)<br />
18<br />
ij ( hm jnh pqmn ip,<br />
q<br />
V<br />
We examine in figure 2 the distortion fields of UDD<br />
configuration as a function of H. Same data as the<br />
single dislocation treatment (e.g. Poisson’s ratio ν and<br />
Burgers vector modulus) is considered.<br />
(a)<br />
(b)<br />
0<br />
-0.01<br />
-0.02<br />
-40<br />
-0.004<br />
-0.006<br />
-0.008<br />
-0.01<br />
x1<br />
-30<br />
x1<br />
-150<br />
-100<br />
-20<br />
-50<br />
-10<br />
20<br />
20<br />
40<br />
40<br />
60<br />
60<br />
80<br />
80<br />
100<br />
100<br />
Fig. 2. Distortion fields β11(x1,x2) for the considered<br />
UDD configuration - H=50 Å (a ) and 200 Å (b).<br />
It can observed that when the distance between<br />
dislocations increases from H=50 to 200 Å, the<br />
β11(x1,x2) component of t he distortion fields decreases.<br />
This is a confirmation of the short-range interaction<br />
phenomena between dislocations [16, 17]. Therefore,<br />
the micromechanical theory predicts the long-range<br />
strain and stress for a single dislocation (without<br />
interaction). But it is not the case for dislocation<br />
x2<br />
x2<br />
configurations (group of dislocations with interaction),<br />
where we reduced this effect of long-range to shortrange<br />
(sometimes mean-range). When H is close to<br />
zero (H=0.1 Å), the estimated fields are close to those<br />
of the single dislocation case, so that our approach is<br />
validated. The results are close but not exactly the<br />
same as interaction between dislocations is considered.<br />
C<strong>ON</strong>CLUSI<strong>ON</strong><br />
A micromechanical deterministic approach, which<br />
utilizes the crystallographic physics, was developed in<br />
order to determine the distortion fields associated with<br />
a dislocation configuration. This approach provides one<br />
the possibility to relate the estimated elastic distortion<br />
with the X-ray scattering intensity. It is worth noting<br />
that it is not necessary to separately calculate contrast<br />
factors [7, 10, 14]. The need for studying the real<br />
dislocations configurations (dislocation dipole, pile-up,<br />
dislocation arrays or dislocation cell-walls) forces us to<br />
utilize more realistic tools based on the average aspect<br />
to describe our configurations.<br />
In prospects, the case of the anisotropic elasticity of<br />
cubic crystal must be developed. Then, for a better<br />
explanation of the broadening measurement, future<br />
work will consider an inverse approach for<br />
dislocation microstructures identification by<br />
coupling the experiment with the modelling.<br />
REFERENCES<br />
[1] Mura T., 1987. Micromechanics of defects in solids.<br />
Mart. Nij. Publishers, Kluwer, Dordrecht, The<br />
Netherlands.<br />
[2] Nabarro F. R. N., 1983. Dislocation in solids. North<br />
Holland, Amsterdam.<br />
[3] Hirth J.P., Lothe J., 1968. Theory of dislocations.<br />
McGraw-Hill, New York.<br />
[4] Teodosiu C., 1982. Elastic models Of crystal deffects.<br />
E.A. Bucharest & Spring.-Verlag.<br />
[5] Warren B.E., 1990. X-ray diffraction. Dover Pub, New<br />
York.<br />
[6] Wilkens M., 1979. J. Appl. Cryst. 12, 119-125.<br />
[7] Ungar T., 2001. Mat. Sci. & Eng. A309-310, pp. 14-22.<br />
[8] Gaal I., 1994. Internal paper.<br />
[9] Van Berkum J.G.M., Delhez R., Keijser T.H., Mittemeijer<br />
E.J., 1996. Mat. Science. Forum, Vol. 228-231, pp. 11-<br />
18.<br />
[10] Groma I., 1998. Physical Review B 57, pp. 7535-7542.<br />
[11] Klimanek P., 1991. Mat. Science. Forum Vol. 79-82, pp.<br />
73-84.<br />
[12] Kröner E., 2001. Int. J. of Sol. and Str. 38, pp. 1115-<br />
1134.<br />
[13] Raabe D., 1996. Philosop. Mag, A 73, No 5, pp. 1363-<br />
1383.<br />
[14] Ghiath M., 1999. Phd Thesis. Ensam Paris.<br />
[15] Ghiath M., Bacroix B., Lebrun J.L., 1999. Proceeding of<br />
the 5 th ECRS. Delft, Netherlands.<br />
[16] Kocks U.F., Scattergood R.O., 1969. Acta. Met. Vol. 17,<br />
pp. 1161-1168.<br />
[17] Kroupa F., 1994. Key Eng. Mat., Vols. 97-98, pp. 377-<br />
382.
The Correlation between <strong>Line</strong> Broadening<br />
and the Elastic Properties of Crystals<br />
Tamás Ungár and Géza Tichy*<br />
Department of General Physics and *Department of<br />
Solid State Physics,<br />
Eötvös University, Budapest, P.O.Box 32, H-1518,<br />
Hungary<br />
ungar@ludens.elte.hu<br />
STRAIN ANISOTROPY<br />
Strain anisotropy in powder diffraction means that<br />
neither the breadths nor the Fourier coefficients of the<br />
diffraction profiles in the Williamson-Hall plot [1] or<br />
the Warren-Averbach method [2] are monotonous<br />
functions of the modulus or the square of the<br />
diffraction vector, g or g 2 , where g=2sinθB/λ, and θB<br />
and λ are the Bragg angle and the wavelength of<br />
radiation, respectively [3-9]. Diffraction peaks broaden<br />
either when the crystallites become small or when the<br />
crystals contain lattice defects. The two effects usually<br />
occur together, however, they can be separated since<br />
the size effect is diffraction order independent (at least,<br />
as long as shape is more or less isotropic), whereas<br />
strain broadening increases with g. In the kinematical<br />
theory of diffraction the physical profile of a Bragg<br />
reflect ion (I F ) is given by the convolution of the size<br />
(I S ) and the strain (I D ) profiles: I F =I S *I D . The Fourier<br />
transform of this is the Warren-Averbach equation [2]:<br />
ln A(L) ≅ ln AL S - 2π 2 L 2 g 2 , (1)<br />
where A(L) and AL S are the absolute values of the<br />
Fourier coefficients of I F and I S , and < εg,L 2 > is the mean<br />
square strain in the g direction. L is the Fourier length<br />
defined: L=na3, a3=λ/2(sinθ2-sinθ1), n are integers and<br />
(θ2,θ1) is the angular range in which the diffraction<br />
profile is measured. Let us define a Cartesian<br />
coordinate system with the unit vectors: s1, s2, s3, and<br />
its origin in the hkl reciprocal lattice node where s1 is<br />
parallel to g. The reciprocal space vector in the vicinity<br />
of g is: K=g+ξ1s1+ξ2s2+ξ3s3. The intensity distribution<br />
in the hkl reciprocal lattice node is a scalar-vector<br />
function: I(ξ1,ξ2,ξ3). In powder diffraction experiments<br />
carried out in the usual θ-2θ regime the diffraction<br />
profiles are automatically integrated over ξ 2 and ξ 3:<br />
I F = ∫ 2 3 ξ Id ξ d . In a single crystal experiment care has<br />
to be taken in order to fulfil this integration. Distortion<br />
is defined by the lattice vectors of the mth atoms:<br />
rm=Rm+um, where Rm is the lattice vector of the<br />
average or undistorted lattice site and um is the<br />
displacement vector. We define the vector r=r1s1+ r2s2+<br />
r3s3 in real space over the base s1, s2, s3. With this the<br />
longitudinal component of the strain tensor parallel to g<br />
is: εg= ∂ / ∂r1<br />
(gu)/g. The spatial average of the square<br />
of εg is the mean square strain:<br />
==,<br />
where b=gradu is the distortion tensor and grad is<br />
carried out over r1, r2 and r3. Here we note that the<br />
Fourier variable L is also defined in the r space given<br />
above. It can be seen that is a homogeneous<br />
zeroth order function of the diffraction vector which<br />
depends only on the direction of g and is independent<br />
of its length. Eq. (1) shows that the strength of strain<br />
broadening is proportional to g 2 . The deviation<br />
from the monotonous g 2 dependence, incorporated in<br />
is strain anisotropy. g 4 is a fourth order<br />
polynomial of the hkl indices: g 4 =P4(h,k,l). In a<br />
powder specimen P4(h,k,l ) becomes independent of<br />
those hkl permutations which correspond to the same d<br />
values. For this reason, in the fourth order polynomial<br />
of g 4 only the fourth order invariants of the hkl<br />
indices will appear. These, however, have to satisfy the<br />
symmetry of the particular crystal structure. The 4th<br />
order invariants of hkl can be found in the book of Nye<br />
[10] and have been recompiled by Popa [11]. In cubic<br />
crystals the only non-trivial 4th order invariant of hkl<br />
is: h 2 k 2 +h 2 l 2 +k 2 l 2 . Especially, in cubic crystals the mean<br />
square strain has the hkl dependence [12]:<br />
= A+B[(h 2 k 2 +h 2 l 2 +k 2 l 2 )/(h 2 +k 2 +l 2 ) 2 ], (2)<br />
where A and B are constants. The derivation up to this<br />
point has been completely general and no assumption<br />
has been made either about the character of strain or<br />
the elastic properties of the crystal. Stephens [8] starts<br />
from the variance of 1/d 2 , Stokes and Wilson [11] use<br />
simple plasticity and both arrive at the same result as<br />
presented here. The two constants, A and B, can be<br />
determined from experiment. Their physical<br />
interpretation needs, however, further discussion of the<br />
origin of microstrain.<br />
THE DISLOCATI<strong>ON</strong> MODEL OF STRAIN<br />
Experiment shows that the mean square strain is never<br />
independent neither of g nor of L, cf. [13]. The L<br />
dependence reveals a double singularity, at small L<br />
values diverges logarithmically and at large L<br />
values it decreases like 1/L, latter indicating the long<br />
range character of the mean square strain. Krivoglaz<br />
[14], Wilkens [15], Gaál [16], Groma et al. [17],<br />
vanBerkum et al. [18], Levine and Thomson [19] and<br />
Groma [20], Kamminga and Delhez [21], all have<br />
shown that this particular behaviour of the mean square<br />
strain indicates that the major contribution of strain to<br />
diffraction peak broadening comes from dislocations.<br />
The mean square strain of a dislocated crystal can be<br />
given as [15]:<br />
=(b/2π) 2 πρCf(η) , (3)<br />
where η=L/Re, Re is the effective outer cut off radius of<br />
dislocations. f(η) is the Wilkens function as given in<br />
eqs. A.6 to A.8 in [15], it starts logarithmically for<br />
small η values and ends hyperbolically for large η<br />
values . The constant C depends on the relative<br />
orientation between the Burgers - and line vectors of<br />
dislocations and the diffraction vector and on the<br />
character of dislocations, e.g. edge or screw in cubic, or<br />
19
asal, prismatic or pyramidal in hexagonal crystals<br />
[22,23]. Equation (2) allows to factorise the mean<br />
square strain into g and L dependent parts:<br />
=C, where = f(η). In an untextured<br />
cubic polycrystal or powder specimen C can be<br />
averaged over the permutations of hkl:<br />
C =A'+B'[(h 2 k 2 +h 2 l 2 +k 2 l 2 )/(h 2 +k 2 +l 2 ) 2 ]. (4)<br />
C is called the average dislocation contrast factor in<br />
analogy with the term used in electron microscopy. It<br />
can be given as:<br />
C = C h00(1-qH 2 ), (5)<br />
where C h00 is the average dislocation contrast factor<br />
of the h00 type reflections, q=-B'/A' and<br />
H 2 =(h 2 k 2 +h 2 l 2 +k 2 l 2 )/(h 2 +k 2 +l 2 ) 2 . The values of C h00<br />
and the q parameter can be obtained numerically for<br />
different dislocation types as functions of the elastic<br />
properties of a crystal [22,23]. A powder diffraction<br />
experiment provides experimental values for both,<br />
C h00 and q. From eq. (3) it is clear, however, that the<br />
experimental value of C h00 depends on the absolute<br />
value of the dislocation density, ρ. The only parameter<br />
in eq. (5) which is well defined by strain anisotropy is<br />
q. It is a function of: (i) the type of dislocations and (ii)<br />
the ratios of the elastic constants of the crystal<br />
[12,22,23]. For this reason there are two ways in which<br />
the experimental values of q can be used: (a) if the<br />
elastic constants are known the dislocation structure or<br />
character can be deduced or, (b) if the elastic constants<br />
are unknown than, by making some assumptions about<br />
the dislocation structure or character, certain ratios of<br />
the elastic constants can be deduced. It is important to<br />
note that q=-B'/A'=-B/A which means that the<br />
experimental strain anisotropy parameters provided by<br />
the analysis of Stephens [8] can also yield the ratios of<br />
the elastic constants. As a specific example we take the<br />
values of S400=3.43x10 -8 and S220=-1.13x10 -8 for the fcc<br />
Rb3C60 specimen from Table 3. in [8]. Simple algebra<br />
provides q=-3.035.<br />
q<br />
-20<br />
0.1 0.2 0.3 0.4 0.5<br />
Az Fig. 1. q as a function of the anisotropy constant,<br />
Az=2c44/(c11-c12), for different dislocations and c11/c12<br />
ratios.<br />
20<br />
0<br />
-5<br />
-10<br />
-15<br />
b=a/2<br />
screw<br />
edge c 12 /c 44 =3<br />
edge c 12 /c 44 =0.5<br />
edge c 12 /c 44 =1<br />
edge c 12 /c 44 =2<br />
Figure 1 shows the values of q as a function of the<br />
anisotropy constant, Az=2c44/(c11-c12), for the simplest<br />
dislocation type in fcc crystals with Burgers vectors<br />
a/2, for different c11/c12 ratios and for screw and<br />
edge character, respectively [23]. Fro m Figure 1 we<br />
conclude that the elastic anisotropy of Rb3C60 is:<br />
Az=0.4+0.1.<br />
REFERENCES<br />
[1] Williamson, G. K. & Hall, W. H., 1, 22-31 (1953)<br />
[2] Warren, B. E. and Averbach, B. L., J. Appl. Phys.<br />
21, 595 (1950)<br />
[3] Caglioti, G., Paoletti, A. and Ricci, F. P., Nucl.<br />
Instrum. 3, 223-228 (1958)<br />
[4] Ungár, T. and Borbély, A., Appl. Phys. Lett., 69,<br />
3173-3175 (1996)<br />
[5] Le Bail, A. & Jouanneaux, A., J. Appl. Cryst., 30,<br />
265-271 (1997)<br />
[6] Scardi, P. & Leoni, M., J. Appl. Cryst., 32, 671-<br />
682 (1999)<br />
[7] Dinnebier, R. E., Von Dreele, R., Stephens, P. W.,<br />
Jelonek, S. & Sieler, J., J. Appl. Cryst., 32, 761-<br />
769 (1999)<br />
[8] Stephens, P. W., J. Appl. Cryst, 32, 281-288 (1999)<br />
[9] Cheary, R. W., Dooryhee, E., Lynch, P.,<br />
Armstrong, N. & Dligatch, S., J. Appl. Cryst.,<br />
33,1271 -1283 (2000)<br />
[10] J. F. Nye, Physical Properties of Crystals, their<br />
Representation by Tensors and Matrices , Oxford<br />
Clarendon Press, 1957.<br />
[11] A.R.Stokes and A.J.C.Wilson, Proc. Phy. Soc.<br />
London, 56, 174 -181 (1944)<br />
[12] T. Ungár & G. Tichy, Phy s. Stat. Sol. (a) 171, 425<br />
(1999)<br />
[13] J. van Berkum, PhD Thesis, Technical University<br />
Delft, Holland, 1994.<br />
[14] M. A. Krivoglaz, in Theory of X-ray and Thermal<br />
Neutron Scattering by real Crystals, Plenum<br />
Press, N. Y. 1969; and in X-ray and Neutron<br />
Diff raction in Nonideal Crystals, Springer-Verlag,<br />
Berlin Heidelberg New York, 1996.<br />
[15] Wilkens, M., in Fundamental Aspects of<br />
Dislocation Theory, ed. J. A. Simmons, R. de<br />
Wit, R. Bullough, Vol. II. Nat. Bur. Stand. (US)<br />
Spec. Publ. No. 317, Washington, DC. USA, pp.<br />
1195-1221 (1970)<br />
[16] Gaál, I., in Proc. 5th Riso Int. Symp. on<br />
Metallurgy and Material Science, eds. N.H.<br />
Andersen, et al., Riso Nat. Lab., Roskilde,<br />
Denmark, p. 249-254. (1984)<br />
[17] I. Groma, T. Ungár, and M. Wilkens, J. Appl.<br />
Cryst. 21, 47 (1988)<br />
[18] van Berkum, J. G. M., Vermuelen, A. C., Delhez,<br />
R., de Keijser, T. H. and Mittemeijer, E. J. J.<br />
Appl. Cryst. 27, 345-357 (1994)<br />
[19] Levine, L. E. and Thomson, R., Acta Cryst. A, 53,<br />
590 (1997)<br />
[20] Groma, I., Phys. Rev. B, 57, 7534-7542 (1998)<br />
[21] Kamminga, J. D. & Delhez, R., J. Appl. Cryst. 33,<br />
1122-1127 (2000)<br />
[22] T. Ungár, I. Dragomir, Á. Révész and A. Borbély,<br />
J. Appl. Cryst. 32 992 (1999)<br />
[23] I. Dragomir and T. Ungár, Powder Diffraction,<br />
17, 104-111 (2002)
Surface relaxation in nano-sized powders<br />
Matteo Leoni, Paolo Scardi<br />
Dipartimento di Ingegneria dei Materiali e Tecnologie<br />
Industriali, Università di Trento<br />
38050, via Mesiano, 77, Trento, Italy<br />
Matteo.Leoni@ing.unitn.it<br />
Nanocrystalline materials usually exhibit unusual<br />
properties when compared to their coarse-grained<br />
counterparts. From the X-ray diffraction point of view,<br />
frequently observed is the increase (decrease) of the<br />
unit cell parameter when decreasing the grain size,<br />
often interpreted in terms of oxygen incorporation or<br />
stoichiometry variations 2 (cf. [1] and refs. Therein).<br />
Seldom considered, yet alternative, is the presence of<br />
Grain Surface Relaxation (GSR). To lower their<br />
energy, the atoms next to a surface tend to shift from<br />
their regular lattice positions: the variation is followed<br />
by the majority of sub-surface atoms, thus mimicking a<br />
unit cell parameter change.<br />
Full-pattern structural (Rietveld method [2]) and<br />
microstructural (Whole Powder Pattern Modelling,<br />
WPPM [3,4]) refinement techniques do not<br />
traditionally consider any GSR phenomenon. A Fourier<br />
formalism, following the ideas of Warren and Bertaut<br />
[5], has been therefore introduced to bridge the gap [1]<br />
and is briefly introduced here. This approach permits<br />
the diffraction profile to be synthesised from first<br />
principles, without recurring to arbitrary bell-shaped<br />
profile functions.<br />
A lognormal distribution of spherical crystallites, taken<br />
as independent coherent scatterers, is considered. To<br />
simplify the mathematics involved, each crystallite is<br />
supposed as made of concentric hollow cylinders<br />
aligned along the scattering direction, each of them<br />
made of columns of blocks (as in Fig. 1).<br />
a1<br />
a3<br />
Fig. 1. Subdivision of a grain into concentric cylinders<br />
made of columns of blocks. For clarity only a single<br />
column is shown. Because of surface relaxation, the<br />
blocks are displaced from their regular lattice<br />
positions.<br />
2 Associated to this is a broadening of line profiles caused by the<br />
reducing size of coherent domains.<br />
a2<br />
For symmetry reasons, the total scattering along the<br />
cylinders’ axis (i.e. parallel to a3) can be calculated by<br />
considering the scattering of just one column of blocks<br />
for each cylinder, taken with a proper weight [1].<br />
The problem therefore reduces to calculating the<br />
scattering power for a column of blocks arranged on a<br />
stretched lattice. The stretching Δz, nil when surface<br />
relaxation is absent, is a function of the coordinate z<br />
along a3 as:<br />
zmax ( r ) −z<br />
z −<br />
Δ zrz ( , ) = ξ e κ<br />
z<br />
where ξ is the maximum stretch (i.e. maximum cell or<br />
atom position shift from the regular lattice), 2 zmax(r) is<br />
the length of the column sitting at a distance r from the<br />
centre of the grain and κ is a relaxation decay constant.<br />
An example of the relaxation function is shown in Fig.<br />
2 for grains of 1 and 10 nm in diameter, respectively.<br />
The proposed model is of course suitable to describe a<br />
lattice contraction as well (by changing the sign of ξ).<br />
Δz (normalised)<br />
1.0<br />
0.8<br />
0.6<br />
0.4<br />
0.2<br />
0.0<br />
-5 -4 -3 -2 -1 0 1 2 3 4 5<br />
Relative position (nm)<br />
Fig. 2. Lattice spacing stretching versus position along<br />
crystallite radius for grains of 1 and 10 nm in<br />
diameter, respectively (ξ=1.0; κ=0.1). Horizontal lines<br />
marks the corresponding average shift.<br />
Taking this stretching into account, the correlation<br />
between couples of cells along the column at various<br />
(Fourier) distances n must be considered [3,5]:<br />
SR N n<br />
SR Nn<br />
An = cos2πLZn Bn =− sin2πLZn N<br />
N<br />
3<br />
where Zn is the distance between the two cells and<br />
indicates average over all n-distant couples. In this<br />
formulation, both relaxation and size effects are<br />
simultaneously taken into account. Besides size and<br />
relaxation effects, using the WPPM approach [3] other<br />
Fourier components relative to other sources of<br />
broadening can be simultaneously considered.<br />
The profile can be finally calculated from the Fourier<br />
A and SR<br />
B as:<br />
coefficients SR<br />
n<br />
n<br />
∞<br />
* ( ) ∝ ∑ { cos2π 3 + sin2π<br />
3}<br />
I d A nh B nh<br />
SR SR SR<br />
hkl n n<br />
n=−∞<br />
where h3 is a relative coordinate in the reciprocal space<br />
(cf. [1]).<br />
Peak intensities can be left as free parameters (as in<br />
WPPM) or bounded to a structural model (as in the<br />
Rietveld method) [4]. A nonlinear least squares routine<br />
is in both cases used to fit the m odel to the data.<br />
3<br />
21
The calculation is lengthy as it should be carried out<br />
for all cylinders of all grains in the powder.<br />
Nevertheless, with the aid of fast numerical algorithms,<br />
a peak can be synthesized in one second (program<br />
compiled with Compaq Visual Fortran Pro ver. 6.6 and<br />
running on an AMD Athlon XP 2000+ processor).<br />
The performance of the algorithm has been tested on<br />
cerium oxide (CeO 2). Nanocrystalline powder was<br />
synthesised using a sol-gel technique [6]: different heat<br />
treatments have been studied and the result for a<br />
sample calcinated for 1h at 400°C is shown here (Fig.<br />
3). The agreement, witnessed by the small residual, is<br />
quite good; it is worth noting that the cell parameter<br />
was fixed to a = 0.541134(12) nm, value reported in<br />
the JCPDS-PDF card #34-0394 (http://www.icdd.com ).<br />
The refinement was done in the GSR -Rietveld mode,<br />
i.e. constraining peak intensities to a structural model<br />
and peak shape to a microstructural model. Conversely,<br />
a traditional refinement (Rietveld or WPPM) fails<br />
unless a larger, average unit cell parameter is used.<br />
Intensity (counts)<br />
Fig. 3. Experimental (open dots) and refined pattern<br />
using the GSR-Rietveld algorithm (line). The difference<br />
between raw data and refinement (residual) is also<br />
shown.<br />
unit cell parameter (nm)<br />
Fig. 4. Average unit cell parameter versus grain size<br />
for the (refined) grain size distribution shown.<br />
22<br />
8000<br />
6000<br />
4000<br />
2000<br />
0<br />
0.5440<br />
0.5435<br />
0.5430<br />
0.5425<br />
0.5420<br />
0.5415<br />
20 40 60 80 100 120 140<br />
2θ (degrees)<br />
ICDD-PDF #39-0349<br />
0.5410<br />
0.0<br />
0 2 4 6 8 10 12 14<br />
D (nm)<br />
0.3<br />
0.2<br />
0.1<br />
Grain fraction<br />
Fig. 4 shows the effect of surface relaxation on grains<br />
of different sizes and the corresponding weight given<br />
by the grain size distribution: smaller grains are more<br />
affected (high surface/volume ratio), thus their average<br />
unit cell parameter is intrinsically higher.<br />
The <strong>XRD</strong> results seems confirmed by other techniques.<br />
For example, Fig. 4 shows a Transmission Electron<br />
Microscopy (TEM) micrograph of a ceria grain: the<br />
interplanar distance increases when running from the<br />
middle to the outer surface of the grain.<br />
Fig. 4. TEM micrograph showing surface relaxation in<br />
a grain of ceria (outer planes show larger spacing [1])<br />
A further confirmation can be found in a recent paper<br />
of Wu et al. [7] where an analogous effect (a core-<br />
shell structure for the grains) is introduced to describe<br />
the EXAFS patterns of nanocrystalline ceria. Even if<br />
not directly comparable, the two results agree both in<br />
sign and order of magnitude, possibly validating the<br />
present approach.<br />
C<strong>ON</strong>CLUSI<strong>ON</strong>S<br />
Powder diffraction can account for surface relaxation<br />
effects in order to explain the anomalous trend of the<br />
average cell parameter observed when reducing the<br />
grain size to the nanometre range. To this, a Fourier<br />
formalism has been developed and implemented in the<br />
WPPM and Rietveld frames to synthesise and refine a<br />
diffraction pattern constraining the cell parameter to<br />
the single-crystal (or coarse grained-powder) value.<br />
Diffraction results are supported by TEM observation.<br />
REFERENCES<br />
[1] M. Leoni, P. Scardi in “Diffraction <strong>Analysis</strong> of the<br />
Microstructure of Materials”, Ed. P. Scardi & E.J.<br />
Mittemeijer, Springer Verlag (Berlin), 2003.<br />
[2] R.A. Young, “The Rietveld Method”, Oxford<br />
University Press (New York), 1993).<br />
[3] P. Scardi, M. Leoni, Acta Cryst. A58 (2002) 190.<br />
[4] P. Scardi, Z. Kristallogr. 217 (2002) 420.<br />
[5] B.E. Warren “X -ray diffraction”, 2 nd edition,<br />
Dover (New York), 1990 (1 st edition, Addison<br />
Wesley, Reading, Mass., USA, 1969)<br />
[6] R. Di Maggio, P. Scardi, M. Leoni. In preparation<br />
[7] Z. Wu, L. Guo, H. Li, Q. Yang, Q. Li, H. Zhu,<br />
Mat. Sci. Eng. A286 (2000) 179.
Powder Diffraction Pattern Of Stacking<br />
Faulted Crystal<br />
E. Estevez-Rams a , B. Aragon-Fernandez b ,<br />
H. Fuess c<br />
a Instituto de Materiales y Reactivos, Universidad de la<br />
Habana, San Lazaro y L. Cp 10400. C. Habana. Cuba.<br />
b Instituto de Investigaciones Metalúrgicas, Ave. 51, #<br />
23611 e/236 y240, San Agustín,La Lisa,C Habana Cuba<br />
c University of Technology Darmstadt. Institute for<br />
Materials Science,Petersenstr. 23 D-64287 Darmstadt<br />
Email: eerams@yahoo.com, estevez@imre.oc.uh.cu<br />
INTRODUCTI<strong>ON</strong><br />
Stacking faulted crystals have been extensively studied<br />
by X-ray diffraction, the reason for that is the well<br />
known fact that planar faulting shift and broadens the<br />
diffraction reflections as well as producing asymmetric<br />
peak profiles. Early treatment of diffraction in stacking<br />
faulted crystals were developed by a number of authors<br />
and a review of the early developments can be found in<br />
[1]. In a broad sense, the approximations towards<br />
diffraction effects of planar faulting can be classified<br />
in two types, those which derive a set of observable<br />
parameters related to some assumed faulting type<br />
probability and those which use simulation techniques<br />
to match calculated patterns with experimental ones.<br />
From the first approach the well known treatment of<br />
Warren and Wilson based on difference equations [2]<br />
(and further development by Jagodzinski and a number<br />
of authors, see [1] for references) is still widely used<br />
for its simplicity, relating measured parameters of the<br />
diffraction pattern with several faulting probabilities.<br />
From the second approach different Monte Carlo<br />
schemes have been put forward where crystals are<br />
“grown” in a computer with a priori faulting<br />
probabilities until a match is found with the<br />
experimental pattern [3].<br />
Warren´s approach makes a series of strong<br />
simplifying assumptions in order to relate peak<br />
parameters with simple cases of planar faulting,<br />
namely deformation and twinning faults. The resulting<br />
relations are limited in applicability and have to be<br />
worked out for each particular structure and faulting<br />
type. It has been pointed out that even in the case of<br />
low faulting probability, it is controversial were the<br />
calculated deformation and twin faulting probabilities<br />
are correct even predicting the faulting trend [4].<br />
Monte Carlo approaches are useful for investigating<br />
more complex faulted structure, yet they still rely on<br />
the ingenuity of the researcher to propose a faulting<br />
model fit for the investigated sample. Simulation<br />
approaches are indirect in nature: they depend on trial<br />
and error procedures, making little use of the observed<br />
experimental data up to the last stages of analysis were<br />
comparison is performed.<br />
Both, difference equation methods and current<br />
simulation approaches, are to be considered to be<br />
faulting models: an underlying structure is assumed<br />
and faulting is seen as a perturbation to the otherwise<br />
perfect ordering along the stacking direction. Faulting<br />
models are at least dubious in their applicability to<br />
phase transformations between polytypes, involving<br />
only reordering of the layers sequence order, and in<br />
heavy faulted structure. In both cases it is not<br />
physically clear which underlying perfect periodic<br />
sequence should one consider.<br />
Recently a different approach has been proposed for<br />
analysing diffraction patterns of faulted crystal [5]. The<br />
approach is based on the determination of the pair of<br />
layers probability correlation functions directly from<br />
the diffraction pattern through a Fourier series, which<br />
in the case of powder diffraction reduces to a cosine<br />
series. The Fourier coefficients are related linearly to<br />
the correlation probability functions (Ps(D)). From the<br />
Ps(D) functions other parameters can be defined which<br />
can be related to more used faulting parameters if<br />
needed.<br />
THE PROBABILITY CORRELATI<strong>ON</strong> FUNCTI<strong>ON</strong><br />
The probability correlation function Ps(D) is defined as<br />
the probability of finding two layers, Δ-layers apart,<br />
and laterally (in the sense of perpendicular to the<br />
stacking direction) displaced, one with respect to the<br />
other, a integer number s of times a minimum<br />
displacement vector.<br />
P 0<br />
P 0<br />
1.0<br />
0.8<br />
0.6<br />
0.4<br />
0.2<br />
0.0<br />
1.0<br />
0.8<br />
0.6<br />
0.4<br />
0.2<br />
0.0<br />
0 10 20 30 40 50<br />
D<br />
Fig. 1. The P0(Δ) correlation function for a (a) perfect<br />
FCC structure and for a (b) 0.05 deformation faulted<br />
structure.<br />
To better understand the probability correlation<br />
function Figure 1a shows the corresponding P0(D ) of<br />
the perfect FCC structure. The correlation function is<br />
consistent with the ABCABCAB… ordering, as for<br />
every multiple of three layers, the probability of<br />
finding layers not displaced one with respect to the<br />
other is 1, otherwise being zero.<br />
For faulted crystals the periodic behaviour of the Ps(D )<br />
function is absent, and correlation is lost with<br />
increasing Δ values. Figure 1b shows the P0(D )<br />
function for a 0.05 deformation faulted structure still<br />
for the FCC structure.<br />
(a)<br />
(b)<br />
23
Figure 1b shows two important characteristics of the<br />
correlation function of faulted structure. They consist<br />
of two contributing terms: one periodic of oscillatory<br />
nature and the other a decaying term. From the<br />
decaying term a critical Δc length can be defined as the<br />
characteristic correlation length of the system (Figure<br />
2). It can be shown that Δc is related to peak<br />
broadening and asymmetry, while the oscillating term<br />
is related to the shifting of the diffraction peak due to<br />
the faulting.<br />
Fig. 2. The definition of the correlation length as<br />
the characteristic length where correlation between<br />
layers can be considered lost.<br />
THE DIRECT SOLUTI<strong>ON</strong> APPROACH<br />
The determination of the Ps(D) functions from the<br />
diffraction data is direct in nature and full use of the<br />
whole information contained in the diffraction data<br />
is made through the Fourier series decomposition.<br />
The Fourier decomposition obtained is periodic in<br />
the reciprocal variable l (assuming that the stacking<br />
direction is c) and the frequent problem of peak<br />
truncation in Fourier analysis is avoided. Constant<br />
background influence is also avoided by proper<br />
normalization of the probability function under<br />
physical constrains.<br />
It has to be pointed out that in the determination of<br />
the P0(D ) function from the diffraction data no<br />
assumption has to be made about the type of<br />
stacking disorder occurring in the crystal structure,<br />
nor is it limited by the density of faulting.<br />
The introduction of the Δc parameter as a measure of<br />
disorder allows the comparison of different faulted<br />
structures, regardless of the difference of faulting type<br />
between them, and gives a structure insensitive<br />
parameter for faulting measure.<br />
For the case of compact structures the P0(D ) function<br />
also allows the direct determination of the amount of<br />
hexagonality in the structure as the P0(2) value.<br />
Extension to non-compact structures can be easily<br />
made, being the percent of non compact layer<br />
arrangement given by P0(1).<br />
24<br />
I (a.u)<br />
P 0<br />
P 0<br />
P 0<br />
D c<br />
0.8<br />
0.6<br />
0.4<br />
0.2<br />
0.0<br />
0.8<br />
0.6<br />
0.4<br />
0.2<br />
0.0<br />
0.8<br />
0.6<br />
0.4<br />
0.2<br />
0.0<br />
800<br />
600<br />
400<br />
200<br />
In the case needed, the relation between the Δc and<br />
Ps(D ) to other more often used parameters can be made.<br />
For example Δc and peak maximum can be related to<br />
the deformation (ao) and twin (bo) faulting probability<br />
in compact structures. In this case the obtained<br />
probabilities are not affected by the approximations<br />
usually made in, for example, the Warren approach.<br />
It has been shown that from the P0(D) values<br />
representative stacking sequences of the structure can<br />
be reconstructed [6]. The determination of the stacking<br />
sequence allows the use of other distance measures for<br />
a more complete characterization of faulting and<br />
polytype occurrence. Further discussion of this topic is<br />
beyond this short comment and will be published in the<br />
near future.<br />
(113)<br />
(300)<br />
(024)<br />
Ho 2 Co 17<br />
40 50 60<br />
2 q<br />
Dy 2 Co 17<br />
TWO EXAMPLES<br />
Fig. 3. (a) The diffraction pattern of RE2Co17 (RE: rare<br />
earth) affected by stacking faults disorder. (b) The<br />
calculated correlation function of three representative<br />
samples. (c) The correlation length for all studied<br />
samples together with the hexagonal percent.<br />
As an example of the use of the above approach to<br />
compact structures, the experimental diffraction pattern<br />
of a RE2Co17 (RE: rare earth) is shown in Figure 3a .<br />
These binary compounds show a transition from<br />
hexagonal packing for the heavy rare earth to<br />
rhombohedral stacking for the light ones. The pattern<br />
was processed according to the above approach<br />
(practical details of pattern decomposition and<br />
(220)<br />
Nd 2 Co 17<br />
0 100<br />
D<br />
Pr<br />
Nd<br />
Gd<br />
Dy<br />
0<br />
58 60 62 64 66 68 70 72<br />
Z<br />
Tb<br />
Ho<br />
Lu<br />
Hexagonality (%)<br />
100<br />
80<br />
60<br />
40<br />
20<br />
0<br />
Nd<br />
Pr<br />
Gd Tb<br />
Nd<br />
Dy<br />
Ho<br />
58 60 62 64 66 68 70 72<br />
Z<br />
Dy<br />
Ho<br />
Lu
I (a.u.)<br />
A (101)<br />
Decay Term<br />
treatment can be found in [7]) and Figure 3b shows the<br />
P0(D) values for three representative samples. Figure<br />
3c plots the evolution of Δc with the rare earth species.<br />
The heavy nature of faulting in the intermediate rare<br />
earths is immediately seen and a comparison of<br />
faulting for the whole series is made possible by the<br />
use of the Δc value.<br />
100000<br />
80000<br />
60000<br />
40000<br />
20000<br />
0.6<br />
0.4<br />
0.2<br />
0.0<br />
-0.2<br />
-0.4<br />
(100)<br />
(00 1/2)<br />
(110)<br />
(10 1/2)<br />
(200)<br />
(11 1/2)<br />
0<br />
10 20 30 40 50 60<br />
(20 1/2)<br />
(210)<br />
2 q<br />
Fig. 4. (a) Diffraction pattern of WO3. (b) The Fourier<br />
coefficients. (c) The decay term for several diffraction<br />
peaks in a semi logarithmic scale, the correlation<br />
length will be given by the inverse of the slope of each<br />
curve and it was found to be Δc=12 layers.<br />
(300)<br />
(21 1/2)<br />
(001)<br />
(101)<br />
(30 1/2)<br />
(310)<br />
(111)<br />
(201)<br />
(400)<br />
(31 1/2)<br />
(40 1/2)<br />
(211)<br />
-0.6<br />
0 10 20 30 40 50 60 70<br />
1<br />
0.36788<br />
0.13534<br />
0.04979<br />
0.01832<br />
0.00674<br />
D<br />
0 5 10 15 20 25 30 35 40 45<br />
D<br />
(100)<br />
(101)<br />
(111)<br />
The hexagonality percent of the structure can be<br />
calculated from the P0(2) values for each sample.<br />
As another example of the use of the above approach<br />
the WO 3 diffraction pattern obtained form the PowBase<br />
database [8] (and said to be affected by stacking faults)<br />
is shown in Figure 4. This corresponds to a non -<br />
compact structure with space group P6/mmm. The<br />
Fourier coefficient behaviour is shown in Figure 4b.<br />
From the slope of the logarithm of the decaying term,<br />
the Δc value was obtained ( Figure 4c) giving a value<br />
of 12 layers.<br />
EER wish to acknowledge the AvH Foundation for a<br />
Humboldt fellowship where part of this work was<br />
completed. This work was carried out partially<br />
financed by a TWAS research project and an Alma<br />
Mater project from the University of Havana. We also<br />
thank the LNLS at Campinas, Brazil where the<br />
diffraction experiments for the RE2Co17 samples were<br />
made.<br />
REFERENCES<br />
[1] T. R. Welberry, Rep. Prog. Phys., 48 (1985), 1543.<br />
[2] Warren, B. E. X-Ray Diffraction (Addison-Wesley,<br />
1969).<br />
[3] R. Berliner and S. A. Werner, Phys. Rev. B 34<br />
(1986), 3586; R. Berliner, O. Fajen, H. G. Smith, R.<br />
L. Hitterman, Phys. Rev. B 40 (1989), 12086; R.<br />
Berliner and R. J. Gooding, Acta Cryst. 50 (1994),<br />
98.<br />
[4] L. Velterop, R. Delhez, Th. H. Keijser, E. J.<br />
Mittemeijer, D. Reefman, J. Appl. Cryst. 33 (2000),<br />
296<br />
[5] E. Estevez-Rams, J. Martinez, A. Penton-Madrigal,<br />
R. Lora Serrano, Phys. Rev. B, 63 (2001), 54109.<br />
[6] E. Estevez -Rams, Private Communication (2002).<br />
[7] E. Estevez-Rams, A. Penton-Madrigal, R. Lora<br />
Serrano, J. Martinez, J. Appl. Crys., 34 (2001), 730.<br />
[8] PowBase can be freely accessed at:<br />
http://pcb4122.univ-lemans.fr/cgi-bin/powbase.pl<br />
25
News from the<br />
International Centre for Diffraction Data<br />
(ICDD)<br />
12 Campus Boulevard www.icdd.com<br />
Newtown Square, PA 19073-3273, U.S.A. www.dxcicdd.com<br />
Phone: +610.325.9814 www.ixas.org<br />
Fax: +610.325.9823 E-mail: info@icdd.com<br />
2002 Denver X-ray Conference<br />
The 51st Denver X-ray Conference was held in Colorado<br />
Springs, Colorado from 29 July to 2 August, attracting nearly<br />
300 registered attendees and over 200 exhibit personnel.<br />
Front: Eileen Jennings, Donna Barry: Middle: Bob Snyder,<br />
Sheila Snyder, Terry Maguire, Denise Flaherty, Jim Kaduk,<br />
Leah Mooney. Back: Cam Hubbard<br />
The Plenary Session, “Applications of X-ray <strong>Analysis</strong> to<br />
Forensic Materials”, was organized by Dr. David F. Rendle,<br />
of The Forensic Science Service, Metropolitan Laboratory,<br />
London, UK and the late Dr. Ron Jenkins, Emeritus, International<br />
Centre for Diffraction Data, Newtown Square,<br />
PA. The Plenary Session presented a series of fascinating<br />
criminal investigations where X-ray analysis provided key<br />
evidence in the solution of a crime. Invited talks presented<br />
during the Plenary Session were: “X-ray <strong>Analysis</strong> in the<br />
U.S. Customs Laboratories”, M.H. Liberman, US Customs<br />
Laboratory, San Francisco, CA; “Underkarat Jewelry: The<br />
Perfect Crime? Investigations and <strong>Analysis</strong> of Jewelry Using<br />
XRF”, D. Kloos, Industry Consultant, Westminster, CA;<br />
“X-ray Diffraction <strong>Analysis</strong> in the Forensic Science Laboratory<br />
of Stuttgart, Germany—The Last Resort in Many<br />
Criminal Cases”, W. Kugler, Forensic Science Laboratory,<br />
Stuttgart, Germany; “Portable XRF for Forensic Investigations”,<br />
D.C. Ward, Federal Bureau of Investigation, Washington,<br />
DC; “Use of X-rays in the United Kingdom<br />
Forensic Science Service”, D.F. Rendle, The Forensic Science<br />
Service, London, UK and “<strong>XRD</strong> at the FBI: The<br />
Three C’s of Forensic Science”, M.C. Bottrell, Federal<br />
Bureau of Investigation, Washington, DC.<br />
The following awards were presented during the<br />
Plenary Session: 2002 Birks Award to Michael Mantler,<br />
Vienna University of Technology, Vienna, Austria; 2002<br />
Jerome B. Cohen Student Award to Jay C. Hanan, The California<br />
Institute of Technology, Pasadena, CA and the 2002<br />
McMurdie Award to Camden R. Hubbard, Oak Ridge<br />
National Laboratories, Oak Ridge, TN.<br />
Forty-two companies exhibited at the conference, displaying<br />
their various products and services for X-ray powder<br />
diffraction and X-ray fluorescence spectrometry. The<br />
ICDD would like to thank the vendors who participated at<br />
the conference and also sponsored evening receptions: Bede<br />
Scientific, Bruker AXS, Corporation Scientifique Claisse,<br />
Materials Data, Inc., PANalytical (formerly Philips Analytical),<br />
Rigaku/MSC and SPEX CertiPrep.<br />
PP<strong>XRD</strong>-2<br />
The ICDD organized the 2nd Pharmaceutical Powder Xray<br />
Diffraction Symposium, PP<strong>XRD</strong>-2, which was held in<br />
Concordville, Pennsylvania, USA on 9–12 December<br />
2002. Hosting over 70 participants, the Symposium<br />
focused on high-throughput crystallization and screening,<br />
polymorph characterization, and powder pattern indexing.<br />
The attendance was truly international with half the participants<br />
coming from 12 different countries. The first three<br />
days were dedicated to technical sessions and round table<br />
discussions. A companion, hands-on workshop, held on the<br />
fourth day at ICDD Headquarters in nearby Newtown<br />
Square, concluded the symposium.<br />
The first day was dedicated to acquisition and analysis of<br />
XRPD data. Creative approaches in pre-formulation and<br />
formulation were discussed. A comparative analysis<br />
between brand name drugs and generic drugs was given.<br />
Several presentations discussed the advantages of capillary<br />
sample holders, especially with single characteristic wavelength<br />
monochromators and parallel beam geometries.<br />
Polymorph characterization was the main focus during the<br />
second day. Results from challenging problems, including,<br />
for example, determining the dynamics of dehydration in<br />
indapamide hemihydrate, using “clustering” of low-quality<br />
XRPD patterns for phase identification, characterization of<br />
four polymorphs of fananserine, and high-throughput crystallization<br />
techniques that allowed up to ~300 crystallizations<br />
per day for a single lead compound were also clearly<br />
explained. The fananserine work showed the opportunity to<br />
connect structural results from X-ray powder diffraction<br />
with thermodynamic properties. Studies using structure
determination techniques were discussed on a wide range of<br />
examples including zopiclone, anhydrous caffeine (Z'=5)<br />
and a compositionally disordered form of ranitidine HCl<br />
form 2. Strong contributions from academia, the pharmaceutical<br />
industry, analytical laboratories, equipment<br />
manufacturers and database organizations were evident in<br />
all sessions.<br />
The third day session on regulatory and patent issues<br />
focused on a number of well-known litigation cases including<br />
cefadroxil and ranitidine hydrochloride. The discussion<br />
centered on distinguishing differences between how courts<br />
interpret X-ray diffraction patents and how scientists interpret<br />
X-ray powder diffraction patterns. This session ended<br />
with several tutorial talks on SAXS and SANS, where<br />
contrast matching and other techniques to characterize<br />
length scale distributions up to several thousand<br />
Angstroms were discussed.<br />
The companion workshop, held on 12 December 2002<br />
included practical guides to powder pattern indexing and a<br />
discussion on round robins that can be used to help<br />
researchers compare their instrument performance with<br />
others in the pharmaceutical industry. The workshop registrants<br />
participated in hands-on exercises, focused on the use<br />
of in-house XRPD methods and practices. Discussions<br />
included the critically important results that can be<br />
obtained from synchrotron-based sources.<br />
High-quality data collection and data analysis were common<br />
themes in most PP<strong>XRD</strong>-2 presentations.<br />
New Product Release:<br />
PDF-4/Organics 2003...Now Available!<br />
At PP<strong>XRD</strong>-2, the ICDD announced the availability of its<br />
exciting new relational database of organic materials targeted<br />
for pharmaceutical analyses, PDF-4/Organics 2003.<br />
This database contains over 147,000 entries (24,385 experimental<br />
and 122,816 calculated), representing a 500%<br />
increase in available organic X-ray diffraction patterns,<br />
making it the world’s largest X-ray powder diffraction database<br />
for organics! Resulting from a four-year collaboration<br />
with the Cambridge Crystallographic Database Centre,<br />
PDF-4/Organics 2003 is targeted for the pharmaceutical<br />
and specialty chemical industries where special attention<br />
has been given to new pharmaceuticals and drug active substances<br />
with 2D chemical structure representations and<br />
subfile classifications. Experimental and calculated data can<br />
be quickly converted into fully digitized patterns using<br />
ICDD’s enhanced “on-the-fly” calculation and display<br />
technology. PDF-4/Organics 2003, like other PDF-4<br />
designed products, integrates both display and search software<br />
into the database. In addition, ICDD’s PDF-4 products<br />
offer unparalleled data with unprecedented power to<br />
data mine 30+ separate diffraction and physical property<br />
data fields<br />
You’re Invited!<br />
The ICDD will hold its Annual Spring Meetings for members<br />
and nonmembers the week of 17–21 March 2003. In<br />
addition to the traditional meetings of our Committees,<br />
Subcommittees, and Task Groups, some new and exciting<br />
changes are planned, including....<br />
◆ A Plenary Session focusing on “Advances in Automated<br />
Phase Identification”—Leading experts in<br />
phase ID will discuss the new possibilities available<br />
today along with their expectations for future development.<br />
◆ A Historical Tour of Philadelphia—Walking tour<br />
through the “City of Brotherly Love”, retracing the steps<br />
of one of the great scientists, Ben Franklin. During the<br />
tour, we'll visit some of the sites where U.S. history was<br />
made, and even meet Ben himself along the way!<br />
If you’d like to take this opportunity to...<br />
◆ Learn more about the ICDD organization, its programs,<br />
products, and services,<br />
◆ Network with peers in all fields of materials characterization,<br />
◆ Benefit from the advice of others working in similar<br />
environments,<br />
◆ Provide input to make the PDF more useful to you in<br />
your analyses,<br />
mark your calendar and join us! Members, friends, and colleagues<br />
in the scientific community are invited and most<br />
welcome. See http://www.icdd.com/profile/march03.htm<br />
to register and to receive further details.<br />
Further Information<br />
To learn more about the ICDD, its products and services, please visit our web sites: www.icdd.com and<br />
www.dxcicdd.com.
Main Conference Information (website: www.sacrs.org.za/ecm21)<br />
You are cordially invited to attend ECM-21 in Durban!<br />
ECM-21 will be held at the International Convention Centre (ICC) in Durban located 1 km from the beachfront. Durban is situated in the heart of the<br />
Zulu kingdom, Kwazulu-Natal. For the first time an ECM will convene in South Africa -- and indeed Africa. The South African currency (ZAR; South<br />
African Rand; 1Euro ca. ZAR9) strongly favours tourism and the conference fees are modest. Participants should at worst not pay more than for<br />
a typical ECA meeting at a European destination. Interested participants are encouraged to contact Conference Call (confcall@yebo.ca.za) or<br />
Andre’ Roodt (Chair: Organising Committee).<br />
Organising Committee<br />
Andreas Roodt (Chairman), RAU, Johannesburg<br />
Dave Billing, WITS, Johannesburg<br />
Demi Levendis, WITS, Johannesburg<br />
Thomas auf der Heyde, TWR, Johannnesburg<br />
Susan Bourne, UCT, Cape Town<br />
Luigi R. Nassimbeni, UCT, Cape Town<br />
Programme Committee<br />
Jan Boeyens (Chairman), South Africa<br />
Paul Beurskens, Netherlands<br />
Mino Caira, South Africa<br />
Johan de Villiers, South Africa<br />
Eleanor Dobson, United Kingdom<br />
Karimat El-Sayed, Egypt<br />
Giovanni Ferraris, Italy<br />
Jan Dillen, US, Stellenbosch<br />
Gert J. Kruger, RAU, Johannesburg<br />
Jan C.A. Boeyens, UP, Pretoria<br />
Johan de Villiers, UP, Pretoria<br />
Gert Kruger, UN, Durban<br />
Paul Boucher, CSIR, Pretoria<br />
Gastone Gilli, Italy<br />
John Helliwell, United Kingdom<br />
Sven Hofmoeller, Sweden<br />
Ted Janssen, Netherlands<br />
Mikhail Kovalchuk, Russia<br />
Gert J. Kruger, South Africa<br />
Demetrius Levendis, South Africa<br />
Finn Krebs Larsen, Denmark<br />
Weather & Tourist Attractions<br />
Spring starts in South Africa at the end of August, and temperatures are very mild<br />
(min/max: 10 - 25 °C) in Durban (subtropical city). Special visits to game parks are<br />
planned, as well as normal pre- and post-conference tours that will be available to<br />
experience South Africa’s wealth of wild-life (& the big FIVE!), plant diversity and<br />
mineralogical phenomena. (Further information, see website & below)<br />
Important Note<br />
Late winter/early spring is a very good time of the year to view game.<br />
ALL participants will be treated to a one day excursion (Friday 29 Aug)<br />
INCLUDED IN C<strong>ON</strong>FERENCE FEE, to a Game Park, replacing the normal<br />
midweek excursion. Scientific programme will thus run non-stop for four days<br />
(25-28 Aug).<br />
Important Dates & Deadlines<br />
Applications: Financial Assistance:<br />
Details: www.sacrs.org.za/ecm21<br />
Early bird Registration:<br />
Abstract submission:<br />
Accommodation:<br />
Deadline: Registration:<br />
Scientific Programme<br />
(a) Plenary Lectures: Eight sequential lectures by experts covering a wide selection of topics (confirmed, see below).<br />
Claude Lecomte, France<br />
Eric Mittemeijer, Germany<br />
Luigi Nassimbeni, South Africa<br />
Alain Polian, France<br />
Andreas Roodt, South Africa<br />
Trevor Sewell, South Africa<br />
Ton Spek, Netherlands<br />
Abelmalek Thalal, Morocco<br />
Preliminary Programme<br />
Sunday, 24 Aug:<br />
Mon-Thu (25-28 Aug):<br />
Thursday Eve (28 Aug):<br />
Friday, 29 Aug:<br />
Åke Oskarsson, LU, Lund, Sweden<br />
Jazek Groshowski, JU, Krakow, Poland<br />
Claude Lecomte, ECA & UHP, Nancy, France<br />
M Fernandes, WITS, Johannesburg<br />
D Liles, UP, Pretoria<br />
28 February 2003<br />
31 March 2003<br />
31 March 2003<br />
15 July 2003<br />
15 July 2003<br />
(b) Micro-symposia & Posters (See Below): The scientific programme is divided in five parallel sessions addressing Five FOCUS AREAS:<br />
i.e., [FC1] Biological and Macromolecular Crystallography, [FC2] Materials and Minerals, [FC3] Experimental and Computational Techniques,<br />
[FC4] Chemical Crystallography, [FC5] Special techniques. These Focus Areas will also be covered by Poster Sessions.<br />
Abstracts<br />
One page Abstracts in English are invited covering all aspects of crystallography and closely related fields of interest: (i) For micro-symposia<br />
and topics see Programme below. (ii) Online submission via website (www.sacrs.org.za/ecm21) -- submission by 31 March 2003. (iii) With<br />
submission please indicate under which micro-symposium / topic the Abstract is submitted, e.g., FC56 indicates topic of ‘Polymorphism’<br />
with Chair & co-chair Bernstein & Caira. Please Note: Small changes in the programme, dependent on the number of Abstracts received for<br />
different micro-symposia, may occur.<br />
Exhibitors<br />
Excellent venue to ensure maximum<br />
interaction with delegates & reasonable<br />
rates -- information & arrangements based<br />
on ECA recommendations via website<br />
(www.sacrs.org.za/ecm21).<br />
Information: confcall@yebo.co.za<br />
21 st EUROPEAN CRYSTALLOGRAPHIC MEETING<br />
DURBAN, SOUTH AFRICA, 24-29 AUGUST 2003<br />
Second Announcement -- Call for papers<br />
Registration & Accommodation<br />
Electronically – request documents<br />
from conference organisers:<br />
confcall@yebo.co.za or, download from<br />
website (www.sacrs.org.za/ecm21) or<br />
fax Registration Form given below<br />
Travel Arrangements: via Internet<br />
Booking flights using South African Travel<br />
agents will result in significant saving on flights<br />
from Europe. The official Travel agent of ECM-<br />
21 is ASTRA/ SURE Travel. Block bookings by<br />
e.g., student groups, can result in even larger<br />
savings. Detailed Information: Johan le Roux:<br />
Tel. +27-51-4476352: Fax: +27-51-4476665;<br />
johanlr.astraho@galileosa.co.za<br />
The Organizing Committee of ECM-21 shall observe the basic policy of nondiscrimination and affirms the rights of scientists throughout the<br />
world to adhere or to associate with international scientific activity without restrictions based on nationality, race, color, age, religion, political<br />
philosophy, ethnic origin, citizenship, language, or sex, in accordance with the Statues on the International Council of Scientific Unions. At this<br />
meeting (or symposium etc) no barriers will exist which would prevent the participation of bona fide scientists.<br />
Pam Thomas, United Kingdom<br />
Peet van Rooyen, South Africa<br />
Chick Wilson, United Kingdom<br />
Andrew Venter, South Africa<br />
Svetlana Zheludeva, Russia<br />
Xiaodong Zou, China<br />
Registration/Welcome<br />
Scientific Programme<br />
Closure & Dinner<br />
Game Park Visits
21st European Crystallographic Meeting<br />
Programme<br />
A. Plenary Lectures<br />
Tom Blundell Structural biology of multiprotein complexes involved in cell signalling. Robert McGreevy Measuring and modelling atomic and magnetic disorder in crystals<br />
Ted Janssen Quasicrystals Bill David Structure determination from powders - crossing the 100-atom threshold.<br />
Emil Makovicky The wonderful world of crystal structures of sulfosalts Wim Hol Drug targets in tropical diseases<br />
Gilberto Artioli Tools for mineralogical crystallography Yu. A. Ossipyan Space materials research. Present status and perspectives<br />
B. Micro-symposia (Chair / co-chair indicated) [NOTE NUMBERING: e.g., FC56 indicates ‘Polymorphism’ Chair / co-chair Bernstein & Caira]<br />
[FC1]: Macromolecular and Biological []FC2]: Materials and Minerals [FC3]: Experimental and Computational [FC4]: Chemical Crystallography [FC5]: Special techniques<br />
Crystallography<br />
Techniques<br />
1 Crystallisation New developments in the structure determination of Electron crystallography and real structures (with Synergy of experiment and theory in studies of charge, spin and Powder diffraction in applied and industrial mineralogy<br />
quasicrystals<br />
SIG4)<br />
momentum densities<br />
T. Bergfors/ J. Garcia Ruiz G. Chapuis / W. Steurer S. Hovmöller / I. Dodony P. Becker / C. Gatti J. de Villiers / I. Madsen<br />
2 Synchrotron radiation and radiation damage Electron crystallography on beam sensitive samples High photon energy techniques Impact of charge and spin density studies on molecular sciences Fast diffraction - high energy and high throughput<br />
powder diffraction<br />
E. Garman/ D. Bourgeois U. Kolb / C. Kübel J. Schneider / P. Suorrti F.K. Larsen / N. Ghermani R. Dinnebier / S. Verryn<br />
3 Structure refinement and analysis Electron crystallography on inorganic materials Grazing angle techniques Rooted in nature: compounds -chirality, absolute structure, Materials for energy storage and the environment<br />
absolute configuration<br />
A. Jones / G. Murshudov C. Gilmore / M. Gemmi J. Nilssen / G. Fragneto J. Grochowski / T. Auf der Heyde M. Thackeray / W. Richter<br />
4 Atomic resolution Mineralogical mrystallography Automatic structure determination: Challenges for Towards the unification of shared-proton interactions Structure determination from powder diffraction data<br />
the future<br />
C. Jelsch / V. Lamzin T. Balic-Zunic / S. Krivovichev A.L. Spek / D. Billing G. Gilli / L. Nassimbeni L. McCusker / G.J. Kruger<br />
5 Proton and electron transfer processes Modular aspects of inorganic crystals – in memory of Can modern programming languages and -- Molecular interactions at extreme conditions Joint powder diffraction and non-diffraction techniques<br />
Boris B Zvyagin<br />
techniques lead to higher reliability and programmer<br />
productivity?<br />
M.A. Carrondo S. Merlino / M. Nespolo L. Cranswick / J. Dillen E. Boldyreva / G. Hearne K. Shankland / L. Smrcok<br />
6 HIV/ AIDS (Infectious diseases) From minerals to materials science Diffraction image processing and data quality Inclusion compounds and intercalates: Structure and application Polymorphism<br />
A. Wlodawer / T. Sewell E. Scandale / J. Kreisel E. Dodson / S. Parsons S. Bourne / S. C. de Sanctis J. Bernstein / M. Caira<br />
7 Large systems Relaxor ferroelectric materials Algorithms of the future Structure-properties relationship in molecular crystals Use of synchrotron and neutron powder diffraction<br />
A. Yonath / H. Dirr P. Thomas / T. Woike D. Watkin / S. Urzhumtsev C. Wilson / D.C. Levendis A. Hewat / A. Fitch<br />
8 Enzyme catalysis Charge/orbital ordering in strongly correlated electron High resolution X-ray diffraction at new European Core chemical crystallography Indexing powder diffraction patterns: Opportunity for<br />
systems<br />
SR sources<br />
new heuristic and global optimisation methods<br />
G. Dodson / R. Hilgenfeld P. Bordet / A. Guehria- Laidoudi M.V. Kovalcuk / B. Capelle F. Lahoz / J. Rutherford R. Shirley / C. Rademeyer<br />
9 Transcription and translation Crystallography in Africa Crystallography at extreme conditions: recent results From structural knowledge to chemical reactivity Time resolved spectroscopy<br />
and new developments<br />
A. Liljas / V. Oosthuizen A. Thalal / G. Kamau J.P. Itié / M. Catti C. Mealli / P.H. van Rooyen M. Wulff / S. Techert<br />
10 Molecular recognition in molecules and Perovskites ancient and modern - in memory of Helen Crystallisation techniques frontier Structural applications in coordination complexes Spectroscopy - an approach to local structure<br />
macromolecules<br />
D Megaw<br />
S. Larsen / C. Kenyon M. Glazer / P. Boucher N. Chayen / A. Zagari A. Roodt / P. Comba E. Libowitzky / A. Beran<br />
Satellite Meetings: To ensure maximum attendance all aspects of crystallography will be adequately covered by the ECM programme. Only two satellite meetings are scheduled:<br />
(a) Neutron Diffraction: 21-22 August at Centurion/ Pretoria with visits to the Safari-1 research reactor at Pelindaba. Organised by Chick Wilson (C.C.Wilson@rl.ac.uk) & Andrew Venter (amventer@aec.co.za).<br />
(b) Indaba4 The fourth in the multidisciplinary Indaba series of the Structural Chemistry Commission of the IUCr. This meeting takes place at Skukuza, in the Kruger National Park, 18-22 August 2003 -- Attendance limited<br />
to about 120 delegates. Theme for Indaba4: ‘Patterns in Nature’. Enquiries to Peet van Rooyen: pvrooyen@scientia.up.ac.za: www.sacrs.org.za/indaba4<br />
Participants<br />
40<br />
70<br />
40<br />
Title and Coordinator<br />
1. Cambridge Structural Database (F Allen: UK; allen@ccdc.cam.ac.uk)<br />
2. Single Crystal and Powder Diffraction Software Workshop (L Cranswick: UK; l.m.d.cranswick@ dl.ac.uk)<br />
3. Introduction to Protein Crystallography (E Dobson: UK; ccp4@ysbl.york.ac.uk)<br />
Workshops: Three workshops are scheduled, free of charge, on a first come first serve basis. These will<br />
be full-day workshops and will run in parallel on Sunday, 24 Aug 2003. Please reserve place via email to<br />
confcall@yebo.co.za -- Further detail on website (An additional workshop or two, based on substantial delegate<br />
interest might be included – consult website on regular basis for updated information)
Computer Corner<br />
Updates on Freely Available Crystallographic and Powder<br />
Diffraction Software<br />
(Suggestions, corrections, comments appreciated;<br />
especially if you know of new program features, program<br />
updates and announcements that should be mentioned<br />
here).<br />
Lachlan M. D. Cranswick<br />
Collaborative Computational Project No 14 (CCP14) for<br />
Single Crystal and Powder Diffraction<br />
CCP14 - School of Crystallography,<br />
Birkbeck University of London,<br />
Malet Street, Bloomsbury,<br />
WC1E 7HX, London, UK<br />
Tel: (+44) 020 7631 6850<br />
Fax: (+44) 020 7631 6803<br />
E-mail: l.m.d.cranswick@dl.ac.uk<br />
WWW: http://www.ccp14.ac.uk - http://ccp14.sims.nrc.ca<br />
- http://ccp14.semo.edu - http://ccp14.minerals.csiro.au<br />
Let the good times roll for Powder Indexing!<br />
Mid to late 2002 has been an exciting time for powder<br />
indexing enthusiasts, not only with updated versions of<br />
Crysfire, EFLECH/Index, but also in the exposition of new,<br />
available indexing algorithms that try to be insensitive to<br />
impurity peaks. Known available examples include the<br />
new powder indexing option within the Bruker Topas<br />
software; a new indexing program by Accelrys; and a third<br />
written by Armel Le Bail. This is most timely considering<br />
that powder indexing (and also refinement of organic<br />
structures) could now be considered bottlenecks in structure<br />
solution by powder diffraction data.<br />
New McMaille (GPL’d) whole profile Monte Carlo<br />
powder indexing software by Armel Le Bail<br />
The first freely available whole profile powder indexing<br />
program has been released by Armel Le Bail called<br />
McMaille (Monte Carlo Cell). McMaille allows for a<br />
major advance for powder indexing users by the application<br />
of Monte Carlo and/or grid search methods on a pseudopattern<br />
regenerated from peak positions and intensities<br />
(with the option of defining separate widths for each peak).<br />
This makes McMaille relatively insensitive to trace<br />
impurity peaks, even if they are some of the low angle<br />
reflections. If you do not have intensities with your peak<br />
position data, you can just give every peak 100% intensity;<br />
and can also up-weight/down-weight desired reflections by<br />
changing its intensity.<br />
While originally released in September 2003, the latest<br />
version 3 is 20,000 times faster than version 2, putting in a<br />
speed range close to Dicvol. There is an easy to start blackbox<br />
starting mode that tries to index the cell in a default<br />
manner. Running in black box mode also creates a more<br />
elaborate starting control file in case further work is<br />
required using non-defaults.<br />
Output files include a Fullprof/Winplotr PRF Rietveld plot<br />
file of the top solution, plus a Chekcell CKM summary file<br />
of found trial cells for use with Chekcell for graphically<br />
exploring which solution and spacegroups look the best.<br />
For non -trivial problems, the Monte Carlo method can<br />
mean that potential cells could take hours to days to reveal<br />
themselves. Thus over lunch and overnight runs can be<br />
desirable. The latest December version of McMaille can<br />
also attempt the indexing of dual phase mixtures. Though it<br />
could be more effective to go back into the laboratory and<br />
try and obtain more pure materials.<br />
It should also be noted that McMaille, like other indexing<br />
programs, requires high quality data. While McMaille<br />
could be considered a program of last resort, its failure may<br />
indicate either data quality prob lems or the application of<br />
“brain power” may be required.<br />
As McMaille is GPL’d, the Fortran source code is included<br />
and can be freely modified and redistributed under the<br />
terms of the Gnu Public Licence. As it can also be spawned<br />
from the command line, it should be relatively easy to link<br />
with other powder diffraction programs.<br />
Following is an example “black box” starting file for<br />
McMaille on an 800MHz PC Pentium running Windows<br />
98. Within 3 minutes on this example, McMaille has<br />
finished, terminating on a monoclinic cell due to a very<br />
good solution being found. Examination in Chekcell can<br />
show that a cubic solution is the “best”. Traditional powder<br />
indexing programs running in default mode would be<br />
stumped due to the low angle impurity peak (even if<br />
“rescaling” of the data a programs such as Crysfire was<br />
used). As is the way with Monte Carlo, different runs may<br />
produce different results depending on the random number<br />
generation. Though in the following example, the cubic<br />
solution is always found in every run.<br />
large cubic with low angle impurity peak<br />
! Wavelength, zeropoint and NGRID<br />
1.54056 0.0 3<br />
! Couples of 2-theta and intensities<br />
! 2Theta Area<br />
4.7575 7.7676<br />
6.3866 2474.7675<br />
7.2979 82.4634<br />
10.4412 774.9840<br />
12.2385 171.4875<br />
12.7871 422.2225<br />
14.7257 3.6086<br />
16.0971 34.4029<br />
18.1222 123.0149<br />
19.2677 1087.7178<br />
20.0663 7.7595<br />
20.9921 229.7027<br />
22.2682 7146.9366<br />
23.4698 71.6624<br />
24.3546 5.7305<br />
24.6169 37.6828<br />
25.7650 58.4862<br />
26.5452 750.2571<br />
26.8630 19.9016<br />
27.8433 328.0867<br />
28.5897 205.9600<br />
29.8069 29.1420<br />
30.0920 22.1179<br />
30.6141 46.3798<br />
30.7613 72.7655<br />
31.6693 17751.3605<br />
32.3504 326.8591<br />
Fig 1: An example McMaille “black box” starting file with<br />
a very low angle impurity peak (first reflection).<br />
31
Fig 2: Example screen image of McMaille running the<br />
above control file. “Nind” is the number of unindexed<br />
lines.<br />
Fig 3: <strong>Profile</strong> from top solution displayed in Winplotr using<br />
the McMaille generated PRF file.<br />
Fig 4: Comparison of the raw diffraction data and peak list<br />
with the resulting solutions displayed in Chekcell using the<br />
McMaille generated CKM Chekcell summary file. (one line<br />
per solution)<br />
McMaille, along with examples, hints and advice on its<br />
usage, is available via the web at<br />
http://www.cristal.org/McMaille/ ; http://sdpd.univlemans.fr/McMaille/<br />
and CCP14 Mirrors.<br />
32<br />
Fityk GPL’d Peak Profiling software by Marcin Wojdyr<br />
A new Open Source GPL’d peak profiling program, Fityk,<br />
by Marcin Wojdyr is now available via the web with<br />
executables for Windows and Linux (as well as C++ source<br />
code). In theory, it is portable to any computer system<br />
where the wxWindows library is supported<br />
(http://www.wxwindows.org/). The Fityk program can be<br />
controlled via a Graphical User Interface (GUI) as well as a<br />
Command <strong>Line</strong> Interface (CLI).<br />
While individual peaks can be profiled on demand, it is also<br />
possible to define crystallographic phases using cell<br />
constants, and instruct the program which hkl’s are present.<br />
Available Peak profile functions within Fityk include:<br />
Gaussian; Lorenzian; Pearson VII; pseudo-Voigt; and Fifthorder<br />
Polynomial. Three algorithms are available for global<br />
optimisation of peak profiling parameters, Levenberg-<br />
Marquard, Nelder-Mead and a Genetic Algorithm.<br />
Background fitting options include a spline function<br />
through fixed points or a refined polynomial background<br />
function.<br />
The command line and scripting interface also allows for<br />
non-standard scripting and instrumental setups. Parameters<br />
can also be defined in terms of other parameters. The<br />
following example shows the line defining the handling of<br />
alpha-2 and parasitic wavelengths, as well as the option of<br />
refining their ratios.<br />
c.w ! , _1.54051 _1 , _1.54433 ~0.5, _1.39217 ~0.03<br />
('~' means the variable is refined, and '_' means the variable<br />
is fixed)<br />
As Fityk is released under the GPL licence, this means<br />
source code is provided; anyone can make use of the<br />
software; as well as modify the source code as required.<br />
The software is also under heavy development, so it also<br />
pays to submit problems and contributed code to Martin as<br />
well as to routinely check for updated versions.<br />
Fig 5: Screen image of Fityk in action
Fig 6: This screen image shows how Fityk allows you to<br />
import other custom data formats by defining them using a<br />
Graphical User Screen. Merging of data points can also be<br />
performed.<br />
Latest EXPGUI can now handle GSAS macromolecular<br />
structure files<br />
As cited in “R. B. Von Dreele, P. W. Stephens, G. D. Smith<br />
and R. H. Blessing, "The first protein crystal structure<br />
determined from high-resolution X-ray powder diffraction<br />
data: a variant of T3R3 human insulin-zinc complex<br />
produced by grinding", Acta Cryst. (2000). D56, 1549-<br />
1553”, GSAS has the capability to refine protein structures<br />
from powder diffraction data (and single crystal data).<br />
The latest versions of EXPGUI GSAS interface by Brian<br />
Toby can now load GSAS macromolecular files containing<br />
a protein structure. This can be convenient for those who<br />
prefer to perform Le Bail fitting and control of other<br />
refinement variables via EXPGUI. EXPGUI is available<br />
via:<br />
http://www.ncnr.nist.gov/programs/crystallography/<br />
Advice on importing a PDB file, and other setting up<br />
considerations within GSAS for refining proteins is<br />
viewable at:<br />
http://www.ccp14.ac.uk/solution/gsas/peak_and_proteins.ht<br />
ml<br />
Fig 7: EXPGUI screens showing the Le Bail fit to protein<br />
powder diffraction data (thanks to John Bond of the School<br />
of Crystallography, Birkbeck University of London for<br />
permission to show this data)<br />
Possible problems within default GSAS Instrument<br />
Parameter files due to X-ray Polarization effects from<br />
the monochromators.<br />
It may not be realised by many GSAS users that the default<br />
X-ray polarisation values defined by the POLA and IPOLA<br />
parameters in the GSAS distribution PRM instrument<br />
parameter files may not match users’ diffractometers due to<br />
the local use of a monochromator. Both incident and<br />
diffracted beam monochromators affect polarization of the<br />
X-ray beam. But with a suitable standard, this can be<br />
refined (or calculated using the CTHM equation as familiar<br />
to DBW users). An example of this using cubic Y2O3 as a<br />
standard to determine POLA and/or IPOLA values is<br />
available on the CCP14 webpage at:<br />
http://www.ccp14.ac.uk/solution/gsas/graphite_monochrom<br />
ator_and_gsas.html<br />
Fig 8: Screen showing the refinement of IPOLA/POLA on<br />
Y2O3 data within GSAS using the EXPGUI interface. This<br />
is using the CTHM method where IPOLA is fixed to one<br />
and POLA now is equivalent to Cos 2 (2-theta) of the<br />
monochromator.<br />
Plab perl script for GSAS by Jon Wright<br />
GSAS has spawned a large number of programs and scripts<br />
that either enhance its functionality or help make using it<br />
easier or quicker. Many of these are listed on the CCP14<br />
website at: http://www.ccp14.ac.uk/solution/gsas/<br />
A new addition to this family of supporting utilities and<br />
progarms is the Plab (PerL Angles and Bonds) perl script<br />
written by Jon Wright for the creation of GSAS bond length<br />
and bond angle macro files for organics structures. Using<br />
Plab can save time in the setup of restraints for the<br />
refinement of organics in GSAS. This utility script, and a<br />
tutorial showing its use, is viewable via:<br />
http://www.ccp14.ac.uk/solution/gsas/jon_wright_restraints<br />
_script.html<br />
While Perl normally comes installed by default in UNIX<br />
systems, free Perl for Windows binaries are available via<br />
http://www.cpan.org/ports/index.html#win32. The Active<br />
Perl for Windows is recommended.<br />
33
Updates to EFLECH/INDEX powder indexing<br />
programs by Joerg Bergmann<br />
Due in part to the recent second Structure Determination by<br />
Powder Diffractometry Round Robin, there have been<br />
significant updates to Joerg Bergmann’s EFLECH/INDEX<br />
peak profiling/powder indexing software which is available<br />
via http://www.bgmn.de/related.html and CCP14 mirrors.<br />
This was this suite of programs that was the only software<br />
able to suggest powder indexing solutions to samples 5, 7<br />
and 8 in the recent SDPDRR-2 Structure Determination by<br />
Powder Diffractometry Round Robin - 2 (http://sdpd.univlemans.fr/sdpdrr2/results/)<br />
EFLECH performs an automatic pattern decomposition by<br />
fitting a growing number of (raytraced fundamental<br />
parameters) peaks to the measured pattern to give a list of<br />
peaks and a covariance matrix. This data is then used by<br />
INDEX to try and get a unit cell performing a full search<br />
over all possible unit cells.<br />
The new features within EFLECH/INDEX is the ability to<br />
cope with synchrotron data, as well as other optimisations<br />
to speed and handle more complex ab-initio powder<br />
indexing problems.<br />
Updated Crysfire 2002 Powder Indexing suite by Robin<br />
Shirley<br />
The Crysfire powder indexing suite by Robin Shirley has<br />
gone through a number of minor upgrades since the last<br />
newsletter. Updated features include more optimisations to<br />
the MMAP program and improved self-calibration facilities<br />
to determine possible systematic peak offsets from the<br />
internal consistency of the data. Crysfire is available via:<br />
http://www.ccp14.ac.uk/tutorial/crys/<br />
Fig 9: The new self-calibration display within Crysfire<br />
involving a sample with many multiple line pairs.<br />
New Sir2002 for Windows and UNIX single crystal<br />
structure solution software<br />
While optimised for solving on single crystal data, people<br />
who use single crystal solving programs to try and solve on<br />
Le Bail or Pawley extracted HKL file may be interested in<br />
the availability of the new Sir2002 direct methods software<br />
by the Sirware group in Italy. Using single crystal hkl data,<br />
Sir2002 can solve on structures with over 2000 atoms in the<br />
asymmetric unit. It also has the potential to be useful to<br />
34<br />
smaller structures where only powder diffraction data is<br />
available and can be subject to Le Bail or Pawley<br />
extraction.<br />
The software can be freely obtained for non-commercial<br />
use (after completing and faxing the registration<br />
information) via the new Sirware website at<br />
http://www.ic.cnr.it<br />
Fig 10: Starting screen in the new Sir2002 direct methods<br />
software for single crystal data. Compared to Sir97, a<br />
more elaborate Graphical User Interface is provided.<br />
Bond Valence Wizard for Microsoft Windows by Ivan<br />
Orlov and Konstantin Popov<br />
A new Bond Valence program for MS-Windows is that of<br />
Bond Valence Wizard by Ivan Orlov and Konstantin<br />
Popov. The software predicts bond lengths in crystals from<br />
the topology and chemical composition of the structure<br />
using nearest neighbour information. A guide in Adobe<br />
Acrobat PDF format is provided with the distribution files<br />
showing how to start using the program.<br />
Fig 11: Screen image of Bond Valence Wizard in action.<br />
Information and download of the program is available via:<br />
http://www-sphys.unil.ch/ic/SoftPro/bondval/ and CCP14<br />
mirrors.<br />
SoftBV "Bond softness sensitive" bond valence<br />
parameters and software for Java by Stefan Adams<br />
Another bond-valence resource that is available via the<br />
internet is that of softBV by Stefan Adams. These suite of
programs also make use of “bond softness”. Literature<br />
explaining this approach is included on the softBV website.<br />
Bond valence calculations using “softBV” data is available<br />
for main group cations, transition metal cations as well as<br />
the ability to insert a structure in Shelx format and put it<br />
through a bond-valence check. Conventional bond-valence<br />
data can also be used, if requested.<br />
Fig 11: Screen image showing the input of a Shelx format<br />
structure to pass through a softBV check.<br />
As it uses web based Java, it should run within any Java<br />
enabled web browser. It can be downloaded via:<br />
http://kristall.uni -mki.gwdg.de/softbv/index.html<br />
Rietveld Software Updates (as of early January 2003):<br />
Hugo Rietveld website:<br />
http://home.wxs.nl/~rietv025/<br />
BGMN (20 th December 2002)<br />
http://www.bgmn.de/<br />
DBWS (22 nd February 2000)<br />
http://www.physics.gatech.edu/downloads/young/downl<br />
oad_dbws.html<br />
Debvin (25 th May 2001)<br />
ftp://ftp.cc.uniud.it/DEBVIN/<br />
GSAS (2 nd January 2003)<br />
ftp://ftp.lanl.gov/public/gsas/<br />
EXPGUI (27 th December 2002)<br />
http://www.ncnr.nist.gov/programs/crystallography/<br />
Jana (10 th October 2002)<br />
http://www-xray.fzu.cz/jana/jana.html<br />
LHPM-Rietica (27 th November 2001)<br />
ftp://ftp.ansto.gov.au/pub/physics/neutron/rietveld/Rieti<br />
ca_LHPM95/<br />
MAUD for Java (GPL’d) (22 nd October 2002)<br />
http://www.ing.unitn.it/~luttero/maud/<br />
Prodd (7 th March 2002)<br />
http://www.ccp14.ac.uk/ccp/web-mirrors/prodd/~jpw22/<br />
Profil (24 th May 2001)<br />
ftp://img.cryst.bbk.ac.uk/pdpl/<br />
Rietan 2000 (GPL’d) (29 th December 2002)<br />
http://homepage.mac.com/fujioizumi/rietan/angle_dispe<br />
rsive/angle_dispersive.html<br />
Winplotr/Fullprof (23 rd July 2002) (if Fullprof FTP site is<br />
unavailable, use the CCP14 Mirrors)<br />
http://www-llb.cea.fr/winplotr/winplotr.htm<br />
ftp://bali.saclay.cea.fr/pub/divers/fullprof.2k/<br />
Winmprof (21 st June 2001)<br />
http://lpec.univ-lemans.fr/WinMProf/<br />
XND (13 th September 2002)<br />
http://www-cristallo.polycnrs-gre.fr/xnd/xnd.html<br />
ftp://ftp.polycnrs-gre.fr/pub/xnd/ (if XND FTP site is<br />
unavailable, use the CCP14 Mirrors)<br />
All the above Rietveld programs are also available via the<br />
CCP14 based mirrors in UK, USA, Australia and Canada<br />
(http://www.ccp14.ac.uk/mirror/).<br />
Summary lists of some software available via the<br />
EPSRC funded CCP14 website:<br />
“What do you want to do?“ (lists of software by single<br />
crystal and powder methods)<br />
http://www.ccp14.ac.uk/mirror/want_to_do.html<br />
Anharmonic Thermal Refinement Software<br />
http://www.ccp14.ac.uk/solution/anharmonic/<br />
Data Conversion for Powder Diffraction<br />
http://www.ccp14.ac.uk/solution/powderdataconv/<br />
Image Plate Software<br />
http://www.ccp14.ac.uk/solution/image-plate/<br />
Incommensurate Structure Software<br />
http://www.ccp14.ac.uk/solution/incomm.htm<br />
Indexing Software for Powders<br />
http://www.ccp14.ac.uk/solution/indexing/<br />
LeBail Method for Intensity Extraction<br />
http://www.ccp14.ac.uk/solution/lebail/<br />
Pawley Method for Intensity Extraction<br />
http://www.ccp14.ac.uk/solution/pawley/<br />
PDF, High Q Powder diffraction <strong>Analysis</strong> Software<br />
http://www.ccp14.ac.uk/solution/high_q_pdf/<br />
Peak Find/Profiling Software for Powder Diffraction<br />
http://www.ccp14.ac.uk/solution/peakprofiling/<br />
Pole Figure and Texture <strong>Analysis</strong> Software<br />
http://www.ccp14.ac.uk/solution/pole_figure/<br />
Powder Diffraction Data Visualisation<br />
http://www.ccp14.ac.uk/solution/powder_data_visual/<br />
Rietveld Software<br />
http://www.ccp14.ac.uk/solution/rietveld_software/<br />
Search-Match Phase Identification Software<br />
http://www.ccp14.ac.uk/solution/search -match.htm<br />
Single Crystal Structure Solution Software relevant to<br />
Chemical Crystallography<br />
http://www.ccp14.ac.uk/solution/xtalsolution/<br />
Single Crystal Structure Refinement Software relevant to<br />
Chemical Crystallography<br />
http://www.ccp14.ac.uk/solution/xtalrefine/<br />
Single Crystal Suites linking to multiple programs relevant<br />
to Chemical Crystallography<br />
http://www.ccp14.ac.uk/solution/xtalsuites/<br />
Spacegroup and Symmetry operator determination software<br />
and source code<br />
http://www.ccp14.ac.uk/recomm/sym_operators_to_sp<br />
acegroups.html<br />
http://www.ccp14.ac.uk/recomm/spacegroups_to_sym<br />
_operators.html<br />
Spacegroup and Structure Transformation Software<br />
http://www.ccp14.ac.uk/solution/transform/<br />
Structure Conversion and Transformation<br />
http://www.ccp14.ac.uk/solution/structconv/<br />
Structure Drawing and Visualisation<br />
http://www.ccp14.ac.uk/solution/structuredrawing/<br />
Unit Cell Refinement of Powder Diffraction Data<br />
http://www.ccp14.ac.uk/solution/unitcellrefine/<br />
35
Free one day Single Crystal and Powder<br />
Diffraction Crystallographic Software<br />
Workshop as part of ECA 2003 in Durban,<br />
South Africa<br />
With a main theme of "Crystallographic Software Wizardry<br />
in Single Crystal and Powder Diffraction", and thanks to<br />
the conference organisers, there will be a free one day<br />
single crystal and powder diffraction software workshop on<br />
Sunday 24th August 2003 (at the start of the ECA<br />
conference). The emphasis will be on practical 20 minute<br />
"power user" examples of features within the software that<br />
casual users may not appreciate. The workshop will take<br />
place in the same facility as the conference, that being the<br />
International Conference Centre in Durban, South Africa.<br />
The workshop webpage, with links to the presenters and the<br />
software being presented is at:<br />
http://www.ccp14.ac.uk/projects/ecm21 -durban2003/<br />
The morning will consist of the powder diffraction session.<br />
This will include: use of the ICDD database; powder<br />
indexing of large volume cells (including proteins); powder<br />
indexing of impure samples using whole profile methods;<br />
structure solution using direct methods and EXPO;<br />
structure solution using real space methods and the FOX<br />
software; Rietveld refinement of complex inorganic<br />
materials using Fullprof; Rietveld Structure Refinement of<br />
protein powder diffraction data using GSAS<br />
The afternoon will then be on single crystal methods.<br />
Topics include: Using CCDs for visually finding tricky<br />
cells, supercells and incommensurate cells; Advanced<br />
absorption correction options using Platon and Euhedral;<br />
Data processing of Bruker and Nonius CCD data using the<br />
WinGX Single Crystal suite, incorporating Sortav; SnB<br />
(Shake-n-Bake) direct methods software; Dirdif - fragment<br />
searching to solve structures that direct metho ds won't;<br />
Crystals to CCDC Mogul geometry validation; and nontrivial<br />
applications of Platon, Addsym and intra/intermolecular<br />
validation<br />
Speakers who are presently listed at time of writing include<br />
(for Powder Diffraction): Brian O'Connor, Robin Shirley,<br />
Armel Le Bail, Radovan Cerny, Mauro Bortolotti, Luca<br />
Lutterotti, Juan Rodriguez -Carvajal and Jon Wright.<br />
(Single Crystal): Martin Lutz, Louis Farrugia, Charles<br />
Weeks, Bob Gould, David Watkin and Ton Spek.<br />
While the workshop is free, places are limited. People<br />
attending ECM-21 and who wish to also go to the software<br />
workshop are requested to contact Lachlan Cranswick on<br />
the information below.<br />
Lachlan M. D. Cranswick<br />
CCP14 - School of Crystallography,<br />
Birkbeck University of London,<br />
Malet Street, Bloomsbury,<br />
WC1E 7HX, London, UK<br />
Tel: (+44) 020 7631 6850<br />
Fax: (+44) 020 7631 6803<br />
E-mail: l.m.d.cranswick@dl.ac.uk<br />
WWW: http://www.ccp14.ac.uk<br />
36<br />
MEETINGS AND SCHOOLS<br />
Powder Diffraction Software:<br />
What lies behind the buttons?<br />
Every two years the 'Werkgroep Poederdiffractie' of the<br />
Dutch Crystallographic Association (NVK) organizes a day<br />
with a special theme. The theme of this year was: “Powder<br />
Diffraction Software. What lies behind the buttons?” The<br />
chairman of the day, Fokke Tuinstra, mentioned in his<br />
opening speech that this years date, Friday the 13 th (of<br />
December) can be a lucky day, he had met his wife on a<br />
Friday the 13 th and there was a participant who had his<br />
birthday. Five speakers were asked to present a lecture in<br />
the new Bruker-Nonius building in Delft.<br />
The first lecture given by Gerrit Wiegers (retired) was a<br />
historical overview. He gave an admirable inside view of<br />
how the first structures were solved from powder<br />
diffraction data and which programs were used.<br />
Lachlan Cranswick (Birkbeck College, University of<br />
London) gave the next lecture titled ‘What can freely<br />
available powder diffraction software via the internet do for<br />
you’. Every participant (about 50 persons) got a brand new<br />
version of the Xtal Nexus CD. A few of them had never<br />
heard from the CCP14 website and were pleasantly<br />
surprised with the wealth of software freely available on the<br />
Internet.<br />
During the poster session and during lunch, sponsored by<br />
PANalytical, lively discussions were held on various<br />
diffraction topics including Variable Counting Time<br />
procedures.<br />
Leo Woning (Bruker-Nonius) introduced the Fundamental<br />
Parameter Approach for powder pattern fitting. He<br />
explained the basic concepts, which are built on physical<br />
parameters and not on analytical functions. Most persons<br />
agreed that the FPA is the way to go, and like someone<br />
remarked: ‘we are at the starting point of a new<br />
development’<br />
René Peschar (University of Amsterdam) described the<br />
attempts that are undertaken in Amsterdam to determine the<br />
structure of various ‘larger’ organic molecules (e.g. cocoa<br />
butter) from powder data. It was a pity he didn’t bring some<br />
chocolates for determining the taste during the tea break.<br />
During the break the participants had a guided tour through<br />
the new building of Bruker-Nonius. They saw the<br />
production facilities of the single crystal machines and the<br />
application laboratory showing single crystal and powder<br />
diffraction equipment.<br />
Frans Peerdeman (PANalytical) closed the day with a talk<br />
about <strong>XRD</strong>ML, the new data format of PANalytical, and<br />
how can it be used. The description of this data format is<br />
freely available. He expressed the wish that this new ASCII<br />
data format that can be used by the whole diffraction<br />
community will be the new standard in the powder<br />
diffraction.<br />
The day was a gr eat success and ended with a drink<br />
sponsored by Bruker-Nonius.<br />
Céleste A. Reiss<br />
PANalytical, Lelyweg 1,<br />
7602 EA Almelo, The Netherlands<br />
E-mail: Celeste.Reiss@PANalytical.com
The following web-site contains an up-to-date and<br />
semi-exhaustive list of conference and workshops<br />
in crystallography and related areas.<br />
http://www.iucr.org/cww-top/mtg.date.html<br />
9th – 11th April 2003<br />
International Workshop on Hard Synchrotron<br />
X-rays for Texture and Strain <strong>Analysis</strong><br />
DESY, Hamburg, Germany.<br />
Web: http://www-<br />
hasylab.desy.de/conferences/workshop/<br />
28 April – 2 May 2003<br />
Practical X-ray Fluorescence Spectrometry<br />
ICDD, Newtown Square, Pennsylvania, U.S.A.<br />
Covering basics of X-ray spectra, inst rumentation<br />
design, methods of qualitative and quantitative<br />
analysis, specimen preparation, review of<br />
mathematical matrix correction procedures,<br />
applications for both wavelength and energy<br />
dispersive spectrometry and new developments in<br />
XRF.<br />
Web: www.icdd.com/education/clinics/<br />
E-mail: clinics@icdd.com<br />
2 – 6 June 2003<br />
Fundamentals of X-ray Powder Diffraction<br />
ICDD, Newtown Square, Pennsylvania, U.S.A.<br />
Covering instrumentation, specimen preparation, data<br />
acquisition, and qualitative phase analysis<br />
Web: www.icdd.com/education/clinics/<br />
E-mail: clinics@icdd.com<br />
9 – 13 June 2003<br />
Advanced Methods in X-ray Powder<br />
Diffraction<br />
ICDD, Newtown Square, Pennsylvania, U.S.A.<br />
Emphasizing computer-based methods of data collection and<br />
interpretation, both for qualitative and quantitative phase<br />
analysis<br />
Web: www.icdd.com/education/clinics/<br />
E-mail: clinics@icdd.com<br />
4th – 15th June 2003<br />
International School of Crystallography: High<br />
Pressure Crystallography<br />
Erice, Sicily, Italy<br />
Web:http:/ /www.geomin.unibo.it/orgv/erice/highp<br />
res.htm and http://www.crystalerice.org<br />
WHAT’S <strong>ON</strong><br />
E-mail: paola.spadon@unipd.it and<br />
katran@amu.edu.pl<br />
26th – 31st July 2003<br />
American Crystallographic Association Annual<br />
Meeting, ACA 2003<br />
Northern Kentucky Convention Center,<br />
Cincinnati, Ohio, USA<br />
Web: http://www.hwi.buffalo.edu/ACA/<br />
E-mail: jeanette.krause@uc.edu<br />
4th – 6th August 2003<br />
Polarised Neutrons and Synchrotrons X-rays<br />
for Magnetism - PNSXM<br />
Venice International University, San Servolo,<br />
Venice, Italy<br />
Web: http://venice.infm.it<br />
E-mail: massimo.altarelli@elettra.trieste.it<br />
4th – 8th August 2003<br />
52 nd Annual Denver X-ray Conference<br />
Denver Marriott Tech Center Hotel, Denver,<br />
Colorado, USA<br />
Web: http://www.dxcicdd.com/<br />
E-mail: dxc@icdd.com<br />
10th – 13th August 2003<br />
AsCA'03/Crystal -23 : Asian Crystallographic<br />
Association and the Society for<br />
Crystallographers in Australia and New<br />
Zealand (SCANZ)<br />
Cable Beach Club resort, Broome, Western<br />
Australia, Australia<br />
Web: http://www.crystal.uwa.edu.au/CrystalsDownUnder/<br />
E-mail: srh@crystal.uwa.edu.au<br />
24th – 30th August 2003<br />
21st European Crystallographic Meeting<br />
International Conference Center, Durban, South<br />
Africa<br />
Web: http://www.sacrs.org.za/ecm21/<br />
E-mail: jboeyens@postino.up.ac.za<br />
8th - 13th September 2003<br />
Aperiodic -2003<br />
Universidade Federal de Minas Gerais (UFMG),<br />
Belo Horizonte, Brazil.<br />
Web: http://agora.grude.ufmg.br/aperiodic2003<br />
37
8th - 18th September 2003<br />
8th Oxford School on Neutron Scattering<br />
Univ. of Oxford, Mansfield College, Oxford, UK<br />
http://www.isis.rl.ac.uk/conferences/osns2003/<br />
E-mail: C.C.Wilson@rl.ac.uk<br />
14th - 19th September 2003<br />
Structure Solution from Powder Diffraction<br />
Data - SSPD'03<br />
Congress Center Academia, Stara Lesna, Slovak<br />
Republic<br />
Web: http://www.sspd-03.sav.sk<br />
E-mail: Lubomir.Smrcok@savba.sk<br />
13th-15th September 2006<br />
European Congress on Residual Stresses<br />
ECRS7, TU Berlin, Germany<br />
E-mail: Walter.Reimers@TU-Berlin.de<br />
38<br />
Companies<br />
9th - 20th June 2004<br />
Diversity amidst Similarity: a Multidisciplinary<br />
Approach to Polymorphs, Solvates and Phase<br />
Relationships: the 35th crystallographic course<br />
at the Ettore Majorana Centre<br />
Ettore Majorana Centre, Erice, Italy<br />
Web: http://www.geomin.unibo.it/orgv/erice/olderice/<br />
bernstei.htm and http://www.crystalerice.org<br />
E-mail: Yoel@bgumail.bgu.ac.il<br />
23 rd to 31 st , August 2005<br />
IUCr XX - XX Congress and General<br />
Assembly of the International of<br />
Crystallography<br />
Congress Citidal, Florence, Italy<br />
Web: http://www.iucr2005.it<br />
How to receive the IUCr CPD Newsletter<br />
If you wish to be added to the mailing list for the Newsletter of the IUCr Commission on Powder<br />
Diffraction or have changed address, please contact the Chair man:<br />
Robert Dinnebier (r.dinnebier@fkf.mpg.de).<br />
The Newsletter can also be downloaded in electronic format, as a .pdf file, from the CPD web-site.<br />
If you would like to advertise in this twice-yearly newsletter, please contact Robert Dinnebier on<br />
e-mail: r.dinnebier@fkf.mpg.de<br />
Telephone: +49-711-689-1503<br />
Fax: +49-711-689-1502<br />
Call for contributions to the next CPD Newsletter (No 29)<br />
The next issue of the CPD Newsletter will be edited by Andy Fitch , to appear in July 2003. Andy will<br />
greatly appreciate contributions from readers on matters of interest to the powder diffraction<br />
community, e.g. meeting reports, future meetings, developments in instruments, techniques, and news<br />
of general interest. Please contact him for sending articles and suggestions. Software developments can<br />
be directly addressed to Lachlan Cranswick or to the Editor of Newsletter No 29 (addresses are given<br />
below)<br />
Dr A. N. Fitch<br />
ESRF, Grenoble France<br />
Telephone : +33 476 88 25 32 | Fax: +33 476 88 25 42<br />
e-mail: fitch@esrf.fr<br />
Dr Lachlan M. D. Cranswick<br />
CCP14, Department of Crystallography, Birkbeck College University of London,<br />
Malet Street, Bloomsbury, WC1E 7HX, London, UK<br />
e-mail: l.m.d.cranswick@dl.ac.uk<br />
WWW: http://www.ccp14.ac.uk