Microstructure Analysis on Nanocrystalline Materials COMMISSION ...
Microstructure Analysis on Nanocrystalline Materials COMMISSION ...
Microstructure Analysis on Nanocrystalline Materials COMMISSION ...

Create successful ePaper yourself
Turn your PDF publications into a flip-book with our unique Google optimized e-Paper software.
Once the sampled interatomic distance database is<br />
available and the size and strain distributi<strong>on</strong> functi<strong>on</strong>s<br />
are chosen, the pattern intensity can be easily computed<br />
using a fast algorithm performing the Debye Functi<strong>on</strong>,<br />
thanks to the c<strong>on</strong>stant step of the sampled distances [4].<br />
The details of the pattern intensity calculati<strong>on</strong> and interatomic<br />
distances sampling are given in [4, 5]. A<br />
brief descripti<strong>on</strong> of the software NANO which presently<br />
implements our method is described in [6]. With<br />
respect to the versi<strong>on</strong> described in [6] the refinement<br />
secti<strong>on</strong> has been modified alternating COMPLEX,<br />
Simulating Annealing and Full-Newt<strong>on</strong> Least Squares<br />
algorithms.<br />
n d(nm) Atoms Interatomic<br />
distances<br />
Gaussian<br />
sampled<br />
distances<br />
5 2.143 561 1.6 · 105 5 2.143 561 1.6 · 10 362<br />
5 5 2.143 561 1.6 · 10 362<br />
5 1.6 · 105 362<br />
10 4.524 3871 7.5 · 106 10 4.524 3871 7.5 · 10 705<br />
6 10 4.524 3871 7.5 · 10 705<br />
6 7.5 · 106 705<br />
20 9.286 28741 4.0 · 108 20 9.286 28741 4.0 · 10 1412<br />
8 20 9.286 28741 4.0 · 10 1412<br />
8 4.0 · 108 1412<br />
50 23.573 429351 9.0 · 10 10 50 23.573 429351 9.0 · 10 3534<br />
10 50 23.573 429351 9.0 · 10 3534<br />
10 9.0 · 10 10 3534<br />
Table I. n = cluster shell number, d = cluster diameter,<br />
interatomic distances and Gaussian sampled distances<br />
valid up to 2 sinθ<br />
max<br />
−1<br />
q max = = 125 . Å .<br />
λ<br />
APPLICATIONS<br />
PbS nanoparticles<br />
Colloidals PbS nanoparticles in the size range 4-7 nm<br />
have been studied by HRTEM and XRPD to determine<br />
the particle size in order to calculate the extincti<strong>on</strong> coefficients<br />
[7]. One of the samples involved in this work<br />
was analyzed with this approach (an extensive applicati<strong>on</strong><br />
was not possible because the samples are all affected<br />
by texture effects, not yet available in the<br />
model). We generated spherical PbS clusters up to<br />
about 20 nm in diameter (prototype rocksalt, Pears<strong>on</strong><br />
symbol cF8). The structural informati<strong>on</strong> was taken by<br />
ICSD #38293, with a cell parameter a=5.934 Å.<br />
Intensity<br />
8000<br />
7000<br />
6000<br />
5000<br />
4000<br />
3000<br />
2000<br />
1000<br />
0<br />
-1000<br />
Fracti<strong>on</strong> (%)<br />
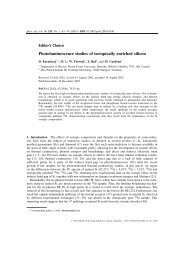
Fig. 2. PbS XRPD experimental dataset and relevant<br />
calculated pattern. Background and difference profiles<br />
are included. Size & Strain distributi<strong>on</strong> are shown in<br />
the inset. GoF=2.54, Rwp=10.32.<br />
60<br />
50<br />
40<br />
30<br />
20<br />
10<br />
30 40 50 60 70 80 90<br />
2θ (deg)<br />
0<br />
0.990<br />
5 6 7 8 9 10<br />
diameters (nm)<br />
1.010<br />
1.008<br />
1.006<br />
1.004<br />
1.002<br />
1.000<br />
0.998<br />
0.996<br />
0.994<br />
0.992<br />
Strain<br />
Refined parameters were: the centre and width of the<br />
lognormal size distributi<strong>on</strong>, strain parameters and the<br />
background coefficients. The final best fit is shown in<br />
Fig. 2 together with the size and strain distributi<strong>on</strong>s (in<br />
the inset).<br />
The tensile strain of about 0.001, independent<br />
of the size, can be also interpreted as a larger unit cell<br />
(a = 5.942 Å) in agreement with the refined value that<br />
was found when the data were modelled using a shapebased<br />
c<strong>on</strong>voluti<strong>on</strong> approach described in [8].<br />
Ir<strong>on</strong> oxide nanoparticles<br />
Maghemite nanoparticles have been synthesized with<br />
an original chemical route obtaining nanocrystals of<br />
different shapes according to the reacti<strong>on</strong> parameters<br />
[9]. In Fig. 3 the diffracti<strong>on</strong> patterns collected <strong>on</strong><br />
spherical shape nanocrystals (solid line) and <strong>on</strong><br />
tetrapods (dotted curve) are shown. The shape clearly<br />
affects the width and intensity ratio. A gradual increase<br />
in the I220/I511 and especially in the I440/I311 ratio accompanies<br />
the transiti<strong>on</strong> from the spherical to the<br />
tetrapod shape with progressively l<strong>on</strong>ger branches. It is<br />
also noted that the (111) and (220) peak maxima<br />
slightly shift to higher angles. We first started data analy-<br />
sis with the sample having a spherical shape.<br />
Within our approach we generated spherical<br />
maghemite clusters up to about 10 nm in diameter. The<br />
structural informati<strong>on</strong> 1 was taken by ICSD #87119<br />
(Pears<strong>on</strong> symbol cP53), with a cell parameter a =<br />
8.3457 Å. Refined parameters were: centre and width<br />
of the lognormal size distributi<strong>on</strong>, the isotropic thermal<br />
parameters and the background coefficients. The final<br />
best fit is shown in Fig. 4 together with the size and<br />
strain distributi<strong>on</strong>s (in the inset).<br />
Intensity<br />
18000<br />
16000<br />
14000<br />
12000<br />
10000<br />
8000<br />
6000<br />
4000<br />
2000<br />
0<br />
111<br />
220<br />
311<br />
222<br />
400<br />
422<br />
511<br />
440<br />
620<br />
533<br />
444<br />
642<br />
731<br />
800<br />
751<br />
840<br />
10 20 30 40 50<br />
2θ (deg)<br />
Fig. 3. Ir<strong>on</strong> Oxide XRPD experimental datasets: the<br />
solid and dotted lines corresp<strong>on</strong>d to spherical and<br />
tetrapod shape nanocrystals, respectively.<br />
The atomic models for tetrapods (TPs) with arms oriented<br />
al<strong>on</strong>g the [110], [111] and [100] orientati<strong>on</strong>s<br />
were generated and the corresp<strong>on</strong>ding diffracti<strong>on</strong> patterns<br />
were calculated. Dotted and solid curves are<br />
computed for TPs with different arm length (l) and di-<br />
1 It is worth noting that for this structure, cluster's generati<strong>on</strong><br />
takes into account the partial occupancy of<br />
some atoms.<br />
931<br />
844<br />
5