Microstructure Analysis on Nanocrystalline Materials COMMISSION ...
Microstructure Analysis on Nanocrystalline Materials COMMISSION ...
Microstructure Analysis on Nanocrystalline Materials COMMISSION ...

You also want an ePaper? Increase the reach of your titles
YUMPU automatically turns print PDFs into web optimized ePapers that Google loves.
observed already after annealing at 150-200 ºC. It was<br />
found that the additi<strong>on</strong> of at least 0.5 wt. % Al2O3 prevents<br />
grain growth and keeps the dislocati<strong>on</strong> density<br />
high and crystallites small up to about 400°C. The<br />
amount of 0.3 wt. % is insufficient for that and a rapid<br />
grain growth is observed at about 200°C. Higher<br />
amount 1.1 wt. % Al2O3 does not improve stability c<strong>on</strong>siderably.<br />
0.0050<br />
0.0045<br />
0.0040<br />
0.0035<br />
0.0030<br />
0.0025<br />
0.0020<br />
0.0015<br />
0.0010<br />
0.0005<br />
β (10 -10 m -1 )<br />
HPT Fe<br />
sin θ<br />
0.0000<br />
0.0 0.2 0.4 0.6 0.8 1.0<br />
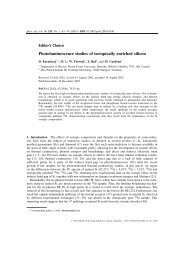
Fig. 5. Evoluti<strong>on</strong> of the Williams<strong>on</strong>-Hall plot with annealing<br />
temperature (from the top – as-deformed,<br />
130ºC, 190ºC, 370ºC). All points corresp<strong>on</strong>d to the experimental<br />
values after correcti<strong>on</strong> <strong>on</strong> instrumental<br />
broadening.<br />
For ir<strong>on</strong> samples, c<strong>on</strong>tinuous strain recovery is observed<br />
in the range 130-200°C (Fig. 5). However, microstructural<br />
changes at about 200 ºC are accompanied<br />
by an increase of line broadening and decrease of WH<br />
plot slope. Magnesium samples did not show significant<br />
line broadening even after severe deformati<strong>on</strong> at<br />
room temperature. Additi<strong>on</strong> of 10 % of Gd leads to<br />
finer and highly defected microstructure which remains<br />
stable up to about 220 ºC. A decrease of defect density<br />
and grain growth with increasing temperature during<br />
isochr<strong>on</strong>al annealing lead to rise of the intensity of the<br />
free positr<strong>on</strong> comp<strong>on</strong>ent in PL spectra accompanied by<br />
a decrease of the intensities of positr<strong>on</strong>s trapped at defects<br />
[28]. A typical example of temperature dependence<br />
of the relative intensities of positr<strong>on</strong> comp<strong>on</strong>ents<br />
is plotted in Fig. 6 for UFG Cu.<br />
INHOMOGENEITY<br />
In-plane inhomogeneity for as-deformed disc samples<br />
was found by positr<strong>on</strong> annihilati<strong>on</strong> [29, 30] but not by<br />
XRD. The diameter of the analyzed regi<strong>on</strong> was similar<br />
in both cases (4 mm). Therefore, it was explained by<br />
the inhomogeneous distributi<strong>on</strong> of micro-voids.<br />
In-depth gradients were found by both techniques.<br />
In Fig. 7, the WH plots are shown c<strong>on</strong>structed<br />
for as-deformed copper and for high-resoluti<strong>on</strong> parallel<br />
beam measurements with rotating anode, Goebel mirror<br />
in the incident beam and two crystals in the diffracted<br />
beam – quartz (101) and graphite (001). While<br />
there is no difference between centre and margin of the<br />
specimen, clear difference can be seen for plots obtained<br />
in symmetrical scan and the <strong>on</strong>e at the fixed an-<br />
gle of incidence γ = 5 °. In the latter case, the penetrati<strong>on</strong><br />
depth is smaller, which means a higher defect density<br />
<strong>on</strong> the surface. Therefore, in order to remove the<br />
surface layer, the samples were etched before most of<br />
XRD measurements.<br />
I (%)<br />
100<br />
80<br />
60<br />
40<br />
20<br />
Ι 2 - di sl ocati<strong>on</strong>s<br />
Ι3 - microvoids<br />
T ( o 0<br />
0 100 200 30<br />
0<br />
C)<br />
Ι1 - free positr<strong>on</strong>s<br />
400 500<br />
Fig. 6. Temperature dependence of relative intensities<br />
of positr<strong>on</strong> comp<strong>on</strong>ent resolved in positr<strong>on</strong> lifetime<br />
spectrum of UFG Cu prepared by high pressure torsi<strong>on</strong><br />
using pressure p = 3 GPa.<br />
β (10 10 m -1 )<br />
0.010<br />
0.008<br />
0.006<br />
0.004<br />
0.002<br />
margin<br />
center<br />
center - 5 deg<br />
center - 5 deg, calc<br />
center - calculated<br />
111<br />
200<br />
0.000<br />
0.0 0.2 0.4 0.6<br />
sin θ<br />
0.8 1.0<br />
Fig. 7. Williams<strong>on</strong>-Hall plots for Cu + 0.5 % Al2O3<br />
sample measured in the centre ( ), at the margin (x)<br />
and in the centre by 2θ scan at low angle of incidence<br />
(●).<br />
A different picture appeared after annealing. Valuable<br />
results were obtained by the classical simple backreflecti<strong>on</strong><br />
method. For as-prepared samples, c<strong>on</strong>tinuous<br />
Debye rings were observed while after annealing a few<br />
dots were clearly distinguished <strong>on</strong> them indicating fast<br />
growth of <strong>on</strong>ly a few grains. This appeared at lower<br />
temperatures, before any significant changes of line<br />
broadening and PL spectra and it was <strong>on</strong>ly detected for<br />
copper samples while for ir<strong>on</strong> and magnesium the grain<br />
growth seems to be homogeneous.<br />
In-plane inhomogeneity was also detected by<br />
the back-reflecti<strong>on</strong>. In the margin regi<strong>on</strong>s of disc<br />
specimens, larger grains were detected than in their<br />
centers. The effect appeared <strong>on</strong>ly after annealing above<br />
220<br />
311<br />
222<br />
400<br />
420<br />
331<br />
22