Microstructure Analysis on Nanocrystalline Materials COMMISSION ...
Microstructure Analysis on Nanocrystalline Materials COMMISSION ...
Microstructure Analysis on Nanocrystalline Materials COMMISSION ...

You also want an ePaper? Increase the reach of your titles
YUMPU automatically turns print PDFs into web optimized ePapers that Google loves.
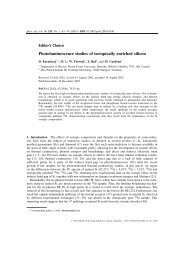
<strong>on</strong>ly the first parts of the diffracti<strong>on</strong> patterns up to about<br />
2θ = 78° are shown here.<br />
Counts<br />
Counts<br />
10000 Measured<br />
Fitted<br />
1000<br />
100<br />
10000<br />
1000<br />
100<br />
SrF 2 12 min a)<br />
20 40 60 80<br />
[ Deg ]<br />
2θ<br />
SrF 2 40 min<br />
20 40 60<br />
Measured<br />
Fitted<br />
2θ<br />
[ Deg ]<br />
Fig. 3. Observed (dotted line) and fitted (solid line)<br />
patterns of SrF2 after 12 (a) and 40 (b) minutes ball<br />
milling. Note the logarithmic intensity scale. (By courtesy<br />
of Ribárik et al. [40])<br />
Difference (counts)<br />
2000<br />
1000<br />
0<br />
-1000<br />
SrF 2<br />
(111)<br />
25 26 27 28<br />
2θ<br />
b)<br />
Milling periods<br />
min.<br />
40<br />
60<br />
30<br />
6, 12<br />
Fig. 4. The difference between the measured and fitted<br />
intensities of the 111 Bragg reflecti<strong>on</strong> as a functi<strong>on</strong> of<br />
the period of ball milling of SrF2. (By courtesy of Ribárik<br />
et al. [40].)<br />
In the case of the specimen ball milled for 60 min the<br />
measured and model based fitted patterns coincide<br />
again, as in the case of the 12 min ball milling. The ap-<br />
pearing and disappearing of the interference effect with<br />
milling time is shown by plotting the difference between<br />
the measured and fitted intensities of the 111<br />
Bragg reflecti<strong>on</strong>s in Fig. 4. The positive deviati<strong>on</strong>s in<br />
the tail regi<strong>on</strong>s of the intensities indicate that the measured<br />
profiles are narrower than the fitted <strong>on</strong>es. The figure<br />
shows that the peak narrowing relative to the model<br />
peaks is negligible for 6 and 12 min, increases to a<br />
maximum at 40 min and decreases for l<strong>on</strong>ger ball milling<br />
periods, respectively. It is important to note that the<br />
coincidence of the measured and modelled intensities<br />
was found to be perfect for all measured diffracti<strong>on</strong><br />
patterns from the fourth or fifth Bragg reflecti<strong>on</strong>s up to<br />
the last, fifteenth measured reflecti<strong>on</strong>. The size distributi<strong>on</strong><br />
of crystallites went through a minimum around<br />
40 min ball milling, as it can be seen in Fig. 13 in [40].<br />
The interference effect in the ball milled Fluorides has<br />
been interpreted as follows. A simple picture for the<br />
interference effect was given by figure 7 in [40] or figure<br />
1 in [41]. It shows the schematic diffracti<strong>on</strong> spots<br />
in reciprocal space blown up by small particle size for<br />
two adjacent crystallites with a small difference in their<br />
crystallographic orientati<strong>on</strong>. The figure is reproduced<br />
here as Fig. 5. The interference effect occurs when two<br />
diffracti<strong>on</strong> spots corresp<strong>on</strong>ding to adjacent crystallites<br />
overlap, cf. [23].<br />
1<br />
Fig. 5. Schematic drawing for the interpretati<strong>on</strong> of the<br />
interference effect. The dashed and the dotted spots are<br />
the blown up reciprocal lattice nodes corresp<strong>on</strong>ding to<br />
two adjacent crystallites rotated in orientati<strong>on</strong> with respect<br />
to each other by a small angle. The orientati<strong>on</strong>s<br />
of the two crystallites are indicated schematically by<br />
the dashed and dash-dotted arrows. The two diffracti<strong>on</strong><br />
spots encircled and numbered 1 and 2 overlap, whereas<br />
the <strong>on</strong>es numbered 3 are well separated. (By courtesy<br />
of Ribárik et al. [40]) A similar figure can be<br />
found in [41].<br />
This can happen if (i) the crystallites are small, so that<br />
the blow up of diffracti<strong>on</strong> spots is large, (ii) if the lattice<br />
c<strong>on</strong>stant of the material is large, so that there are<br />
diffracti<strong>on</strong> spots not too far from the origin of reciprocal<br />
space and (iii) the orientati<strong>on</strong> difference between<br />
adjacent crystallites is small enough, so that the overlap<br />
can occur. In the case of the ball milled Fluorides c<strong>on</strong>diti<strong>on</strong><br />
(i) is assured by ball milling. The lattice parameter<br />
of the Fluorides is somewhat larger than 0.5 nm, a<br />
2<br />
3<br />
15