Comparison of Observed Temperature and Salinity Changes in the ...
Comparison of Observed Temperature and Salinity Changes in the ...
Comparison of Observed Temperature and Salinity Changes in the ...

You also want an ePaper? Increase the reach of your titles
YUMPU automatically turns print PDFs into web optimized ePapers that Google loves.
1JANUARY 2003 BANKS AND BINDOFF<br />
157<br />
TABLE 1.<br />
Zonal<br />
section<br />
47N<br />
24N<br />
10N<br />
17S<br />
32S<br />
43S<br />
Modern <strong>and</strong> historical data used <strong>in</strong> <strong>the</strong> comparison.<br />
Modern<br />
(yr)<br />
1985<br />
1985<br />
1989<br />
1994<br />
1987<br />
1989<br />
No. <strong>of</strong><br />
casts<br />
299<br />
156<br />
213<br />
294<br />
109<br />
72<br />
Historical<br />
(yr)<br />
1966<br />
1970<br />
1969<br />
1967<br />
1962<br />
1967<br />
No. <strong>of</strong><br />
casts<br />
299<br />
509<br />
400<br />
706<br />
451<br />
18<br />
Std dev<br />
(yr)<br />
5.0<br />
5.5<br />
6.0<br />
5.0<br />
10.0<br />
1<br />
Time<br />
difference<br />
(yr)<br />
19<br />
15<br />
20<br />
30<br />
25<br />
22<br />
can produce <strong>the</strong> observed changes <strong>in</strong> temperature <strong>and</strong><br />
sal<strong>in</strong>ity on isopycnals. Beyond validation, <strong>in</strong> a coupled<br />
model it is possible to diagnose surface forc<strong>in</strong>g <strong>and</strong>,<br />
<strong>the</strong>refore, to try to underst<strong>and</strong> <strong>the</strong> processes <strong>and</strong> mechanisms<br />
by which subsurface oceanic changes may occur.<br />
This paper aims to address three questions: 1) Can a<br />
coupled climate model reproduce observed water mass<br />
changes <strong>in</strong> <strong>the</strong> Indo-Pacific? 2) Are observed changes<br />
anthropogenically forced or a signal <strong>of</strong> <strong>in</strong>ternal variability?<br />
3) What atmospheric changes drive <strong>the</strong> observed<br />
subsurface water mass changes? We will first<br />
describe observations from <strong>the</strong> Indo-Pacific over <strong>the</strong> last<br />
century <strong>and</strong> simulations <strong>of</strong> a state-<strong>of</strong>-<strong>the</strong>-art coupled<br />
climate model, <strong>the</strong> third Hadley Centre Coupled Ocean–<br />
Atmosphere General Circulation Model (HadCM3; section<br />
2). We will <strong>the</strong>n compare observed changes <strong>in</strong> temperature<br />
<strong>and</strong> sal<strong>in</strong>ity with those simulated by <strong>the</strong> coupled<br />
climate model (section 3). In section 4 we will f<strong>in</strong>d<br />
<strong>the</strong> pattern <strong>of</strong> change <strong>in</strong> <strong>the</strong> coupled model that may be<br />
thought <strong>of</strong> as a f<strong>in</strong>gerpr<strong>in</strong>t <strong>of</strong> anthropogenic forc<strong>in</strong>g, <strong>and</strong><br />
<strong>in</strong> section 5 we will relate <strong>the</strong> subsurface f<strong>in</strong>gerpr<strong>in</strong>t to<br />
<strong>the</strong> changes <strong>in</strong> surface fluxes. F<strong>in</strong>ally, <strong>in</strong> section 6 we<br />
will draw conclusions.<br />
2. Data <strong>and</strong> methods<br />
a. The data<br />
We compare <strong>the</strong> output <strong>of</strong> <strong>the</strong> model with <strong>the</strong> observed<br />
differences <strong>in</strong> temperature <strong>and</strong> sal<strong>in</strong>ity <strong>in</strong> <strong>the</strong><br />
deep ocean (Table 1). These differences are constructed<br />
from a variety <strong>of</strong> datasets <strong>and</strong> analyses (B<strong>in</strong>d<strong>of</strong>f <strong>and</strong><br />
Church 1992; B<strong>in</strong>d<strong>of</strong>f <strong>and</strong> McDougall 1994, 2000;<br />
Wong et al. 2001). The historical data are primarily<br />
obta<strong>in</strong>ed from J. Reid <strong>and</strong> A. Mantyla (1994, personal<br />
communication) <strong>and</strong> from <strong>the</strong> Sou<strong>the</strong>rn Ocean Atlas<br />
(Gordon et al. 1982) for both <strong>the</strong> Indian <strong>and</strong> Pacific<br />
Oceans. The hydrographic data from <strong>the</strong>se atlases are<br />
ma<strong>in</strong>ly Nansen bottle data. The recent hydrographic data<br />
come from <strong>the</strong> World Ocean Circulation Experiment<br />
(WOCE) <strong>and</strong> are available from <strong>the</strong> World Hydrographic<br />
Program Office (WHPO; see onl<strong>in</strong>e at http://<br />
whpo.ucsd.edu). These WOCE data are all CTD data<br />
calibrated aga<strong>in</strong>st sal<strong>in</strong>ity analyses from water samples<br />
taken through <strong>the</strong> whole water column. Typical accuracies<br />
<strong>of</strong> <strong>the</strong> CTD temperature <strong>and</strong> sal<strong>in</strong>ity data are<br />
0.002C <strong>and</strong> 0.003 psu. The historical data are <strong>in</strong>terpolated<br />
to <strong>the</strong> location <strong>of</strong> each cast from <strong>the</strong> recent<br />
hydrographic pr<strong>of</strong>iles us<strong>in</strong>g objective methods (Bre<strong>the</strong>rton<br />
et al. 1976; Roemmich 1983; B<strong>in</strong>d<strong>of</strong>f <strong>and</strong> Wunsch<br />
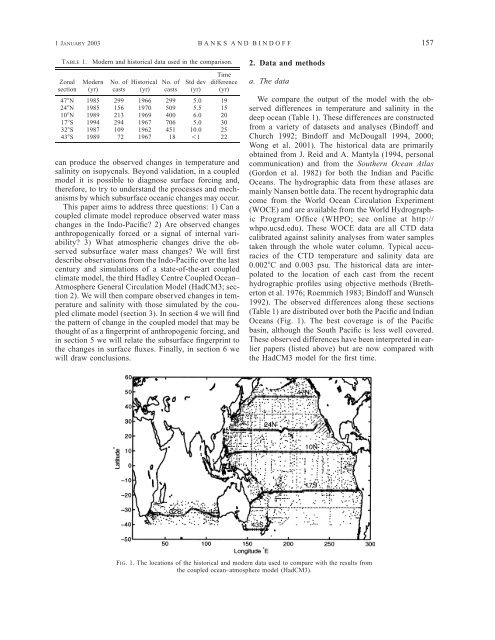
1992). The observed differences along <strong>the</strong>se sections<br />
(Table 1) are distributed over both <strong>the</strong> Pacific <strong>and</strong> Indian<br />
Oceans (Fig. 1). The best coverage is <strong>of</strong> <strong>the</strong> Pacific<br />
bas<strong>in</strong>, although <strong>the</strong> South Pacific is less well covered.<br />
These observed differences have been <strong>in</strong>terpreted <strong>in</strong> earlier<br />
papers (listed above) but are now compared with<br />
<strong>the</strong> HadCM3 model for <strong>the</strong> first time.<br />
FIG. 1. The locations <strong>of</strong> <strong>the</strong> historical <strong>and</strong> modern data used to compare with <strong>the</strong> results from<br />
<strong>the</strong> coupled ocean–atmosphere model (HadCM3).