Oceans Program
Oceans Program Oceans Program
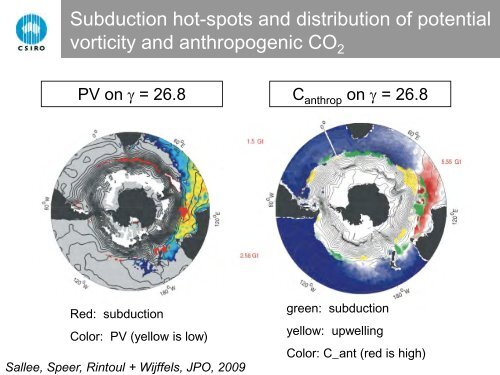
Subduction hot-spots and distribution of potential vorticity and anthropogenic CO 2 PV on γ = 26.8 C anthrop on γ = 26.8 Red: subduction Color: PV (yellow is low) Sallee, Speer, Rintoul + Wijffels, JPO, 2009 green: subduction yellow: upwelling Color: C_ant (red is high)
Sallee, Speer, Rintoul, Nature Geoscience, 2010 Structure and variability of the mixed layer Seasonal variations in mixed layer depth Variations in mixed layer depth with the Southern Annular Mode SAM + SAM -
- Page 1 and 2: The Southern Ocean and Sea-Level Ri
- Page 3 and 4: Research plan: Fieldwork Argo, incl
- Page 5 and 6: Who’s involved? ACE + local partn
- Page 7 and 8: IPCC Oceans chapter outline Chapter
- Page 9 and 10: Overturning circulation acts as a v
- Page 11 and 12: Warming of the abyssal ocean Purkey
- Page 13 and 14: Kerguelen Deep Western Boundary Cur
- Page 15: Subduction hot-spots
- Page 19 and 20: Can IPCC models parameterise the ef
- Page 21 and 22: Trends in sea surface height: 1992-
- Page 23 and 24: Diagnosing the causes of SO change
- Page 25 and 26: East Antarctica more vulnerable tha
- Page 27: Basal melt rates vs. temperature el
- Page 32 and 33: With additional support from The So
- Page 34 and 35: Mawson meets Scott The Monthly, Jul
- Page 36 and 37: EAST-WEST 5 Andrew Meijers + Ben Ga
- Page 38 and 39: Measuring the ACC flow through gaps
- Page 40: Injection of Subantarctic Mode Wate
Subduction hot-spots and distribution of potential<br />
vorticity and anthropogenic CO 2<br />
PV on γ = 26.8<br />
C anthrop on γ = 26.8<br />
Red: subduction<br />
Color: PV (yellow is low)<br />
Sallee, Speer, Rintoul + Wijffels, JPO, 2009<br />
green: subduction<br />
yellow: upwelling<br />
Color: C_ant (red is high)


