WATER IN A CHANGING WORLD - Outorga
WATER IN A CHANGING WORLD - Outorga
WATER IN A CHANGING WORLD - Outorga

You also want an ePaper? Increase the reach of your titles
YUMPU automatically turns print PDFs into web optimized ePapers that Google loves.
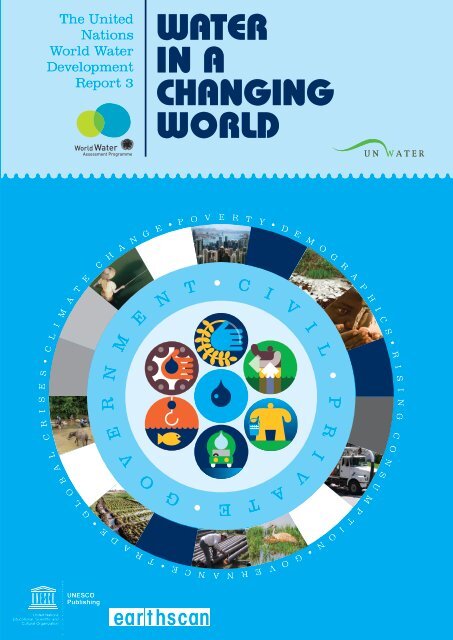
The United<br />
Nations<br />
World Water<br />
Development<br />
Report 3<br />
<strong>WATER</strong><br />
<strong>IN</strong> A<br />
CHANG<strong>IN</strong>G<br />
<strong>WORLD</strong><br />
C L<br />
I M<br />
A T<br />
E C H<br />
M<br />
A N<br />
E<br />
G E<br />
N<br />
P O<br />
•<br />
T<br />
V<br />
E R<br />
•<br />
C<br />
T Y<br />
I<br />
• D<br />
V<br />
E M<br />
I<br />
O G<br />
R A<br />
P H<br />
I C<br />
L<br />
S •<br />
R I<br />
S •<br />
N<br />
•<br />
S E<br />
R I<br />
R<br />
P<br />
S I<br />
N G<br />
E<br />
R<br />
C<br />
C<br />
A L<br />
V<br />
I<br />
O N<br />
O B<br />
G L<br />
E •<br />
O<br />
G<br />
•<br />
E<br />
T<br />
A<br />
V<br />
T I<br />
M P<br />
S U<br />
A D<br />
O N<br />
T R<br />
• G<br />
E •<br />
N C<br />
N A<br />
E R<br />
O V
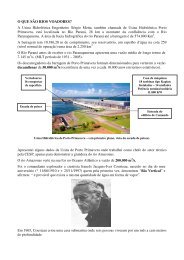
GETT<strong>IN</strong>G OUT OF THE BOX – SPHERE OF DECISION-MAK<strong>IN</strong>G ABOUT <strong>WATER</strong>. Many paths to sustainable development are<br />
linked to water, but the decisions that determine how water resources are used or abused are not made by<br />
water managers alone. That central theme of The United Nations World Water Development Report 3 is illustrated<br />
in this figure (which also appears in chapter 1).<br />
The lower section of the figure, titled Water box, is the realm of water sector management. Here, water managers<br />
inside the water box and managers of other sectors oversee their own management–resource-use<br />
interactions. Above<br />
them are the actors who<br />
DECISION-MAK<strong>IN</strong>G AFFECT<strong>IN</strong>G <strong>WATER</strong><br />
make or influence broad<br />
socioeconomic policies<br />
that affect water.<br />
Political<br />
The cycle begins with<br />
political-process actors –<br />
in government, civil society<br />
and business – deciding<br />
on socio-economic<br />
development objectives<br />
and formulating policy<br />
and operational decisions<br />
to achieve them. Their<br />
decisions, which respond<br />
to life and livelihoods<br />
requirements, are implemented<br />
in a context<br />
of externalities – often<br />
beyond their direct<br />
control – that interact<br />
with and modify drivers<br />
of change, creating<br />
pressures on land and<br />
water resources (among<br />
others).<br />
Water resources managers<br />
address the demands<br />
of water uses to meet<br />
the life-sustaining<br />
requirements of people<br />
and other species and to<br />
create and support livelihoods.<br />
In doing so, they<br />
may add to – or reduce<br />
– the pressures caused by<br />
these drivers. However,<br />
their actions may fall<br />
short of their objectives<br />
because of constraints<br />
related to inadequate<br />
water, financial or human<br />
resources or because<br />
• Economic<br />
• Social<br />
• Environment<br />
• Demographic<br />
• Policy, law and<br />
finance<br />
• Technology<br />
• Climate change<br />
Civil<br />
society<br />
actors<br />
Drivers of<br />
change<br />
Pressures<br />
• Finance<br />
• Exploitation<br />
• Pollution<br />
• Urbanization<br />
• Land use<br />
• Water use<br />
• Climate variability<br />
Water resources<br />
• Rainwater<br />
• Groundwater<br />
• Lakes<br />
• Reservoirs<br />
• Wetlands<br />
• Wastewater<br />
• Desalinated water<br />
Impact<br />
• Policy<br />
formation<br />
• Resource<br />
allocations<br />
• Political and<br />
operational<br />
decisions<br />
Life and<br />
livelihoods<br />
• Aspirations<br />
• Poverty alleviation<br />
• Health and<br />
well-being<br />
• Security<br />
• Employment<br />
the external forces are behaving in unforeseen ways. Making progress thus requires returning to the original<br />
political actors in the decision-making process for responses that take these constraints into account.<br />
Needed in place of this discontinuous decision-making process is one in which water managers inform the initial<br />
decision-making and participate in planning the appropriate responses, interacting with the principal actors and<br />
with the managers of other sectors.<br />
actors<br />
Modify<br />
Other sector<br />
management<br />
Create<br />
Water<br />
box<br />
Affect<br />
Water sector<br />
management<br />
Business and<br />
economic<br />
actors<br />
Response<br />
options<br />
Demand<br />
Water uses<br />
• Domestic<br />
• Agriculture<br />
• Industry<br />
• Energy<br />
• Leisure<br />
• Transport<br />
• Environment<br />
Demand
The United<br />
Nations<br />
World Water<br />
Development<br />
Report 3<br />
<strong>WATER</strong><br />
<strong>IN</strong> A<br />
CHANG<strong>IN</strong>G<br />
<strong>WORLD</strong>
Published jointly by<br />
The United Nations Educational, Scientific and<br />
Cultural Organization (UNESCO)<br />
7, place de Fontenoy, 75007 Paris, France, and<br />
Earthscan, Dunstan House, 14a St Cross Street,<br />
London EC1N 8XA, United Kingdom.<br />
© UNESCO 2009<br />
All rights reserved.<br />
UNESCO ISBN: 978-9-23104-095-5<br />
Earthscan ISBN: 978-1-84407-839-4 (hardback)<br />
978-1-84407-840-0 (paperback)<br />
UNESCO Publishing: http://publishing.unesco.org/<br />
Earthscan: www.earthscan.co.uk<br />
The designations employed and the presentation of material<br />
throughout this publication do not imply the expression of<br />
any opinion whatsoever on the part of UNESCO concerning<br />
the legal status of any country, territory, city or area or of its<br />
authorities, or concerning the delimitation of its frontiers or<br />
boundaries.<br />
The authors are responsible for the choice and the<br />
presentation of the facts contained in this book and for the<br />
opinions expressed therein, which are not necessarily those<br />
of UNESCO and do not commit the Organization.<br />
Suggested citation<br />
World Water Assessment Programme. 2009. The United<br />
Nations World Water Development Report 3: Water in a<br />
Changing World. Paris: UNESCO, and London: Earthscan.<br />
Cover design<br />
Peter Grundy, London, UK<br />
Book design and typesetting<br />
Communications Development Incorporated, Washington, DC<br />
A catalogue record for this book is available from the British<br />
Library.<br />
Library of Congress Cataloging-in-Publication data has been<br />
applied for.<br />
Earthscan strives to minimize its environmental impacts<br />
and carbon footprint by reducing waste, recycling and<br />
offsetting its carbon dioxide emissions, including those<br />
created through publication of this book. For more details of<br />
our environmental policy, see www.earthscan.co.uk.<br />
This Report has been published on behalf of the United<br />
Nations World Water Assessment Programme (WWAP), with<br />
the support of the following organizations:<br />
United Nations Funds and Programmes<br />
United Nations Centre for Human Settlements<br />
(UN-HABITAT)<br />
United Nations Children’s Fund (UNICEF)<br />
United Nations Conference on Trade and Development<br />
(UNCTAD)<br />
United Nations Department of Economic and Social Affairs<br />
(UNDESA)<br />
United Nations Development Programme (UNDP)<br />
United Nations Environment Programme (UNEP)<br />
United Nations High Commissioner for Refugees (UNHCR)<br />
United Nations University (UNU)<br />
Specialized UN Agencies<br />
Food and Agriculture Organization (FAO)<br />
International Atomic Energy Agency (IAEA)<br />
International Bank for Reconstruction and Development<br />
(World Bank)<br />
World Health Organization (WHO)<br />
World Meteorological Organization (WMO)<br />
United Nations Educational, Scientific and Cultural<br />
Organization (UNESCO)<br />
International Fund for Agricultural Development (IFAD)<br />
United Nations Industrial Development Organization (UNIDO)<br />
United Nations Regional Commissions<br />
Economic Commission for Europe (ECE)<br />
Economic and Social Commission for Asia and the Pacific<br />
(ESCAP)<br />
Economic Commission for Africa (ECA)<br />
Economic Commission for Latin America and the Caribbean<br />
(ECLAC)<br />
Economic and Social Commission for Western Asia (ESCWA)<br />
Secretariats of United Nations Conventions and Decades<br />
Secretariat of the Convention to Combat Desertification (CCD)<br />
Secretariat of the Convention on Biological Diversity (CBD)<br />
Secretariat of the United Nations Framework Convention on<br />
Climate Change (FCCC)<br />
Secretariat of the International Strategy for Disaster<br />
Reduction (ISDR)<br />
This book was printed in the<br />
United Kingdom by Butler,<br />
Tanner & Dennis. The paper<br />
used is certified by the Forest<br />
Stewardship Council (FSC), and<br />
the inks are vegetable based.
Table of contents<br />
Foreword by Ban Ki-moon, Secretary‐General, United Nations<br />
Foreword by Koïchiro Matsuura, Director‐General, United Nations<br />
Economic, Scientific and Cultural Organization vii<br />
Preface<br />
ix<br />
Acknowledgements<br />
xiii<br />
Overview of key messages<br />
xix<br />
Water in a changing world 1<br />
Chapter 1 Getting out of the box – linking water to decisions<br />
for sustainable development 3<br />
Opening the water box 4<br />
Sustainable development as the framework for water management 6<br />
Investing in water 9<br />
Global crises and water 14<br />
The need for action – now 20<br />
Structure of the Report 21<br />
Part 1 Understanding what drives the pressures on water 25<br />
Chapter 2 Demographic, economic and social drivers 29<br />
Demographic drivers 29<br />
Economic drivers 32<br />
Social drivers 36<br />
Chapter 3 Technological innovation 41<br />
Recent trends and advances in science and technology 42<br />
The technology dissemination challenge 45<br />
Chapter 4 Policies, laws and finance 49<br />
Policies and laws 49<br />
Financing – the missing link 56<br />
Chapter 5 Climate change and possible futures 68<br />
The influence of climate change on the other drivers of change 69<br />
Identifying possible futures: the need for scenarios 74<br />
Challenges for summarizing the pressures of external drivers on water resources 75<br />
Part 2 Using water 77<br />
Chapter 6 Water’s many benefits 80<br />
Water for economic development 81<br />
Water and poverty reduction 83<br />
Water and health 88<br />
Maintaining ecosystem services 91<br />
Chapter 7 Evolution of water use 96<br />
Water use in the world 97<br />
Domestic water supply and sanitation 102<br />
Water use in agriculture 106<br />
Water for industry and energy 115<br />
v<br />
Water in a changing world<br />
iii
Table of contents<br />
In-stream water uses 120<br />
Chapter 8 Impacts of water use on water systems and the environment 127<br />
How water use affects water resources 128<br />
Seeking sustainable management of groundwater 131<br />
Growing risks: pollution and degradation of water quality 136<br />
Progress in mitigating pollution 139<br />
Progress in achieving environmental sustainability 145<br />
Chapter 9 Managing competition for water and the pressure on ecosystems 150<br />
Type, extent and effect of competition for water 150<br />
Managing competition through supply and demand management and reallocation 154<br />
Part 3 State of the resource 160<br />
Chapter 10 The Earth’s natural water cycles 166<br />
Overview of the global hydrologic cycle 166<br />
Relationship of water to global biogeochemical cycles 172<br />
Chapter 11 Changes in the global water cycle 181<br />
Changes in the water cycle 181<br />
Links between the terrestrial carbon and water cycles 196<br />
Is the hydrologic cycle accelerating? 200<br />
Assessing future impacts of climate change 201<br />
Summary 202<br />
Chapter 12 Evolving hazards – and emerging opportunities 211<br />
Hazards vary with climate regions 211<br />
Changes in average streamflow 212<br />
Changes in extreme events 213<br />
Changes in groundwater 217<br />
Changes in erosion, landslides, river morphology and sedimentation patterns 217<br />
Challenges: hazards and opportunities 222<br />
Chapter 13 Bridging the observational gap 226<br />
The importance of hydrologic observations 226<br />
Recent developments in observation methods, networks and monitoring 227<br />
Changing status of operational data over the recent past 228<br />
Opportunities and challenges 234<br />
Some suggestions for bridging the observational gap 235<br />
Part 4 Responses and choices 237<br />
Chapter 14 Options inside the water box 241<br />
Water governance reform: strengthening policy, planning and institutions 242<br />
Consulting with stakeholders and avoiding corruption: accountability in planning,<br />
implementation and management 251<br />
Capacity development for more effective action 254<br />
Developing appropriate solutions through innovation and research 258<br />
Data and information needs 260<br />
Financing 261<br />
Chapter 15 Options from beyond the water box 269<br />
Promoting win-win scenarios by creating space for change 270<br />
Clearing pathways towards win-win situations: avoiding negative impacts 273<br />
Promoting win-win scenarios through cooperation and knowledge 275<br />
Sustaining change: changing habits through awareness 285<br />
Ensuring sustainable financing 286<br />
Chapter 16 The way forward 291<br />
Making water an integral part of all planning and management decisions 292<br />
Working towards better development outcomes 295<br />
Deciding – and acting! 296<br />
Appendix 1 World Water Development Report indicators 298<br />
Appendix 2 Water-related goals and objectives of major<br />
conferences and forums, 1972-present 302<br />
Abbreviations, data notes and units of measure 306<br />
List of boxes, figures, maps and tables 308<br />
Index 313<br />
iv World Water Development Report 3
Foreword by<br />
Ban Ki-moon,<br />
Secretary‐General,<br />
United Nations<br />
It is well known that water is life; what this Report shows is that water also means livelihoods.<br />
It is the route out of poverty for individuals and communities. Managing water is<br />
essential if the world is to achieve sustainable development.<br />
This challenge is even more pressing as the world confronts the triple threats of climate<br />
change, rising food and energy costs, and the global economic crisis. All three are exacerbating<br />
poverty, inequality and underdevelopment.<br />
The United Nations has responded by consolidating our work and joining with partners<br />
who can make a difference through UN-Water, which brings together more than two<br />
dozen UN agencies and other stakeholders. The initiative’s World Water Assessment Programme<br />
is setting an example of system-wide cooperation based on the understanding<br />
that water is such a central consideration that it must be an integral part of all planning<br />
and investments.<br />
Developing countries and countries in transition are striving to manage their water resources<br />
more effectively. I call on the bilateral donors to support those efforts by increasing<br />
water’s share of official development assistance above the current level of 5.4%.<br />
This is important not only for development; it is a matter of security, too. Lack of basic<br />
services can contribute to political instability. Armed conflicts can further disrupt these<br />
services.<br />
There has been a widespread failure to recognize water’s vital role in providing food, energy,<br />
sanitation, disaster relief, environmental sustainability and other benefits. This has<br />
left hundreds of millions of people suffering from poverty and ill health and exposed to<br />
the risks of water-related diseases.<br />
This situation is unconscionable. Governments and the international development<br />
community must make more and immediate investments in water management and<br />
related infrastructure. We must all work together to address this matter of life and livelihoods.<br />
This Report is meant to spur such action, and I commend it to a wide global<br />
audience.<br />
Ban Ki-moon<br />
Secretary-General<br />
United Nations<br />
Water in a changing world<br />
v
Foreword by<br />
Koïchiro Matsuura,<br />
Director‐General,<br />
United Nations Educational,<br />
Scientific and Cultural<br />
Organization<br />
With the release of this third edition of The United Nations World Water Development Report,<br />
it is clear that urgent action is needed if we are to avoid a global water crisis. Despite<br />
the vital importance of water to all aspects of human life, the sector has been plagued by<br />
a chronic lack of political support, poor governance and underinvestment. As a result,<br />
hundreds of millions of people around the world remain trapped in poverty and ill<br />
health and exposed to the risks of water-related disasters, environmental degradation and<br />
even political instability and conflict. Population growth, increasing consumption and<br />
climate change are among the factors that threaten to exacerbate these problems, with<br />
grave implications for human security and development.<br />
The current Report provides a comprehensive analysis of the state of the world’s freshwater<br />
resources. It also, for the first time, shows how changes in water demand and<br />
supply are affected by and affect other global dynamics. It represents a considerable collaborative<br />
achievement for the 26 UN agencies that make up UN-Water and are engaged<br />
in the World Water Assessment Programme (WWAP), which leads the monitoring and<br />
evaluation behind the Report. UNESCO is very proud to have played a pivotal role in the<br />
launch of this flagship programme and to continue to support its work by housing the<br />
WWAP Secretariat. I am confident that this third volume will prove crucial as a working<br />
tool for policy-makers and other stakeholders, providing solid evidence from which to<br />
develop an effective and sustainable approach to water issues.<br />
The Report could not come at a more important time. We have passed the halfway point<br />
towards the 2015 target date for achieving the Millennium Development Goals, and<br />
despite progress, massive challenges remain. Millennium Development Goal 7 calls for<br />
halving the proportion of people without sustainable access to safe drinking water and<br />
basic sanitation. While the world is on track to achieve the water target globally, large<br />
regions of the world and many countries lag behind, and some risk backsliding. This<br />
is particularly the case in sub-Saharan Africa and low-income Arab states. On current<br />
trends the sanitation target will be missed by a wide margin in the majority of developing<br />
countries. But water is linked not only to Millennium Development Goal 7. It also<br />
directly affects, as this Report establishes, the achievement of all eight Millennium<br />
Development Goals, including, notably, the first goal, the eradication of extreme poverty<br />
and hunger.<br />
Water is a cross-cutting issue that demands a coordinated approach. Our success in avoiding<br />
a global water crisis is directly linked to our ability to address other global challenges,<br />
from poverty eradication and environmental sustainability to fluctuating food and energy<br />
costs and financial turmoil in world economies. It is therefore imperative that global<br />
risks, including those associated with water, be dealt with in an integrated manner. We<br />
must develop interdisciplinary tools that can take into account different drivers such as<br />
climate change and financial markets to achieve sustainable water management. This<br />
Water in a changing world<br />
vii
Foreword<br />
requires the engagement of all stakeholders, particularly government leaders, as well as<br />
global coordination through the UN system.<br />
Water is essential to facing today’s global challenges and achieving the Millennium<br />
Development Goals. As such, it should be a priority for the United Nations and the global<br />
community as a whole. Be assured that UNESCO stands ready to play its part in this<br />
process.<br />
Koïchiro Matsuura<br />
Director-General<br />
United Nations Educational, Scientific and Cultural Organization<br />
viii World Water Development Report 3
Preface<br />
In 1999 the United Nations system resolved to issue regular editions of The United Nations<br />
World Water Development Report. An expert group, convened by the United Nations Department<br />
of Economic and Social Affairs, developed recommendations for the objectives<br />
and targeted audience of the report (box 1).<br />
The first edition, The United Nations World Water Development Report: Water for People,<br />
Water for Life, was released in March 2003 at the 3rd World Water Forum in Kyoto,<br />
Japan. The second, Water, a Shared Responsibility, was released in March 2006 at the 4th<br />
World Water Forum in Mexico City. The first report provided an inaugural assessment of<br />
progress since the 1992 United Nations Conference on Environment and Development<br />
in Rio de Janeiro. Both reports were based on key challenge areas (such as water for food,<br />
water for energy, and challenges for governance). Stand-alone assessments were prepared<br />
by UN agencies. The assessments included pilot case studies on which the Report drew in<br />
developing appropriate assessment methodologies and lessons learned.<br />
This third edition embraces a holistic structure and focuses on the second objective<br />
established by the expert group – to accelerate coverage and investments for basic<br />
human water needs (drinking water supply, sanitation and health, food security, mitigation<br />
of floods and droughts and prevention of conflicts), giving priority to developing<br />
countries.<br />
Contents of the Report<br />
A major theme of this Report is that important decisions affecting water management are<br />
made outside the water sector and are driven by external, largely unpredictable forces –<br />
forces of demography, climate change, the global economy, changing societal values and<br />
norms, technological innovation, laws and customs and financial markets. Many of these<br />
external drivers are dynamic, and changes are accelerating. The conceptual framework<br />
Box 1<br />
Objectives and targeted audience of The United Nations World<br />
Water Development Report<br />
It is recommended that The United Nations<br />
World Water Development Report be targeted for<br />
national decision-makers and water resources<br />
managers, with two complementary objectives:<br />
• To strengthen and stimulate national capacities<br />
and cross-sector institutions in integrated<br />
water development planning and in sustainable<br />
management of water resources at river<br />
basin and aquifer levels.<br />
• To stimulate an acceleration of coverage and<br />
investments, in priority, for basic human<br />
water needs (drinking water supply, sanitation<br />
and health, food security, mitigation of floods<br />
and droughts and prevention of conflicts),<br />
giving a priority to developing countries.<br />
A more effective and targeted support of the international<br />
community for such local and national<br />
efforts would also be an important objective of<br />
this awareness-raising and action-oriented report.<br />
Source: United Nations Expert Group Meeting to<br />
Examine Methodologies for the Preparation of a Biennial<br />
‘World Water Development Report’, convened and<br />
organized by the UN Department of Economic and<br />
Social Affairs, New York, 11-14 January 2000.<br />
Water in a changing world<br />
ix
Preface<br />
that evolved for the Report is on the inside front cover of the Report and in figure 1.1 in<br />
chapter 1. The figure illustrates how developments outside the water domain influence<br />
water management strategies and policies. The Report emphasizes that decisions in other<br />
sectors and those related to development, growth and livelihoods should incorporate<br />
water as an integral component, including responses to climate change, food and energy<br />
challenges and disaster management.<br />
At the same time, the Report’s analysis of the state of the world’s water resources is imbedded<br />
in a more expansive context of what can be accomplished through water management.<br />
The analysis leads to a set of responses and recommendations for action that<br />
differ from those that have emerged from more introspective analyses of the water sector<br />
because they incorporate the contribution of water to sustainable development.<br />
This Report offers a holistic approach to links between water and climate change, food,<br />
energy, health and human security. Human security, broadly conceived, includes basic<br />
needs for food, water, health, livelihoods and a place to live – issues addressed in the<br />
Millennium Development Goals. As the second part of the Fourth Assessment Report of<br />
the Intergovernmental Panel on Climate Change (IPCC), released in April 2007, demonstrates,<br />
poor people are likely to suffer most from the effects of climate change. 1<br />
New processes<br />
In keeping with the Report’s broader view on policy options, new processes were applied<br />
in preparing this Report. Fuller treatment is given to such topics as climate change, business<br />
and trade, financing, the role of the private sector, water transport and innovations<br />
and new technologies.<br />
The United Nations Expert Group recommendation to involve countries in preparing the<br />
reports was reflected in the first edition in case studies based on 10 countries (including<br />
10 national river basins) with different physical, climate and socioeconomic conditions.<br />
This method was followed in the second edition and in this Report, which presents the<br />
case studies in a companion volume to the main report. The World Water Assessment<br />
Programme is also launching a series of supporting publications that include scientific<br />
side papers, topic and sector reports and dialogue reports, taking the programme out of<br />
its rigid three-year cycle.<br />
The preparatory process for this Report has followed an inclusive, participatory approach<br />
benefiting from opinion and feedback from the scientific, professional and decision-making<br />
communities from within and outside the water sector.<br />
Broader input to the Report and the World Water Assessment Programme processes in<br />
general has been achieved through four mechanisms:<br />
• A Technical Advisory Committee of 11 prominent individuals from around the world<br />
with water sector expertise and broader policy-making experience in their countries<br />
and internationally.<br />
• Expert groups on indicators, monitoring and data/metadata bases; scenarios; climate<br />
change and water; policy relevance; business, trade, finance and the private sector;<br />
legal issues and water storage.<br />
• A Report team composed of UN-Water member agencies, their professional and<br />
non-governmental organization partners and the broader community of water and<br />
water-related sectors.<br />
• Stakeholder engagement through the World Water Assessment Programme Website<br />
and review processes, including public as well as solicited input and feedback from<br />
hundreds of individuals and organizations.<br />
1.<br />
‘Poor communities can be especially vulnerable, in particular those concentrated in high risk areas.<br />
They tend to have more limited adaptive capacities and are more dependent on climate-sensitive<br />
resources such as local water and food supplies.’ (IPCC, 2007, Summary for Policymakers. In Climate<br />
Change 2007: Impacts, Adaptation and Vulnerability. Contribution of Working Group II to the Fourth<br />
Assessment Report of the Intergovernmental Panel on Climate Change, eds., M. L. Parry, O. F. Canziani,<br />
J. P. Palutikof, P. J. van der Linden and C. E. Hanson, Cambridge, UK: Cambridge University Press, p. 9).<br />
x World Water Development Report 3
Preface<br />
This Report marks a transition from the first two reports – a transition from being a<br />
report primarily for water managers to being a report for leaders at all levels of government,<br />
the private sector and civil society, whose decisions depend on the availability of<br />
water resources and make demands on water management. The Expert Group on Policy<br />
Relevance consulted hundreds of such leaders to obtain their views on policy issues<br />
relevant to the water sector. At the same time, the Report continues to provide useful<br />
data for water managers on the state and use of this precious resource. Past reports have<br />
looked at trends based on historical data. It is clear that change is accelerating and that<br />
the effects of change are not easily projected from trends. To help us understand possible<br />
futures and how to cope with their impact on water resources, the World Water Assessment<br />
Programme process looks at the development of scenarios that will serve the fourth<br />
World Water Development Report. This scenario effort takes into account the main drivers<br />
of water, including demographics, climate change, social and economic processes and<br />
technology, along with their interactions.<br />
In preparing this Report new data were available to update only a third of the 60-plus<br />
indicators that were reported in the second edition. And some indicators were found to<br />
be no longer valid. The lack of data was echoed by the coordinators and authors of this<br />
Report, who found that indicators and data were often not available for analysing and<br />
reporting on issues considered important. As a consequence, a new process was developed<br />
for indicators and monitoring that aims at a better understanding of the trends<br />
and developments, including changes, in the state of water resources, their uses and the<br />
interface between the state and water uses and between water and other sectors. This reflects<br />
a recommendation of Agenda 21 – a comprehensive plan of action agreed at the Rio<br />
Summit for all areas of human impact on the environment – that a detailed data collection<br />
for both fluxes of ‘exploitable water resources’ and of ‘associated costs and finances’<br />
be conducted within a comprehensive plan for water development at the basin level. 2<br />
To this end, the World Water Assessment Programme established an Expert Group on<br />
Indicators, Monitoring and Data/Metadata Bases, and UN-Water established a Task Force<br />
on Indicators, Monitoring and Reporting, which is coordinated by the World Water<br />
Assessment Programme. Their results will be reported by the World Water Assessment<br />
Programme in a process leading to the fourth World Water Development Report and by UN-<br />
Water. A table showing the status of indicators reported on in this Report is presented in<br />
appendix 1. More detailed information may be found at www.unesco.org/water/wwap.<br />
Few countries know how much water is being used and for what purposes, the quantity<br />
and quality of water that is available and that can be withdrawn without serious environmental<br />
consequences and how much is being invested in water management and<br />
infrastructure. Despite the availability of new remote sensing and geographic information<br />
system technologies that can simplify monitoring and reporting and despite the growing<br />
need for such information in an increasingly complex and rapidly changing world, less is<br />
known with each passing decade. Strengthening such information systems is vital not only<br />
at a national scale but also at a global scale – to inform the construction of global models of<br />
the hydrologic cycle and decisions on where interventions, including external aid, would<br />
be most useful. Chapters 10 and 13 of the Report, in particular, treat this subject.<br />
Challenges remain in managing water resources for development<br />
The contribution of sustainable access to safe drinking water and adequate sanitation<br />
to achieving the Millennium Development Goals is well established. Largely ignored,<br />
however, is the fact that water resources are at the core of many of the Millennium Development<br />
Goals on which progress is lagging. This Report and others elaborate the direct<br />
and indirect contributions of water management across all the Millennium Development<br />
Goals.<br />
It is not enough to hope that the trickle-down effects of economic growth will result in<br />
equitable distribution that includes the poor. The economic growth and poverty-reducing<br />
contributions of water resources must be made explicit and specific at the country<br />
level. Intergovernmental efforts must support such actions and maintain the momentum<br />
of the global commitments made since the Millennium Declaration in 2000.<br />
2.<br />
United Nations, 1992, Agenda 21, Chapter 18, Protection of the Quality and Supply of Freshwater<br />
Resources: Application of Integrated Approaches to the Development, Management and Use of Water<br />
Resources, New York: Department of Economic and Social Affairs, United Nations.<br />
Water in a changing world<br />
xi
Preface<br />
While mitigation of anthropogenic climate change is vital, the blunt reality is that all<br />
countries – particularly developing countries that will be hit hardest and earliest – and business<br />
sectors must also adapt to climate change. Even if greenhouse gas concentrations stabilize<br />
in the coming years, some impacts from climate change are unavoidable. These include<br />
increasing water stress in many regions, more extreme weather events, the potential for large<br />
population migration and the disruption of international markets. These challenges cannot<br />
be separated from the challenges of sustainable development in a complex global context.<br />
This report provides evidence of the need for public investments in water resources infrastructure<br />
and implementation capacity. It also provides evidence of the vital importance of<br />
water resources and environmental sustainability to engage the private sector, civil society<br />
and communities to invest and become involved, offering examples of how this can be done.<br />
Bilateral donors, important in funding water investments, must avoid the temptation to<br />
reduce their aid budgets during the current global financial and economic crises. Multilateral<br />
aid could be an important source of financing for many years to come. Yet both bilateral<br />
and multilateral donors appear not to recognize the contribution of the water sector<br />
to growth: the water sector’s share of official development assistance has remained below<br />
6% for some time. This said, the flow of official development assistance has increased in<br />
recent years and so has the water component in dollar terms. But most of the increase has<br />
gone to water supply (and sanitation, to a lesser degree), while aid flows to other water sectors<br />
have stagnated in dollar terms and fell as a percentage of total assistance.<br />
Like other physical infrastructure, water infrastructure deteriorates over time and needs<br />
repair and replacement. Investment is also required in operation and maintenance and in<br />
developing the capacity of the sector so that infrastructure meets appropriate standards<br />
and functions efficiently.<br />
The case of sub-Saharan Africa<br />
Sub-Saharan Africa, in particular, remains mired in poverty. Its progress towards achieving<br />
the Millennium Development Goals lags behind that of other regions. The percentage<br />
of the population living in absolute poverty is essentially the same as it was 25<br />
years ago. About 340 million Africans lack access to safe drinking water, and almost 500<br />
million lack access to adequate sanitation. Countries in sub-Saharan Africa store only<br />
about 4% of their annual renewable flows, compared with 70%-90% in many developed<br />
countries, yet water storage is essential to ensure reliable sources of water for irrigation,<br />
water supply and hydropower and to provide a buffer for flood management.<br />
The need to act now<br />
The challenges that face decision-makers are numerous. The context in which they must<br />
make decisions is not well defined. This Report does not attempt to provide a full set of<br />
answers. But it identifies the key issues that must be faced. It describes some of the ways<br />
that decision-makers have dealt with these challenges, providing options for consideration<br />
across levels of government and sectors.<br />
Despite the many unknowns, we need to act now – with decisions about investments in<br />
water infrastructure and in implementation capacity to enable environmentally sustainable<br />
economic growth and social development and with decisions on safety nets to ensure<br />
basic services that protect the poor.<br />
We hope that this third United Nations World Water Development Report will stimulate<br />
decision-makers in government, the private sector and civil society to act.<br />
Olcay Ünver<br />
World Water Assessment Programme Coordinator<br />
United Nations Educational, Scientific and Cultural<br />
Organization<br />
William Cosgrove<br />
United Nations World Water<br />
Development Report 3<br />
Content Coordinator<br />
xii World Water Development Report 3
Acknowledgements<br />
This Report would not have been possible without the essential and gracious support<br />
of many individuals. The personal support and interest of Koïchiro Matsuura, Director-<br />
General of the United Nations Educational, Scientific and Cultural Organization (UNESCO),<br />
created an enabling environment. The leadership and guidance of Andras Szöllösi-Nagy,<br />
director of the Division of Water Sciences of UNESCO, allowed the World Water Assessment<br />
Programme (WWAP) team to mobilize its collective energy and capacity in the best way<br />
possible. Pasquale Steduto, chair of UN-Water and chief of the Land and Water Division of<br />
the Food and Agriculture Organization of the United Nations (FAO), graciously extended his<br />
catalytic support during a challenging process of preparation and production.<br />
The leadership of Uri Shamir, chair of the Report’s Technical Advisory Committee and<br />
professor of engineering at Technion-Israeli Institute of Technology, and the expertise<br />
of the committee members helped create a product of sound scientific basis and superior<br />
quality, which was further enhanced by the work of WWAP’s Expert Groups. We<br />
acknowledge the efforts of Gerald Galloway, professor of engineering at the University of<br />
Maryland, in helping to reach out to hundreds of decision-makers worldwide, enabling<br />
the Report to be policy relevant to its primary intended audience.<br />
We acknowledge the support of the World Bank, FAO and Organisation for Economic<br />
Co-operation and Development in providing the most recent data and information available,<br />
sometimes before they were published. We especially thank the Italian Ministry of<br />
Environment, Land and Sea for its generous provision of funds; the Italian Ministry of<br />
Foreign Affairs for its support; and the government of the Umbria Region of Italy for the<br />
beautiful new premises that now house the WWAP at the Villa La Colombella, Perugia.<br />
We thank the Report’s editors, Bruce Ross-Larson and Meta de Coquereaumont, and<br />
their production team at Communications Development Incorporated – Joseph Caponio,<br />
Amye Kenall, Allison Kerns, Christopher Trott and Elaine Wilson – for the extraordinary<br />
support they provided.<br />
The WWAP also thanks the following individuals and organizations from around the<br />
world for their generous and varied contributions to the Report.<br />
UN-Water<br />
Pasquale Steduto, chair; Aslam Chaudhry, Johan Kuylenstierna and Frederik Pischke<br />
UNESCO<br />
Alice Aureli, Jonathan Baker, Jeanne Damlamian, Siegfried Demuth, Walter Erdelen,<br />
Rosanna Karam, Shahbaz Khan, Anil Mishra, Djaffar Moussa-Elkadhum, Anna Movsisyan,<br />
Mohan Perera, Amale Reinholt-Gauthier, Léna Salamé and Alberto Tejada-Guibert<br />
World Water Development Report 3 teams<br />
Chapter coordinators<br />
Tim Kasten (UNEP) with the support of Thomas Chiramba (UNEP); Andras Szöllösi-Nagy<br />
(UNESCO) and Wolfgang Grabs (WMO), associate coordinator, with the support of<br />
Siegfried Demuth (UNESCO) and Anil Mishra (UNESCO); Jean-Marc Faurès (FAO);<br />
Håkan Tropp (UNDP Water Governance Facility); Olcay Ünver (WWAP)<br />
Water in a changing world<br />
xiii
Acknowledgements<br />
Content coordinator<br />
William Cosgrove<br />
Process manager<br />
George de Gooijer<br />
Chapter facilitators<br />
Richard Connor, William Cosgrove, George de Gooijer, Denis Hughes and Domitille Vallée<br />
Graphics coordinator<br />
Akif Altundaş<br />
WWAP publications coordinator<br />
Samantha Wauchope<br />
United Nations World Water Assessment Programme<br />
Technical Advisory Committee<br />
Uri Shamir, chair; Dipak Gyawali, deputy chair; Fatma Attia, Anders Berntell,<br />
Elias Fereres, M. Gopalakrishnan, Daniel Pete Loucks, Laszlo Somlyody, Lucio Ubertini,<br />
Henk van Schaik, Albert Wright<br />
Sponsors and donors<br />
Italian Ministry of Environment, Land and Sea; Government of Region of Umbria, Italy;<br />
Government of Japan; UNESCO Etxea, Basque Water Agency (URA) and Danish International<br />
Development Assistance; and US Army Corps of Engineers, Institute for Water Resources<br />
Secretariat<br />
Olcay Ünver, coordinator; Michela Miletto, deputy coordinator; Akif Altundaş,<br />
Floriana Barcaioli, Adriana Fusco, Lisa Gastaldin, Georgette Gobina, Simone Grego,<br />
Shaukat Hakim, Rosanna Karam, Engin Koncagül, Lucilla Minelli, Stéfanie Néno,<br />
Abigail Parish, Daniel Perna, Jean-Baptiste Poncelet, Astrid Schmitz, Marina Solecki,<br />
Toshihiro Sonoda, Jair Torres, Domitille Vallée, Casey Walther and Samantha Wauchope<br />
Expert groups<br />
Indicators, monitoring and databases<br />
Mike Muller and Roland Schulze, co-chairs; Joseph Alcamo, Amithirigala Jayawardena,<br />
Torkil Jønch-Clausen, Peter C. Letitre, Aaron Salzberg, Charles Vörösmarty, Albert Wright<br />
and Daniel Zimmer<br />
Business, trade, finance and involvement of private sector<br />
Ger Bergkamp and Jack Moss, co-chairs; Margaret Catley-Carlson, Joppe Cramwinckel,<br />
Mai Flor, Richard Franceys, Jürg Gerber, Gustavo Heredia, Karin Krchnak, Neil McLeoud,<br />
Herbert Oberhansli, Jeremy Pelczer and Robin Simpson<br />
Climate change and water<br />
Pierre Baril and BertJan Heij, co-chairs; Bryson Bates, Filippo Giorgi, Fekri Hassan,<br />
Daniela Jacob, Pavel Kabat, Levent Kavvas, Zbigniew Kundzewicz, Zekai Şen and<br />
Roland Shulze<br />
Legal issues<br />
Stefano Burchi and Patricia Wouters, co-chairs; Rutgerd Boelens, Carl Bruch,<br />
Salman M. A. Salman, Miguel Solanes, Raya Stephan and Jessica Troell<br />
Policy relevance<br />
Gerry Galloway and Dipak Gyawali, co-chairs; Adnan Badran, Qiu Baoxing,<br />
Antonio Bernardini, Benito Braga, Max Campos, Peter Gleick, Rajiv Gupta,<br />
Mohammed Ait Kadi, Celalettin Kart, Juliette Biao Koudenoukpo, Juan Mayr, Jack Moss,<br />
Mike Muller, Hideaki Oda, Marc Overmars, Victor Pochat, Jerome Delli Priscoli,<br />
Cletus Springer, Carel de Villeneuve, Zhang Xiangwei and Jiao Yong<br />
Scenarios<br />
Joseph Alcamo and Gilberto Gallopin, co-chairs; Vahid Alavian, Nadezhda Gaponenko,<br />
Allen Hammond, Kejun Jiang, Emilio Lebre la Rovere, Robert Martin, David Molden,<br />
xiv World Water Development Report 3
Acknowledgements<br />
Mike Muller, Mark Rosegrant, Igor Shiklomanov, Jill Slinger, Narasingarao Sreenath,<br />
Ken Strzepek, Isabel Valencia and Wang Rusong<br />
Storage<br />
Luis Berga and Johan Rockström, co-chairs; Alison Bartle, Jean-Pierre Chabal,<br />
William Critchley, Nuhu Hatibu, Theib Oweis, Michel de Vivo, Arthur Walz and<br />
Carissa Wong<br />
Contributing and partner organizations<br />
AquaFed; Conservation International; Global Water Partnership; International Centre<br />
for Water Hazard and Risk Management; International Institute for Advanced Systems<br />
Analysis; International Research and Training Center on Erosion and Sedimentation;<br />
International Water Association; Organisation for Economic Co-operation and Development;<br />
Stockholm Environment Institute; UNDP Water Governance Facility at Stockholm<br />
International Water Institute; UN-Water Decade Programme on Capacity Development;<br />
UNEP-DHI Centre for Water and Environment; University of Dundee Centre for Water<br />
Law, Policy and Science; UNESCO-IHE Institute for Water Education; World Business<br />
Council on Sustainable Development and World Water Council<br />
Case studies<br />
Editor<br />
Engin Koncagül (WWAP)<br />
Editorial team<br />
Rebecca Brite and Alison McKelvey Clayson<br />
Maps<br />
AFDEC<br />
Case study contributors<br />
Argentina, Bolivia, Brazil, Paraguay and Uruguay (La Plata River basin)<br />
Miguel Ángel López Arzamendia, Silvia González, Verónica Luquich, Victor Pochat and<br />
staff of the Intergovernmental Coordinating Committee of the La Plata River Basin<br />
Bangladesh<br />
Saiful Alam, Mozaddad Faruque, Azizul Haque, Md. Anwarul Hoque,<br />
Jalaluddin Md. Abdul Hye, Md. Azharul Islam, Andrew Jenkins, A. H. M. Kausher,<br />
Hosne Rabbi, Md. Mustafizur Rahman, Md. Shahjahan and the Bangladesh Ministry of<br />
Water Resources<br />
Brazil and Uruguay (Lake Merín Basin)<br />
Gerardo Amaral, José Luis Fay de Azambuja, Ambrosio Barreiro, Artigas Barrios,<br />
Jorge Luiz Cardozo, Daniel Corsino, Adolfo Hax Franz, Henrique Knorr, Fiona Mathy,<br />
Juan José Mazzeo, Joao Menegheti, Claudio Pereira, Jussara Beatriz Pereira,<br />
Martha Petrocelli, Carlos María Prigioni, Hamilton Rodrigues, Aldyr Garcia Schlee,<br />
Carlos María Serrentino, Manoel de Souza Maia and Silvio Steinmetz<br />
Cameroon<br />
Kodwo Andah and Mathias Fru Fonteh<br />
China<br />
Dong Wu, Hao Zhao, Jin Hai, Ramasamy Jayakumar, Liu Ke, Pang Hui, Shang Hongqi,<br />
Song Ruipeng, Sun Feng, Sun Yangbo and Xu Jing<br />
Estonia<br />
Erki Endjärv, Harry Liiv, Peeter Marksoo and Karin Pachel<br />
Finland and Russian Federation (Vuoksi River basin)<br />
Natalia Alexeeva, Sari Mitikka, Raimo Peltola, Bertel Vehviläinen, Noora Veijalainen and<br />
Riitta-Sisko Wirkkala<br />
Italy<br />
Beatrice Bertolo and Francesco Tornatore<br />
Water in a changing world<br />
xv
Acknowledgements<br />
Republic of Korea<br />
Republic of Korea Ministry of Land, Transport and Maritime Affairs<br />
Netherlands<br />
Marcel E. Boomgaard, Joost J. Buntsma, Michelle J. A. Hendriks, Olivier Hoes,<br />
Rens L. M. Huisman, Jan Koedood, Ed R. Kramer, Eric Kuindersma, Cathelijn Peters,<br />
Jan Strijker, Sonja Timmer, Frans A. N. van Baardwijk, Tim van Hattum and Hans Waals<br />
Pacific Islands<br />
Marc Overmars, Hans Thulstrup and Ian White<br />
Pakistan<br />
Ch. Muhammad Akram, Mi Hua and Zamir Somroo<br />
Spain (Autonomous Community of the Basque Country)<br />
Fernando Díaz Alpuente, Ana Oregi Bastarrika, Iñaki Urrutia Garayo, Mikel Mancisidor,<br />
Sabin Intxaurraga Mendibil, Josu Sanz and Tomás Epalza Solano<br />
Sri Lanka<br />
M. M. M. Aheeyar, Sanath Fernando, K. A. U. S. Imbulana, V. K. Nanayakkara,<br />
B. V. R. Punyawardena, Uditha Ratnayake, Anoja Seneviratne, H. S. Somatilake,<br />
P. Thalagala and K. D. N. Weerasinghe<br />
Sudan<br />
Gamal Abdo, Abdalla Abdelsalam Ahmed, Kodwo Andah, Abdin Salih,<br />
Swaziland<br />
Kodwo Andah, E. J. Mwendera and the Swaziland Department of Water Affairs<br />
Tunisia<br />
Mustapha Besbes, Jamel Chaded, Abdelkader Hamdane and Mekki Hamza<br />
Turkey (Istanbul)<br />
Gülçin Aşkın, Zeynep Eynur, Canan Gökçen, Canan Hastürk, S. Erkan Kaçmaz, Selami Oğuz,<br />
Gürcan Özkan, Vildan Şahin, Turgut Berk Sezgin, Aynur Uluğtekin and Aynur Züran<br />
Uzbekistan<br />
Abdi Kadir Ergashev, Eh. Dj. Makhmudov, Anna Paolini and Sh. I. Salikhov<br />
Zambia<br />
Osward M. Chanda, Hastings Chibuye, Christopher Chileshe, Peter Chola, Ben Chundu,<br />
Adam Hussen, Joseph Kanyanga, Peter Lubambo, Andrew Mondoka, Peter Mumba,<br />
Mumbuwa Munumi, Priscilla Musonda, Christopher Mwasile, Kenneth Nkhowani,<br />
Imasiku A. Nyambe, Liswaniso Pelekelo, Zebediah Phiri, Friday Shisala, Lovemore Sievu<br />
and George W. Sikuleka<br />
Participants at preparatory meetings and workshops<br />
Inception meeting – 7-11 November 2007 – Paris, France<br />
Virginie Aimard, Guy Alaerts, Joseph Alcamo, Reza Ardakanian, Pierre Baril,<br />
Francesca Bernardini, Gunilla Björklund, Janos Bogardi, Rudolph Cleveringa,<br />
James Dorsey, Elias Fereres, M. Gopalakrishnan, Wolfgang Grabs, Dipak Gyawali,<br />
BertJan Heij, Molly Hellmuth, Denis Hughes, Tim Kasten, Henrik Larsen,<br />
Peter C. Letitre, Daniel Pete Loucks, Jan Luijendijk, Robert Martin, Michel Meybeck,<br />
Jack Moss, Yuichi Ono, Léna Salamé, Monica Scatasta, Uri Shamir, Laszlo Somlyody,<br />
Manfred Spreafico, Alberto Tejada-Guibert, Lucio Ubertini, Henk van Schaik,<br />
Charles Vörösmarty, James Winpenny, Junichi Yoshitani and Daniel Zimmer<br />
Integration meeting – 19-25 April 2008 – Perugia, Italy<br />
Daniel Adom, Virginie Aimard, Guy Alaerts, Joseph Alcamo, Youssef Al-Mooji,<br />
Fatma Attia, Pierre Baril, Luis Berga, Anders Berntell, Gunilla Björklund, Robert Bos,<br />
Andrew Bullock, Stefano Burchi, Thomas Chiramba, Engin Çitak, Rudolph Cleveringa,<br />
Elias Fereres, Carlos Fernandez, Gilberto Gallopin, Gerry Galloway, M. Gopalakrishanan,<br />
Wolfgang Grabs, Dipak Gyawali, Joakim Harlin, BertJan Heij, Molly Hellmuth,<br />
Sarah Hendry, Denis Hughes, Niels Ipsen, Tim Kasten, Yanikoglu Kubra, Kshitij M. Kulkarni,<br />
Johan Kuylenstierna, Jon Lane, Henrik Larsen, Peter C. Letitre, Dennis Lettenmaier, Daniel<br />
Pete Loucks, Robert Martin, Anil Mishra, Jack Moss, Mike Muller, Yuichi Ono, Walter Rast,<br />
xvi World Water Development Report 3
Acknowledgements<br />
Ahmet Saatci, Léna Salamé, Darren Saywell, Roland Schulze, Uri Shamir, Laszlo Somlyody,<br />
Toshihiro Sonoda, Alberto Tejada-Guibert, Jon Martin Trondalen, Duygu Tuna,<br />
Lucio Ubertini, Stefan Uhlenbrook, Wim van der Hoek, Pieter van der Zaag, Henk van Schaik,<br />
Charles Vörösmarty, James Winpenny, Albert Wright, Adikari Yoganath and Daniel Zimmer<br />
Workshop on indicators, monitoring and databases – 18-20 June 2008 – Perugia, Italy<br />
Karen Frenken, George de Gooijer, Jan Hassing, Engin Koncagül, Mike Muller, Stéfanie<br />
Néno, Gerard Payen, Roland Schulze, Charles Vörösmarty and Casey Walther<br />
Workshop on policy relevance – 28 July – 1 August 2008 – Perugia, Italy<br />
Michael Abebe, Altay Altinors, Kodwo Andah, Ger Bergkamp, Thanade Dawasuwan,<br />
Gerry Galloway, Dipak Gyawali, Saadou Ebih Mohamed, Jack Moss, Stéfanie Néno,<br />
Joshua Newton, Jerome Delli Priscoli, Khomoatsana Tau and Håkan Tropp<br />
Solicited consultations<br />
Real-time Delphi survey on scenarios, October 2007<br />
Joseph Alcamo, Fatma Attia, Pierre Baril, Bryon Bates, Anders Berntell,<br />
Elias Fereres Castiel, Gilberto Gallopin, Nadezhda Gaponenko, Filipo Giorgi,<br />
Jerome Glenn, Stela Goldenstein, M. Gopalakrishnan, Wolfgang Grabs, Dipak Gyawali,<br />
BertJan Heij, Danielle Jacob, Pavel Kabat, Tim Kasten, Zbigniew Kundzewicz,<br />
Peter Loucks, David Molden, David Seckler, Uri Shamir, Zekai Şen, Igor Shiklomanov,<br />
Roland Shulze, Lazslo Somlyody, Ken Strzepek, Lucio Ubertini, Isabel Valencia,<br />
Henk van Schaik, Wang Rusong and Albert Wright<br />
Real-time Delphi survey on storage, February 2008<br />
Alison Bartle, Luis Berga, Jean-Pierre Chabal, Imo Efiong Ekpo, John Gowing,<br />
Robert T. Heath, Jia Jinsheng, Marna de Lange, Peter Stuart Lee, Jan Lundqvist,<br />
Maimbo Mabanga Malesu, Norihisa Matsumoto, Adama Nombre,<br />
Alberto Marulanda Posada, Johan Rockström, Herman E. Roo, Giovanni Ruggeri,<br />
Bernard Tardieu, Richard M. Taylor, Barbara van Koppen, Arthur Walz, Martin Wieland,<br />
Qiang Zhu and Przemyslaw Zielinski<br />
Public online consultation on the table of contents, March 2008<br />
Diepeveen Aleid, Abdullatif Al-Mugrin, Elfadil Azrag, Nick Blazquez, Marcia M. Brewster,<br />
Olga Daguia, Binayak Das, Orock Tanyi Fidelis, Mikkel Funder, Cristy Gallano,<br />
Andreas Grohmann, Alfred Heuperman, Peter Kabongo, Tom McAuley, F. H. Mughal,<br />
Farhad Mukhtarov, Kefah Naom, N. Parasuraman Ngappan, Cyprien Ntahomvukiye,<br />
Gerd Odenwaelder, Gbenga Olatunji, Michaela Oldfield, Ramadhan, Friederike Schubert,<br />
Paulo de Tarso Castro, Mase Toru, Nicola Tynan, Etiosa Uyigue, Hideo Watanabe,<br />
Maya Wolfensberger, Nayyer Alam Zaigham and the Gender and Water Alliance<br />
Real-time Delphi survey on policy relevance, March 2008<br />
Emaduddin Ahmad, Natalia Alexeeva, Ali Al-Jabbari, Elena Isabel Benitez Alonso,<br />
Miguel Angel, Lina Sergie Atassi, Manuel Rodríguez Becerra, Charlie Bepapa,<br />
Benedito Braga, Martina Bussettini, Mokhtar Bzioui, Adrian Cashman,<br />
Sharif Uzzaman Choudhury, Betsy A. Cody, Christopher Cox, Basandorj Davaagiin,<br />
Dwarika Dhugnel, Francis Flynn, Bertha Cruz Forero, Gerald Galloway,<br />
Iñaki Urrutia Garayo, Zaheer Hussain Shah Gardezi, Peter Gleick, Biksham Gujja,<br />
Handagama, Islam-ul-Haque, Kocou Armand Houanye, Mukdad Hussein,<br />
Upali Senarath Imbulana, Abbasgholi Jahani, Ananda Jayasinghe, Mohamed Ait Kadi,<br />
Badra Kamaladasa, Ville Keskisarja, Julio Thadeu S. Kettelhut, Arzel Hossain Khan,<br />
Juliette Biao Koudenoukpo, Latu S. Kupa, Juan Mayr Maldonado, Olga Marecos,<br />
Jurado Marquez, Polioptro F. Martínez-Austria, Miguel A. Medina, Jr., G. Tracy Mehan,<br />
A. M. Muller, Jadambaa Namjilin, Gustavo Victor Necco, Visa Niittyniemi,<br />
Ali Noorzad, Michel Ouellet, Marc Overmars, Mauri Cesar Barbosa Pereira,<br />
Claudia Patricia Mora Pineda, Giorgio Pineschi, Victor Pochat, Syed Ayub Qutub,<br />
Walid Abed Rabboh, Hifza Rasheed, Josu Sanz, Henk van Schaik, Carlos María Serrentino,<br />
Cletus Springer, Steven L. Stockton, Sumitha Sumanaweera, Vincent D. Sweeney,<br />
Muhammad Aslam Tahir, Sonja Timmer, Francesco Tornatore, Robert Reece Twilley,<br />
Carel de Villeneuve, Erik K. Webb, Cevat Yaman and Farhad Yazdandoost<br />
Electronic survey for water leaders and water experts, July 2008<br />
Sameh Mohamed Abdel-Gawad, Florence Grace Adongo, Emaduddin Ahmad,<br />
Abdalla A. Ahmed, Fernando Alberto, Sibel Algan, Daouda Aliou, Mirtha Almada,<br />
Hugo Pablo Amicarelli, Paula Antunes, Bayoumi Bayoumi Attia, Van Baardwijk, Banadda,<br />
Jayanta Bandyopadhyay, Elena Benitez, Emilia Bocanegra, Lisa Bourget, John Carey,<br />
Water in a changing world<br />
xvii
Acknowledgements<br />
Adrian Cashman, Roberto Torres Castro, Lucas Chamorro, Xu Cheng, Mourad Choyekh,<br />
Murray Clamen, Michael J. Clark, Betsy A. Cody, Ken Conca, Filiz Demirayak,<br />
Carlos Diaz, Kayembe Ditanta, Ajaya Dixit, Ould Mohamed El Hacen Saadou Ebih,<br />
Omar Elbadawy, Evens Emmanuel, Loic Fauchon, Miriam Feilberg, Bertha Cruz Forero,<br />
Iñaki Urrutia Garayo, Roberto Galan Garcia, Elda Guadalupe Vasquez de Godoy,<br />
Elizabeth Granados, Norman Grannemann, Pilar Cornejo R. de Grunauer,<br />
Sylvain Guebanda, Guero, Adrian Ortega Guerrero, Biksham Gujja, G. J. C. Gunatilake,<br />
Carlos Gutiérrez-Ojeda, Dipak Gyawali, Charles Hakizimana, Azizul Haque,<br />
Islam-ul-Haque, Liu Heng, Oda Hideaki, Eduardo Zamudio Huertas, Magda Amin Idris,<br />
Upali S. Imbulana, Mulipola Pologa Ioane, Vijay Jagannathan, Jahani, Santiago Jara,<br />
H. M. Jayatillake, Gerald Jean-Batiste, Badra Kamaladasa, Vakup Karaaslan, Ville Keskisarja,<br />
Wael M. Khairy, Arzel Hossain Khan, Nguyen Hong Khanh, Abdelaziz H. Konsowa,<br />
Juan Jose Ledesma, Peter Letitre, Mark Limbaugh, Ana Deisy López Ramos, Lutfi Ali Madi,<br />
Yvon Maranda, Darysbeth Martinez, Andrés Pérez Mattiauda, Marcus Moench,<br />
Ekhlas Gamal Eldin Mohamed, David Molden, Sadí Laporte Molina, Isaìas Montoya B.,<br />
Mike Muller, Hamza Ozguler, Gürcan Özkan, Eddy Gabriel Baldellón Pedraza,<br />
Amataga Penaia, Ralph Pentland, Mauri Cesar Barbosa Pereira, Andrés Pérez,<br />
Odalis Perez, Mathieu Pinkers, Syed Ayub Qutub, Walid Abed Rabboh,<br />
Santiago Maria Reyna, Decarli Rodríguez, Jorge Rucks, Jayampathy Samarakoon,<br />
Monica Elizabeth Urbieta Sanabria, João Bosco Senra, Carlos Maria Serrentino,<br />
José Joaquín Chacón Solano, Toshihiro Sonoda, Guido Soto, Hugo Herrera Soto,<br />
Steven L. Stockton, Sumitha Sumanaweera, Veronica Tarbaeva, U. Tsedendamba,<br />
Aynur Uluğtekin, Kishor Uprety, Jeroen van der Sommen, Ximena Vargas,<br />
Celso Velazquez, Ingrid Verstraeten, Carel de Villeneuve, Carissa Wong,<br />
Jorge Montaño Xavier, Alaa Yassin and Farhad Yazdandoost<br />
UN-Water consultation, August-September 2008<br />
Secretariat of the Convention on Biological Diversity, Food and Agriculture Organization<br />
of the United Nations, United Nations Environment Programme and World Bank<br />
WWAP side publications series coordinator<br />
Marwa Daoudy<br />
Partners in WWDR Side Publications Series<br />
Zafar Adeel, Yoganath Adikari, Joseph Alcamo, Maite Martinez Aldaya, Reza Ardakanian,<br />
Pierre Baril, Dominique Berteaux, Harriet Bigas, David Bird, Gunilla Björklund,<br />
Sylvie de Blois, Amadou Idrissa Bokoye, Sobhanlal Bonnerjee, Leon Braat, Marco Braun,<br />
Anne Cann, Diane Chaumont, Torkil-Jønch Clausen, David Coates, Jean-François Cyr,<br />
Claude Desjarlais, Paris Edwards, Marie-Joëlle Fluet, Louis-Guillaume Fortin,<br />
Gilberto Gallopín, Jerome Glenn, Matt Hare, Joakim Harlin, Jan Hassing, BertJan Heij,<br />
Andrew Hudson, Niels Ipsen, Harald Koethe, David Lammie, Henrik Larsen,<br />
Jan Leentvaar, Geerinck Lieven, Palle Lindgaard-Jørgensen, Manuel Ramon Llamas,<br />
Ralf Ludwig, Wolfram Mauser, Alastair Morrison, Jasna Muskatirovic, André Musy,<br />
Benjamin Ndala, Gernot Pauli, Alain Rousseau, René Roy, Brigitte Schuster,<br />
Lynette de Silva, Lucia De Stefano, Jon Martin Trondalen, Håkan Tropp, Richard Turcotte,<br />
Wim van der Hoek, Charlotte van der Schaaf, Luc Vescovi, Ruth Vollmer, Ian White,<br />
James Winpenny, Lars Wirkus, Aaron T. Wolf and Junichi Yoshitani<br />
World Water Development Report 3 Messages Series<br />
Coordinator<br />
George de Gooijer<br />
Contributors<br />
Altay Altinörs, Ger Bergkamp, Claire Furlong, George de Gooijer, Dipak Gyawali, Jack Moss,<br />
Joshua Newton, Sharon Velasquez Orta, Darren Saywell, Alberto Tejada-Guibert and<br />
James Winpenny<br />
Special thanks<br />
The Turkish Ministry of Foreign Affairs, the Secretariat of the 5th World Water Forum<br />
(Istanbul), the Greater Municipality of Istanbul Water and Sewerage Administration and<br />
the General Directorate of State Hydraulic Works of Turkey<br />
We apologize for any inadvertent errors or omissions of contributors to the Report. Some<br />
names may be incomplete because they come from participants’ own online registration<br />
information, which may have been incomplete.<br />
xviii World Water Development Report 3
Overview of<br />
key messages<br />
The amount of freshwater on Earth is<br />
finite, but its distribution has varied considerably,<br />
driven mainly by natural cycles<br />
of freezing and thawing and fluctuations<br />
in precipitation, water runoff patterns and<br />
evapotranspiration levels. That situation<br />
has changed, however. Alongside natural<br />
causes are new and continuing human<br />
activities that have become primary ‘drivers’<br />
of the pressures affecting our planet’s<br />
water systems. These pressures are most<br />
often related to human development and<br />
economic growth.<br />
History shows a strong link between<br />
economic development and water resources<br />
development. There are abundant<br />
examples of how water has contributed to<br />
economic development and how development<br />
has demanded increased harnessing<br />
of water. Such benefits came at a cost and<br />
in some places led to increasing pressure<br />
on the environment and increasing competition<br />
among users. Our requirements<br />
for water to meet our fundamental needs<br />
and our collective pursuit of higher living<br />
standards, coupled with the need for water<br />
to sustain our planet’s fragile ecosystems,<br />
make water unique among our planet’s<br />
natural resources.<br />
Important decisions affecting water management<br />
are made outside the water sector<br />
and are driven by external, largely unpredictable<br />
drivers – demography, climate<br />
change, the global economy, changing societal<br />
values and norms, technological innovation,<br />
laws and customs, and financial<br />
markets. Many of these external drivers<br />
are dynamic and changing at a faster pace.<br />
Developments outside the water domain<br />
influence water management strategies<br />
and policies. Decisions in other sectors<br />
and those related to development, growth<br />
and livelihoods need to incorporate water<br />
as an integral component, including<br />
responses to climate change, food and energy<br />
challenges and disaster management.<br />
The analysis of these issues leads to a set of<br />
responses and recommendations for action<br />
that incorporate the contribution of water<br />
to sustainable development.<br />
Chapter 1. Getting out of the box<br />
– linking water to decisions for<br />
sustainable development<br />
The news media today are full of talk of<br />
crises – in climate change, energy and food<br />
supplies and prices, and troubled financial<br />
markets. These global crises are linked to<br />
each other and to water resources management.<br />
They arise against a background of<br />
continuing poverty for a large part of the<br />
world. Unless resolved, they may lead to<br />
increasing political insecurity and conflict<br />
at local and national levels.<br />
• The ‘water box’ dilemma must be resolved.<br />
Leaders in the water sector – in<br />
water supply and sanitation, hydropower,<br />
irrigation and flood control<br />
– have long been aware that water is<br />
essential to sustainable development,<br />
but they do not make the decisions<br />
on development objectives and the<br />
allocation of human and financial<br />
resources to meet them. These decisions<br />
are made or influenced by leaders<br />
in government, the private sector and<br />
civil society, who must learn to recognize<br />
water’s role in obtaining their<br />
objectives.<br />
• Water is essential for achieving sustainable<br />
development and the Millennium<br />
Development Goals. Properly managing<br />
water resources is an essential component<br />
of growth, social and economic<br />
development, poverty reduction and<br />
equity – all essential for achieving the<br />
Millennium Development Goals.<br />
Leaders in the<br />
water sector<br />
have long been<br />
aware that water<br />
is essential to<br />
sustainable<br />
development,<br />
but they do not<br />
make the decisions<br />
on development<br />
objectives and<br />
the allocation<br />
of human and<br />
financial resources<br />
to meet them.<br />
These decisions are<br />
made by leaders<br />
in government,<br />
the private sector<br />
and civil society<br />
Water in a changing world<br />
xix
Overview of key messages<br />
Alongside the<br />
natural forces<br />
affecting water<br />
resources are new<br />
human activities<br />
that have become<br />
the primary<br />
‘drivers’ of the<br />
pressures affecting<br />
our planet’s<br />
water systems<br />
• Water is linked to the crises of climate<br />
change, energy and food supplies and<br />
prices, and troubled financial markets.<br />
Unless their links with water are addressed<br />
and water crises around the<br />
world are resolved, these other crises<br />
may intensify and local water crises<br />
may worsen, converging into a global<br />
water crisis and leading to political insecurity<br />
and conflict at various levels.<br />
Specialists and managers in water supply and<br />
sanitation, hydropower, irrigation and flood<br />
control have long been aware of this. But<br />
they often have a narrow, sectoral perspective<br />
that blinds many decisions on water.<br />
And they do not make the decisions on development<br />
objectives and financial resources<br />
needed to meet these broader objectives.<br />
Action is required now. Lives and livelihoods<br />
depend on water for development.<br />
After decades of inaction, the problems are<br />
enormous. And they will worsen if left unattended.<br />
But while the challenges are substantial,<br />
they are not insurmountable. The<br />
Report has examples of how some countries<br />
and regional and local governments<br />
have solved similar challenges. Recognizing<br />
the links between water resources and<br />
other crises around the world and between<br />
water resources and development, leaders<br />
in the water domain and decision-makers<br />
outside it must act together now to meet<br />
these challenges.<br />
Part 1. Understanding what<br />
drives the pressures on water<br />
Alongside the natural forces affecting<br />
water resources are new human activities<br />
that have become the primary ‘drivers’ of<br />
the pressures affecting our planet’s water<br />
systems. These pressures are most often<br />
related to human activities and economic<br />
growth. Our requirements for water to<br />
meet our fundamental needs and our collective<br />
pursuit of higher living standards,<br />
coupled with the need for water to sustain<br />
our planet’s fragile ecosystems, make water<br />
unique among natural resources.<br />
Drivers should not be considered in isolation<br />
of related socioeconomic and political<br />
factors or of other drivers. Many natural<br />
links also influence how drivers affect<br />
changes, directly and indirectly. Water<br />
properties are governed by biological,<br />
chemical and physical laws that define the<br />
quantity and quality of water resources,<br />
regardless of human influences, and that<br />
are linked in various ways. Superimposed<br />
on these natural processes are human<br />
activities that intensify these processes<br />
and disrupt the natural balance of water<br />
systems.<br />
Economic growth, a principal driver of water<br />
use, is affected by a wide range of policy<br />
decisions, from international trade to education<br />
and public health, while the potential<br />
rate of economic growth can be affected by<br />
demographic variables such as population<br />
distribution (local workforce availability)<br />
and social characteristics (workforce capacity<br />
and the role of women) and by the availability<br />
of new technologies. Water availability is<br />
also directly subject to the impacts of climate<br />
change, which also can exert additional pressures<br />
on the other drivers.<br />
The result of these combined and interacting<br />
forces is a continuously increasing demand<br />
for finite water resources for which<br />
there are no substitutes. When water resources<br />
of acceptable quality can no longer<br />
be provided in sustainable quantities,<br />
the outcome can be overexploitation of<br />
aquatic ecosystems. The ultimate losers are<br />
the exploited aquatic ecosystems and the<br />
organisms (including humans) dependent<br />
on them for survival and well-being.<br />
Chapter 2. Demographic, economic<br />
and social drivers<br />
Human activities and processes of all types<br />
– demographic, economic and social – can<br />
exert pressures on water resources and<br />
need to be managed. These pressures are in<br />
turn affected by a range of factors such as<br />
technological innovation, institutional and<br />
financial conditions and climate change.<br />
Demographic drivers. Population dynamics<br />
(growth, gender and age distribution, migration)<br />
create pressures on freshwater resources<br />
through increased water demands and<br />
pollution. Changes in the natural landscape<br />
associated with population dynamics (migration,<br />
urbanization) can create additional<br />
pressures on local water resources and the<br />
need for more water-related services.<br />
Economic drivers. Growth and changes<br />
in the global economy are having farreaching<br />
impacts on water resources and<br />
their use. Growing international trade in<br />
goods and services can aggravate water<br />
stress in some countries while relieving it<br />
in others through flows of ‘virtual water’<br />
(water embedded in products and used in<br />
their production, particularly in the form<br />
of imported agricultural commodities).<br />
Social drivers. Social drivers are mainly about<br />
individual rather than collective actions<br />
and about the way people think and act on<br />
a day-to-day basis. Social drivers influence<br />
xx World Water Development Report 3
Overview of key messages<br />
human perceptions and attitudes about the<br />
environment, including water resources, in<br />
turn influencing the pressures people exert<br />
on water through water demands and uses.<br />
Changes in lifestyles represent one of the<br />
principal drivers of change. They reflect<br />
human needs, desires and attitudes (as illustrated<br />
in consumption and production<br />
patterns), which are influenced by such social<br />
drivers as culture and education and by<br />
economic drivers and technological innovation;<br />
the rapid global rise in living standards<br />
combined with population growth presents<br />
the major threat to the sustainability of<br />
water resources and the environment.<br />
Chapter 3. Technological innovation<br />
Technological innovation is driven largely<br />
by both human wants and needs. It can<br />
create both positive and negative pressures,<br />
sometimes simultaneously, resulting in<br />
increased or decreased water demand, supply<br />
and quality. One of the most unpredictable<br />
drivers, technological innovation<br />
can create rapid, dramatic and unexpected<br />
changes, both in pressures and solutions.<br />
Impediments to the dissemination of<br />
technology must be overcome for developing<br />
countries to benefit from innovations<br />
developed in richer countries.<br />
Chapter 4. Policies, laws and finance<br />
Efforts to implement water management<br />
effectively and efficiently and to properly<br />
inform the decision-making process<br />
are facilitated by the adoption of water<br />
resources management laws, policies and<br />
strategies that reflect links between water<br />
and the social and economic sectors. Good<br />
examples can be found in many countries.<br />
But even if all the necessary policies and<br />
laws are in place, development of water resources<br />
will not take place without adequate<br />
funding of infrastructure and the institutional<br />
and human capacity of the sector.<br />
Policies and laws. Effective policies and<br />
legal frameworks are necessary to develop,<br />
carry out and enforce the rules and regulations<br />
that govern water use and protect the<br />
resource. Water policy operates within a<br />
context of local, national, regional and global<br />
policy and legal frameworks that must<br />
all support sound water management goals.<br />
Legitimate, transparent and participatory<br />
processes can effectively mobilize input for<br />
designing and implementing water resources<br />
policy and create a strong deterrent<br />
to corruption. Corruption remains a poorly<br />
addressed governance issue in the water domain.<br />
It can lead to uncontrolled pollution<br />
of water sources, overpumping and depletion<br />
of groundwater, lack of planning, degradation<br />
of ecosystems, weakened flood protection,<br />
urban expansion leading to heightened<br />
water tensions, and other harmful effects.<br />
Finance. Although water is often described as<br />
a ‘gift of nature’, harnessing and managing<br />
it for the wide variety of human and ecological<br />
needs entail financial costs. While there<br />
may appear to be many financing options<br />
for water resources development, governments<br />
still have only three basic means of<br />
financing them: tariffs, taxes and transfers<br />
through external aid and philanthropy.<br />
Policy-makers need to make political decisions<br />
on socially and environmentally<br />
acceptable trade-offs among different<br />
objectives and on who bears the costs of<br />
such compromise. Commitments have<br />
been made by the donor community to increase<br />
assistance to the broad water sector,<br />
but this has led mainly to an increase in<br />
allocations for water supply and sanitation<br />
in dollar terms (although its share of total<br />
official development assistance has stagnated<br />
at 4%), and the percentage of total<br />
aid allocated to the water sector remains<br />
below 6% and has been declining.<br />
Chapter 5. Climate change and<br />
possible futures<br />
The external drivers of change, strongly<br />
connected, create complex challenges<br />
and opportunities for water managers and<br />
decision- makers in government, the private<br />
sector and civil society. Climate change<br />
and variability, while seldom the main<br />
stressors on sustainable development, can<br />
impede or even reverse development gains.<br />
Climate change. There is evidence that the<br />
global climate is changing and that some<br />
of the change is human-induced. The main<br />
impacts of climate change on humans and<br />
the environment occur through water.<br />
Climate change is a fundamental driver of<br />
changes in water resources and an additional<br />
stressor through its effects on external<br />
drivers. Policies and practices for mitigating<br />
climate change or adapting to it can have<br />
impacts on water resources, and the way we<br />
manage water can affect the climate.<br />
Public policy, so far dominated by mitigation,<br />
could benefit from a better balance<br />
between mitigation and adaptation. Carbon<br />
is a measure of the anthropogenic causes<br />
of climate change – water is a measure of<br />
its impacts. The international community<br />
also has to balance investing for tomorrow’s<br />
likely problems of greater climate variability<br />
and global warming against investing for<br />
today’s problems of climate variability to<br />
Although water is<br />
often described as<br />
a ‘gift of nature’,<br />
harnessing and<br />
managing it<br />
for the wide<br />
variety of human<br />
and ecological<br />
needs entail<br />
financial costs<br />
Water in a changing world<br />
xxi
Overview of key messages<br />
Steadily increasing<br />
demand for<br />
agricultural<br />
products to<br />
satisfy the needs<br />
of a growing<br />
population, and<br />
the desire for a<br />
more varied diet,<br />
continues to be<br />
the main driver<br />
behind water use<br />
prevent losses from droughts and floods.<br />
While both are vital, focusing on today’s<br />
problems can also create greater resilience<br />
for dealing with the problems of tomorrow.<br />
Possible futures. Each of the external water<br />
drivers is dynamic and continues to evolve,<br />
as do the direct and indirect pressures they<br />
exert on water resources. Thus, it is difficult<br />
to draw a comprehensive picture of the<br />
future by examining each driver independently.<br />
Because the drivers can have even<br />
more of an impact on future water resources<br />
collectively than they can individually,<br />
future scenarios that consider these interactions<br />
offer a more holistic picture. Existing<br />
global water scenarios are outdated, incomplete<br />
or sectoral and do not fully incorporate<br />
each of the external drivers. The evolution<br />
of the drivers and the logic behind<br />
their storylines need to be examined and<br />
possibly redefined in view of developments<br />
both inside and outside the water sector<br />
that have occurred over the past decade.<br />
Part 2. Using water<br />
History shows a strong link between economic<br />
development and water resources<br />
development. There are abundant examples<br />
of how water has contributed to economic<br />
development and how development<br />
has demanded increased harnessing of<br />
water. Steadily rising demand for agricultural<br />
products to satisfy the diverse needs<br />
of growing populations (for food, fibre and<br />
now fuel) has been the main driver behind<br />
agricultural water use.<br />
The effects of water-depleting and waterpolluting<br />
activities on human and ecosystem<br />
health remain largely unreported or<br />
difficult to measure, and the need grows<br />
stronger for effective protection of ecosystems<br />
and the goods and services they<br />
produce – on which life and livelihoods<br />
depend. As competition among demands<br />
on water increases, society will need to respond<br />
with improved water management,<br />
more effective policies and transparent and<br />
efficient water allocation mechanisms.<br />
Chapter 6. Water’s many benefits<br />
Water has always played a key role in<br />
economic development, and economic<br />
development has always been accompanied<br />
by water development. Investment in water<br />
management has been repaid through livelihood<br />
security and reductions in health<br />
risks, vulnerability and ultimately poverty.<br />
Water contributes to poverty alleviation in<br />
many ways – through sanitation services,<br />
water supply, affordable food and enhanced<br />
resilience of poor communities faced with<br />
disease, climate shocks and environmental<br />
degradation. Water of the right quality can<br />
improve health through better sanitation<br />
and hygiene and, when applied at the right<br />
time, can enhance the productivity of land,<br />
labour and other productive inputs. In addition,<br />
healthy freshwater ecosystems provide<br />
multiple goods and services essential<br />
to life and livelihood.<br />
The importance of water services is especially<br />
apparent in societies where normal<br />
social life and political structures have<br />
broken down. In these fragile states the<br />
government cannot or will not deliver core<br />
functions to most of its people, including<br />
the poor. While each fragile state is fragile<br />
in different ways and for different reasons<br />
– war, post-conflict recovery, major natural<br />
catastrophe, prolonged mismanagement<br />
and political repression – a striking commonality<br />
in reports from aid agencies is<br />
the prominence of water and sanitation in<br />
relief and reconstruction programmes. The<br />
rapid restoration of viable water services is<br />
often a crucial ingredient of nation-building<br />
in these fragile states.<br />
Chapter 7. Evolution of water use<br />
While most of the old challenges of water<br />
supply, sanitation and environmental sustainability<br />
remain, new challenges such as<br />
adaptation to climate change, rising food<br />
and energy prices, and ageing infrastructure<br />
are increasing the complexity and<br />
financial burden of water management.<br />
Population growth and rapid economic<br />
development have led to accelerated freshwater<br />
withdrawals.<br />
Trends in access to domestic water supply<br />
indicate substantial improvement in the<br />
past decade, putting most countries on track<br />
to achieve the water supply target of the<br />
Millennium Development Goals. However,<br />
sanitation is lagging well behind, and most<br />
sub-Saharan African countries and many<br />
rural areas still show unsatisfactory records<br />
for both water supply and sanitation.<br />
Steadily increasing demand for agricultural<br />
products to satisfy the needs of a growing<br />
population continues to be the main driver<br />
behind water use. While world population<br />
growth has slowed since the 1970s and is<br />
expected to continue its downward trend,<br />
steady economic development, in particular<br />
in emerging market economies, has translated<br />
into demand for a more varied diet,<br />
including meat and dairy products, putting<br />
additional pressure on water resources.<br />
After agriculture, the two major users of<br />
water for development are industry and<br />
xxii World Water Development Report 3
Overview of key messages<br />
energy (20% of total water withdrawals),<br />
which are transforming the patterns of<br />
water use in emerging market economies.<br />
Water and energy share the same drivers:<br />
demographic, economic, social and<br />
technological processes put pressure on<br />
both energy and water. The recent acceleration<br />
in the production of biofuel and<br />
the impacts of climate change bring new<br />
challenges and add to the pressures on<br />
land and water resources.<br />
Freshwater ecosystems provide an extensive<br />
array of vital services to support<br />
human well-being. A variety of economic<br />
and recreational activities such as navigation,<br />
fisheries and pastoral activities<br />
depend on direct use of water in healthy<br />
ecosystems. Yet some environmental services<br />
receive inadequate policy attention<br />
and are endangered by the way development<br />
sectors use water.<br />
Chapter 8. Impacts of water use on<br />
water systems and the environment<br />
The pattern and intensity of human activity<br />
have disrupted – through impacts on<br />
quantity and quality – the role of water as<br />
the prime environmental agent. In some<br />
areas depletion and pollution of economically<br />
important river basins and associated<br />
aquifers have gone beyond the point of noreturn,<br />
and coping with a future without<br />
reliable water resources systems is now a<br />
real prospect in parts of the world.<br />
While the intensity of groundwater use,<br />
partly encouraged by subsidized rural<br />
electrification, has led to the emergence of<br />
many groundwater-dependent economies,<br />
their future is now threatened by aquifer<br />
depletion and pollution. Prospects for<br />
relaxing use of these key aquifers, remediating<br />
water quality and restoring groundwater<br />
services to ecosystems look remote<br />
unless alternative management approaches<br />
are developed.<br />
Our ability to maintain the environmental<br />
services we depend on has improved but<br />
remains constrained by an incomplete<br />
understanding of the magnitude and impact<br />
of pollution, the resilience of affected<br />
ecosystems and the social institutions that<br />
use and manage water resources systems. A<br />
failure to monitor the negative impacts of<br />
water use on the environment and institutional<br />
weaknesses in many developing<br />
countries prevent effective enforcement of<br />
regulatory provisions.<br />
Relevant information about pollution loads<br />
and changes in water quality is lacking precisely<br />
where water use is most intense – in<br />
densely populated developing countries.<br />
As a result, the often serious impacts of<br />
polluting activities on the health of people<br />
and ecosystems remain largely unreported.<br />
Still, there are signs of progress in how<br />
pollution and the risks of pollution can<br />
be mitigated and trends in environmental<br />
degradation reversed.<br />
Chapter 9. Managing competition for<br />
water and the pressure on ecosystems<br />
Competition for water and shortcomings<br />
in managing it to meet the needs of society<br />
and the environment call for enhanced societal<br />
responses through improved management,<br />
better legislation and more effective<br />
and transparent allocation mechanisms.<br />
Challenges include wise planning for<br />
water resources, evaluation of availability<br />
and needs in a watershed, possible reallocation<br />
or storage expansion in existing reservoirs,<br />
more emphasis on water demand<br />
management, a better balance between<br />
equity and efficiency in water use, inadequate<br />
legislative and institutional frameworks<br />
and the rising financial burden of<br />
ageing infrastructure.<br />
Water management choices should emerge<br />
from informed consultation and negotiation<br />
on the costs and benefits of all options<br />
after considering basin interconnectedness,<br />
relationships between land and<br />
water resources, and the consistency and<br />
coherence of decisions with other government<br />
policies.<br />
Part 3. State of the resource<br />
The uneven distribution over time and<br />
space of water resources and their modification<br />
through human use and abuse are<br />
sources of water crises in many parts of the<br />
world. In many areas hydrologic extremes<br />
have increased. Deaths and material damage<br />
from extreme floods can be high, and<br />
more intense droughts, affecting increasing<br />
numbers of people, have been observed<br />
in the 21st century. Worldwide, water<br />
observation networks are inadequate for<br />
current and future management needs and<br />
risk further decline. There are insufficient<br />
data to understand and predict the current<br />
and future quantity and quality of water<br />
resources, and political protocols and imperatives<br />
for sharing data are inadequate.<br />
Chapter 10. The Earth’s natural water<br />
cycles<br />
Water resources are made up of many components<br />
associated with water in its three<br />
physical states (liquid, solid and gas). The<br />
components of the water cycle (rainfall,<br />
Water and<br />
energy share the<br />
same drivers:<br />
demographic,<br />
economic, social<br />
and technological<br />
processes put<br />
pressure on both<br />
energy and water<br />
Water in a changing world<br />
xxiii
Overview of key messages<br />
Most climate<br />
scientists agree<br />
that global<br />
warming will<br />
result in an<br />
intensification,<br />
acceleration or<br />
enhancement<br />
of the global<br />
hydrologic cycle,<br />
and there is some<br />
observational<br />
evidence that<br />
this is already<br />
happening<br />
evaporation, runoff, groundwater, storage<br />
and others) therefore all differ in their<br />
chemical and biochemical qualities, spatial<br />
and temporal variability, resilience, vulnerability<br />
to pressures (including land use and<br />
climate change), susceptibility to pollution<br />
and capacity to provide useful services and<br />
to be used sustainably. A consequence of<br />
this variability is that while human pressures<br />
have resulted in large modifications<br />
to the global hydrologic cycle, the directions<br />
and degrees of change are complex<br />
and difficult to ascertain. The uneven<br />
distribution of water resources over time<br />
and space and the way human activity is<br />
affecting that distribution today are fundamental<br />
sources of water crises in many<br />
parts of the world. Adding complexity, climate<br />
change and variability also influence<br />
the water supply, demand and buffering<br />
system, although their precise impacts can<br />
be difficult to isolate.<br />
Chapter 11. Changes in the global<br />
water cycle<br />
Most climate scientists agree that global<br />
warming will result in an intensification,<br />
acceleration or enhancement of the global<br />
hydrologic cycle, and there is some observational<br />
evidence that this is already happening.<br />
While trends in precipitation have<br />
been noted in some parts of the world, in<br />
other areas precipitation patterns have<br />
remained about the same within the period<br />
of observed data. Changes have been<br />
observed in snow cover extent and snow<br />
water equivalent and in the frequency with<br />
which precipitation falls as snow. More<br />
than 15% of the world’s population live<br />
where water resources availability depends<br />
heavily on snowmelt from ephemeral<br />
snowpacks or perennial glaciers. Despite<br />
the evidence of temperature changes, there<br />
is little evidence of detectable changes in<br />
evaporation and evapotranspiration.<br />
Climate change is being superimposed on<br />
an already complex hydrologic landscape,<br />
making its signal difficult to isolate, and yet<br />
making its influence felt throughout the<br />
water supply, demand and buffering system.<br />
Data limitations in record length, continuity<br />
and spatial coverage contribute to the<br />
uncertainty, while natural climate variability<br />
and multiyear variability associated with<br />
large-scale atmospheric circulation patterns<br />
influence the interpretation of many trends<br />
in ways that are not yet fully understood.<br />
Despite the limitations of global datasets,<br />
many studies have shown changes in<br />
runoff and streamflow. Many have focused<br />
on low (drought) or high (flood) extremes.<br />
Except in regions with flows affected by<br />
glacier meltwater, the general conclusion is<br />
that global trends are not present or cannot<br />
be detected at this stage, although climate<br />
change-related trends are evident in some<br />
regions. Groundwater resources have been<br />
heavily used for human supply and agriculture<br />
for many years. While many groundwater<br />
abstraction schemes access fossil<br />
water (water unrelated to current conditions),<br />
renewable groundwater resources depend<br />
on highly variable recharge volumes.<br />
It is thus realistic to expect future recharge<br />
regimes to reflect changes in the driving<br />
hydrologic processes (such as precipitation<br />
and evapotranspiration) that might result<br />
from anticipated climate changes. It is<br />
increasingly clear that the assumption of<br />
statistical stationarity is no longer a defensible<br />
basis for water planning.<br />
Among the consequences of a changing<br />
hydrologic cycle is its interaction with<br />
the terrestrial carbon cycle. The terrestrial<br />
biosphere may have taken up roughly 25%<br />
of anthropogenic carbon emissions during<br />
the last century; it is unclear how long this<br />
can continue.<br />
Chapter 12. Evolving hazards – and<br />
emerging opportunities<br />
Water-related hazards can be naturally occurring<br />
or anthropogenic. Hazards can result<br />
from too much water (floods, erosion,<br />
landslides and so on) or too little (droughts<br />
and loss of wetlands or habitat) and from<br />
the effects of chemical and biological pollution<br />
on water quality and in-stream ecosystems.<br />
The natural variability of water<br />
resources and changes, whatever the cause,<br />
can provide opportunities for management<br />
strategies to respond to potential climate<br />
change threats by implementing more<br />
resource-sustainable policies and practices.<br />
In many places climate-related water events<br />
have become more frequent and more<br />
extreme. In developing countries extreme<br />
floods can result in many deaths, while<br />
in developed countries they can result in<br />
billions of dollars in damages. More intense<br />
droughts in the past decade, affecting an<br />
increasing number of people, have been<br />
linked to higher temperatures and decreased<br />
precipitation but are also frequently<br />
a consequence of the mismanagement of<br />
resources and the neglect of risk management.<br />
The increased exposure to potential<br />
climate change hazards has led to more<br />
awareness of water resources management.<br />
Changes in flow and inputs of chemical<br />
and biological waste from human activity<br />
have altered the water quality and<br />
xxiv World Water Development Report 3
Overview of key messages<br />
ecological functioning of many of the<br />
world’s rivers. Global warming is expected<br />
to have substantial effects on energy flows<br />
and matter recycling through its impact<br />
on water temperature, resulting in algal<br />
blooms, increases in toxic cyanobacteria<br />
bloom and reductions in biodiversity.<br />
In areas of increasing water stress groundwater<br />
is an important buffer resource,<br />
capable of responding to increased water<br />
demands or of compensating for the declining<br />
availability of surface water.<br />
Chapter 13. Bridging the<br />
observational gap<br />
Worldwide, water observation networks<br />
provide incomplete and incompatible data<br />
on water quantity and quality for properly<br />
managing water resources and predicting<br />
future needs – and these networks are in<br />
jeopardy of further decline. Also, no comprehensive<br />
information exists on wastewater<br />
generation and treatment and receiving<br />
water quality on a regional or global scale.<br />
While new technologies based on satellite<br />
remote sensing and modelling present<br />
opportunities, their value is limited by our<br />
ability to ground-truth and validate the<br />
simulated information.<br />
Management of the world’s water resources<br />
requires reliable information about the<br />
state of the resource and how it is changing<br />
in response to external drivers such as<br />
climate change and water and land use.<br />
There is little sharing of hydrologic data,<br />
due largely to limited physical access to<br />
data, policy and security issues; lack of<br />
agreed protocols for sharing; and commercial<br />
considerations. This hampers regional<br />
and global projects that have to build on<br />
shared datasets for scientific and applications-oriented<br />
purposes, such as seasonal<br />
regional hydrologic outlooks, forecasting,<br />
disaster warning and prevention, and<br />
integrated water resources management in<br />
transboundary basins.<br />
Improving water resources management<br />
requires investments in monitoring and<br />
more efficient use of existing data, including<br />
traditional ground-based observations<br />
and newer satellite-based data products.<br />
Most countries, developed and developing,<br />
need to give greater attention and more<br />
resources to monitoring, observations<br />
and continual assessments of the status of<br />
water resources.<br />
Part 4. Responses and choices<br />
We have many of the answers. Across the<br />
planet we have already shown that it can<br />
be done! But there is no one-size-fits-all<br />
solution. The best mix of responses to a<br />
country’s development objectives and<br />
policy priorities to meet its water challenges<br />
depends on the availability of water in<br />
space and in time and the country’s technical,<br />
financial, institutional and human<br />
capacities – its culture, political and regulatory<br />
frameworks, and markets.<br />
Options within the water domain are<br />
distinct from those outside it. Leaders in<br />
the water domain can inform the processes<br />
outside their domain and implement<br />
decisions for the water domain; but it is the<br />
leaders in government, the private sector<br />
and civil society who determine the directions<br />
that will be taken. Responses outside<br />
the water domain strongly affect the macro<br />
changes that influence how water is used<br />
and allocated. They also make water adaptation<br />
measures more (or less) effective and<br />
less (or more) costly.<br />
Many countries face multiple challenges<br />
but have limited financial and natural<br />
resources and implementation capacities.<br />
Countries need to fully use synergy<br />
opportunities and to make trade-offs<br />
and difficult decisions on how to allocate<br />
among uses and users to protect their water<br />
resources. To achieve results, many actors<br />
need to participate in these decisions.<br />
Chapter 14. Options inside the water<br />
box<br />
There are many practical examples of<br />
solutions within the water domain. Some<br />
options show particular promise. Preparing<br />
institutions to deal with current and<br />
future challenges requires support for<br />
institutional development through such<br />
reforms as decentralization, stakeholder<br />
participation and transparency, increased<br />
corporatization where feasible and fair,<br />
partnerships and coordination (publicprivate,<br />
public-public, public-civil society),<br />
and new administrative systems based on<br />
shared benefits of water, including when<br />
water crosses borders. Decision-makers<br />
need to consider the influence of water<br />
law, both formal and customary, including<br />
regulations in other sectors that influence<br />
the management of water resources.<br />
Decision-making is improved by consulting<br />
with stakeholders and ensuring accountability<br />
in planning, implementation and<br />
management as well as building trust<br />
within the water and related sectors and<br />
fighting corruption and mismanagement.<br />
Strengthening organization structures and<br />
improving the operating efficiency of water<br />
supply utilities will help to improve service<br />
Worldwide, water<br />
observation<br />
networks provide<br />
incomplete and<br />
incompatible data<br />
on water quantity<br />
and quality for<br />
properly managing<br />
water resources<br />
and predicting<br />
future needs – and<br />
these networks<br />
are in jeopardy of<br />
further decline<br />
Water in a changing world<br />
xxv
Overview of key messages<br />
unsustainable<br />
management and<br />
inequitable access<br />
to water resources<br />
cannot continue.<br />
We might not have<br />
all the information<br />
we would like<br />
to have before<br />
acting, but we do<br />
know enough now<br />
to begin to take<br />
significant steps<br />
quality and increase the coverage and<br />
density of connections, while also boosting<br />
revenues and creating a more viable financial<br />
base to attract further investment.<br />
Innovation and research are critical for developing<br />
appropriate solutions. And greater<br />
institutional capacity and human capacity<br />
are needed, both within the water domain<br />
and in areas or sectors outside the water<br />
domain. Capacity development can occur<br />
through traditional forms of education,<br />
on-the-job training, e-learning, public<br />
awareness raising, knowledge management<br />
and professional networks.<br />
Sound management accountability and<br />
good governance within the water sector<br />
contribute to creating a favourable investment<br />
climate. This should include new<br />
approaches such as payment for environmental<br />
services.<br />
Chapter 15. Options from beyond the<br />
water box<br />
Dealing with risk and uncertainty has long<br />
been a routine challenge for water resources<br />
managers and policy-makers across<br />
sectors and the world. However, issues like<br />
climate change and demographic dynamics<br />
have made the risks greater and the task<br />
more complex. Risk management is now<br />
much more important – indeed essential –<br />
to analysis and decision-making.<br />
Drivers and policies outside the water sector<br />
have more impact on water management<br />
than do many policies championed and implemented<br />
by water-related ministries. Identifying<br />
trade-offs and synergies between<br />
water and other policy sectors can enhance<br />
policy impacts in all sectors and avoid some<br />
adverse effects on water. Because governments,<br />
civil society and business leaders<br />
make decisions every day that can affect<br />
water, it is important to identify where such<br />
decisions can also lead to improvements in<br />
water sector management and in water sector<br />
and environmental services.<br />
Examples of win-win situations abound –<br />
whether created by governments, communities<br />
or businesses – that point to promoting<br />
deliberate cooperation between water<br />
and non-water actors and integrating water<br />
issues into external decisions. International<br />
organizations, notably the UN system, can<br />
provide support and expertise to governments,<br />
help civil society build capacity and<br />
catalyse leadership in the private sector.<br />
Chapter 16. The way forward<br />
Water and water systems must be managed<br />
to achieve social and economic<br />
development objectives and to sustain<br />
development. Water resources, properly<br />
managed, are critical to the survival and<br />
well-being of individuals. They can ensure<br />
equity and security in water and sanitation<br />
for families, businesses and communities.<br />
And they can ensure adequate water for<br />
food, energy and the environment as well<br />
as protection from floods and droughts.<br />
Decision-making on water requires seeking<br />
synergies and selecting appropriate tradeoffs.<br />
It also requires distinguishing between<br />
short-term ‘fire-fighting’ – responding to<br />
the urgent issues of the day – and long-term<br />
strategic development. Developing multipurpose<br />
water schemes and reusing water<br />
wherever feasible can lessen the need for<br />
trade-offs by enabling the same volumes of<br />
scarce water to deliver multiple outcomes.<br />
The donor community can incorporate<br />
water into the broader frameworks of<br />
development aid and focus assistance on<br />
areas where it is needed most – in sub-<br />
Saharan Africa, in Asian and Latin American<br />
slums and in states recovering from<br />
conflict. Recent G-8 efforts in this direction<br />
are promising.<br />
The chief executives of the UN agencies,<br />
following the example of their joint discussions<br />
of and collective responses to climate<br />
change, can convene to examine the role<br />
of water, water systems and water management<br />
in development and environmental<br />
services, providing direction to agencies<br />
and advice to member countries.<br />
The World Water Assessment Programme<br />
and its partners are working to help reduce<br />
uncertainty, facilitate decision-making and<br />
accelerate investment by highlighting the<br />
links between socioeconomic development<br />
and investment in water management capacity<br />
and infrastructure in other sectors.<br />
The challenges are great, but unsustainable<br />
management and inequitable access<br />
to water resources cannot continue. We<br />
might not have all the information we<br />
would like to have before acting, but we do<br />
know enough now to begin to take significant<br />
steps. Actions must include increased<br />
investment in water infrastructure and<br />
capacity development. Leaders in the water<br />
domain can inform the processes outside<br />
their domain and manage water resources<br />
to achieve agreed socioeconomic objectives<br />
and environmental integrity. But leaders<br />
in government, the private sector and civil<br />
society will determine the direction that<br />
actions take. Recognizing this responsibility,<br />
they must act now!<br />
xxvi World Water Development Report 3
Water in a changing world<br />
Chapter<br />
1 Getting out of the box – linking water<br />
to decisions for sustainable development<br />
Chapter 1<br />
Coordinator<br />
Olcay Ünver<br />
(WWAP)<br />
Facilitator<br />
William Cosgrove
PART<br />
Chapter 1<br />
Getting out of<br />
the box – linking<br />
water to decisions for<br />
sustainable development<br />
Authors: Andy Bullock, William Cosgrove, Wim van der Hoek, James Winpenny<br />
Contributors: Gerry Galloway, BertJan Heij, Molly Hellmuth, Jack Moss, Monica Scatasta<br />
Coordinator: Olcay Ünver (WWAP)<br />
Facilitator: William Cosgrove<br />
Key messages<br />
The ‘water box’ dilemma must be resolved. Leaders in the water sector<br />
– in water supply and sanitation, hydropower, irrigation and flood<br />
control – have long been aware that water is essential to sustainable<br />
development, but they do not make the decisions on development<br />
objectives and the allocation of human and financial resources to<br />
meet them. These decisions are made or influenced by leaders in government,<br />
the private sector and civil society, who must learn to recognize<br />
water’s role in obtaining their objectives.<br />
Water is essential for achieving sustainable development and the Millennium<br />
Development Goals. Properly managing water resources is<br />
an essential component of growth, social and economic development,<br />
poverty reduction and equity, and sustainable environmental services<br />
– all essential for achieving the Millennium Development Goals.<br />
Water is linked to the crises of climate change, energy and food supplies<br />
and prices, and troubled financial markets. Unless their links<br />
with water are addressed and water crises around the world are resolved,<br />
these other crises may intensify and local water crises may<br />
worsen, converging into a global water crisis and leading to political<br />
insecurity and conflict at various levels.<br />
The media today are full of talk of crises<br />
– in climate change, energy and food<br />
supplies and prices, and troubled financial<br />
markets. These global crises are linked to<br />
each other and to water resources. Unless<br />
resolved, they may lead to increasing political<br />
insecurity and conflict at local and<br />
national levels.<br />
These crises arise against a background of<br />
continuing poverty for much of the world.<br />
Managing water resources is essential to<br />
social and economic development, poverty<br />
reduction and equity and to achieving the<br />
Millennium Development Goals. Sustainable<br />
development depends on managing<br />
the costs of service provision using existing<br />
infrastructure along with additional<br />
investments in new water infrastructure<br />
and rehabilitation, both physical and<br />
institutional.<br />
Specialists and managers in water supply<br />
and sanitation, hydropower, irrigation<br />
and flood control have long been aware<br />
that water is essential to sustainable development.<br />
But they often have a narrow,<br />
sectoral perspective that blinds many<br />
decisions on water. And they do not make<br />
the decisions on development objectives<br />
and the allocation of human and financial<br />
resources needed to meet these broader<br />
objectives. These decisions are made or<br />
influenced by leaders in government,<br />
the private sector and civil society. These<br />
leaders must learn to recognize water’s<br />
role in attaining their objectives and act<br />
accordingly.<br />
Water in a changing world 3
PART<br />
Chapter 1<br />
an understanding<br />
of water issues<br />
and of the<br />
support needed<br />
for investments,<br />
institutions,<br />
incentives,<br />
information<br />
and capacity<br />
inside the ‘water<br />
sector’ requires<br />
partnerships<br />
between those<br />
responsible for<br />
the economywide<br />
benefits of<br />
water and those<br />
responsible for<br />
managing water<br />
And they must act in a changing world, a<br />
world driven by forces that they often do<br />
not control – forces of demography, the<br />
global economy, changing societal values<br />
and norms, technological innovation,<br />
international law, financial markets and<br />
climate change.<br />
Opening the water box<br />
Until the 1990s (and continuing in some<br />
countries) water subsectors generally<br />
worked independently, with specialists in<br />
water supply and sanitation, hydropower,<br />
irrigation, flood control and so on interacting<br />
very little. 1 As population growth<br />
and other pressures on water (‘water drivers’)<br />
brought more and more basins near<br />
closure (the allocation of all of the water<br />
in a basin), the need to manage water<br />
across subsectors at the basin level became<br />
evident. Water management was expanded<br />
during the 1990s to incorporate efficient<br />
water use, equitable sharing of benefits,<br />
and environmental sustainability – what<br />
came to be called integrated water resources<br />
management. And in 2002 the World<br />
Summit on Sustainable Development in<br />
Johannesburg set for all countries the goal<br />
to develop integrated water resources management<br />
plans by 2005.<br />
Many countries are applying integrated<br />
water resources management at the basin<br />
level. But management is still largely confined<br />
to the water sector, where it is well<br />
understood that water is essential to all life<br />
on the planet (human and other species)<br />
and to human livelihoods. The sector is<br />
beginning to recognize that decisions by<br />
people outside the water sector determine<br />
how water will be used, but the other<br />
sectors are seen as cross-cutting in water<br />
management. The approach within the<br />
sector has been to invite those working in<br />
other socioeconomic sectors to join in integrated<br />
water resources management. But<br />
the societal and political questions that<br />
determine the real allocation and management<br />
of water resources also need to take<br />
into account the technological aspects of<br />
integrated water resources management.<br />
The sphere of decision-making and<br />
the water box<br />
Within government, water use is decided<br />
by the interaction of decision-makers in<br />
the main socioeconomic sectors – health,<br />
education, agriculture, housing, industry,<br />
energy, economic development and environment.<br />
In many countries this interaction<br />
occurs through a cabinet of ministers<br />
presided over by the prime minister or<br />
president. Parallel mechanisms may exist<br />
at a regional, state (provincial) or local<br />
(municipal) government level. The role of<br />
these government structures is critical in<br />
water management.<br />
In many countries government directly<br />
controls only a small fraction of investments<br />
in the economy, but it determines<br />
the conditions that will attract or discourage<br />
investment. To be most effective,<br />
decisions should be taken through an<br />
interactive process that involves leaders in<br />
business (finance, industries, commerce)<br />
and civil society (community-based organizations<br />
and other non-governmental<br />
organizations).<br />
Ideally, government, business and civil<br />
society leaders would work together in the<br />
interest of society. Because of the implications<br />
of their decisions for water use, an<br />
understanding of water issues and of the<br />
support needed for investments, institutions,<br />
incentives, information and capacity<br />
inside what has traditionally been considered<br />
the ‘water sector’ requires partnerships<br />
between those responsible for the<br />
economy-wide benefits of water and those<br />
responsible for managing water. Leaders<br />
in the water sector must thus ensure that<br />
these leaders outside the ‘water box’ know<br />
the constraints and options for water<br />
resources and help them implement their<br />
decisions efficiently and effectively.<br />
Among the decisions that affect water the<br />
most are those relating to how a country<br />
meets its objectives for energy and food<br />
security, employment, disaster preparedness,<br />
environmental sustainability and<br />
other societal goals. These decisions are<br />
made in broader political frameworks and<br />
not by water managers, who subsequently<br />
deal with their implications for water and<br />
with other outcomes that touch on water.<br />
Figure 1.1 illustrates this process.<br />
Outside the water sector is an area of synergy,<br />
tradeoffs, coordination and integration,<br />
involving higher-level, multisectoral<br />
decision-making processes. Water professionals,<br />
stakeholders and individuals can<br />
inform and influence decisions in this<br />
area, affecting outcomes. But they need<br />
to have a seat at the decision-making<br />
table and to respond by implementing<br />
water management effectively and efficiently<br />
and by properly informing the<br />
decision-making process. These efforts are<br />
facilitated in the many countries that have<br />
adopted water resources management laws,<br />
policies or strategies that reflect links between<br />
water and the social and economic<br />
sectors.<br />
4 World Water Development Report 3
PART<br />
getting out of the box – linking water to decisions for sustainable development<br />
Figure 1.1<br />
Decision-making affecting water<br />
Political<br />
actors<br />
• Economic<br />
• Social<br />
• Environment<br />
• Demographic<br />
• Policy, law and<br />
finance<br />
• Technology<br />
• Climate change<br />
Civil<br />
society<br />
actors<br />
Drivers of<br />
change<br />
• Policy<br />
formation<br />
• Resource<br />
allocations<br />
• Political and<br />
operational<br />
decisions<br />
Modify<br />
Business and<br />
economic<br />
actors<br />
Response<br />
options<br />
Pressures<br />
• Finance<br />
• Exploitation<br />
• Pollution<br />
• Urbanization<br />
• Land use<br />
• Water use<br />
• Climate variability<br />
Other sector<br />
management<br />
Create<br />
Life and<br />
livelihoods<br />
• Aspirations<br />
• Poverty alleviation<br />
• Health and<br />
well-being<br />
• Security<br />
• Employment<br />
Impact<br />
Water<br />
box<br />
Demand<br />
Demand<br />
Water resources<br />
• Rainwater<br />
• Groundwater<br />
• Lakes<br />
• Reservoirs<br />
• Wetlands<br />
• Wastewater<br />
• Desalinated water<br />
Affect<br />
Water sector<br />
management<br />
Water uses<br />
• Domestic<br />
• Agriculture<br />
• Industry<br />
• Energy<br />
• Leisure<br />
• Transport<br />
• Environment<br />
Source: Authors’ construction.<br />
Water in a changing world 5
PART<br />
Chapter 1<br />
everywhere<br />
decisions related<br />
to development<br />
of necessity<br />
incorporate water<br />
development<br />
decisions,<br />
whether explicitly<br />
recognized or not<br />
Decision-makers and water<br />
management<br />
Providing water is but a means of achieving<br />
a country’s development objectives –<br />
generally job creation, food security, GDP<br />
growth and social goals including poverty<br />
reduction. In pursuing these objectives,<br />
decision-makers are challenged by tradeoffs<br />
between possible investments and<br />
possible synergies between sectors. Making<br />
trade-offs and searching for synergies require<br />
cooperation between those responsible<br />
for different sectors of the economy.<br />
Where there has been sustained development,<br />
the role of government has generally<br />
been to facilitate action by others and<br />
to regulate the process. 2 The role of water<br />
managers has been to inform decisionmakers<br />
of the constraints and opportunities<br />
of water resources management and<br />
water infrastructure development and<br />
then to act in accordance with the national<br />
development strategy.<br />
Partnerships have been strongly promoted<br />
in the water sector, particularly for service<br />
provision. Public-private partnerships<br />
have been the predominant model, some<br />
functioning as intended, and some with<br />
mixed impacts. Water user associations in<br />
participatory irrigation management have<br />
become widespread in a number of countries,<br />
with some success in improving irrigation<br />
scheme management. But whether<br />
the operator is a private company, a public<br />
corporation or a municipal service, the<br />
successes have clearly demonstrated the<br />
importance of the complementary roles of<br />
public decision-makers and authorities on<br />
the one side and service operators on the<br />
other. In the long-term neither can succeed<br />
without the other.<br />
Other types of partnerships include civil<br />
society organizations, municipalities and<br />
the private sector. A recent study on Latin<br />
America concluded that proper institutional<br />
frameworks, incentives and mutual<br />
trust are keys to successful partnerships. 3<br />
River basin organizations are increasingly<br />
playing an important role. Broad coalitions<br />
of development partners, including different<br />
levels of government; donors; multinational,<br />
international and regional agencies;<br />
and local non-governmental organizations<br />
are being created in some countries, such<br />
as Mozambique, 4 to advise on priorities<br />
for public expenditures. Speaking at the<br />
Davos economic summit in January 2008,<br />
U.K. Prime Minister Gordon Brown said<br />
that the Millennium Development Goals<br />
will not be met ‘unless there is a private,<br />
voluntary and government partnership’. 5<br />
He added that ‘governments have to understand<br />
that they have to make it possible for<br />
companies to affect change’ and at times<br />
have to see companies as providers not just<br />
of resources but also of resourcefulness.<br />
Where development is occurring rapidly<br />
and growth is viable, greater emphasis will<br />
be on private sector engagement and market-based<br />
mechanisms. Where development<br />
is slower and growth prospects are weaker,<br />
greater emphasis will be on providing basic<br />
services, including safety nets targeting<br />
society’s poorest. Where governments and<br />
institutions are weak (fragile states) emphasis<br />
will be on reconstruction and rehabilitation.<br />
And where there are humanitarian crises,<br />
conflicts and natural disasters, emphasis<br />
will be on emergency responses. Working<br />
across many countries simultaneously,<br />
regional approaches emphasize integration,<br />
regional security and equity. Thus, although<br />
development is taking place in very different<br />
settings, with different integrating<br />
frameworks and processes and different sets<br />
of actors, everywhere decisions related to<br />
development of necessity incorporate water<br />
development decisions, whether explicitly<br />
recognized or not.<br />
More important than trying to quantify<br />
the relative ‘market share’ of the public<br />
and private sectors is recognizing that they<br />
face similar challenges, constraints and<br />
difficulties. The task for decision-makers<br />
and political leaders is to create the framework<br />
conditions under which operators of<br />
all kinds – public, private, mixed, community<br />
providers and others – can provide<br />
services and investments effectively over<br />
the long term.<br />
Sustainable development<br />
as the framework for water<br />
management<br />
In the overview of The Growth Report of<br />
2008 the Commission on Growth and<br />
Development argues that<br />
Growth is not an end in itself. But<br />
it makes it possible to achieve other<br />
important objectives of individuals<br />
and societies. It can spare people<br />
en masse from poverty and drudgery.<br />
Nothing else ever has. It also<br />
creates the resources to support<br />
health care, education, and the<br />
other Millennium Development<br />
Goals to which the world has committed<br />
itself. In short, we take the<br />
view that growth is a necessary, if<br />
not sufficient, condition for broader<br />
development, enlarging the scope<br />
6 World Water Development Report 3
PART<br />
getting out of the box – linking water to decisions for sustainable development<br />
for individuals to be productive and<br />
creative. 6<br />
Box 1.1<br />
Commitment of African heads of state to<br />
water as a key to sustainable development<br />
Sustained growth requires water<br />
Growth requires access to natural resources.<br />
The Growth Report acknowledges that we<br />
may be entering a period in which natural<br />
resources, broadly defined, impose new<br />
limits on growth. But the report makes<br />
no major reference to the essential role of<br />
water resources. World Water Development<br />
Report 3, which places more emphasis on<br />
development than its predecessors, makes<br />
the case that the availability of water resources<br />
and their management are determinants<br />
of a country’s growth strategy.<br />
Africa provides a good example because<br />
both growth and water are major challenges<br />
there. The African heads of state<br />
recognized the importance of water to development<br />
when they gathered in Sharm<br />
el-Sheikh, Egypt, in mid-2008 and adopted<br />
a declaration explicitly noting the role of<br />
water as a key to sustainable development<br />
in the region (box 1.1).<br />
Societies do not become wealthy first and<br />
then invest in water management; they<br />
find ways to manage water and risk first,<br />
which then leads to wealth. If they are<br />
wise, they do this in a way that avoids<br />
pollution, cares for equity and otherwise<br />
ensures the sustainability of the resource.<br />
Investment in water infrastructure is<br />
required to meet basic needs in rural areas<br />
and to enhance agricultural productivity<br />
through better management of water. As<br />
development proceeds, with the shift to<br />
commercial and industrial activities in<br />
urban areas, water has to be managed for<br />
energy and food production, transportation,<br />
flood control, and drinking water<br />
and sanitation, as well as for industrial<br />
and commercial activities.<br />
WE, the Heads of State and Government<br />
of the African Union, meeting at<br />
the 11th Ordinary Session of our Assembly<br />
in Sharm el-Sheikh, Arab Republic of<br />
Egypt, from 30 June to 1 July 2008,<br />
Recognizing the importance of water<br />
and sanitation for social, economic<br />
and environmental development of<br />
our countries and Continent; . . .<br />
Recognizing that water is and must remain<br />
a key to sustainable development<br />
in Africa and that water supply and<br />
sanitation are prerequisites for Africa’s<br />
human capital development;<br />
Concerned that there is an underutilization<br />
and uneven sharing of water<br />
resources in Africa, and that remains a<br />
growing challenge in the achievement<br />
of food and energy securities. . . .<br />
WE COMMIT OURSELVES TO:<br />
(a) Increase our efforts to implement<br />
our past declarations related to water<br />
and sanitation.<br />
(b) Raise the profile of sanitation by addressing<br />
the gaps in the context of the<br />
2008 eThekwini Ministerial Declaration<br />
on sanitation in Africa adopted by [the<br />
African Ministers Council on Water].<br />
(c) Address issues pertaining to agricultural<br />
water use for food security as<br />
provided for in the Ministerial Declaration<br />
and outcomes of the first African<br />
Water Week.<br />
And particularly;<br />
(d) Develop and/or update national<br />
water management policies, regulatory<br />
frameworks, and programmes, and<br />
prepare national strategies and action<br />
plans for achieving the [Millennium Development<br />
Goal] targets for water and<br />
sanitation over the next seven (7) years;<br />
(e) Create conducive environment to<br />
enhance the effective engagement of<br />
local authorities and the private sector;<br />
(f) Ensure the equitable and sustainable<br />
use, as well as promote integrated management<br />
and development, of national<br />
and shared water resources in Africa;<br />
(g) Build institutional and human resources<br />
capacity at all levels including<br />
the decentralized local government<br />
level for programme implementation,<br />
enhance information and knowledge<br />
management as well as strengthen<br />
monitoring and evaluation;<br />
(h) Put in place adaptation measures to<br />
improve the resilience of our countries<br />
to the increasing threat of climate<br />
change and variability to our water<br />
resources and our capacity to meet<br />
the water and sanitation targets;<br />
(i) Significantly increase domestic<br />
financial resources allocated for implementing<br />
national and regional water<br />
and sanitation development activities<br />
and call upon Ministers of water and<br />
finance to develop appropriate investment<br />
plans;<br />
(j) Develop local financial instruments<br />
and markets for investments in the<br />
water and sanitation sectors;<br />
(k) Mobilize increased donor and other<br />
financing for the water and sanitation<br />
initiatives. . . .<br />
Source: African Union 2008.<br />
Asian Water Development Outlook 2007 highlights<br />
the significant global development<br />
challenge this represents. 7 That report emphasizes<br />
a ‘multi disciplinary and multi-sector<br />
perspective [on water] around the Asia<br />
and Pacific region’ in facing the challenges<br />
of sustaining growth. It highlights<br />
important topics that have been<br />
neglected or are being inadequately<br />
considered in most countries of<br />
the region. Among these is the<br />
urgent need to address the inherent<br />
interrelationships between water<br />
and other important developmentrelated<br />
sectors, like energy, food,<br />
and the environment.<br />
It has little in the way of a detailed roadmap<br />
for water resources development, however.<br />
Benefits from investing in water<br />
Many water investments have been evaluated<br />
by the rate of return of single-purpose<br />
schemes without considering the additional<br />
benefits possible from multipurpose<br />
projects. 8 Increasingly, evidence is emerging<br />
of the direct economy-wide benefits<br />
of investments in water (see chapter 6).<br />
For example, there is evidence that local<br />
action on water management in China<br />
has delivered measurable improvements<br />
in local GDP. 9 In the 335 counties in<br />
China with primary electrification from<br />
hydropower, annual average income per<br />
Water in a changing world 7
PART<br />
Chapter 1<br />
700<br />
600<br />
500<br />
400<br />
300<br />
200<br />
100<br />
Figure 1.2<br />
Total economic costs (US$ billions)<br />
0<br />
Richest countries a<br />
a. Annual GDP per capita above $9,361.<br />
b. Annual GDP per capita below $760.<br />
Source: Delli Priscoli and Wolf 2009.<br />
Figure 1.3<br />
800<br />
700<br />
600<br />
500<br />
400<br />
300<br />
200<br />
100<br />
0<br />
1928 1934<br />
The costs of disasters as a share of GDP are<br />
much higher in poor countries than rich<br />
countries<br />
Costs as share of GDP (percent)<br />
Poorest countries b<br />
US government investments in water<br />
infrastructure during 1930-96 yielded $6 in<br />
damages averted for each $1 invested<br />
Investment in water infrastructure<br />
(1999 US$ billions, adjusted using Construction Cost Index)<br />
1940<br />
1946<br />
1952<br />
1958<br />
Source: Based on Delli Priscoli and Wolf 2009.<br />
Box 1.2<br />
1964<br />
1970<br />
1976<br />
Cumulative benefits<br />
Cumulative expenditures<br />
1982<br />
1988<br />
Economic impacts of lack of adequate<br />
sanitation facilities in South-East Asia<br />
Cambodia, Indonesia, the Philippines<br />
and Viet Nam lose an estimated $9 billion<br />
a year because of poor sanitation<br />
(based on 2005 prices), or approximately<br />
2% of their combined GDP, according<br />
to the first regional study on<br />
the economic impacts of poor sanitation,<br />
undertaken in South-East Asia by<br />
the World Bank Water and Sanitation<br />
Project. The highest economic costs<br />
($4.8 billion for the four countries<br />
combined) are from sanitation- and<br />
hygiene-related diseases. Poor sanitation<br />
also contributes substantially to<br />
water pollution, adding to the cost of<br />
Annual benefits<br />
1994<br />
14<br />
12<br />
10<br />
8<br />
6<br />
4<br />
2<br />
0<br />
1999<br />
providing safe water for households<br />
and reducing the production of fish<br />
in rivers and lakes ($2.3 billion). There<br />
are also environmental losses (loss of<br />
productive land, $220 million) and<br />
tourism losses ($350 million). Universal<br />
sanitation would lead to an annual<br />
gain of $6.3 billion in the four countries.<br />
Implementing ecological sanitation<br />
approaches (latrines separating<br />
urine and fæces for use as fertilizer)<br />
would be worth an estimated $270<br />
million annually.<br />
Source: Hutton, Haller, and Bartram 2007.<br />
farmer rose 8.1% a year, nearly 3 percentage<br />
points more than the national average.<br />
In those communities 30 million people<br />
upgraded their livelihoods from marginalized<br />
farming to off-farm labourers in<br />
the industrial and services sector without<br />
any negative impact on agricultural<br />
production.<br />
Evidence is also growing of the macroeconomic<br />
returns to investments in water<br />
management – and the costs of failures to<br />
invest. Disasters such as floods (resulting<br />
from typhoons and hurricanes and from<br />
rainfall exceeding the carrying capacity of<br />
channels) and droughts hurt poor economies<br />
more than wealthy ones, which are<br />
better prepared to cope with such disasters<br />
(figure 1.2).<br />
Investments in environmental sustainability<br />
and water management to prevent<br />
water -related disasters can have large<br />
payoffs, so countries need not wait to invest<br />
until they have achieved middle- or<br />
high-income status. Investments in water<br />
infrastructure by the US Army Corps of<br />
Engineers between 1930 and 1999, for<br />
example, yielded returns of $6 for each<br />
$1 spent and controlled flood damage<br />
despite rising population numbers and<br />
property value at risk over the period<br />
(figure 1.3). The World Health Organization<br />
(WHO) estimates returns of $3-$34,<br />
depending on the region and technology,<br />
for each $1 invested in safe drinking<br />
water and basic sanitation. 10 There is thus<br />
a strong case that improved coverage of<br />
drinking water and sanitation contributes<br />
to economic growth. Policy-makers can<br />
use these data to justify their actions,<br />
identify areas of deficiency and better<br />
prioritize actions. 11<br />
Policy-makers also need to better understand<br />
the benefits for national development<br />
that result from sustainable water<br />
management and provision of safe water.<br />
Expanding safe drinking water and sanitation<br />
services would drastically cut the loss<br />
of life from water-related illness and free<br />
up scarce health resources in developing<br />
countries. Five thousand children die each<br />
day from diarrhoea alone – one every 17<br />
seconds. 12 Upgrading water supply and<br />
sanitation services can also improve education,<br />
allowing more girls to attend school<br />
instead of spending hours each day collecting<br />
water. Improved access would also<br />
save millions of work days. The overall<br />
economic loss in Africa alone due to lack<br />
of access to safe water and basic sanitation<br />
is estimated at $28.4 billion a year, or<br />
around 5% of GDP. 13 Box 1.2 estimates the<br />
8 World Water Development Report 3
PART<br />
getting out of the box – linking water to decisions for sustainable development<br />
costs of lack of access to adequate sanitation<br />
facilities for four South-East Asian<br />
countries.<br />
Box 1.3<br />
Estimated costs of restoring essential<br />
ecosystems in the United States<br />
Environmental degradation from water<br />
pollution and excessive withdrawals also<br />
has negative economic impacts. For example,<br />
the damage cost of environmental<br />
degradation in the Middle East and North<br />
Africa has been estimated at some $9 billion<br />
a year, or 2.1%-7.4% of GDP. 14 Industrial<br />
countries are learning the enormous<br />
costs associated with restoring essential<br />
ecosystems. In the United States the costs<br />
have been estimated at more than $60 billion<br />
and continue to rise as more becomes<br />
known (box 1.3).<br />
Investing in water<br />
Investment flows to uses with the highest<br />
economic rate of returns. Currently, water<br />
often gives very low returns for very long<br />
payback periods primarily because of the<br />
way it is governed (see chapter 4). Much<br />
political interaction in the water sector<br />
drives operations to ‘structural bankruptcy’.<br />
It is not surprising that new investors<br />
are not eager to enter the water sector.<br />
Yet public investment in infrastructure is<br />
declining. And so the needs of the water<br />
sector go unmet.<br />
The challenges in financing water services<br />
have been well described in recent<br />
years. Proposed solutions and innovative<br />
responses are presented in the reports<br />
of the World Panel on Financing Water<br />
Infrastructure 15 and the Task Force on<br />
Financing Water for All. 16 Ultimately, there<br />
are only three sources of financing: user<br />
tariffs, public expenditure and external<br />
aid (official or philanthropical). Recourse<br />
to these sources should be preceded and<br />
accompanied by efficiency measures to<br />
control operating costs and by careful<br />
project selection and design to ensure the<br />
best return to scarce resources.<br />
Many studies have attempted to estimate<br />
the total investments that would be required<br />
to provide adequate infrastructure<br />
for water supply and sanitation. Typically<br />
presented as global or regional estimates,<br />
they often ignore the essential precondition<br />
of investments in institutions, reform,<br />
and implementation and management<br />
capacities and in replacement of ageing<br />
infrastructure. Because water can be managed<br />
only locally, investments must also<br />
be managed locally. Investing in water<br />
requires a holistic approach (figure 1.4).<br />
Sound financial management, as illustrated<br />
in figure 1.4, will make it possible<br />
for water authorities and governments to<br />
The following are estimates for restoring<br />
major essential ecosystems in<br />
the United States. The cost exceeds<br />
$60 billion, and the total is likely to<br />
be higher still as more information<br />
becomes available.<br />
• Everglades Restoration: $10.9<br />
billion. Groundwork laid for<br />
Everglades restoration, but<br />
projects are experiencing delays<br />
(www8.nationalacademies.<br />
org/onpinews/newsitem.<br />
aspx?RecordID=11754).<br />
• Restoration of the Upper Mississippi<br />
River: $5.3 billion for a<br />
50-year ecosystem restoration<br />
plan (www.nationalaglawcenter.<br />
org/assets/crs/RL32470.pdf).<br />
• Restoration of Coastal Louisiana:<br />
$14 billion towards a<br />
Sustainable Coastal Louisiana<br />
Figure 1.4<br />
Investment<br />
plans<br />
Realistic finance<br />
strategies<br />
Ultimate sources<br />
(filling the gap)<br />
• Users and beneficiaries<br />
• Public budgets<br />
• External aid<br />
Leveraging<br />
• To fill the gap<br />
• Increase users’<br />
willingness to pay<br />
(services, efficiency,<br />
reforms)<br />
• To bridge the gap<br />
• Attract private<br />
funds<br />
• Integrate finance<br />
packages<br />
Source: Authors’ construction.<br />
• Objectives<br />
• Technology requirements<br />
attract loans or external aid to supplement<br />
their own sources of capital.<br />
Nonetheless, many developing countries,<br />
having applied all of the measures implied<br />
by such a process, will still lack the capital<br />
required to meet basic needs through<br />
by 2050 (www.coast2050.<br />
gov/2050reports.htm).<br />
• Restoration of Chesapeake Bay:<br />
$19 billion for the Chesapeake Bay<br />
Program (www.chesapeakebay.<br />
net/fundingandfinancing.aspx<br />
?menuitem=14907).<br />
• Restoration of Great Lakes: $8<br />
billion for Great Lakes restoration<br />
and protection priorities (www.<br />
cglg.org/projects/priorities/<br />
PolicySolutionsReport12-10-04.<br />
pdf).<br />
• Restoration of California Bay<br />
Delta: $8.5 billion (first seven<br />
years) for large-scale ecosystem<br />
restoration initiatives (www.<br />
nemw.org/calfed.htm).<br />
• Restoration of Missouri River – to<br />
be determined.<br />
Water investment requires a holistic approach<br />
– links between pricing, financing and<br />
stakeholders<br />
Costs<br />
Financial<br />
needs/gap<br />
Pricing strategies<br />
• Part of sustainable cost recovery<br />
• Trade-offs: financial, social, economic, environmental<br />
sustainability<br />
• Leveraging effects: sources and skills<br />
• Payment schemes? Leveraging beneficiaries’<br />
willingness to pay<br />
Financing mechanisms (bridging the gap)<br />
• Payment schemes leveraging beneficiaries’<br />
willingness to pay<br />
• Attract funds and build appropriate finance packages<br />
(cost of capital)<br />
Maximizing contributions to sector sustainability by<br />
different stakeholders, including the private sector<br />
• Increase efficiency: reduce cost, reduce gap<br />
• Improve service: increase users’ willingness to pay<br />
• Clarify roles and provide stability: attract funds<br />
• Elicit users’ needs: reduce cost/gap, increase<br />
willingness to pay<br />
Water in a changing world 9
PART<br />
Chapter 1<br />
Today, poverty<br />
reduction<br />
strategies still offer<br />
only the prospect<br />
of aligning action<br />
on water with<br />
poverty reduction,<br />
as few current<br />
poverty reduction<br />
strategies give<br />
anything but<br />
superficial<br />
attention to<br />
action on water<br />
water resources development and service<br />
delivery. In those cases it is relevant to<br />
question how much external aid is available,<br />
where it is applied and whether the<br />
amount can or should be increased.<br />
Distributing the benefits of growth<br />
The 2007 U.K. Department for International<br />
Development policy paper ‘Growth<br />
and Infrastructure’ stated that ‘Growth is<br />
the single most important way of pulling<br />
people out of poverty’. 17 It cites empirical<br />
literature attributing more than 80%<br />
of recent poverty reduction worldwide to<br />
growth and less than 20% to redistribution<br />
(social protection). It gives the examples<br />
of China, where 450 million people<br />
have been lifted out of poverty since 1979,<br />
helped by exceptionally high growth<br />
rates, and Viet Nam, which experienced<br />
the most rapid reduction in poverty rates<br />
on record, from 75% in the late 1980s to<br />
less than a third in 2002, thanks to high<br />
growth rates.<br />
That poverty reduction is the overriding<br />
policy concern is evidenced by the<br />
primacy of poverty reduction strategies<br />
and national development plans as the<br />
governing mechanisms for partnerships<br />
and finance from the international community.<br />
As of mid-2008, 59 countries had<br />
prepared full poverty reduction strategies<br />
and 11 more had completed preliminary<br />
poverty reduction strategies. This represents<br />
a significant change. For many<br />
years action on water that could deliver<br />
benefits to the poor lacked government<br />
frameworks that prioritized poverty<br />
reduction and mobilization of financing.<br />
Today, poverty reduction strategies still<br />
offer only the prospect of aligning action<br />
on water with poverty reduction, as few<br />
current poverty reduction strategies give<br />
anything but superficial attention to action<br />
on water.<br />
Public expenditure reviews are another<br />
tool to help decision-makers allocate<br />
public funds. These reviews of government<br />
spending can boost efficiency and equity,<br />
development impact and the accountability<br />
of public spending. They can also increase<br />
the accountability and transparency<br />
of results and support governance reforms<br />
and anticorruption programs.<br />
Economic justification for water investments<br />
come from their translation into<br />
economy-wide growth through employment,<br />
capital and labour productivity,<br />
taxes, government expenditure, revenue<br />
control, debt, purchasing power, balance<br />
of payments, foreign exchange reserves,<br />
trade balances, accelerator impacts on<br />
capital investment, business confidence<br />
and the stock market.<br />
In India water development evened out<br />
the seasonal demand for labour, resulting<br />
in major gains for the country. 18 Forecasts<br />
by the New Partnership for Africa’s<br />
Development concerning African agriculture’s<br />
contribution to growth and poverty<br />
reduction are founded on the economic<br />
justifications of reduced food import bills,<br />
more predictable import profiles, increased<br />
export revenues and reduced poverty at<br />
the household level. 19<br />
To attract development-oriented finance,<br />
the growth-increasing and povertyreducing<br />
contributions of water resources<br />
must be made explicit and specific at the<br />
country level. Such specifics will influence<br />
the sources, costs, viability, sustainability<br />
and instruments of finance. National,<br />
basin and local action plans are needed to<br />
align water resources, economic growth<br />
and poverty reduction. Making such alignments<br />
and other essential connections<br />
will be more successful within frameworks<br />
such as a round of poverty reduction<br />
strategies, public expenditure reviews and<br />
national development plans.<br />
Reducing poverty, which limits<br />
access to water<br />
The world must acknowledge the crisis of<br />
persistent underdevelopment and poverty.<br />
Since the end of the Second World War<br />
more than 3 billion people have benefited<br />
from economic development, but<br />
at least 2 billion people remain in need.<br />
Some 1.4 billion people lived in ‘absolute<br />
poverty’ in 2005, 20 a number that does not<br />
take into account the recent wave of increases<br />
in energy and food prices. 21 These<br />
women, men and children daily face the<br />
consequences of poverty – disease, malnutrition<br />
and hunger. They have no capacity<br />
to prepare for natural disasters, such<br />
as earthquakes and floods, or to respond<br />
when they strike. The world community<br />
has set the Millennium Development<br />
Goal target of halving the proportion of<br />
people living in poverty by 2015. But we<br />
are far from being on track, particularly in<br />
regions where the need is highest.<br />
Human Development Report 2006 considers<br />
the experience of water and sanitation<br />
as reinforcing the ‘long-standing human<br />
development lesson’ that rates of coverage<br />
in access to water and sanitation rise with<br />
income on average (figure 1.5). 22 Global<br />
Monitoring Report 2005 notes that in South<br />
Asia an improving investment climate and<br />
10 World Water Development Report 3
PART<br />
getting out of the box – linking water to decisions for sustainable development<br />
stronger policies, along with gains in basic<br />
service delivery, have sustained rapid economic<br />
growth since 1990 and contributed<br />
significantly to poverty reduction and to<br />
reaching the Millennium Development<br />
Goals in some countries. 23<br />
The case for investing in Africa<br />
Where investment in water has been<br />
weak, GDP growth has been constrained<br />
– by as much as 10% where the effects of<br />
droughts, floods and natural hydrologic<br />
variability are compounded in less developed<br />
economies. Where weak economic<br />
growth has been accompanied by inadequate<br />
investment in social protection, the<br />
gap in achieving the Millennium Development<br />
Goals has worsened in many countries,<br />
with devastating social impacts.<br />
Africa, in particular, remains mired in<br />
poverty (figure 1.6) despite recent economic<br />
growth trends in some countries. In<br />
developed countries water storage ensures<br />
reliable sources of water for irrigation,<br />
water supply and hydropower as well as a<br />
buffer for flood management. Countries<br />
in Africa store only about 4% of annual<br />
renewable flows, compared with 70%-90%<br />
in many developed countries. About 340<br />
million Africans lack access to safe drinking<br />
water, and almost 500 million lack<br />
access to improved sanitation facilities.<br />
The First African Water Week, convened<br />
in Tunis in March 2008, opened with<br />
a call for greater efforts to ensure water<br />
security nationally and regionally. Donald<br />
Kaberuka, president of the African Development<br />
Bank Group, emphasized that<br />
Figure 1.5<br />
100<br />
80<br />
60<br />
40<br />
20<br />
0 5,000 10,000 15,000 20,000<br />
100<br />
80<br />
60<br />
40<br />
20<br />
Access to water and sanitation rises with<br />
income<br />
Population with sustainable access to improved drinking water source, 2006 (percent)<br />
GNI per capita, 2006 (purchasing power parity dollars)<br />
Population with sustainable access to improved sanitation, 2006 (percent)<br />
0<br />
0 5,000 10,000 15,000 20,000<br />
GNI per capita, 2006 (purchasing power parity dollars)<br />
Source: Based on data from WHO Statistical Information System (www.who.int/whosis/en/).<br />
100<br />
Figure 1.6<br />
75<br />
Poverty remains high in sub-Saharan Africa<br />
Share of population living below the poverty line (percent)<br />
$2.00<br />
it is no longer acceptable that the<br />
African continent continues to utilize<br />
only 4% of its water resources,<br />
when a huge proportion of the<br />
people do not have access to safe<br />
water, and when large populations<br />
are faced with frequent floods and<br />
drought, in addition to food and<br />
energy shortages. Action is urgently<br />
needed. 24<br />
50<br />
25<br />
0<br />
1981<br />
1984<br />
1987<br />
1990<br />
1993<br />
Note: Poverty lines in 2005 prices.<br />
Source: Based on Chen and Ravallion 2008, p. 41.<br />
1996<br />
1999<br />
2002<br />
$1.25<br />
$1.00<br />
2005<br />
In June 2008 the MDG Africa Steering<br />
Group published a number of concrete<br />
recommendations for scaling up opportunities<br />
to address poverty in Africa. 25 Their<br />
recommendations related to achieving the<br />
Millennium Development Goals in Africa<br />
are summarized in table 1.1.<br />
along the timeline from the Millennium<br />
Summit of 2000 and the 2015 target date<br />
for attaining the Millennium Development<br />
Goals. Making progress towards<br />
those goals will rise even higher on political<br />
agendas within the next six years.<br />
Investing in water to reach the<br />
Millennium Development Goals<br />
This third edition of the United Nations<br />
World Water Development Report is being<br />
published just beyond the half-way point<br />
The Millennium Declaration placed safe<br />
drinking water and basic sanitation firmly<br />
among the development objectives, making<br />
it a target of Millennium Development<br />
Goal 7. But while adequate progress is<br />
Water in a changing world 11
PART<br />
Chapter 1<br />
Table 1.1<br />
Summary of scaling-up opportunities related to achieving the Millennium Development<br />
Goals in Africa<br />
Scaling-up<br />
opportunity<br />
Achieving the<br />
Millennium<br />
Development<br />
Goals in Africa<br />
Summary of<br />
key results<br />
Comprehensive<br />
cross-sector public<br />
expenditure<br />
programmes<br />
against clear<br />
quantitative<br />
targets<br />
Policy<br />
leadership<br />
Secretary-<br />
General and<br />
MDG Africa<br />
Steering Group,<br />
G-8 leadership,<br />
African Union,<br />
private sector,<br />
foundations<br />
Key multilateral financing<br />
mechanisms (among<br />
several funding sources)<br />
All multilateral, bilateral and private<br />
mechanisms providing high-quality,<br />
predictable financing<br />
Estimated public external<br />
financing needs by 2010<br />
from all funding sources<br />
Some $72 billion a year, of which<br />
$62 billion (in 2007 terms) from<br />
Development Assistance Committee<br />
members (following the Gleneagles<br />
G-8 meeting, Monterrey Consensus<br />
and EU official development<br />
assistance targets), with additional<br />
financing from non-Development<br />
Assistance Committee donors,<br />
developing country collaboration,<br />
private foundations and innovative<br />
private co-financing<br />
Source: Based on MDG Africa Steering Group 2008, p. 32.<br />
Box 1.4<br />
Progress in meeting the Millennium<br />
Development Goal target on water supply<br />
and sanitation<br />
The world is on track to meet the Millennium<br />
Development Goal target on<br />
drinking water. Current trends suggest<br />
that more than 90% of the global<br />
population will use improved drinking<br />
water sources by 2015.<br />
The world is not on track to meet<br />
the Millennium Development Goal<br />
sanitation target. Between 1990 and<br />
2006 the proportion of people without<br />
improved sanitation decreased<br />
by only 8 percentage points. Without<br />
an immediate acceleration in<br />
progress, the world will not achieve<br />
even half the sanitation target by<br />
2015. Based on current trends, the<br />
total population without improved<br />
sanitation in 2015 will have decreased<br />
only slightly, from 2.5 billion<br />
to 2.4 billion.<br />
Source: WHO and UNICEF Joint Monitoring<br />
Programme 2008, pp. 8 and 23.<br />
being made towards the provision of safe<br />
drinking water, the sanitation target is far<br />
from being met (box 1.4).<br />
And despite progress, the scale of the challenge<br />
remains massive. While the water<br />
supply target is being attained at a global<br />
level, large regions of the world and many<br />
countries are far from the target, and<br />
some risk backsliding. This is particularly<br />
the case in sub-Saharan Africa and lowincome<br />
Arab states. In many places the<br />
sanitation targets will be missed by a wide<br />
margin.<br />
Both the drinking water and sanitation<br />
targets are vitally important. The contribution<br />
of improved drinking water and<br />
sanitation to the achievement of all the<br />
Millennium Development Goals is now<br />
well established. 26 This report demonstrates<br />
this link throughout; others have<br />
elaborated the direct and indirect contributions<br />
of water management across all<br />
the Millennium Development Goals. 27<br />
Figure 1.7 depicts these links graphically.<br />
These links served as an important advocacy<br />
instrument during the International<br />
Year of Sanitation in 2008. High-profile international<br />
attention has focused on basic<br />
services in recent years, including declarations<br />
at Brasilia (2003), Beppu (2007),<br />
eThekwini (2008), Tunis (2008) and Sharm<br />
el-Sheik (2008). Gaps in drinking water<br />
and sanitation, in particular, have attracted<br />
political attention at the highest levels.<br />
Development partnerships are helping<br />
countries that are off track for achieving<br />
the Millennium Development Goals get<br />
back on track. Intergovernmental efforts<br />
are working to maintain the momentum<br />
of the global commitments made since the<br />
Millennium Declaration and of waterspecific<br />
processes such as the G-8 Evian<br />
Action Plan 28 (box 1.5). New initiatives,<br />
such as the 2007 launch of the Millennium<br />
Development Goal Africa Initiative<br />
by the UN system, have sought to reinvigorate<br />
the efforts of countries that are off<br />
track in their progress towards achieving<br />
the Millennium Development Goals.<br />
Sustaining the environment<br />
Environmental sustainability, broadly,<br />
refers to the ability of the environment<br />
to continue to support progressive social<br />
and economic development and to provide<br />
many types of ecosystem services (table<br />
1.2). Multistakeholder processes, such as<br />
the World Commission on Dams, have<br />
seen environmental sustainability rise<br />
in prominence as a factor influencing<br />
water development decisions. And such<br />
inter national conventions as the United<br />
Nations Convention to Combat Desertification<br />
and the United Nations Convention<br />
on Biodiversity have made water a global<br />
issue.<br />
12 World Water Development Report 3
PART<br />
getting out of the box – linking water to decisions for sustainable development<br />
Figure 1.7<br />
Cause-effect chains and links between water and the Millennium Development Goals<br />
Horizontal<br />
expansion<br />
Terrestrial ecosystems<br />
Hunger<br />
alleviation<br />
goal<br />
Poverty<br />
alleviation<br />
goal<br />
Sanitation<br />
goal (water<br />
supply and<br />
sanitation<br />
goal)<br />
Increased<br />
crop<br />
production<br />
Agricultural<br />
chemicals<br />
Incomegenerating<br />
activities<br />
Human waste<br />
and<br />
latrines<br />
Irrigation<br />
Water<br />
harvesting<br />
Eutrophication<br />
Nitrates in<br />
groundwater<br />
Industrial<br />
production<br />
Pollution<br />
River<br />
depletion<br />
Polluted<br />
water<br />
sources<br />
Aquatic ecosystems<br />
Aquatic ecosystems<br />
Groundwaterdependent<br />
wetlands<br />
Water<br />
supply<br />
goal<br />
Aquatic ecosystems<br />
Environmental<br />
sustainability<br />
goal<br />
Source: Based on Cosgrove 2006, p. 38.<br />
Today, water management crises are developing<br />
in most of the world. UN-Water<br />
reports that in just one week in mid-<br />
November 2006 national media sources<br />
reported local but high-profile shortages<br />
in parts of Australia, Botswana, Canada,<br />
China, Fiji, Kuwait, Liberia, Malawi, Pakistan,<br />
Philippines, South Africa, Uganda,<br />
the United Arab Emirates and the United<br />
States. 29<br />
Generally regional phenomena, water<br />
crises can emerge as water shortages and<br />
droughts, floods or both, now aggravated<br />
by the consequences of climate change.<br />
They may be natural or caused by demands<br />
that exceed supply, lack of infrastructure<br />
or poor water management. They<br />
may be the result of waste or abuse resulting<br />
in pollution. Together they threaten<br />
the lives and livelihoods of billions of<br />
people and risk irrevocably altering the<br />
planet’s ecosystems.<br />
Every year in developing countries an estimated<br />
3 million people die prematurely<br />
from water-related diseases. The largest<br />
proportion of these deaths are among<br />
infants and young children, followed by<br />
women, from poor rural families who lack<br />
access to safe water and improved sanitation<br />
(box 1.6). 30 More than 1 million<br />
people die annually from malaria, the vast<br />
majority in poverty-stricken Africa. Another<br />
1 million people die from air pollution<br />
in urban areas. And everywhere the poor<br />
suffer most.<br />
Box 1.5<br />
High-Level Event on the Millennium<br />
Development Goals, United Nations, New<br />
York, 25 September 2008: Extract from<br />
compilation of partnership events and<br />
commitments<br />
The event [Water and Sanitation for<br />
All] reiterated the strong political<br />
and diplomatic support for international<br />
efforts needed to address<br />
the water and sanitation issues and<br />
enhance human security. It promoted<br />
good water cycle management and<br />
the application of Integrated Water<br />
Resources Management. It reaffirmed<br />
the importance of formulation and<br />
implementation of national assistance<br />
strategies building on the ‘Paris Declaration<br />
on Aid Effectiveness’, while<br />
considering the specific needs and<br />
resources of the recipient countries.<br />
The event emphasized the importance<br />
of mobilizing adequate international<br />
and national financial resources for the<br />
implementation of the national strategies<br />
and the need to strive towards<br />
using sector-wide approaches; and developed<br />
partnerships with civil society<br />
organizations, local authorities and the<br />
private sector to implement national<br />
strategies and action plans to improve<br />
the accessibility and quality of water<br />
and sanitation services as well as initiatives<br />
to establish a ‘Framework for Action’<br />
to focus on the off-track countries,<br />
including the possible consideration<br />
for a ‘Fast Track Initiative’ with catalytic<br />
funding to install a High-Level ‘Task<br />
Force’ to reach [Millennium Development<br />
Goal 7], and to make one annual<br />
global progress report and to hold one<br />
annual high-level review meeting.<br />
Japan committed to establish a Water<br />
Security Action Team for Africa to provide<br />
safe drinking water for 6.5 million<br />
people and implement a water supply<br />
capacity-building program that would<br />
train 5,000 people over the next five<br />
years. Tajikistan said it would host the<br />
International Freshwater Forum in<br />
2010 as a venue for a preliminary discussion<br />
of achievements, challenges<br />
and experiences within the International<br />
Decade Water for Life, 2005-15.<br />
The Netherlands said it would help<br />
provide access to safe drinking water<br />
and sanitation for at least 50 million<br />
people by 2015 having already signed<br />
various agreements that will benefit<br />
almost 30 million people, at a cost of<br />
around €1.3 billion. Germany will continue<br />
to train Central Asian water experts.<br />
The Netherlands and the United<br />
Kingdom committed €106 million in<br />
joint funding for water and sanitation<br />
initiatives in developing countries over<br />
the next five years.<br />
Source: UN 2008.<br />
Water in a changing world 13
PART<br />
Chapter 1<br />
Table 1.2<br />
Environmental<br />
goods<br />
Regulating<br />
services<br />
Supporting<br />
services<br />
Cultural<br />
services<br />
Box 1.6<br />
Malnutrition attributable to environmental<br />
risks<br />
Experts estimate that poor water and<br />
sanitation services and hygiene practices<br />
and inadequate water resources<br />
management contribute to half of all<br />
cases of infant and child underweight,<br />
an estimate corroborated by a World<br />
Bank technical review of 38 recent<br />
cohort studies (confidence interval<br />
of 39%-61%). Evidence from several<br />
of those studies demonstrates that<br />
exposure to environmental health risks<br />
Box 1.7<br />
Water as capital<br />
Classical economists recognized land<br />
(all natural resources), labour and<br />
produced capital as the basic sources<br />
of wealth. Neoclassical economists focused<br />
only on labour and capital, treating<br />
‘land’ as another interchangeable<br />
form of capital. Natural resources were<br />
considered abundant relative to demand<br />
and therefore not an important<br />
focus for economics, whose task was to<br />
allocate scarce resources – those whose<br />
use constrained alternative economic<br />
opportunities. There was little consideration<br />
of the environment’s dual role<br />
as a source of valuable inputs and as a<br />
sink for the economy’s waste and pollution.<br />
Nor was much thought given<br />
to the possibility that the world might<br />
reach a scale of resource exploitation at<br />
which the capacity of both the source<br />
and sink functions of the environment<br />
could become binding constraints on<br />
economic growth.<br />
The focus on produced rather<br />
than natural capital is particularly<br />
Types of ecosystem services<br />
Forests<br />
• Food<br />
• Freshwater<br />
• Fuel<br />
• Fibre<br />
• Climate regulation<br />
• Flood regulation<br />
• Disease regulation<br />
• Water purification<br />
• Nutrient cycling<br />
• Soil formation<br />
• Aesthetic<br />
• Spiritual<br />
• Educational<br />
• Recreational<br />
Source: Based on MEA 2005.<br />
Oceans<br />
• Food<br />
• Fuel<br />
• Climate<br />
regulation<br />
• Disease<br />
regulation<br />
• Nutrient cycling<br />
• Primary<br />
production<br />
• Aesthetic<br />
• Spiritual<br />
• Educational<br />
• Recreational<br />
Cultivated/<br />
agricultural lands<br />
• Food<br />
• Fuel<br />
• Fibre<br />
• Climate<br />
regulation<br />
• Water<br />
purification<br />
• Nutrient cycling<br />
• Soil formation<br />
• Aesthetic<br />
• Educational<br />
in early childhood leads to permanent<br />
growth faltering, lowered immunity<br />
and increased mortality. A recent<br />
large study from Bangladesh reveals<br />
that dysentery and watery diarrhoea<br />
together can retard weight gain by<br />
20%-25% compared with periods of<br />
no infections.<br />
Source: Prüss-Üstün and Corvalán 2006;<br />
World Bank 2008; Alam et al. 2000.<br />
misleading for water. Prices are typically<br />
related to the capital outlays<br />
required to deliver water (that is, for<br />
the infrastructure and operations and<br />
maintenance charges), with little or<br />
no value attributed to the resource<br />
itself. Not only do undervalued water<br />
resources tend to be overused, but<br />
undervaluation also induces distorted<br />
prices that provide poor information<br />
about whether investments make<br />
sense. Focusing only on capital costs<br />
provides no insight into whether<br />
economic activities are creating value<br />
or whether the resource is running out<br />
and needs to be conserved.<br />
Water delivery is highly capital-intensive,<br />
so produced capital will remain a<br />
crucial focus for financial and economic<br />
analyses of water investments. But<br />
the value of water resources also matters,<br />
and water’s availability, quality<br />
and timing cannot simply be assumed.<br />
Source: Bergkamp and Sadoff 2008.<br />
The value of water goes well beyond its<br />
productive value (box 1.7). Citizens who<br />
realize this are calling for action to protect<br />
water, joined by business people who<br />
recognize the importance of protecting<br />
the sources of the water on which they<br />
depend. Many are even paying for such<br />
protection. 31<br />
Also to be considered is the impact of<br />
climate change on environmental sustainability.<br />
At the High-Level Event on the<br />
Millennium Development Goals at the<br />
United Nations in September 2008 discussion<br />
focused on the need for new adaptation<br />
strategies and for climate-resilient<br />
national development plans, especially for<br />
the least developed countries:<br />
Linkages between financing for<br />
development and international<br />
climate change financing were<br />
discussed. It was also agreed that<br />
all countries, including donor<br />
countries, the UN system and the<br />
Bretton Woods institutions, need to<br />
clarify the budgetary implications<br />
of adaptation; ensure that adequate<br />
finance mechanisms are in place;<br />
and help meet the additional costs<br />
that climate-resilient development<br />
will entail. 32<br />
Global crises and water<br />
While climate change will create important<br />
pressures on water, it is not currently<br />
the most important driver of these pressures<br />
outside the water sector. The most<br />
important drivers – forces and processes<br />
generated by human activities – are demographics<br />
and the increasing consumption<br />
that comes with rising per capita incomes<br />
(see chapter 2).<br />
In the early stages of development population<br />
growth is the most important driver.<br />
But most of the projected growth in<br />
demand comes not from high-populationgrowth<br />
countries but from countries with<br />
high rates of economic growth and large<br />
current populations. As incomes permit,<br />
people consume more. To start with, there<br />
will be a requirement for more water to<br />
produce food for tens of millions of people<br />
moving from one meal to two meals a day.<br />
Later, still more water will be needed for<br />
food production as people include more<br />
meat in their diets. Changes in lifestyles<br />
will require large amounts of water to<br />
produce and process non-food goods and<br />
services (virtual water), further increasing<br />
pressures on the quantity and quality<br />
of water resources. Other demographic<br />
14 World Water Development Report 3
PART<br />
getting out of the box – linking water to decisions for sustainable development<br />
drivers include rural-urban migration and<br />
migration in response to political conflict<br />
and environmental crises.<br />
Other external forces that may create<br />
either positive or negative pressures on<br />
water resources include pricing policies and<br />
subsidies for water and water-related goods,<br />
trade patterns, developments in science<br />
and technology, consumption patterns,<br />
evolution of policies and laws, social movements<br />
and global and national politics.<br />
Except for climate change, these forces<br />
will not create pressures directly (or only)<br />
on water management. The pressures will<br />
be felt first at the level of sector ministers,<br />
whose responses will translate into strategies<br />
that affect the water sector. These<br />
ministers will have to make decisions<br />
under conditions of risk and uncertainty.<br />
The better informed they are, the more<br />
likely they are to make the right decisions.<br />
For water managers this means being able<br />
to provide reliable information about<br />
where and when water is available, of what<br />
quality, where and how it is used, what<br />
happens to wastewater, how much water<br />
leaves the country in exports of goods<br />
that use water in their production (virtual<br />
water) and how much enters the country<br />
in imports. This will be a challenge for<br />
water managers in most countries, which<br />
lack the necessary measurements and do<br />
not systematically collect the necessary<br />
data. But when the information is available,<br />
it will be possible to calculate the<br />
country’s water balance and the water<br />
footprints (volume of water used) of various<br />
users. Using this information, water<br />
managers can advise decision-makers in<br />
other sectors of the feasibility of their<br />
plans and the implications for water.<br />
The Report provides ample evidence of<br />
all these facts. This is not the first time<br />
that professionals in the water sector have<br />
attempted to bring them to the world’s<br />
attention. But this time the effort may<br />
be more successful, because this time the<br />
world is facing other global crises – in<br />
energy, food and climate change and<br />
global warming – that cannot adequately<br />
be addressed without considering the role<br />
of water.<br />
Water for energy<br />
Demand for energy – for heat, light, power<br />
and transportation – is increasing rapidly<br />
(see chapter 7). The price of energy commodities<br />
has been rising as well. Volatile,<br />
the nominal price of oil – the benchmark<br />
commodity – rose from less than $25 a<br />
barrel eight years ago to about $100 early<br />
in 2008 and more than $140 in June 2008.<br />
Within two months it fell below levels<br />
projected for the longer term by the Energy<br />
Information Administration of the U.S. Department<br />
of Energy and was at $35 a barrel<br />
on December 19, 2008 (figure 1.8). Energy<br />
the world is facing<br />
global crises in<br />
energy, food, and<br />
climate change and<br />
global warming<br />
that cannot<br />
adequately be<br />
addressed without<br />
considering the<br />
role of water<br />
Figure 1.8<br />
Historical and projected energy demand and oil prices show steadily rising demand and<br />
rapidly rising prices<br />
Btus (quadrillions)<br />
Nominal dollars per barrel<br />
250<br />
Projections<br />
Liquids<br />
250<br />
Projections<br />
200<br />
Coal<br />
200<br />
High price<br />
150<br />
Natural gas<br />
150<br />
Reference<br />
100<br />
100<br />
Renewables<br />
Low price<br />
50<br />
50<br />
Nuclear<br />
0<br />
1980<br />
1990<br />
2000<br />
2005<br />
2010<br />
2020<br />
2030<br />
0<br />
1980<br />
1990<br />
2000<br />
2007<br />
2020<br />
2030<br />
Note: The reference case assumes average GDP growth of 2.4% a year, the high case assumes 3.0% a year, and the low case assumes 1.8% a year.<br />
Source: Based on EIA 2005, 2008a.<br />
Water in a changing world 15
PART<br />
Chapter 1<br />
The number of<br />
countries without<br />
enough water<br />
to produce their<br />
food is rising.<br />
The situation can<br />
be remedied by<br />
investing in water<br />
infrastructure,<br />
markets, credit,<br />
agricultural<br />
technology and<br />
extension services<br />
prices, particularly the oil prices that drive<br />
them, earlier reflected rising world demand<br />
and constraints. The recent financial<br />
crisis, which has slowed economic growth<br />
throughout the world, reducing anticipated<br />
demand, was largely responsible for the<br />
low price of oil at the end of 2008.<br />
The combination of high prices and a<br />
desire to substitute other sources of fuel<br />
led to the recent increase in the production<br />
of bioenergy, which has potentially<br />
important impacts on water quality and<br />
availability. Hydropower may be a renewable<br />
and non-polluting source of energy<br />
in some countries. Water for cooling is<br />
needed for all thermal sources of power,<br />
including nuclear. In the United States<br />
water withdrawn for cooling (39%)<br />
equals agriculture’s share of water use. At<br />
the same time energy is required to lift<br />
groundwater, pump it through pipes and<br />
treat both groundwater and wastewater.<br />
An estimated 7% of all energy produced<br />
is used for such purposes. 33 Increased<br />
demand for water through desalination<br />
may increase energy demand in some<br />
countries, although marginally on a global<br />
scale.<br />
Water for food<br />
Agriculture is by far the largest consumer<br />
of freshwater – about 70% of all freshwater<br />
withdrawals go to irrigated agriculture (see<br />
chapter 7). The recent steep rise in food<br />
prices (figure 1.9) has severely hurt many<br />
food-importing countries. Rising demand<br />
for food caused by growing populations<br />
and shifting diets, production shortfall in<br />
some countries, increased costs for key agricultural<br />
inputs such as fertilizers (driven<br />
in turn by energy costs), bio energy-related<br />
incentives in some countries and possible<br />
financial speculation have all contributed<br />
to the problem. The High-Level Conference<br />
on World Food Security: The Challenges of<br />
Climate Change and Bioenergy, a Food and<br />
Agriculture Organization summit in Rome<br />
on 3 June 2008, adopted a declaration acknowledging<br />
‘an urgent need to help developing<br />
countries and countries in transition<br />
expand agriculture and food production,<br />
and to increase investment in agriculture,<br />
agribusiness and rural development, from<br />
both public and private sources’. 34 It calls<br />
on donors to provide balance of payments<br />
and budget support to low-income foodimporting<br />
countries.<br />
At the summit Robert B. Zoellick, president<br />
of the World Bank, said that the Bank<br />
recognizes that the energy-food nexus<br />
means that food prices will stay high and<br />
that the ‘task is two-fold, to handle today’s<br />
danger to those for whom securing food<br />
has become a daily struggle, and turn<br />
higher food prices into an opportunity<br />
for developing world agriculture, and<br />
Figure 1.9<br />
Wheat and rice prices have risen sharply in recent years<br />
Historical and projected prices of wheat and rice, 1970-2017<br />
Wheat<br />
Rice<br />
US$ per tonne<br />
US$ per tonne<br />
800<br />
Projections<br />
1,500<br />
Real price<br />
Projections<br />
600<br />
Real price<br />
1,250<br />
1,000<br />
400<br />
750<br />
200<br />
500<br />
250<br />
Nominal price<br />
Nominal price<br />
0<br />
1970<br />
1980<br />
1990<br />
2000<br />
2010<br />
2017<br />
0<br />
1970<br />
1980<br />
1990<br />
2000<br />
2010<br />
2017<br />
Source: Based on OECD and FAO 2008.<br />
16 World Water Development Report 3
PART<br />
getting out of the box – linking water to decisions for sustainable development<br />
for farmers in developing countries’. 35<br />
The summit highlighted the strong links<br />
among food security, economic development,<br />
climate change, markets, development<br />
assistance and energy and how<br />
actions have implications for other sectors.<br />
While the role of water in agriculture was<br />
discussed at the summit, the final declaration<br />
did not mention water and water’s<br />
strong links with these and many other<br />
issues.<br />
Water scarcity may limit food production<br />
and supply, putting pressure on food prices<br />
and increasing countries’ dependence on<br />
food imports. The number of countries and<br />
regions without enough water to produce<br />
their food is rising as populations increase.<br />
The situation can be remedied in many<br />
developing countries by investing in water<br />
infrastructure, markets, credit, agricultural<br />
technology and extension services.<br />
Underinvestment in water<br />
The energy and food crises are taking<br />
place during a time of global financial crisis.<br />
A credit crunch has followed the financial<br />
crises that began in the United States<br />
and Europe in 2007 and spread around the<br />
globe. The credit crunch has resulted in a<br />
slowdown in economic growth around the<br />
world. The International Monetary Fund<br />
forecast in January 2009 that all industrial<br />
countries would face a period of recession<br />
and that some developing countries<br />
are more at risk than others (box 1.8). 36<br />
According to the Commission on Growth<br />
and Development ‘developing countries<br />
are most vulnerable to sudden stoppages<br />
of credit and sudden switches of international<br />
custom or supply.’ 37<br />
Developing countries most at risk include<br />
those exporting directly to crisis-affected<br />
countries, those whose exports are experiencing<br />
falling world prices and those<br />
whose exports have high income elasticity<br />
(luxury goods, including tourism). Declining<br />
tourism revenues and employment<br />
will directly affect the poor. Countries<br />
dependent on foreign direct investment,<br />
remittances and development funds to<br />
finance the current account deficit will<br />
also be at risk. Oil-importing countries<br />
have already been hard hit by the period<br />
of high oil prices.<br />
The high rates of global savings and strong<br />
productivity growth in the three decades<br />
before the financial crisis – when the stock<br />
of financial assets grew three times faster<br />
than GDP – were not accompanied by<br />
investments in physical assets, and their<br />
levels are below those in the last decade.<br />
While other factors may also have contributed<br />
to these lower levels of investment,<br />
economic uncertainty is a major factor.<br />
Uncertainty about the policy environment<br />
in developing and emerging market<br />
economies has always been a concern, but<br />
its influence has strengthened in the currently<br />
highly competitive global markets. 38<br />
The impact on developing countries will<br />
vary. Budgetary spending on infrastructure<br />
is often cut during periods of financial<br />
tightening, although for governments<br />
that can afford it, investing in infrastructure<br />
can help counter an economic slowdown.<br />
Private investment may also suffer,<br />
but since the private sector’s contribution<br />
to the water sector has been relatively<br />
small, the sector is less exposed to any<br />
financial tightening. Countries dependent<br />
on aid face uncertain times. Bilateral<br />
donors, important in funding water<br />
investments, may be tempted to reduce<br />
their aid budgets. Multilateral aid could be<br />
an important source of financing for the<br />
next few years, especially following recent<br />
record multiyear replenishments of the<br />
International Development Association,<br />
African Development Fund and European<br />
Development Fund. Yet both bilateral and<br />
multilateral aid donors still appear not to<br />
recognize the contribution of the water<br />
sector to growth, as indicated by the sector’s<br />
small share of total official development<br />
assistance in recent years (less than<br />
4%; see table 4.4 in chapter 4).<br />
Inadequate information on water<br />
and water crises<br />
Managing water is made more difficult by<br />
the lack of knowledge and information required<br />
for decision-making and long-term<br />
planning. Few countries know how much<br />
water is being used and for what purposes,<br />
the quantity and quality of water that is<br />
available and that can be withdrawn without<br />
serious environmental consequences<br />
Box 1.8<br />
World growth is projected to fall to<br />
0.5 % in 2009, its lowest rate since<br />
World War II. Despite wide-ranging<br />
policy actions, financial strains remain<br />
acute, pulling down the real economy.<br />
A sustained economic recovery will<br />
not be possible until the financial<br />
sector’s functionality is restored and<br />
credit markets are unclogged.<br />
Financial markets are expected to remain<br />
strained during 2009. In the advanced<br />
economies, market conditions<br />
Few countries<br />
know how much<br />
water is being<br />
used and for<br />
what purposes,<br />
the quantity and<br />
quality of water<br />
that is available<br />
and that can<br />
be withdrawn<br />
without serious<br />
environmental<br />
consequences and<br />
how much is being<br />
invested in water<br />
management and<br />
infrastructure<br />
International Monetary Fund updated<br />
economic forecast for 2009<br />
will likely continue to be difficult until<br />
forceful policy actions are implemented<br />
to restructure the financial<br />
sector, resolve the uncertainty about<br />
losses, and break the adverse feedback<br />
loop with the slowing real economy.<br />
In emerging economies, financing<br />
conditions will likely remain acute for<br />
some time – especially for corporate<br />
sectors that have very high rollover<br />
requirements.<br />
Source : IMF 2009, pp. 1-2.<br />
Water in a changing world 17
PART<br />
Chapter 1<br />
Scarcity – low<br />
available water per<br />
capita – is forecast<br />
to worsen where<br />
population growth<br />
is still high, as in<br />
sub-Saharan Africa,<br />
South Asia and<br />
some countries in<br />
South America and<br />
the Middle East<br />
Box 1.9<br />
and how much is being invested in water<br />
management and infrastructure (see chapter<br />
13).<br />
Underfunding of observation, monitoring<br />
and information systems leads to weaknesses<br />
in infrastructure, research and<br />
development, and training and to reduced<br />
efficiencies. Less is known with each passing<br />
decade, despite the availability of new<br />
remote sensing and geographic information<br />
system technologies that can simplify<br />
monitoring and reporting and despite the<br />
growing need for such information in an<br />
increasingly complex and rapidly changing<br />
world. Such information is vital not only at<br />
a national scale but also at a global scale –<br />
to inform the construction of global models<br />
of the hydrologic cycle and decisions<br />
on where interventions, including external<br />
aid, would be most useful. One move in<br />
that direction is the United Nations Economic<br />
Commission for Europe Convention<br />
on the Protection and Use of Transboundary<br />
Watercourses and International Lakes,<br />
which requires signatories to exchange<br />
data on water quality and quantity and<br />
pollution sources and the environmental<br />
conditions of transboundary waters.<br />
Climate change and water<br />
Some parts of the world have no shortage<br />
of water. Others, such as North and<br />
Southern Africa, the Middle East and parts<br />
of South Asia, South-East Asia and South<br />
America, suffer scarcity because of low<br />
annual rainfall. Others suffer seasonal<br />
scarcity. Yet others suffer from extreme<br />
rainfall, causing floods. Some suffer from<br />
both low and extreme rainfall, at different<br />
times. In some large countries, such as<br />
Extracts from Declaration of Leaders Meeting<br />
of Major Economies on Energy Security and<br />
Climate Change at the G-8 Hokkaido, Toyako,<br />
summit, 9 July 2008<br />
Climate change is one of the great<br />
global challenges of our time. Conscious<br />
of our leadership role in meeting<br />
such challenges, we, the leaders<br />
of the world’s major economies, both<br />
developed and developing, commit to<br />
combat climate change in accordance<br />
with our common but differentiated<br />
responsibilities and respective capabilities<br />
and confront the interlinked<br />
challenges of sustainable development,<br />
including energy and food<br />
security, and human health.<br />
We will work together in accordance<br />
with our Convention commitments to<br />
strengthen the ability of developing<br />
countries, particularly the most vulnerable<br />
ones, to adapt to climate change.<br />
This includes the development and<br />
dissemination of tools and methodologies<br />
to improve vulnerability and adaptation<br />
assessments, the integration of<br />
climate change adaptation into overall<br />
development strategies, increased implementation<br />
of adaptation strategies,<br />
increased emphasis on adaptation<br />
technologies, strengthening resilience<br />
and reducing vulnerability, and<br />
consideration of means to stimulate<br />
investment and increased availability<br />
of financial and technical assistance.<br />
Source: G-8 2008.<br />
Mozambique and the United States, parts<br />
of the country may experience damaging<br />
intensive rainfalls while other parts suffer<br />
prolonged drought. These variations matter<br />
most where they affect large populations.<br />
Scarcity – low available water per capita<br />
– is forecast to worsen where population<br />
growth is still high, as in sub- Saharan<br />
Africa, South Asia and some countries in<br />
South America and the Middle East.<br />
Adapting to climate change adds a critical<br />
challenge to this picture for all countries,<br />
particularly for developing countries,<br />
whose capacity to adapt is low, and for<br />
cities in coastal areas (see chapter 5). Even<br />
if greenhouse gas concentrations stabilize<br />
in the coming years, some impacts from<br />
climate change are unavoidable. These include<br />
growing water stress, more extreme<br />
weather events, higher levels of migration<br />
and the disruption of international markets.<br />
Climate models show that extremes<br />
of rainfall are likely to worsen, resulting<br />
in more floods and droughts in regions<br />
already affected – often regions with<br />
low income levels per capita, widespread<br />
absolute poverty, high population growth<br />
and rapid urbanization. If climate change<br />
brings significant shifts in the availability<br />
of water resources, patterns of human<br />
migration could be affected.<br />
These challenges cannot be separated from<br />
the challenges of sustainable development.<br />
For some developing countries the<br />
incremental costs of adapting to climate<br />
change will soon approach the current<br />
value of aid inflows. The leaders of the<br />
G-8, meeting in Hokkaido, Japan, in July<br />
2008, committed to accelerating action<br />
on technology development, transfer,<br />
financing and capacity building to support<br />
adaptation (box 1.9). Such action must<br />
include water resources, which will be<br />
most affected by climate change. A recent<br />
United Nations Framework Convention on<br />
Climate Change document on adaptation<br />
noted that:<br />
sector-specific adaptation planning<br />
and practices were discussed in the<br />
areas of agriculture and food security,<br />
water resources, coastal zones<br />
and health. Those sectors were<br />
selected based on their importance<br />
to Parties and organizations as<br />
highlighted in their submissions. 39<br />
The world is right to be concerned about<br />
climate change, which poses major threats<br />
to humans and ecosystems. The 2007<br />
United Nations Climate Change Conference<br />
in Bali, Indonesia, acknowledged that<br />
18 World Water Development Report 3
PART<br />
getting out of the box – linking water to decisions for sustainable development<br />
even the minimum predicted shifts in<br />
climate for the 21st century, at more than<br />
twice the 0.6° Celsius increase that has<br />
occurred since 1900, would be significant<br />
and disruptive. The intergovernmental<br />
response has focused primarily on mitigation<br />
of climate change, embracing wideranging<br />
measures, including reducing<br />
greenhouse gas emissions, transferring<br />
clean technologies and protecting forests.<br />
These measures may slow climate change.<br />
They will not halt or reverse it.<br />
It will be two generations before these<br />
measures begin to have an effect. And<br />
even if successful, they imply a considerably<br />
changed future climate. (They are<br />
not aimed at reversing changes already<br />
under way.) In the meantime people must<br />
be protected from the consequences of<br />
global climate change through adaptation<br />
measures. Adaptation, as embodied in the<br />
Nairobi Work Programme of the United<br />
Nations Framework Convention on Climate<br />
Change, is based on gaining a better<br />
understanding of the impacts of climate<br />
change and making informed decisions on<br />
practical measures. 40<br />
The water situation and the vulnerability<br />
of poor communities present a strong case<br />
for action on climate change. Projections<br />
warn of changes in water availability and<br />
quality that could have disastrous consequences.<br />
Water is the principal medium<br />
through which climate change will affect<br />
economic, social and environmental conditions.<br />
Changes in water availability will<br />
have economy-wide impacts.<br />
Yet while the world appears motivated to<br />
respond to the impacts of future climate<br />
change, it remains unmotivated to act on<br />
the water crises that are with us today.<br />
Even without climate change, development<br />
is threatened in many regions by factors<br />
that we have already failed to address time<br />
and again. The Intergovernmental Panel<br />
on Climate Change’s April 2008 report on<br />
water points this out clearly (box 1.10).<br />
Security and water<br />
Climate change, especially its implications<br />
for scarce water resources, is a matter of<br />
collective security in a fragile and increasingly<br />
interdependent world. At a 2007 UN<br />
Security Council debate on the impact of<br />
climate change on peace and security UN<br />
Secretary-General Ban Ki-moon noted that<br />
climate change has implications for peace<br />
and security, as well as serious environmental,<br />
social and economic implications,<br />
especially ‘in vulnerable regions that face<br />
multiple stresses at the same time – preexisting<br />
conflict, poverty and unequal<br />
access to resources, weak institutions, food<br />
insecurity and incidence of diseases such<br />
as HIV/AIDS.’ 41 He outlined ‘alarming,<br />
though not alarmist’ scenarios, including<br />
limited or threatened access to energy<br />
increasing the risk of conflict, a scarcity<br />
of food and water transforming peaceful<br />
competition into violence, and floods and<br />
droughts sparking massive human migrations,<br />
polarizing societies and weakening<br />
the ability of countries to resolve conflicts<br />
peacefully.<br />
In Africa alone by 2020, 75-250 million<br />
people may be exposed to increased water<br />
stress due to climate change. If coupled<br />
with increased demand, this will hurt livelihoods<br />
and exacerbate water-related problems.<br />
42 Research centres such as the Oxford<br />
Research Group 43 are underpinning<br />
the security concerns of the United Nations,<br />
the European Union 44 and national<br />
governments 45 about climate change and<br />
its impacts on water. The forces at work are<br />
global in scale, the aggregate result of the<br />
behaviour of all countries. Dealing with<br />
them will require international cooperation<br />
and coordination. Yet at the same<br />
time national leaders must continue to act<br />
and make decisions at a national level.<br />
As climate change and adverse water impacts<br />
increase in politically charged areas,<br />
conflicts will likely intensify, requiring<br />
new and rapid adaptive security strategies.<br />
Hydrologic shocks that may occur<br />
through climate change increase the risk<br />
of major national and international security<br />
threats, especially in unstable areas<br />
(box 1.11). Adverse changes in internal,<br />
interjurisdictional and transboundary waters<br />
can put food, social, health, economic,<br />
political and military security at risk.<br />
Some fragile states (map 1.1) have experienced<br />
widespread conflict that has<br />
resulted in the destruction of economic<br />
Box 1.10<br />
Current water management practices<br />
may not be robust enough to cope<br />
with the impacts of climate change<br />
on water supply reliability, flood<br />
risk, health, agriculture, energy and<br />
aquatic ecosystems. In many locations,<br />
water management cannot<br />
satisfactorily cope even with current<br />
climate variability, so that large flood<br />
and drought damages occur. As a<br />
first step, improved incorporation of<br />
while the world<br />
appears motivated<br />
to respond to<br />
the impacts of<br />
future climate<br />
change, it remains<br />
unmotivated to act<br />
on water crises that<br />
are with us today<br />
Intergovernmental Panel on Climate Change<br />
Technical Report on Water and Climate Change<br />
information about current climate<br />
variability into water-related management<br />
would assist adaptation to<br />
longer-term climate change impacts.<br />
Climatic and non-climatic factors,<br />
such as growth of population and<br />
damage potential, would exacerbate<br />
problems in the future. (very high<br />
confidence)<br />
Source: IPCC 2008.<br />
Water in a changing world 19
PART<br />
Chapter 1<br />
Box 1.11<br />
‘The challenge of securing safe and<br />
plentiful water for all is one of the<br />
most daunting challenges faced by<br />
the world today.<br />
UN Secretary General Ban Ki-moon warns<br />
that water shortages are increasingly driving<br />
conflicts<br />
‘Until only recently, we generally assumed<br />
that water trends do not pose<br />
much risk to our businesses. While<br />
many countries have engaged in<br />
waste-water treatment and some conservation<br />
efforts, the notion of water<br />
sustainability in a broad sense has not<br />
been seriously examined.<br />
‘Our experiences tell us that environmental<br />
stress due to lack of water may<br />
lead to conflict and would be greater<br />
in poor nations.<br />
‘Ten years ago – even five years ago –<br />
few people paid much attention to the<br />
arid regions of western Sudan. Not<br />
many noticed when fighting broke out<br />
between farmers and herders, after<br />
the rains failed and water became<br />
scarce.<br />
‘Today everyone knows Darfur. More<br />
than 200,000 people have died. Several<br />
million have fled their homes.<br />
‘There are many factors at work in<br />
this conflict, of course. But almost<br />
forgotten is the event that touched it<br />
off – drought. A shortage of life’s vital<br />
resource.<br />
‘We can change the names in this sad<br />
story. Somalia. Chad. Israel. The occupied<br />
Palestinian territories. Nigeria. Sri<br />
Lanka. Haiti. Colombia. Kazakhstan.<br />
All are places where shortages of water<br />
contribute to poverty. They cause<br />
social hardship and impede development.<br />
They create tensions in conflictprone<br />
regions. Too often, where we<br />
need water we find guns. . . .’<br />
Source: Ban Ki-moon 2008.<br />
infrastructure. The vulnerability of affected<br />
populations is worsened by the state’s<br />
loss of control over the forces of law and<br />
order and ultimately by its loss of political<br />
legitimacy. Installing infrastructure and<br />
renewing institutional capacity following<br />
conflict have the potential to set postconflict<br />
nations on a path to recovery. For<br />
example, rehabilitation of damaged irrigation<br />
infrastructure and expansion of water<br />
supply and sanitation formed a significant<br />
part of the 2006 Somali Rehabilitation and<br />
Reconstruction Plan. 46 Similarly, rehabilitation<br />
of infrastructure after major natural<br />
disasters provides an opportunity to address<br />
long-standing infrastructure deficits.<br />
The need for action – now<br />
Water has remained too low on the list of<br />
political priorities for too long, a situation<br />
that cannot be allowed to continue. Action<br />
is required now. Lives and livelihoods depend<br />
on water for development. Changes<br />
in human behaviour and activity are accelerating,<br />
affecting demand for water and<br />
its supply. Because investments have been<br />
neglected, development is lagging, people<br />
are suffering and the environment is deteriorating.<br />
The resources needed to address<br />
the problems of water management are<br />
minuscule compared with the financial<br />
resources that have been pledged and secured<br />
to deal with carbon emissions or the<br />
current financial crisis. After decades of<br />
inaction, the problems are enormous. And<br />
they will worsen if left unattended.<br />
Although substantial, the challenges are<br />
not insurmountable. In part 4 the Report<br />
shows how some countries and regional<br />
and local governments have solved similar<br />
challenges. The decisions on development<br />
objectives and the allocation of human<br />
and financial resources needed to meet<br />
Map 1.1<br />
Fragile states as defined by the International Development Association<br />
Territory of<br />
Kosovo<br />
Uzbekistan<br />
Afghanistan<br />
Haiti<br />
Lao People's Democratic Republic<br />
Mauritania<br />
Chad Eritrea<br />
Myanmar<br />
Gambia<br />
Sudan<br />
Djibouti<br />
Guinea-Bissau<br />
Cambodia<br />
Nigeria<br />
Central African<br />
Guinea<br />
Papua New Guinea<br />
Sierra Togo<br />
Republic<br />
Burundi<br />
Leone São Tomé<br />
Democratic Republic of the Congo<br />
Solomon Islands<br />
Liberia and Príncipe<br />
Côte<br />
Angola<br />
Comoros<br />
Timor-Leste<br />
Vanuatu<br />
d’Ivoire<br />
Republic of<br />
Zimbabwe<br />
Tonga<br />
the Congo<br />
Note: Fragile states are low-income countries that score below a threshold on the International Development Association’s Country Policy and Institutional<br />
Assessment, a tool used to assess the quality of country policies. The list is prepared annually.<br />
Source: Based on IDA 2007.<br />
20 World Water Development Report 3
PART<br />
getting out of the box – linking water to decisions for sustainable development<br />
them are made or influenced by leaders<br />
in government, the private sector and<br />
civil society. They are the ones who must<br />
recognize the role of water in attaining<br />
their objectives – and demonstrate the will<br />
to act now.<br />
Structure of the Report<br />
The Report has four parts. Part 1 examines<br />
water drivers – or what drives the<br />
pressures on water. Externalities, mostly<br />
human-induced, create pressures on water.<br />
Human activities and processes of all types<br />
– demographic, economic and social – can<br />
exert pressures on water resources that<br />
need to be managed. These pressures are<br />
affected by a range of factors such as technological<br />
innovation, climate change, and<br />
policies, laws and financial conditions<br />
Part 2 is about using water. History shows<br />
strong, mutual links between economic<br />
development and water development.<br />
Steadily increasing demand for agricultural<br />
products to satisfy the diverse needs<br />
of a growing population (for food, fibre<br />
and now fuel) has long been the main<br />
driver behind agricultural water use. In a<br />
situation of tight balance between food<br />
supply and demand, climate events –<br />
droughts in particular – have an increasingly<br />
strong impact on food price volatility.<br />
There is a growing need to protect<br />
ecosystems and the goods and services<br />
they produce and on which life and livelihoods<br />
depend. As competition among<br />
demands on water increases, society will<br />
need to respond more effectively through<br />
improved water management, policies<br />
and transparent and efficient water allocation<br />
mechanisms.<br />
Part 3 explores the state of water resources.<br />
The uneven distribution over time and<br />
space of water resources, and how that<br />
distribution is being modified, are fundamental<br />
sources of the water crisis. Global<br />
warming is expected to result in an intensification,<br />
acceleration or enhancement of<br />
the global hydrologic cycle. There is some<br />
observational evidence that this is already<br />
happening. In many places climate extremes<br />
have become more frequent or more<br />
intense, with droughts and floods affecting<br />
increasing numbers of people. Worldwide,<br />
water observation networks are inadequate<br />
for current needs and are at risk of further<br />
decline. The data to understand and predict<br />
water quantity and quality are lacking.<br />
Part 4 is on responses and choices. It<br />
shows that we can do what it takes to manage<br />
water resources properly to avert crises<br />
and promote sustainable socio economic<br />
development. Others have already shown<br />
the way. But there is no one-size-fits-all<br />
solution. The best mix of responses to a<br />
specific country’s development objectives<br />
and policy priorities to meet various water<br />
challenges depends on the availability of<br />
water of acceptable quality for its intended<br />
use and the country’s technical, financial,<br />
institutional and human capacities and its<br />
culture, political and regulatory frameworks<br />
and markets.<br />
Leaders within the water domain can<br />
inform the processes outside their domain<br />
and manage water resources to achieve<br />
agreed socioeconomic objectives. But it<br />
is the leaders in government, the private<br />
sector and civil society who determine<br />
the directions that development will take.<br />
Recognizing this, they must act now!<br />
The decisions<br />
on development<br />
objectives and<br />
the allocation<br />
of human and<br />
financial resources<br />
needed to meet<br />
them are made<br />
or influenced<br />
by leaders in<br />
government, the<br />
private sector and<br />
civil society – not<br />
by water managers<br />
or specialists<br />
Notes<br />
1. There were exceptions, such as the development<br />
of the Tennessee River in the<br />
United States beginning in the 1930s<br />
under the Tennessee Valley Authority.<br />
2. Commission on Growth and Development<br />
2008.<br />
3. Phumpiu and Gustafsson 2007.<br />
4. See www.pap.org.mz.<br />
5. Speaking at the session Re-Thinking Social<br />
Responsibility on 25 January 2008,<br />
as cited in Maidmont 2008.<br />
6. Commission on Growth and Development<br />
2008, p. 1.<br />
7. ADB 2007, p. vi.<br />
8. The benefits of investing in water are<br />
presented in greater detail in chapter 6.<br />
9. SIWI 2005.<br />
10. Hutton and Haller 2004.<br />
11. Schuster-Wallace et al. 2008.<br />
12. UN-Water 2008.<br />
13. WHO 2006.<br />
14. Hussein 2008.<br />
15. Winpenny 2003.<br />
16. van Hofwegen 2006.<br />
17. DfID 2007, p. 2.<br />
18. World Bank 2003.<br />
19. NEPAD 2002.<br />
20. Originally defined as $1.00 per day<br />
and revised to $1.25 in 2005 to reflect<br />
evolving purchasing power parity<br />
21. Chen and Ravallion 2008.<br />
22. UNDP 2006, p. 6.<br />
23. World Bank 2005.<br />
24. Kaberuka 2008.<br />
25. MDG Africa Steering Group 2008.<br />
26. WELL 2005.<br />
27. Poverty-Environment Partnership 2006.<br />
28. G-8 2003.<br />
29. UN-Water 2007.<br />
30. World Bank 2008.<br />
31. Worldwatch Institute 2008, pp. 117-21.<br />
32. United Nations 2008.<br />
33. Hoffman 2004.<br />
34. FAO 2008.<br />
35. Zoellnick 2008.<br />
36. IMF 2009.<br />
37. Commission on Growth and Development<br />
2008, p. 103.<br />
38. Rajan 2006.<br />
Water in a changing world 21
PART<br />
Chapter 1<br />
39. UNFCCC 2007.<br />
40. UNFCCC 2005.<br />
41. UN Security Council 2007.<br />
42. IPCC 2008.<br />
43. The Oxford Research Group, in a<br />
briefing paper on sustainable security,<br />
argues that the effects of climate<br />
change – displacement of peoples, food<br />
shortages, social unrest – have longterm<br />
security implications far greater<br />
than those of terrorism and notes that<br />
the U.S. Department of Defense’s Office<br />
of Net Assessment takes the same view<br />
(Abott, Rogers, and Sloboda 2006,<br />
p. 7).<br />
44. Such as the statement by the European<br />
Commission and the Secretary General/<br />
High Representative for Foreign and Security<br />
Policy Javier Solana (2006, p. 2):<br />
‘Investment in mitigation . . . as well<br />
as ways to adjust to the unavoidable<br />
should go hand in hand with addressing<br />
the international security threats created<br />
by climate change.’<br />
45. Such as U.K. Foreign Secretary Margaret<br />
Beckett’s statement in the 2007 UN<br />
Security Council debate on the impact<br />
of climate change on peace and security<br />
that climate change exacerbates<br />
many threats (UN Security Council<br />
2007) and the testimony of Deputy<br />
Director of National Intelligence for<br />
Analysis (NIA) Thomas Finger before<br />
a Joint House committee that an NIA<br />
assessment found that sub-Saharan<br />
Africa, the Middle East and Central and<br />
South-East Asia are most vulnerable to<br />
warming-related drought, flooding,<br />
extreme weather and hunger (House<br />
Permanent Select Committee on Intelligence<br />
and U.S. House Select Committee<br />
on Energy Independence and<br />
Global Warming 2008, p.13).<br />
46. UNDP and World Bank 2007.<br />
References<br />
Abott, Chris, Paul Rogers, and John Sloboda.<br />
2006. Global Responses to Global<br />
Threats Sustainable Security for the 21st<br />
Century. Oxford, UK: Oxford Research<br />
Group.<br />
ADB (Asian Development Bank). 2007.<br />
Asian Water Development Outlook 2007:<br />
Achieving Water Security for Asia. Manila:<br />
Asian Development Bank.<br />
African Union. 2008. Sharm El-Sheikh<br />
Commitments for Accelerating the<br />
Achievement of Water and Sanitation<br />
Goals in Africa. Declaration I. Assembly<br />
of the African Union, Eleventh Ordinary<br />
Session, 30 June-1 July, Sharm<br />
el-Sheikh, Egypt. www.africa-union.<br />
org/root/au/Conferences/2008/<br />
june/summit/dec/ASSEMBLY%20<br />
DECISIONS%20193%20-%20207%20<br />
(XI).pdf.<br />
Alam, Dewan S., Geoffrey C. Marks, Abdullah<br />
H. Baqui, M. Yunus, and George<br />
J. Fuchs. 2000. Association between<br />
Clinical Type of Diarrhoea and Growth of<br />
Children under 5 Years in Rural Bangladesh.<br />
International Journal of Epidemiology<br />
29 (5): 916-21.<br />
Ban Ki-moon. 2008. Address by the UN<br />
Secretary-General to the session “Time<br />
is Running Out on Water,” of the Davos<br />
World Economic Forum, 24 January<br />
2008, in Davos, Switzerland. www.<br />
un.org/apps/news/infocus/sgspeeches/<br />
search_full.asp?statID=177.<br />
Bergkamp, G., and C. W. Sadoff. 2008.<br />
Water in a Sustainable Economy. In State<br />
of the World: Innovations for a Sustainable<br />
Economy. Washington, DC: Worldwatch<br />
Institute.<br />
Chen, Shaohua, and Martin Ravallion.<br />
2008. The Developing World Is Poorer than<br />
We Thought, but No Less Successful in<br />
the Fight against Poverty. Policy Research<br />
Working Paper 4703. World Bank, Washington,<br />
DC.<br />
Commission on Growth and Development.<br />
2008. The Growth Report: Strategies<br />
for Sustained Growth and Inclusive<br />
Development. Conference Edition. Washington,<br />
DC: World Bank.<br />
Comprehensive Assessment of Water Management<br />
in Agriculture. 2007. Water<br />
for Food, Water for Life: A Comprehensive<br />
Assessment of Water Management in Agriculture.<br />
London: Earthscan, and Colombo:<br />
International Water Management Institute.<br />
Cosgrove, W. J. 2006. Water for Growth<br />
and Security. In Water Crisis: Myth or Reality?:<br />
Marcelino Botin Water Forum 2004.<br />
Peter Rogers, M. Ramon Llamas, and<br />
Louis Martinez-Cortina, eds. London:<br />
Taylor and Francis.<br />
Delli Priscoli, J., and A. T. Wolf. 2009. Managing<br />
and Transforming Water Conflicts.<br />
International Hydrology Series. Cambridge,<br />
UK: Cambridge University Press.<br />
DfID (Department for International<br />
Development). 2007. Growth and Infrastructure<br />
Policy Paper. Department for<br />
International Development, London.<br />
EIA (Energy Information Administration).<br />
2005. International Energy Annual 2005.<br />
Washington, DC: U.S. Department of<br />
Energy. www.eia.doe.gov/iea.<br />
———. 2008a. Annual Energy Outlook 2008<br />
(DOE/EIA 0383/2008). Washington, DC:<br />
U.S. Department of Energy.<br />
———. 2008b. World Energy Projections Plus.<br />
Washington, DC: U.S. Department of<br />
Energy.<br />
European Commission and the Secretary-<br />
General/High Representative for<br />
Foreign and Security Policy. 2006.<br />
Report on Climate Change and International<br />
Security to the European Council,<br />
3 March 2006. Council of the European<br />
Union, Brussels. www.envirosecurity.org/<br />
activities/diplomacy/gfsp/documents/<br />
Solana_security_report.pdf.<br />
FAO (Food and Agriculture Organization<br />
of the United Nations). 2006. Rapid<br />
Growth of Selected Asian Economies: Lessons<br />
and Implications for Agriculture and<br />
Food Security. Synthesis Report. Bangkok:<br />
Food and Agriculture Organization of the<br />
United Nations.<br />
———. 2008. Declaration of the High-Level<br />
Conference on World Food Security:<br />
The Challenges of Climate Change and<br />
Bioenergy. High-Level Conference on<br />
World Food Security, 3-5 June, Rome.<br />
www.un.org/issues/food/taskforce/<br />
declaration-E.pdf.<br />
G-8. 2003. Water: A G8 Action Plan. G8<br />
Summit, 1-3 June, Evian, France.<br />
———. 2008. Declaration of Leaders<br />
Meeting of Major Economies on<br />
Energy Security and Climate Change.<br />
Hokkaido Toyako Summit, 9 July, Toyako,<br />
Hokkaido, Japan. www.mofa.go.jp/<br />
policy/economy/summit/2008/doc/<br />
doc080709_10_en.html.<br />
Hoffman, Allan R. 2004. The Connection:<br />
Water and Energy Security. Energy<br />
Security, 13 August. Institute for Analysis<br />
of Global Security. www.iags.org/<br />
n0813043.htm.<br />
House Permanent Select Committee<br />
on Intelligence and House Select<br />
Committee on Energy Independence<br />
and Global Warming. 2008. National<br />
Intelligence Assessment on the National<br />
Security Implications of Global Climate<br />
Change to 2030: Statement for the<br />
Record of Dr. Thomas Fingar, Deputy<br />
Director of National Intelligence for<br />
Analysis and Chairman of the National<br />
Intelligence Council, 25 June 2008. U.S.<br />
Congress, Washington, DC.<br />
Hussein, M. A. 2008. Costs of Environmental<br />
Degradation: An Analysis in the<br />
Middle East and North Africa Region.<br />
Management of Environmental Quality 19<br />
(3): 305-17.<br />
Hutton, Guy, and Laurence Haller. 2004.<br />
Evaluation of the Costs and Benefits of<br />
Water and Sanitation Improvements at<br />
the Global Level. Geneva: World Health<br />
Organization.<br />
Hutton, Guy, Laurence Haller, and Jamie<br />
Bartram. 2007. Economic and Health<br />
Effects of Increasing Coverage of Low<br />
Cost Household Drinking-water Supply<br />
and Sanitation Interventions to Countries<br />
Off-track to Meet MDG Target 10. Background<br />
paper for Human Development<br />
Report 2006, World Health Organization,<br />
Public Health and the Environment,<br />
Geneva.<br />
IDA (International Development Association).<br />
2007. List of Fragile States. The<br />
International Development Association of<br />
the World Bank, Washington, DC. http://<br />
web.worldbank.org/.<br />
22 World Water Development Report 3
PART<br />
getting out of the box – linking water to decisions for sustainable development<br />
IMF (International Monetary Fund). 2009.<br />
World Economic Outlook Update. January.<br />
Washington, DC: International Monetary<br />
Fund. www.imf.org/external/pubs/ft/<br />
weo/2009/update/01/index.htm.<br />
IPCC (Intergovernmental Panel on Climate<br />
Change). 2008. Technical Paper<br />
on Climate Change and Water. IPCC-<br />
XXVIII/Doc. 13, Intergovernmental Panel<br />
on Climate Change, Geneva. www.ipcc.<br />
ch/meetings/session28/doc13.pdf.<br />
Kaberuka, Donald. 2008. Opening Statement.<br />
African Development Group First<br />
African Water Week: Accelerating Water<br />
Security for Socio-Economic Development<br />
of Africa, 26-28 March, Tunis.<br />
Maidmont, Paul. 2008. Re-thinking<br />
Social Responsibility. Forbes 25<br />
(January). www.forbes.com/leadership/citizenship/2008/01/25/<br />
davos-corporate-responsibility-lead<br />
-cx_pm_0125notes.html.<br />
Manning, Nick. 1999. Strategic Decisionmaking<br />
in Cabinet Government: Institutional<br />
Underpinnings and Obstacles.<br />
Washington, DC: World Bank.<br />
MDG Africa Steering Group. 2008. Achieving<br />
the Millennium Development Goals<br />
in Africa: Recommendations of the MDG<br />
Africa Steering Group. New York: United<br />
Nations.<br />
MEA (Millennium Ecosystem Assessment).<br />
2005. Ecosystems and Human Well-Being:<br />
Wetlands and Water Synthesis. Washington,<br />
DC: World Resources Institute.<br />
NEPAD (New Partnership for Africa’s Development).<br />
2002. Comprehensive Africa<br />
Agriculture Development Programme. New<br />
Partnership for Africa’s Development,<br />
Midrand, South Africa.<br />
OECD (Organisation for Economic Cooperation<br />
and Development) and FAO<br />
(Food and Agriculture Organization of<br />
the United Nations). 2008. OECD-FAO<br />
Agricultural Outlook 2008-2017. Paris:<br />
Organisation for Economic Co-operation<br />
and Development.<br />
Phumpiu, P., and J. E. Gustafsson. 2007.<br />
Reform or Adjustment? From the Liberal<br />
and Neo-liberal Policy Reform Process in<br />
Honduras. Paper from 5th International<br />
Water History Association Conference:<br />
Pasts and Futures of Water, 13-17 June,<br />
Tampere, Finland.<br />
Poverty-Environment Partnership. 2006.<br />
Linking Poverty Reduction and Water<br />
Management. Poverty-Environment<br />
Partnership.<br />
Prüss-Üstün, A., and C. Corvalán. 2006.<br />
Preventing Disease through Healthy<br />
Environments: Towards an Estimate of the<br />
Environmental Burden of Disease. Geneva:<br />
World Health Organization. www.who.<br />
int/quantifying_ehimpacts/publications/<br />
preventingdisease/en/index.html.<br />
Rajan, Raghuram G. 2006. Investment<br />
Restraint, the Liquidity Glut and Global<br />
Imbalances. Remarks by the Economic<br />
Counsellor and Director of Research,<br />
International Monetary Fund, at the Conference<br />
on Global Imbalances organized<br />
by the Bank of Indonesia in Bali, Indonesia,<br />
November 16, 2006. www.imf.org/<br />
external/np/speeches/2006/111506.htm.<br />
Schuster-Wallace, Corinne J., Velma I.<br />
Grover, Zafar Adeel, Ulisses Confalonieri,<br />
and Susan Elliott. 2008. Safe<br />
Water as the Key to Global Health. Hamilton,<br />
Canada: United Nations University<br />
International Network on Water, Environment<br />
and Health.<br />
SIWI (Stockholm International Water<br />
Institute). 2005. Making Water a Part<br />
of Economic Development: The Economic<br />
Benefits of Improved Water Management<br />
and Services. Stockholm: Stockholm<br />
International Water Institute.<br />
UN Security Council. 2007. Security Council<br />
Holds First-ever Debate on Impact<br />
of Climate Change on Peace, Security,<br />
Hearing over 50 Speakers. UN Security<br />
Council 5663rd meeting, 17 April<br />
2007. United Nations Security Council,<br />
Department of Public Information, News<br />
and Media Division, New York, 17 April.<br />
www.un.org/News/Press/docs/2007/<br />
sc9000.doc.htm.<br />
UNDP (United Nations Development<br />
Programme). 2006. Human Development<br />
Report 2006. Beyond Scarcity. Power,<br />
Poverty and the Global Water Crisis. New<br />
York: Palgrave Macmillan.<br />
UNDP (United Nations Development<br />
Programme) and World Bank. 2007.<br />
Somalia Reconstruction and Development<br />
Programme: Deepening Peace<br />
and Reducing Poverty. Somalia Joint<br />
Needs Assessment, United Nations and<br />
World Bank Coordination Secretariat,<br />
Nairobi. www.somali-jna.org/downloads/<br />
ACF7C9C.pdf.<br />
UNFCCC (United Nations Framework<br />
Convention on Climate Change). 2005.<br />
Five-year Programme of Work on the Subsidiary<br />
Body for Scientific and Technological<br />
Advice on Impacts, Vulnerability and<br />
Adaptation to Climate Change. FCCC/<br />
CP/2005/5/Add.1, Bonn, Germany.<br />
———. 2007. Report on the Workshop<br />
on Adaptation Planning and Practices.<br />
FCCC/SBSTA/2007/15, United Nations<br />
Framework Convention on Climate<br />
Change.<br />
United Nations. 2008. Compilation of<br />
Initiatives and Commitments relating<br />
to the High-Level Event on the Millennium<br />
Development Goals. High-Level<br />
Event on the Millennium Development<br />
Goals: Committing to Action: Achieving<br />
the Millennium Development Goals, 25<br />
September, New York.<br />
UN-Water. 2007. Outcome of Seminar Coping<br />
with Water Scarcity. Outcome of the<br />
Seminar on Coping with Water Security,<br />
23 August, Stockholm. www.unwater.<br />
org/www-seminar2.html.<br />
———. 2008. Sanitation Is Vital for Health.<br />
Factsheet 1. International Year for Sanitation,<br />
New York.<br />
van Hofwegen, Paul, and Task Force on Financing<br />
Water for All. 2006. Enhancing<br />
Access to Finance for Local Governments.<br />
Financing Water for Agriculture. Chaired<br />
by Angel Gurría. Marseille, France: World<br />
Water Council.<br />
WELL. 2005. Supporting the Achievement of<br />
the MDG Sanitation Target. WELL Briefing<br />
Note for CSD-13, WELL, Leicestershire.<br />
WHO (World Health Organization). 2006.<br />
Economic and Health Effects of Increasing<br />
Coverage of Low Cost Water and<br />
Sanitation Interventions. UNHDR Occasional<br />
Paper, World Health Organization,<br />
Geneva.<br />
WHO (World Health Organization) and<br />
UNICEF (United Nations Children’s<br />
Fund) Joint Monitoring Programme.<br />
2008. Progress on Drinking Water and<br />
Sanitation: Special Focus on Sanitation.<br />
New York and Geneva: World Health<br />
Organization.<br />
Winpenny, James. 2003. Financing Water<br />
for All. Report of The World Panel on Financing<br />
Water Infrastructure, chaired by<br />
Michel Camdessus. Kyoto: World Water<br />
Council, 3rd World Water Forum, and<br />
Global Water Partnership.<br />
World Bank. 2003. Water Resources Sector<br />
Strategy: Strategic Directions for World<br />
Bank Engagement. World Bank, Washington,<br />
DC.<br />
———. 2005. Global Monitoring Report.<br />
Millennium Development Goals: From<br />
Consensus to Momentum. Washington,<br />
DC: World Bank.<br />
———. 2008. Environmental Health and<br />
Child Survival: Epidemiology, Economics Experiences.<br />
Washington, DC: World Bank.<br />
Worldwatch Institute. 2008. State of the<br />
World: Innovations for a Sustainable<br />
Economy. New York: Norton Institute.<br />
Zoellnick, Robert B. 2008. Speech by<br />
President of World Bank at United Nations’<br />
High-Level Conference on World<br />
Food Security: The Challenges of Climate<br />
Change and Bioenergy, 3 June 2008,<br />
Rome, Italy.<br />
Water in a changing world 23
Understanding what drives<br />
the pressures on water<br />
PART<br />
1<br />
Chapter<br />
2 Demographic, economic and social drivers<br />
3 Technological innovation<br />
4 Policies, laws and finance<br />
5 Climate change and possible futures<br />
Chapters 2-5<br />
Coordinator<br />
Tim Kasten<br />
(UNEP) with the<br />
support of Thomas<br />
Chiramba (UNEP)<br />
Facilitator<br />
Richard Connor
PART<br />
1<br />
Authors: Richard Connor and Walter Rast<br />
The amount of freshwater on Earth is<br />
finite, but its distribution has varied<br />
considerably, driven mainly by natural<br />
cycles of freezing and thawing and<br />
fluctuations in precipitation, water<br />
runoff patterns and evapotranspiration<br />
levels.<br />
That situation has changed, however.<br />
Alongside natural causes are new and<br />
continuing human activities that have<br />
become primary ‘drivers’ of the pressures<br />
affecting our planet’s water systems.<br />
These pressures are most often<br />
related to human development and economic<br />
growth. Our requirements for<br />
water to meet our fundamental needs<br />
and our collective pursuit of higher<br />
living standards, coupled with the need<br />
for water to sustain our planet’s fragile<br />
ecosystems, make water unique among<br />
our planet’s natural resources.<br />
Chapters 2-5 describe these water drivers<br />
and their interactions as they relate<br />
to the sustainability of water resources<br />
and systems. They also examine how to<br />
make reasonable predictions about the<br />
future. Such forecasts are relevant for<br />
policy-making directed to water resources<br />
and for development activities,<br />
investment planning and other activities<br />
generally considered to be outside<br />
the domain of the water sector – or<br />
‘outside the water box’.<br />
Part 1 examines the processes behind<br />
the rising pressures on our water supplies,<br />
identify the ones most likely to<br />
have the greatest impact on the world’s<br />
water resources in the coming decades<br />
and describe the context within<br />
which water will be managed. These<br />
chapters describe what we know about<br />
the current situation and recent trends<br />
and forecast possible futures related to<br />
processes that we refer to as drivers of<br />
change and define as:<br />
a set of fundamental processes<br />
that are external to the water sector<br />
and that directly or indirectly<br />
co-determine the evolution of the<br />
water system in terms of the quality,<br />
quantity and spatial distribution<br />
of the resource.<br />
At the turn of the century the World<br />
Water Vision exercise of the World<br />
Water Council – the first and largest<br />
international effort to develop global<br />
water scenarios – identified a series<br />
of ‘driving forces’ that ‘represent key<br />
factors, trends or processes which<br />
influence the situation, focal issues or<br />
decisions, and actually propel the system<br />
forward and determine the story’s<br />
outcome’. 1 Using this definition, the<br />
Vision team selected major drivers and<br />
organized them into six clusters: demographic,<br />
economic, technological,
PART<br />
1<br />
social, governance and environmental.<br />
This part of the Report draws on<br />
these clusters, with the exception of the<br />
environment, which is defined as a use<br />
and is covered extensively in part 2. To<br />
this list we have added climate change,<br />
discussed in chapter 5 and throughout<br />
the Report. This part of the Report also<br />
describes many of the complex links<br />
between the drivers, which can cause<br />
both positive and negative feedback<br />
impacts.<br />
In describing drivers ‘external to the<br />
water sector’, we have sought to identify<br />
key forces or processes of change over<br />
which water sector users, managers<br />
and decision-makers have little direct<br />
influence. Thus, water use sectors (agriculture,<br />
energy, domestic and industrial)<br />
are not drivers even though they<br />
have a major impact on the resource<br />
because they are not external to the<br />
water sector. The drivers of agriculture<br />
– and its demand for water – are such<br />
fundamental processes as population<br />
growth, changes in dietary preferences<br />
as living standards rise, and increasing<br />
demand for non‐food agricultural products<br />
such as bioenergy. The drivers of<br />
change are the demographic, economic<br />
and social forces that, in combination,<br />
exert pressures on the agriculture sector.<br />
This leads to an evolution in agriculture<br />
practices, which can also be<br />
influenced by technological innovation<br />
and agricultural and trade policies, all<br />
of which eventually affect the quality<br />
and quantity of water.<br />
These drivers should not be considered<br />
in isolation of related socioeconomic<br />
or political factors and other drivers.<br />
Many natural links influence how drivers<br />
affect changes, directly and indirectly.<br />
Water properties are governed by<br />
biological, chemical and physical laws<br />
that define the quantity and quality of<br />
water resources and that are linked in<br />
various ways. Temperature, a physical<br />
factor, can affect the metabolism of<br />
aquatic organisms, a biological process.<br />
The excessive biological production<br />
(such as excessive algal growth)<br />
associated with increased temperature<br />
can degrade water quality, a chemical<br />
property.<br />
Superimposed on these natural processes<br />
are human activities that exacerbate<br />
these processes, disrupting the natural<br />
balance of water systems. The growth<br />
of algae or aquatic plants in a lake,<br />
for example, is stimulated by excessive<br />
nutrients and minerals washed into<br />
the lake as a result of human activities,<br />
accelerating natural growth processes<br />
to levels that can cause water quality<br />
degradation and interfere with beneficial<br />
water uses.
PART<br />
1<br />
Drivers are thus the forces and processes<br />
generated by human activities.<br />
Consider governments’ efforts to improve<br />
citizens’ livelihoods and standards<br />
of living by increasing economic<br />
growth. Economic growth is affected<br />
by a wide range of policy decisions,<br />
from international trade to education<br />
and public health, while the potential<br />
rate of economic growth can be affected<br />
by demographic variables such as<br />
population distribution (local workforce<br />
availability) and social characteristics<br />
(workforce capacity) and by the availability<br />
of new technologies. Economic<br />
activity also requires adequate quantities<br />
of natural resources, including<br />
freshwater. And water availability is directly<br />
subject to the impacts of climate<br />
change, which can exert additional<br />
pressures on other drivers.<br />
A rising standard of living is typically<br />
accompanied by increased consumption<br />
and production of goods, along<br />
with rising demands for water-related<br />
household services and water resources<br />
to facilitate economic growth and related<br />
activities. Rising demand for meat<br />
and fish in urbanized and emerging<br />
market economies, for example, has increased<br />
fishery activities and livestock<br />
production, generally a water-intensive<br />
activity. The feedback loop of degraded<br />
water quality from livestock feedlot<br />
runoff can diminish fish production<br />
or alter its quality. There is also sociological<br />
evidence that urbanization<br />
shifts fishing pressures from natural<br />
water systems to artificial systems.<br />
Thus, urbanization and globalization,<br />
with changes in diets and lifestyles,<br />
are strong drivers of water use, even<br />
though decisions made outside the<br />
water sector are driving them.<br />
The result is a continuously increasing<br />
demand for finite water resources for<br />
which there are no substitutes. When<br />
water resources of acceptable quality<br />
can no longer be provided in sustainable<br />
quantities to meet such demands,<br />
aquatic ecosystems can be overexploited<br />
as each sector or user group tries<br />
to satisfy its own water needs at the<br />
expense of others. The ultimate loser<br />
is the sustainability of the exploited<br />
aquatic ecosystems and the organisms<br />
(including humans) dependent on them<br />
for survival and well-being.<br />
Note<br />
1. Gallopín and Rijsberman 2000,<br />
p. 18.
Chapter 2<br />
Demographic,<br />
economic and<br />
social drivers<br />
PART<br />
1<br />
Authors: Gunilla Björklund, Richard Connor, Anne Goujon, Molly Hellmuth,<br />
Patrick Moriarty, Walter Rast, Koko Warner and James Winpenny<br />
Contributors: Arjen Hoekstra, Walter Rast and David Wiberg<br />
Coordinator: Tim Kasten (UNEP)<br />
Facilitator: Richard Connor<br />
Key messages<br />
Human activities and processes of all types – demographic, economic<br />
and social – can exert pressures on water resources and<br />
need to be managed.<br />
These pressures are in turn affected by a range of factors such<br />
as technological innovation, institutional and financial conditions<br />
and climate change.<br />
The rapid global rise in living standards combined with population<br />
growth presents the major threat to the sustainability of<br />
water resources and environmental services.<br />
Demographic drivers<br />
Authors: Richard Connor, Anne Goujon,<br />
Molly Hellmuth and Koko Warner<br />
Contributors: Walter Rast and David Wiberg<br />
Key messages<br />
• Population dynamics (growth, age distribution,<br />
urbanization and migration)<br />
create pressures on freshwater resources<br />
through increased water demands<br />
and pollution.<br />
• Changes in the natural landscape<br />
associated with population dynamics<br />
(migration, urbanization) can create<br />
additional pressures on local freshwater<br />
resources and the need for more<br />
water-related services.<br />
Demographic processes such as population<br />
growth, age distribution, urbanization<br />
and migration create some of the greatest<br />
pressures on water resources quantity<br />
and quality. These demographic processes<br />
directly affect water availability and<br />
quality through increased water demands<br />
and consumption and through pollution<br />
resulting from water use. They affect water<br />
resources indirectly through changes in<br />
land use and water use patterns, with<br />
significant implications at local, regional<br />
and global levels. And the availability and<br />
quality of water as well as trends in water<br />
use can influence demographic processes.<br />
The world’s population is growing by<br />
about 80 million people a year, implying<br />
increased freshwater demand of about<br />
64 billion cubic metres a year. 1 An estimated<br />
90% of the 3 billion people who are<br />
expected to be added to the population<br />
by 2050 will be in developing countries,<br />
many in regions where the current population<br />
does not have sustainable access to<br />
safe drinking water and adequate sanitation.<br />
2 Many governments lack the financial<br />
resources and institutional capacity to<br />
provide for these needs, while countries<br />
that have experienced gains in the number<br />
of people with access to water supply and<br />
sanitation services since 1990 may see<br />
these gains eroded by population growth.<br />
The demographics of the global population<br />
are changing, with important implications<br />
for water resources. By 2050, 22% of the<br />
world’s population is expected to be 60<br />
years old or older, up from 10% in 2005. At<br />
the same time, the world has more young<br />
Water in a changing world 29
PART<br />
1<br />
Chapter 2<br />
the world will<br />
have substantially<br />
more people in<br />
vulnerable urban<br />
and coastal areas<br />
in the next 20<br />
years. In areas<br />
with already-scarce<br />
water resources<br />
water managers<br />
will have to look<br />
beyond the water<br />
sector for solutions<br />
people than ever, with nearly half the world<br />
population being under the age of 25.<br />
While the world’s urban population grew<br />
rapidly during the 20th century (from<br />
220 million to 2.8 billion), the next few<br />
decades will see an unprecedented scale of<br />
urban growth across developing countries.<br />
In Africa and Asia the urban population<br />
is expected to double between 2000 and<br />
2030. By 2030 the towns and cities of the<br />
developing world will make up an estimated<br />
81% of urban humanity. 3<br />
Today, there are an estimated 192 million<br />
migrants worldwide, up from 176 million<br />
in 2000. 4 Coastal areas, with 18 of the<br />
world’s 27 megacities (populations of 10<br />
million or greater), are thought to face the<br />
largest migration pressures. 5 About 75%<br />
of people residing in low-lying areas are<br />
in Asia, with the most vulnerable being<br />
poor people. International migration is<br />
increasing as a result of such factors as<br />
demographic changes, economic disparities,<br />
trade liberalization, environmental<br />
changes and new communication technologies.<br />
Impacts of climate change can<br />
substantially accelerate migration (see<br />
chapter 5). Demographic changes affect<br />
international migration in two ways.<br />
Rapid population growth, combined with<br />
economic difficulties, push people to cities,<br />
while a declining and ageing population<br />
induces countries to accept migrants,<br />
who are typically willing to work at much<br />
lower wages than native workers. Water<br />
shortages and hazards, particularly where<br />
people are directly dependent on the<br />
environment for their livelihood, can also<br />
induce migration.<br />
The net implication of these demographic<br />
processes is clear: the world will have substantially<br />
more people in vulnerable urban<br />
and coastal areas in the next 20 years. The<br />
rate of slum formation is nearly the same<br />
as the rate of urban growth. In areas with<br />
already-scarce water resources water managers<br />
will have to look beyond the water<br />
sector for solutions. They will have to work<br />
closely with leaders in other sectors, such<br />
as education, health, social services and<br />
agriculture, to respond effectively to the<br />
demographic challenge.<br />
Population growth<br />
We live in a demographically divided<br />
world, with population still growing rapidly<br />
in some regions (Africa and the Middle<br />
East), ageing rapidly in others (Europe and<br />
East Asia) and already declining in others<br />
(Europe; map 2.1).<br />
Besides Eastern Europe and the former<br />
Soviet Union, where annual population<br />
growth is already negative, Australia,<br />
China, Japan, New Zealand and Western<br />
Europe will also soon see shrinking<br />
populations. Around 2060 South Asia and<br />
Pacific will also experience negative population<br />
growth rates. Other regions are less<br />
susceptible to negative population growth<br />
forces. Sub-Saharan Africa and the Middle<br />
East will continue to experience high rates<br />
of population growth well into the future.<br />
This timing will characterize most of the<br />
problems of water scarcity.<br />
Map 2.1 Expected areas of population growth and decline, 2000-2080<br />
Ratio of population 2080/2000<br />
Increase<br />
1.00-1.24<br />
1.25-1.49<br />
1.50-1.74<br />
1.75-1.99<br />
2.0-2.99<br />
3.0-5.8<br />
Decrease<br />
0.5-0.7<br />
0.8-1.0<br />
No data<br />
Source: Lutz, Sanderson, and Scherbov 2008.<br />
30 World Water Development Report 3
demographic, economic and social drivers<br />
PART<br />
1<br />
Most population growth will occur in<br />
developing countries, mainly in regions<br />
that are already in water stress and in<br />
areas with limited access to safe drinking<br />
water and adequate sanitation facilities.<br />
More than 60% of the world’s population<br />
growth between 2008 and 2100 will be in<br />
sub-Saharan Africa (32%) and South Asia<br />
(30%). Together, these regions are expected<br />
to account for half of world population<br />
in 2100. Such rates of population growth<br />
will have major social and environmental<br />
impacts, given the level of economic development<br />
in many affected countries.<br />
Age distribution<br />
The age of the population will influence<br />
consumption and production patterns,<br />
with attendant impacts on natural resource<br />
needs, including freshwater. The<br />
resource needs and services associated<br />
with increasing longevity will include<br />
greater provision of medicines, medical<br />
facilities and health-care providers. For<br />
younger people the globalization of trade<br />
and advertising tempts those in developing<br />
countries to want more and those in<br />
developed countries who already have<br />
more to want even more. These needs and<br />
wants translate into higher consumption<br />
and production patterns, requiring additional<br />
resources, including freshwater.<br />
Urbanization and the growth of<br />
informal human settlements<br />
In 2008 world population was estimated to<br />
be equally split between urban and rural<br />
areas, marking the transition from a rural<br />
dominated to an urban dominated world.<br />
By 2030 the number of urban dwellers<br />
is expected to be about 1.8 billion more<br />
than in 2005 and to constitute about<br />
60% of the world’s population (figure 2.1),<br />
while the number of rural inhabitants is<br />
expected to decline slightly from 3.3 billion<br />
to 3.2 billion. Almost all (95%) of the<br />
increase in urban populations is expected<br />
in developing countries, especially in<br />
Africa and Asia, where the urban population<br />
is projected to double between 2000<br />
and 2030. 6 Urbanization rates are much<br />
lower in developed countries and are even<br />
declining in some countries.<br />
believed to be better than in rural areas.<br />
But in informal urban areas residents<br />
have little access to safe drinking water or<br />
adequate sanitation services, increasing<br />
the danger of water- and sanitation-related<br />
diseases. It is through such informal urban<br />
areas that most urban growth occurs.<br />
In addition to the sociological and health<br />
implications of increased population density<br />
in urban settlements, urbanization has<br />
unique environmental impacts. Urbanization<br />
is accompanied by the transformation<br />
of natural land surfaces into impervious<br />
surfaces, such as streets, parking lots, roofs<br />
and other types of structures that block<br />
the percolation of rainwater and snowmelt<br />
into soil. Such construction increases the<br />
flow velocity of water over the land surface,<br />
carrying polluting materials into receiving<br />
water systems, degrading water quality<br />
and causing local pollution problems. This<br />
urban drainage effect has increased the<br />
frequency of flash floods, causing casualties<br />
and infrastructure damage.<br />
Migration<br />
Migratory populations include traditional<br />
groups of subsistence-level pastoralists<br />
and agriculturalists, as well as family<br />
groups and individuals seeking greater<br />
opportunities and refugees fleeing the<br />
consequences of war, conflict or natural<br />
disasters. Refugees often pass through<br />
camps or informal settlements that may<br />
be artificially sustained by aid agencies or<br />
governments. The result is the rapid denuding<br />
of the surrounding area as people<br />
search for water and fuel wood in order<br />
to survive – leading to soil degradation,<br />
deforestation, land clearing and a scarcity<br />
of potable water. Migratory pastoralists<br />
Figure 2.1<br />
Share of population residing in urban areas, 2005 and 2030 (percent)<br />
100<br />
80<br />
60<br />
2005<br />
2030<br />
Most population<br />
growth will occur<br />
in developing<br />
countries and<br />
mainly in regions<br />
that are already<br />
in water stress, in<br />
areas with limited<br />
access to safe<br />
drinking water<br />
and adequate<br />
sanitation facilities<br />
By 2030 about 60% of the world’s population<br />
is expected to live in urban areas<br />
Despite the continuing growth of megacities<br />
– which require natural resources<br />
and create waste in quantities not seen<br />
in human history – most of the world’s<br />
urban populations live in cities with fewer<br />
than 500,000 inhabitants. The growth of<br />
small and mid-size cities will have significant<br />
impacts on water resources. In most<br />
established or formal urban areas access<br />
to water supply and sanitation services is<br />
40<br />
20<br />
0<br />
World<br />
Africa<br />
Asia<br />
Note: Regions are official UN regions.<br />
Source: United Nations 2006b.<br />
Europe<br />
Latin<br />
America<br />
and the<br />
Caribbean<br />
Northern<br />
America<br />
Oceania<br />
Water in a changing world 31
PART<br />
1<br />
Chapter 2<br />
The relation<br />
between water<br />
and migration<br />
is two-way:<br />
water stressors<br />
drive migration,<br />
and migration<br />
contributes to<br />
water stress<br />
and agriculturalists can also have significant<br />
localized impacts on the surrounding<br />
landscape through such practices as overgrazing<br />
of livestock and slash and burn<br />
agriculture. While generally considered<br />
rural dwellers, these migrants frequently<br />
constitute a large share of those seeking<br />
better economic opportunities and better<br />
access to water and sanitation services,<br />
shelter, health services and food stocks<br />
in established urban areas, leading to the<br />
proliferation of informal communities on<br />
the fringes of cities.<br />
The relation between water and migration<br />
is two-way: water stressors drive migration,<br />
and migration contributes to water stress.<br />
Water stressors, such as water scarcity and<br />
flooding, can trigger migration decisions.<br />
The social, economic and political context<br />
in which water stresses occur will influence<br />
the migration response. And if the<br />
natural environment becomes inhospitable,<br />
people are motivated to move to areas<br />
where their locally specific knowledge may<br />
no longer apply. Once people move, their<br />
places of destination must provide them<br />
with water resources, which can lead to<br />
further environmental stresses.<br />
In these situations the arrival of additional<br />
people can worsen existing water crises and<br />
strain the capacity of the urban infrastructure.<br />
Water conflicts can be exacerbated<br />
through migration or the presence of<br />
refugees, and the fragile balance of human<br />
populations and water resources can be<br />
upset. Increasingly, links between environmental<br />
issues, including water, and security<br />
issues, including migration, have become<br />
a topic of scientific research and policy<br />
debate. Climate change, which is predicted<br />
to lead to greater frequency and intensity of<br />
extreme weather events, is likely to result in<br />
an overall increase in the displacement of<br />
people in the future (see chapter 5).<br />
Estimates of potential environmentally<br />
displaced people range from 24 million to<br />
almost 700 million who could be displaced<br />
by water-related factors, including development<br />
projects designed to relieve future<br />
water availability stresses. 7 Part of the<br />
complexity in unraveling the connection<br />
between migration and environmental<br />
factors such as water resources is that people<br />
rely indirectly or directly on the environment<br />
for their livelihoods. In addition,<br />
development policies and political and<br />
economic stability – or the lack of it – can<br />
affect both migration and water resources.<br />
Given these complexities, it is difficult to<br />
estimate the magnitude of potential migration<br />
as a result of environmental factors.<br />
One positive outcome of migration is the<br />
lessening of the pressures on the vacated<br />
lands, which may allow some ecosystems<br />
to recover. In Europe and North America<br />
the rural exodus has resulted in the growth<br />
of new parklands in some locations.<br />
Challenges<br />
With rapidly ageing populations in some<br />
places and rapidly ageing populations<br />
combined with a shrinking population<br />
in others, it is important to consider the<br />
quality dimensions of education and<br />
health as well as the quantitative dimensions<br />
of population size and age structure<br />
in addressing the water needs of evolving<br />
communities. To meet the challenges of<br />
rapid urban population growth, decisionmakers<br />
can focus on positive factors that<br />
affect fertility decline – social development,<br />
investments in health and education,<br />
empowerment of women and better<br />
access to reproductive health services – in<br />
contrast to antimigration approaches.<br />
Economic drivers<br />
Authors: Richard Connor, Walter<br />
Rast and James Winpenny<br />
Contributor: Arjen Hoekstra<br />
Key messages<br />
• Growth and changes in the global<br />
economy are having far-reaching impacts<br />
on water resources and their use.<br />
• Growing international trade in goods<br />
and services can aggravate water stress<br />
in some countries while relieving it in<br />
others through flows of ‘virtual water’,<br />
particularly in the form of imported<br />
agricultural commodities.<br />
Global economic expansion affects water<br />
through growth in the number of consumers<br />
and through changes in their<br />
consumption habits, in the way goods and<br />
services are produced and in the location<br />
of activities, all of which affect international<br />
trade. Growth in global output<br />
is currently estimated to slow to 2.2%<br />
in 2009, though this will likely be less<br />
because of the economic volatility arising<br />
from the global financial crisis. 8 The<br />
growth output is also unevenly distributed.<br />
Several emerging market economies<br />
are registering continuously high growth<br />
rates, transforming them into major global<br />
economic forces. Brazil, China, India and<br />
the Russian Federation are, on Goldman<br />
Sachs’ latest forecast, expected to overtake<br />
the combined economic strength of the<br />
G-8 by 2032. 9 Even sub-Saharan Africa,<br />
long a growth straggler, is experiencing<br />
32 World Water Development Report 3
demographic, economic and social drivers<br />
PART<br />
1<br />
growth rates of 6% or more, fuelled largely<br />
by oil and commodities.<br />
Water is affected by economic forces, while<br />
the state of water resources has a strong<br />
feedback to the economy. In periods of<br />
water shortages public authorities are<br />
likely to close factories and divert water<br />
from farmers to release water supplies for<br />
households. Water contamination from<br />
industrial effluents may result in factory<br />
closures and relocation, while the depletion<br />
and contamination of groundwater<br />
may compel industries to relocate. Lack<br />
of water storage infrastructure may cause<br />
heavy economic losses from flooding and<br />
drought. Polluted water has high costs for<br />
human health. In short, adequate investments<br />
in water management, infrastructure<br />
and services can yield a high economic<br />
return by avoiding such related costs. 10<br />
Globalization – used here as shorthand for<br />
the increasing international flows of goods<br />
and services, people, investments and<br />
finance – may make the situation worse,<br />
but it can also provide solutions. Producing<br />
and exporting goods and services with a<br />
large water footprint (the volume of water<br />
used in producing the goods and services<br />
consumed) could aggravate the problems<br />
of a water-scarce economy. Yet such an<br />
economy could gain from importing<br />
goods with a high water content (importing<br />
virtual water). Companies can escape<br />
their local water problems by relocating to<br />
other countries. However, growing corporate<br />
awareness of a firm’s water footprint<br />
is leading to greater transparency about<br />
the impact of a firm’s supply chain on its<br />
water environment. Globalization is also<br />
enabling the spread of water expertise provided<br />
by international firms and through<br />
global communications of service providers<br />
in other countries. These companies are<br />
a key part of water solutions through the<br />
desalination, re-use and wastewater treatment<br />
technologies they bring with them.<br />
The following sections focus on economic<br />
processes that have exerted pressures on<br />
water resources and how they are managed.<br />
In addition to globalization, these<br />
processes include the global food and fuel<br />
crises and international trade (virtual water<br />
and increasing awareness of the water footprints<br />
of production and services).<br />
Globalization<br />
While economic integration is a dominant<br />
feature of globalization, social, cultural, political<br />
and institutional aspects are also important.<br />
Changes in consumption patterns<br />
through growing demands and easier access<br />
to goods and services, increased transport<br />
and energy needs and global access to innovation<br />
and knowledge all play a role in<br />
globalization – and all have an impact on<br />
water resources and the environment.<br />
Globalization has raised the productivity<br />
and living standards of people in the<br />
countries that have opened themselves<br />
to the global marketplace. However, the<br />
gains from globalization have not been<br />
evenly distributed. Many people remain on<br />
the fringes, and some have fallen further<br />
behind. Exclusion, grinding poverty and<br />
environmental damage create dangers. An<br />
estimated 1.4 billion people – often referred<br />
to as the ‘bottom billion’ – live on just<br />
$1.25 a day. 11 Those who suffer the most<br />
usually have the least to start with – indigenous<br />
peoples, women in developing countries,<br />
the rural poor and their children.<br />
In many cases rapid economic growth has<br />
failed to provide opportunities for these<br />
poorest of the poor. Social services remain<br />
severely unfunded, and environmental and<br />
energy problems, including water quality<br />
and lack of service delivery, are acute. In<br />
advanced economies increased economic<br />
insecurity has been associated with rising<br />
inequality and the squeezing of social<br />
provisioning. In middle-income countries<br />
economic shocks, accelerated trade liberalization<br />
and premature de industrialization<br />
have constrained economic diversification<br />
and formal job creation. Elsewhere, intractable<br />
poverty has fed a vicious circle of<br />
economic insecurity and political instability<br />
and, on occasion, communal violence. 12<br />
Such situations increase the threat of<br />
degrading water resources and reducing<br />
environmental services.<br />
In addition to these indirect pressures are<br />
the direct pressures, such as proliferation<br />
of invasive species. Related to the increasing<br />
exchange of goods through international<br />
shipping, invasive species have<br />
caused enormous environmental damage<br />
to aquatic and terrestrial ecosystems.<br />
The global food crises and the rising<br />
cost of fuel and energy<br />
Reversing decades of low prices, the twoyear<br />
period 2006-08 has seen sharp, and<br />
largely unanticipated, increases in food<br />
prices. Because poor people spend one-half<br />
to three-quarters of their income on food,<br />
a steep increase in the price of rice, grains<br />
and edible oils is tantamount to a large<br />
reduction in income. While in the long<br />
run higher food prices are an opportunity<br />
for those who live and work in rural areas<br />
(especially if they have the technology and<br />
The gains from<br />
globalization have<br />
not been evenly<br />
distributed: many<br />
people remain on<br />
the fringes, and<br />
some have fallen<br />
further behind<br />
Water in a changing world 33
PART<br />
1<br />
Chapter 2<br />
The world will<br />
need almost 60%<br />
more energy in<br />
2030 than in 2002.<br />
Water is needed<br />
for the production<br />
of energy of all<br />
types, so expansion<br />
16<br />
14<br />
12<br />
10<br />
of energy supply<br />
will affect water<br />
Figure 2.2<br />
8<br />
6<br />
4<br />
2<br />
0<br />
1970<br />
resources<br />
the inputs – including water – needed to<br />
raise their productivity to its full potential),<br />
in the short run higher prices create<br />
a crisis for the urban and rural poor.<br />
Although Africa and other low-income<br />
countries are particularly vulnerable, even<br />
middle-income countries are at risk if they<br />
lack well developed safety nets.<br />
According to the Commission on Growth<br />
and Development, there are many potential<br />
causes for the steep food price<br />
increases. Contributing factors include<br />
rising demand, shifting diets, droughts,<br />
increased costs of agricultural inputs (such<br />
as fertilizers) and policies that encourage<br />
the use of agricultural land and output for<br />
bioenergy production. Although there is<br />
no consensus yet on the relative importance<br />
of these factors, many believe that<br />
policies favouring bioenergy over food<br />
need to be reviewed. 13 The 2008 Declaration<br />
of the High-Level Conference on<br />
World Food Security: The Challenges of<br />
Climate Change and Bioenergy cautions:<br />
We are convinced that in-depth<br />
studies are necessary to ensure that<br />
production and use of biofuels is<br />
sustainable in accordance with the<br />
three pillars of sustainable development<br />
and takes into account<br />
the need to achieve and maintain<br />
global food security. 14<br />
Other longer-term factors may also have<br />
been at play. The low agricultural prices<br />
prevailing until recently may have led governments<br />
to neglect investments in rural<br />
infrastructure, research and development,<br />
storage and food security programmes that<br />
were once a priority. In parallel, agricultural<br />
policies in many countries encouraged<br />
non-food commodities such as bioenergy,<br />
Estimated energy costs, 1970-2005 (nominal US$ per million Btus)<br />
1975<br />
1980<br />
Source: Based on EIA 2008.<br />
The cost of energy to consumers has been<br />
rising since the 1970s<br />
1985<br />
1990<br />
1995<br />
2000<br />
2005<br />
fibres and narcotics over food commodities.<br />
Many major food-producing countries have<br />
reacted to the crisis by restricting exports to<br />
help contain prices at home, driving international<br />
prices still higher. Global markets<br />
in food have become temporarily fragmented.<br />
The recent food crisis has encouraged<br />
countries to re-consider food self-sufficiency,<br />
giving it prominence over purely economic<br />
considerations. This will likely have<br />
an impact on national food and agriculture<br />
policies for several years, with implications<br />
for water resources management.<br />
A drive towards food self-sufficiency would<br />
have undesirable consequences for national<br />
water security, especially for countries<br />
in arid regions. Such policies, though<br />
beneficial for rural development, increase<br />
a country’s national water footprint and<br />
forfeit growth in higher-income, less<br />
water-intensive sectors.<br />
Crude oil prices have also risen sharply in<br />
recent years – from under $25 a barrel in<br />
2002 to more than $150 in July 2008 before<br />
dropping back to just under $40 in early<br />
January 2009. Among the likely contributing<br />
factors to the rise is increased demand<br />
linked to economic growth in emerging<br />
market economies. This growing demand<br />
has also increased pressure to exploit new<br />
sources of oil. Many of these, such as the<br />
tar sands in Western Canada, have a very<br />
high water – and environmental – footprint<br />
(see chapter 3). Increasing oil prices are also<br />
likely linked to the overall increase in the<br />
cost of energy, which has been rising steadily<br />
since the early 1970s (figure 2.2).<br />
Like food security, energy security is important<br />
for GDP growth. According to the<br />
International Energy Agency, the world will<br />
need almost 60% more energy in 2030 than<br />
in 2002, with economic growth in developing<br />
countries driving most of the increase. 15<br />
Development of hydropower is one energy<br />
strategy to reduce dependence on fossil<br />
fuels and limit greenhouse gas emissions,<br />
and developing countries possess significant<br />
hydropower potential. Water is needed for<br />
the production of energy of all types (see<br />
chapter 7), so expansion of energy supply<br />
will affect water resources and related<br />
environmental services. Energy to support<br />
growth within urban centres will depend<br />
largely on water resources management<br />
responses to centralized power production.<br />
Growth in small towns will likely rely more<br />
on off-grid renewable energy sources.<br />
High prices can provide incentives for<br />
greater efficiency in fuel consumption and<br />
agricultural production and can generate<br />
34 World Water Development Report 3
demographic, economic and social drivers<br />
PART<br />
1<br />
more income for people in rural areas. High<br />
fuel prices are likely to spur the development<br />
of alternative energy types like wind<br />
and solar, which require little water, and<br />
many countries also benefit from higher<br />
tax proceeds when energy prices rise –<br />
resources that could be used for further<br />
investments in efficiency and development.<br />
Water and trade: virtual water<br />
and growing awareness of water<br />
footprints<br />
The concepts of water footprints and<br />
virtual water are used to describe the relations<br />
among water management, international<br />
trade and politics and policies, and<br />
water resources use as it pertains to human<br />
consumption. Water footprints measure<br />
how much water is used in the production<br />
and consumption of goods and services (as<br />
well as how much pollution is generated),<br />
while virtual water is a tool for determining<br />
the movement of water through international<br />
trade.<br />
Because water is heavy relative to its value,<br />
it is not feasible to transport it in bulk over<br />
long distances, with the exception of limited<br />
schemes for drinking water. Thus, water<br />
is predominantly a local concern, although<br />
it becomes a regional issue where rivers<br />
or lakes cross national boundaries. What<br />
transforms water into a global issue is trade<br />
in goods and services with a substantial<br />
water content either in the finished product<br />
or in its production (so-called virtual water).<br />
Providing water and wastewater services to<br />
households, industries and farmers can also<br />
have implications for international trade.<br />
Countries with water shortages can import<br />
water-intensive goods and services,<br />
while water-abundant countries can take<br />
advantage of their bountiful water supplies<br />
through exports. While this beneficial<br />
trade happens broadly at a regional<br />
level (box 2.1), many countries have trade<br />
patterns that do not promote or benefit<br />
from this advantage. Through patterns of<br />
consumption and imports, countries can<br />
aggravate water shortages and pollution of<br />
their water supplies. Trade distortions and<br />
failure to properly price water resources<br />
may worsen the water-related problems of<br />
trading partners (see map 7.3 in chapter 7<br />
and map 8.1 in chapter 8).<br />
Many companies are beginning to understand<br />
the need to measure their water<br />
footprint, including that of their supply<br />
chains, and to relieve water stress in<br />
the communities where they operate.<br />
Countries with<br />
water shortages<br />
can import waterintensive<br />
goods<br />
and services, while<br />
water-abundant<br />
countries can<br />
take advantage<br />
of their bountiful<br />
water supplies<br />
through exports<br />
Box 2.1<br />
Virtual water<br />
Water-intensive products are heavily<br />
traded over large distances, as countries<br />
import and export water in virtual form as<br />
agricultural and industrial commodities.<br />
The global volume of virtual water flows in<br />
commodities is 1,625 billion cubic metres<br />
(m 3 ) a year, accounting for about 40% of<br />
total water consumption. About 80% of<br />
these virtual water flows relate to agricultural<br />
products trade,<br />
and the remainder to<br />
industrial products<br />
trade.<br />
would require 15.6 billion m 3 a year. From<br />
a global perspective this trade in cereals<br />
saves 8.5 billion m 3 of water a year. Despite<br />
some trade from countries with low<br />
water productivity to countries with high<br />
productivity, global water savings through<br />
international trade of agricultural products<br />
has been estimated at about 350 billion<br />
m 3 a year, equivalent to 6% of the global<br />
volume of water used for agricultural<br />
production.<br />
Many countries, including Japan, Mexico<br />
and most countries in Europe, the Middle<br />
East and North Africa, have net virtual<br />
water imports (see map). Water security in<br />
many countries thus strongly depends on<br />
external water resources (see chapter 7).<br />
Regional virtual water balances and net interregional virtual water flows related to trade in<br />
agricultural products, 1997-2001<br />
Global virtual water<br />
trade can save water<br />
if products are traded<br />
from countries with<br />
high water productivity<br />
to countries with<br />
low productivity. For<br />
example, Mexico<br />
imports wheat, maize<br />
and sorghum from the<br />
United States, which<br />
requires 7.1 billion m 3<br />
of water a year in the<br />
United States to produce.<br />
If Mexico produced<br />
the imported<br />
crops domestically, it<br />
16.7<br />
Net virtual water imports<br />
(billions of cubic metres per year)<br />
-108 North America<br />
-107 South America<br />
-70 Oceania<br />
-45 North Africa<br />
-30 South-East Asia<br />
-16 Central Africa<br />
-5 Southern Africa<br />
2 Central America<br />
13 Former Soviet Union<br />
18 Eastern Europe<br />
47 Middle East<br />
150 Central and Southern Asia<br />
152 Western Europe<br />
15.8<br />
49.0<br />
10.2<br />
75.8<br />
Source: Based on Hoekstra and Chapagain 2008.<br />
15.1<br />
49.0<br />
18.7<br />
19.2 29.0<br />
10.4<br />
12.2<br />
Regional virtual water balance (billions of cubic metres per year)<br />
15.5<br />
Water in a changing world 35
PART<br />
1<br />
Chapter 2<br />
A growing middle<br />
class is consuming<br />
much more milk,<br />
bread, eggs,<br />
chicken and beef,<br />
the production<br />
of which is more<br />
water-intensive<br />
than the simpler<br />
diets they are<br />
replacing<br />
Motivating companies to assess their water<br />
footprints is the desire to gain the goodwill<br />
of customers and potential customers<br />
and the need for cost control and risk<br />
management, including safeguarding<br />
access to the water essential for their<br />
operations. Recent business initiatives to<br />
support sustainable water management<br />
include the CEO Water Mandate launched<br />
at the 2007 UN Global Leadership Forum,<br />
the World Economic Forum’s call for a<br />
‘coalition’ of businesses to engage in water<br />
management partnerships and the World<br />
Business Council for Sustainable Development’s<br />
creation of a water diagnostic tool<br />
and water scenario planning supports. 16<br />
Water is increasingly viewed as a potential<br />
threat and constraint to economic growth.<br />
As an example, China’s remarkable economic<br />
growth has been accompanied by<br />
serious environmental problems, most notably<br />
water shortages in the north and pollution<br />
from wastewater effluents across the<br />
country (box 2.2). Massive projects begun<br />
to divert extensive water resources from<br />
the south to its more populated north will<br />
doubtless result in major environmental<br />
and social issues.<br />
Trade and investment patterns are ultimately<br />
driven by demand, and changes in consumption<br />
and lifestyle accompany rising<br />
income levels in all countries. ‘How much<br />
water do people drink?’ (on average, 2-5<br />
litres a day in developed countries) is much<br />
less relevant than ‘How much water do<br />
people eat?’ (3,000 litres a day in developed<br />
countries, according to one estimate). 17 Economic<br />
growth in emerging market economies<br />
is driving the growth of a middle class<br />
that is consuming much more milk, bread,<br />
eggs, chicken and beef, the production of<br />
which is more water-intensive than the<br />
simpler diets they are replacing. 18 Likewise<br />
in the services sector, tourism and recreation<br />
are creating an increasingly large water<br />
footprint in host societies.<br />
The concepts of virtual water and water<br />
footprints are useful in illustrating the<br />
true influence of economic activity on<br />
water. With greater awareness should come<br />
measures to improve water productivity<br />
(‘output per drop’) in water-stressed environments<br />
and to reduce the polluting side<br />
effects of production.<br />
Challenges<br />
Globalization is bringing increasing economic<br />
opportunities to many, while leaving<br />
behind some who need them most: the<br />
world’s poorest people living in the least<br />
developed countries. The first challenge is<br />
to shift this balance so that the less fortunate<br />
can have access to basic products and<br />
services, including sustainable access to<br />
safe drinking water and adequate sanitation<br />
services.<br />
A second major challenge is to ensure that<br />
the cumulative action of economic activities<br />
and all other water drivers does not<br />
overwhelm nature’s ability to provide for<br />
human needs. The expansion and growth<br />
of the global economy, and the resulting<br />
increases in human consumption, drive<br />
human demands to use more natural resources,<br />
including freshwater. However, the<br />
goods and services provided by ecosystems<br />
(such as water, biodiversity, fibre, food, feed<br />
and climate) are finite and vulnerable. Balancing<br />
economic development and environmental<br />
sustainability – and all the drivers<br />
influencing these links – remains a core<br />
requirement for sustainable development.<br />
Box 2.2<br />
Water: a brake on economic growth and<br />
corporate prospects<br />
While the scarcity of freshwater is felt<br />
acutely in Africa and West Asia, water<br />
scarcity is already an economic constraint<br />
in major growth markets such<br />
as China, India and Indonesia, as well<br />
as commercial centres in Australia<br />
and the western United States. If current<br />
consumption patterns continue,<br />
two-thirds of the world’s population<br />
will live in water-stressed conditions<br />
by 2025. Compounding – and<br />
politicizing – these challenges is the<br />
reality that fully a third of the world’s<br />
population lacks access to sufficient<br />
quantities of safe water to meet their<br />
basic needs.<br />
In the next two to five years many companies<br />
will need to adapt to water availability<br />
concerns, including water stress<br />
and flooding; water quality concerns,<br />
including increasingly contaminated<br />
surface and groundwater supplies; and<br />
water access concerns, specifically competition<br />
with other water users. Corporate<br />
leaders who prepare careful water<br />
strategies for managing medium-term<br />
business risks and opportunities will not<br />
only be prepared to meet the future –<br />
gaining advantage in some of the key,<br />
and most water-constrained, global<br />
markets – but can also help shape it.<br />
Source: Pacific Institute 2007.<br />
Social drivers<br />
Authors: Gunilla Björklund, Richard<br />
Connor, Anne Goujon, Patrick Moriarty,<br />
Walter Rast and James Winpenny<br />
Key messages<br />
• Social drivers influence human perceptions<br />
and attitudes about the environment,<br />
including water resources, in<br />
turn influencing the pressures people<br />
exert on water through water demands<br />
and uses.<br />
• Changes in lifestyles are one of the<br />
principal drivers of change. They<br />
reflect human needs, desires and<br />
attitudes (as illustrated in consumption<br />
and production patterns), which<br />
are influenced by such social drivers<br />
36 World Water Development Report 3
demographic, economic and social drivers<br />
PART<br />
1<br />
as culture and education and by<br />
economic drivers and technological<br />
innovation; the rapid global rise in living<br />
standards combined with population<br />
growth presents the major threat<br />
to the sustainability of water resources<br />
and the environment.<br />
Social drivers are mainly about individual<br />
rather than collective actions and about<br />
the way people think and act on a day-today<br />
basis. The four social drivers considered<br />
here are poverty, education, cultures<br />
and value systems, and lifestyles and<br />
consumption patterns.<br />
Poverty<br />
Poverty leaves people with few choices.<br />
They must do what is necessary for their<br />
survival, whatever the environmental<br />
consequences. Slash-and-burn agricultural<br />
practices, overexploitation of inland fisheries<br />
and the proliferation of informal settlements<br />
around urban areas in developing<br />
countries attest to this reality. And even as<br />
many developing countries have addressed<br />
problems of hunger and malnutrition,<br />
water quality has been degraded and per<br />
capita water availability has worsened. The<br />
poorest communities are also commonly<br />
in areas most vulnerable to the impacts of<br />
climate change and variability, including<br />
unstable hillsides and low-lying coastal<br />
areas, and lack the capacity to cope with<br />
natural disasters.<br />
The inadequate water resources and sanitation<br />
facilities associated with poverty result<br />
in such environmental consequences<br />
as water pollution and degraded aquatic<br />
ecosystems, often the source of poor<br />
people’s livelihoods. High levels of waterassociated<br />
disease (such as schistosomiasis,<br />
malaria, trachoma, cholera and typhoid)<br />
are also common. And many people living<br />
in poverty engage in artisanal activities,<br />
such as metal working, that can generate<br />
large quantities of water pollutants.<br />
Poor people often pay the highest relative<br />
prices for water. Inhabitants of informal<br />
settlements, for example, do not normally<br />
receive water delivery services from central<br />
water supply agencies, but typically pay<br />
exorbitant prices for drinking water (sometimes<br />
of dubious quality) from local water<br />
dealers. And in rural areas in developing<br />
countries people can spend hours each day<br />
fetching water.<br />
History suggests that some initial level of<br />
economic development may be necessary<br />
before attention is given to environmental<br />
sustainability. However, there is sufficient<br />
evidence to believe that the two may not<br />
necessarily be in conflict. First, some processes<br />
are irreversible (for example aquifer<br />
depletion and contamination) and need to<br />
be halted now. Second, the state of water resources<br />
– and the environment in general –<br />
affects the poor disproportionately, so attention<br />
to environmental sustainability must<br />
especially recognize their urgent needs. And<br />
third, investments in environmental protection,<br />
water management and water supply<br />
and sanitation services, among others, can<br />
have high pay-offs in economic benefits.<br />
But whatever actions are taken to reduce<br />
poverty, it must also be recognized that<br />
increasing the economic well-being of<br />
the very poor will ultimately translate<br />
into higher demand for natural resources,<br />
including water. This will require tradeoffs,<br />
especially where these resources are<br />
lacking or over-exploited.<br />
Education<br />
An educated populace typically has a better<br />
understanding of the need for sustainable<br />
use of aquatic ecosystems and the important<br />
environmental goods and services<br />
they provide. Education can also lead to<br />
greater water use efficiency. For example,<br />
knowledge of water systems, new materials<br />
and emerging technologies (such as package<br />
treatment plants) can help extend water<br />
services to informal areas. Knowledge of<br />
water conservation practices also facilitates<br />
improved water use efficiency in these areas.<br />
More education enables people to improve<br />
their economic circumstances, leading to<br />
empowerment, better health and longer<br />
life expectancy. At the community level<br />
the education of broad segments of society<br />
can accelerate the demographic transition,<br />
through declines in fertility and infant<br />
mortality rates (figure 2.3). An educated<br />
Figure 2.3<br />
Total fertility rate (births per woman)<br />
8<br />
7<br />
6<br />
5<br />
4<br />
3<br />
2<br />
Whatever actions<br />
are taken to reduce<br />
poverty, it must<br />
also be recognized<br />
that increasing the<br />
economic wellbeing<br />
of the very<br />
poor will ultimately<br />
translate into<br />
higher demand for<br />
natural resources,<br />
including water<br />
The fertility rate declines with rising female<br />
literacy, 1990<br />
1<br />
0<br />
10 20 30 40 50 60 70 80 90 100<br />
Literacy rate, adult females (percent)<br />
Source: Institute for Statistics 2006; World Population Prospects Database.<br />
Water in a changing world 37
PART<br />
1<br />
Chapter 2<br />
An educated<br />
populace typically<br />
has a better<br />
understanding<br />
of the need for<br />
sustainable use of<br />
aquatic ecosystems<br />
and the important<br />
environmental<br />
goods and services<br />
they provide.<br />
Education can also<br />
lead to greater<br />
water use efficiency<br />
society is also more likely to be democratic<br />
and politically stable, working to reduce<br />
inequity and promote the acceptance of<br />
cultural diversity. Thus, education not only<br />
fosters economic growth, but also increases<br />
expectations of a better quality of life for<br />
individuals, their families and society.<br />
While education is fundamental to improved<br />
economic and social well-being,<br />
in many fast-growing countries in Africa,<br />
South Asia and elsewhere, the predicted<br />
growth in population is likely to depress<br />
school enrolment. Because of budget and<br />
capacity constraints, schools may not<br />
be able to cope with the growth in the<br />
number of children to be enrolled.<br />
In many settings access to schooling also<br />
is linked to improved access to safe drinking<br />
water and sanitation facilities. Separate<br />
sanitation facilities in schools for boys<br />
and girls have been shown to increase the<br />
attendance of girls and are also important<br />
for maintaining a minimum comfort level<br />
for female teachers. Improving access to<br />
water and sanitation facilities, by increasing<br />
family incomes, enables households<br />
to pay for school fees and equipment. And<br />
a reduced incidence of water- and sanitation-related<br />
diseases contributes to less<br />
absenteeism and better performance.<br />
Culture and values<br />
Culture describes the patterns of human<br />
activities and the symbolic structures that<br />
impart significance and importance to<br />
these activities (such as art, institutions,<br />
science, beliefs and moral systems). Because<br />
such structures are passed from generation<br />
to generation, culture can be defined as the<br />
way of life for an entire society.<br />
In several regions the empowerment of<br />
women has emerged as an important<br />
driver, particularly at the household and<br />
community levels. As described in box 2.3,<br />
this ongoing process brings about social,<br />
environmental and health benefits that<br />
can have positive repercussions for the<br />
community as a whole in how water services<br />
are received and managed.<br />
The perceived values of natural resources<br />
reflect cultural perspectives as well as<br />
economic perspectives. Lakes and reservoirs,<br />
for example, provide many valuable<br />
services, including water for drinking<br />
and sanitation, agriculture, industry and<br />
livestock uses and, in the case of reservoirs,<br />
for electricity generation. They<br />
serve as buffers against water shortages<br />
and excesses and as contaminant sinks<br />
for their drainage basins. They provide<br />
food and economic livelihoods through<br />
fisheries, aquaculture and environmental<br />
tourism. They are important aquatic ecosystems<br />
and provide habitat for rare and<br />
threatened species. And they can possess<br />
important cultural and religious values<br />
that emphasize humanity’s connections<br />
to the natural world. Which of these uses<br />
are pursued or emphasized depends largely<br />
on the cultural perspectives and economic<br />
values assigned to them by society.<br />
One of the most powerful manifestations<br />
of cultural values is religious belief. Many<br />
religions describe the role of humanity<br />
as both a moulder and a steward of the<br />
environment. Virtually all of the world’s<br />
major religions see a spiritual challenge<br />
in the ecological crises evident today. 19<br />
Religious beliefs that highlight humanity<br />
as a steward, rather than master, of the environment<br />
can be a powerful influence in<br />
developing and sustaining the awareness<br />
of societies and communities of their roles<br />
in using and conserving natural resources,<br />
including water.<br />
Box 2.3<br />
The role of women within the water sector and the importance of gender mainstreaming<br />
In most developing countries gender<br />
inequity persists in access to and control<br />
of a range of productive, human and<br />
social capital assets. Consequently, the<br />
core components of poverty (capability,<br />
opportunity, security and empowerment)<br />
differ along gender lines.<br />
In the water sector women labour to<br />
provide water for household needs while<br />
men make decisions about water resources<br />
management and development at both<br />
the local and national levels. Women draw<br />
water for household use, transport it home<br />
and store it until it is used for cooking,<br />
cleaning and washing. In areas of low water<br />
coverage women collect water from drains,<br />
ditches or streams that are often infected<br />
with pathogens and bacteria, causing<br />
severe illness or even death. In addition,<br />
women spend considerable time collecting<br />
water at the expense of income-generating<br />
activities. This also exposes them to sexual<br />
abuse and other forms of violence and<br />
leaves less time for girls to attend school.<br />
Lessons from Africa and the rest of the<br />
world have demonstrated that increased<br />
participation by women in decision-making<br />
leads to better operation and maintenance<br />
of water facilities, better health for the<br />
community, greater privacy and dignity for<br />
women, more girls attending school and<br />
increased income opportunities for women.<br />
The immediate action by water sector<br />
participants is to ensure gender mainstreaming<br />
in any planned action, including<br />
legislation, policies and programmes in all<br />
areas and at all levels. This will ensure that<br />
the voices of marginalized and disadvantaged<br />
women and men are integrated in<br />
design, implementation, monitoring and<br />
evaluation of policies and programmes<br />
and therefore help to achieve sustainable<br />
water provision for all.<br />
Source: Adapted from Mutagamba 2008.<br />
38 World Water Development Report 3
demographic, economic and social drivers<br />
PART<br />
1<br />
Religious beliefs can also sometimes accelerate<br />
the degradation of these resources.<br />
One example is the Hindu practice of<br />
cremating their deceased family members<br />
in funeral pyres and placing their ashes<br />
into the Ganges River, which is considered<br />
holy. However, incomplete cremation<br />
results in incompletely burned human<br />
remains being put into the river, causing<br />
degraded water quality and increasing<br />
the potential for the transmission of<br />
waterborne diseases. The custom is deeply<br />
rooted in religious beliefs, making it difficult<br />
to address with a strictly scientific<br />
rationale. Religious significance has been<br />
observed for water systems in other societies<br />
around the world.<br />
Lifestyles and consumption patterns<br />
Lifestyles and associated consumption<br />
choices are increasingly considered the most<br />
important drivers affecting water resources,<br />
along with population growth. And the<br />
pressures these drivers generate can be<br />
transmitted through trade and investment<br />
activities to other regions. As standards<br />
of living rise in developing countries and<br />
countries undergoing economic transition,<br />
the demand for larger homes and for ‘luxury’<br />
items such as kitchen appliances, cars<br />
and other vehicles and the energy to run,<br />
heat and or cool them is increasing the demand<br />
for the resources required to produce,<br />
generate and operate them. Thus, humanity’s<br />
environmental footprint is expanding<br />
dramatically. And despite some laudable<br />
efforts to develop cleaner technologies to<br />
shrink this footprint (see chapter 3), population<br />
growth and the changing lifestyles and<br />
consumption choices associated with rising<br />
living standards will continue to threaten<br />
the sustainability of water resources and the<br />
environment.<br />
The evolution of eating habits and changes<br />
in diets as living standards rise are among<br />
the most important drivers of agricultural<br />
water use for several crops in many<br />
countries. The quantity of water used per<br />
person for food production depends on<br />
a society’s dietary habits, in particular<br />
on the relative importance of meat and<br />
dairy products in diets. Massive social and<br />
economic changes taking place in many<br />
developing countries are lifting millions of<br />
people out of poverty and creating a new<br />
middle class with increasing demands for<br />
such food as milk, bread, eggs, chicken<br />
and beef to complement their traditional<br />
and less water-intensive diets. 20<br />
A simple calculation illustrates the impacts<br />
of changing food habits on water<br />
resources. It is estimated that the Chinese<br />
consumer who ate 20 kilograms (kg) of<br />
meat in 1985 will eat more than 50 kg in<br />
2009, 21 increasing demand for grain to<br />
feed livestock. Assuming that 1 kg of grain<br />
requires 1,000 liters of water to produce,<br />
the annual water footprint of this change<br />
in diet for some 1.3 billion Chinese will<br />
translate into a need for 390 cubic kilometres<br />
(km 3 ) of water. Similar changes are<br />
taking place in other countries with growing<br />
economies. For the extremely poor,<br />
eating even two meals a day instead of one<br />
can substantially increase per capita water<br />
consumption (see box 7.4 in chapter 7).<br />
As this example suggests, lifestyles and<br />
consumption patterns are, in essence, the<br />
sum of all drivers. They bring together<br />
economic growth, technological innovation,<br />
the evolution of culture and values,<br />
population dynamics (population growth<br />
and the number of people who have<br />
reached a certain standard of living) and<br />
governance (how wealth is distributed).<br />
Challenges<br />
Once people’s survival needs are met, their<br />
wants become more prominent. These<br />
wants usually focus on increasing human<br />
comfort and convenience and are generally<br />
associated with rising consumption of material<br />
goods and non-essential services such<br />
as travel and leisure. The desire for a better<br />
lifestyle is arguably one of the most powerful<br />
human motivations, and the rapid global<br />
rise in living standards, combined with<br />
population growth, poses the major threat<br />
to the sustainability of water resources and<br />
the environment. The production of goods<br />
to satisfy these growing human wants is<br />
often not possible without the overuse<br />
of natural resources. Further, it is accompanied<br />
by the production of wastes and<br />
other non-useful by-products. Unrestrained<br />
fulfillment of the desire for a better lifestyle<br />
will be accompanied by environmental<br />
stresses, many of them unprecedented.<br />
The major challenge is to reconcile human<br />
needs and human wants with the ability<br />
of nature to provide or replenish the<br />
resources to produce them. Global society<br />
must address the dual goal of enhancing<br />
human well-being and lifestyles while<br />
ensuring the sustainability of the ecosystems<br />
and environmental conditions that<br />
provide the desired goods and services.<br />
Achieving this goal will prove impossible<br />
unless humans recognize and better understand<br />
the links between their actions<br />
and the condition and sustainability of the<br />
natural environment. Raising awareness<br />
to bring about behavioural change is one<br />
approach, but a still elusive goal.<br />
The desire for a<br />
better lifestyle<br />
is arguably one<br />
of the most<br />
powerful human<br />
motivations, and<br />
the production of<br />
goods to satisfy<br />
these growing<br />
human wants<br />
is often not<br />
possible without<br />
the overuse of<br />
natural resources<br />
Water in a changing world 39
PART<br />
1<br />
Chapter 2<br />
Notes<br />
1.<br />
2.<br />
3.<br />
4.<br />
5.<br />
6.<br />
Hinrichsen, Robey, and Upadhyay 1997.<br />
United Nations 2007.<br />
UNFPA 2007.<br />
United Nations 2006a.<br />
Morton, Boncour, and Laczko 2008.<br />
UNFPA 2007.<br />
7. Klaus Töpfer, former head of the United<br />
Nations Environment Programme, talks<br />
of 22-24 million environmental migrants<br />
(Biermann 2001), whereas Norman<br />
Myers (2005) reports ‘at least’ 25 million<br />
in 1995 (latest date for a comprehensive<br />
assessment), especially in the African<br />
Southern Sahara, Central America,<br />
China and South Asia. Myers expects the<br />
number to reach 50 million by 2010.<br />
The United Nations Refugee Agency<br />
(UNHCR 2002, p. 12) estimated that<br />
there were approximately 24 million<br />
people around the world who fled their<br />
homes because of floods, famine and<br />
other environmental factors. Christian<br />
Aid released a report in 2007 estimating<br />
that up to 685 million people were<br />
forced to move because of environmental<br />
factors, including development<br />
projects such as dams that inundated<br />
large areas of inhabited land. All of these<br />
estimates are from OSCE (2007).<br />
8. More information on the revised forecast<br />
can be found in IMF 2008a.<br />
9. Poddar and Yi 2007.<br />
10. SIWI 2005.<br />
11. World Bank 2008.<br />
12. United Nations 2008.<br />
13. Commission on Growth and Development<br />
2008.<br />
14. High Level Conference on World Food<br />
Security 2008, article 7.f.<br />
15. IEA 2006.<br />
16. WBCSD 2006.<br />
17. World Economic Forum 2008.<br />
18. Wiggins 2008.<br />
19. Bassett, Brinkman, and Pedersen 2000.<br />
20. Wiggins 2008.<br />
21. Wiggins 2008.<br />
References<br />
Bassett, Libby, John T. Brinkman, and<br />
Kusumita P. Pedersen. 2000. Earth<br />
and Faith. A Book of Reflection for Action.<br />
Nairobi: Interfaith Partnership for the Environment<br />
and United Nations Environment<br />
Programme.<br />
Commission on Growth and Development.<br />
2008. The Growth Report: Strategies<br />
for Sustained Growth and Inclusive<br />
Development. Conference Edition. Washington,<br />
DC: World Bank.<br />
EIA (Energy Information Administration).<br />
2008. Annual Energy Review 2007.<br />
Washington, DC: Government Printing<br />
Office. www.eia.doe.gov/emeu/aer/pdf/<br />
aer.pdf.<br />
FAO (Food and Agriculture Organization<br />
of the United Nations). 2008. Declaration<br />
of the High-Level Conference on<br />
World Food Security: The Challenges of<br />
Climate Change and Bioenergy. High<br />
Level Conference on World Food Security,<br />
3-5 June, Rome.<br />
Gallopín, G. C., and F. Rijsberman. 2000.<br />
Three Global Water Scenarios. International<br />
Journal of Water 1 (1): 16-40.<br />
Hinrichsen, D., B. Robey, and U. D. Upadhyay.<br />
1997. Solutions for a Water-Short<br />
World. Population Reports Series M, no.<br />
14. Baltimore, MD: Population Information<br />
Program, Johns Hopkins School of<br />
Public Health.<br />
Hoekstra, A. Y., and A. L. Chapagain.<br />
2008. Globalization of Water: Sharing the<br />
Planet’s Freshwater Resources. Oxford:<br />
Blackwell Publishing.<br />
IEA (International Energy Agency). 2006.<br />
World Energy Outlook 2006. Paris: Organisation<br />
for Economic Co-operation and<br />
Development, and International Energy<br />
Agency.<br />
IMF (International Monetary Fund).<br />
2008a. World Economic Outlook Update:<br />
Rapidly Weakening Prospects Call<br />
for New Policy Stimulus. Washington,<br />
DC: International Monetary Fund. www.<br />
imf.org/external/pubs/ft/weo/2008/<br />
update/03/.<br />
———. 2008b. World Economic Outlook: Financial<br />
Stress, Downturns, and Recoveries.<br />
Washington, DC: International Monetary<br />
Fund.<br />
Institute for Statistics. 2006. World Education<br />
Indicators Data Centre Literacy Statistics.<br />
Paris: United Nations Educational,<br />
Scientific and Cultural Organization.<br />
Lutz, W., W. Sanderson, and S. Scherbov.<br />
2008. The Coming Acceleration of<br />
Global Population Ageing. Nature 451<br />
(20): 716-19.<br />
Morton, A., P. Boncour, and F. Laczko.<br />
2008. Human Security Policy Challenges.<br />
Forced Migration Review: Climate Change<br />
and Displacement. Issue 31. Oxford,<br />
United Kingdom: Refugee Studies Centre,<br />
University of Oxford.<br />
Mutagamba, Maria Lubega. 2008. The<br />
Role of Women within the Water Sector<br />
and The Importance of Gender Mainstreaming.<br />
The 5th World Water Forum<br />
Newsletter 4.<br />
Pacific Institute. 2007. At the Crest of a Wave:<br />
A Proactive Approach to Corporate Water<br />
Strategy. Oakland, CA: Business for Social<br />
Responsibility and the Pacific Institute.<br />
Poddar, Tushar, and Eva Yi. 2007. Global<br />
Economics Paper Issue no. 152: India’s<br />
Rising Growth Potential. Goldman Sachs<br />
Global Economic Website, Goldman<br />
Sachs. http://usindiafriendship.net/viewpoints1/Indias_Rising_Growth_Potential.<br />
pdf.<br />
SIWI (Stockholm International Water<br />
Institute). 2005. Making Water a Part of<br />
Economic Development: The Economic<br />
Benefits of Improved Water Management<br />
and Services. Stockholm: Stockholm<br />
International Water Institute.<br />
United Nations. 2006a. Trends in Total<br />
Migrant Stock: The 2005 Revision. New<br />
York: Population Division, Department<br />
of Economic and Social Affairs, United<br />
Nations.<br />
———. 2006b. World Urbanisation Prospects:<br />
The 2005 Revision. Fact Sheet 3. New<br />
York: Population Division, Department of<br />
Economic and Social Affairs, United Nations.<br />
www.un.org/esa/population/publications/WUP2005/2005WUP_FS3.pdf.<br />
———. 2007. World Population Prospects:<br />
The 2006 Revision. New York: Population<br />
Division, Department of Economic and<br />
Social Affairs, United Nations.<br />
———. 2008. World Economic and Social Survey<br />
2008: Overcoming Economic Insecurity.<br />
New York: Department of Economic and<br />
Social Affairs, United Nations.<br />
UN-HABITAT (United Nations Human<br />
Settlements Programme). 2006. State<br />
of the World’s Cities 2006/7. London:<br />
Earthscan.<br />
UNFPA (United Nations Population Fund).<br />
2007. State of World Population 2007:<br />
Unleashing the Potential of Urban Growth.<br />
New York: United Nations Population<br />
Fund.<br />
UNICEF (United Nations Children’s Fund).<br />
2006a. Childinfo: Monitoring the Situation<br />
of Children and Women, Child Mortality<br />
Info Database. www.childmortality.<br />
org/.<br />
———. 2006b. The State of the World’s Children<br />
2007: The Double Dividend of Gender<br />
Equality. New York: United Nations<br />
Children’s Fund.<br />
WBCSD (World Business Council on<br />
Sustainable Development). 2006. Business<br />
in the World of Water: WBCSD Water<br />
Scenarios to 2025. Washington, DC:<br />
World Business Council on Sustainable<br />
Development.<br />
Wiggins, Jenny. 2008. Feature: Developing<br />
Tastes. Financial Times Magazine, 27-28<br />
January. www.ft.com/cms/s/0/8e606e1e<br />
-cbb2-11dc-97ff-000077b07658.html<br />
?nclick_check=1<br />
World Bank. 2008. World Development Indicators<br />
2008. Washington, DC: World Bank.<br />
World Economic Forum. 2008. Managing<br />
Our Future Water Needs for Agriculture,<br />
Industry, Human Health, and the Environment.<br />
Discussion Document for the<br />
World Economic Forum Annual Meeting<br />
2008. www.european-waternews.com/<br />
download/whitepaper_uploadfile_2.pdf.<br />
40 World Water Development Report 3
demographic, economic and social drivers<br />
Chapter 3<br />
Technological<br />
innovation<br />
PART<br />
1<br />
Authors: Richard Connor and Walter Rast<br />
Contributor: Gunilla Björklund<br />
Coordinator: Tim Kasten (UNEP)<br />
Facilitator: Richard Connor<br />
Key messages<br />
Technological innovation is driven largely by both human<br />
wants and needs.<br />
Technological innovation can create both positive and negative<br />
pressures, sometimes simultaneously, resulting in increased or<br />
decreased water demand, supply and quality.<br />
Technological innovation is one of the most unpredictable drivers.<br />
It can create rapid, dramatic and unexpected changes, both<br />
in pressures and solutions.<br />
Impediments to the dissemination of technology must be overcome<br />
if developing countries are to benefit from innovations<br />
developed in richer countries.<br />
Technological change takes different<br />
forms, each with different potential<br />
impacts on the environment. Some innovations<br />
reduce environmental pressures<br />
(by lowering emissions or using water<br />
resources more efficiently, for example),<br />
while others increase them (by increasing<br />
water demands for their production, for<br />
example). Most innovations create both<br />
positive and negative pressures on the<br />
environment, while the main purpose of<br />
technology is to make processes (production,<br />
transformation and communication,<br />
for example) more efficient, which generally<br />
means more cost-effective, the environmental<br />
benefits of some technologies have<br />
also yielded broader economic benefits. In<br />
recent decades, for example, greater environmental<br />
regulation and corporate social<br />
responsibility, combined with pressures<br />
from society, have prompted cleaner and<br />
more environmentally friendly technologies<br />
and increased their overall value.<br />
Disseminating technology is as important<br />
as developing it. Controls on the dissemination<br />
of technology, especially from<br />
developed countries (where much of the<br />
technology is generated) to developing<br />
countries (which are less able to afford or<br />
generate it), inhibit the ability of developing<br />
countries to stay economically and<br />
environmentally competitive.<br />
In the water sector the expansion of<br />
scientific knowledge and technological<br />
applications is changing the way water is<br />
used, cleaned and reused to meet human,<br />
economic and environmental needs.<br />
Industries are investing in new technologies<br />
and processes that reduce water use<br />
and wastewater discharges. Household<br />
consumers are being offered water-saving<br />
technologies such as low-flush toilets,<br />
low-flow showers and faucet aerators.<br />
Agricultural productivity is being leveraged<br />
by drip irrigation and maintained by<br />
soil fertility and conservation techniques.<br />
Water supplies are being enhanced in<br />
many countries through innovative wastewater<br />
treatment and reuse techniques.<br />
And breakthroughs continue in desalination:<br />
advances in technologies and energy<br />
efficiency in the past decade have made<br />
Water in a changing world 41
PART<br />
1<br />
Chapter 3<br />
Water supplies are<br />
being enhanced<br />
in many countries<br />
through innovative<br />
wastewater<br />
treatment and<br />
reuse techniques<br />
desalination an economic option for water<br />
supplies in coastal cities (see figure 9.3 and<br />
box 9.5 in chapter 9). 1<br />
This chapter looks at six areas – in which<br />
water-related technologies are emerging<br />
rapidly – that are likely to exert strong<br />
pressures on the supply, use and management<br />
of water resources: environmental research<br />
and development, renewable energy,<br />
information and communications technology,<br />
biotechnology, bioenergy and nanotechnology.<br />
It also describes the challenges<br />
and difficulties associated with the dissemination<br />
of technology, which is especially<br />
important for developing countries.<br />
Recent trends and advances in<br />
science and technology<br />
Key message<br />
• Technological innovation is driven<br />
largely by both human wants and<br />
needs.<br />
People are the ultimate drivers of change<br />
on a global scale, through both their<br />
needs (their requirements for survival) and<br />
their wants (their desires for products and<br />
services that enhance safety, comfort and<br />
well-being). Although not true everywhere<br />
or to the same degree, technological<br />
advances that address these wants and<br />
needs are a major reason why many people<br />
enjoy a standard of living that includes<br />
access to safe drinking water and adequate<br />
sanitation.<br />
It is sometimes difficult to determine<br />
whether technology development drives<br />
water demands or whether increasing water<br />
demands associated with human activities<br />
drive technology. Some new technologies<br />
can have positive benefits – reducing water<br />
demand and increasing water availability<br />
(for example, rainwater harvesting) – while<br />
others can increase water demands (such<br />
as using crops to produce bioenergy). In<br />
analysing technological advances and<br />
interventions, it is also useful to distinguish<br />
their structural elements (such as<br />
construction of a plant, dam or irrigation<br />
system) and their non-structural elements<br />
(including public awareness campaigns,<br />
educational programmes and information<br />
sharing). This section outlines some key<br />
technology areas and provides some insight<br />
on how new developments can affect<br />
water resources.<br />
Environmental research and<br />
development<br />
Many developed countries have increased<br />
their investment in environmental<br />
research and development (R&D) to<br />
encourage new technologies to improve<br />
environmental quality (figure 3.1). Perhaps<br />
more important, developed countries also<br />
encourage research by the private sector<br />
through subsidies and tax incentives<br />
for specific types of research. This has<br />
been much less the case in most developing<br />
countries, however, because of the<br />
many competing claims on their limited<br />
financial resources. Thus, the main path<br />
of technology transfer is from developed<br />
countries to developing countries.<br />
The focus of the R&D activities varies with<br />
national sustainable development priorities<br />
and interests and available funding.<br />
Germany, for example, has focused on<br />
clean processes and production technologies,<br />
Norway on energy and the environment<br />
and the United States on climate,<br />
water and hydrogen as an energy source.<br />
5<br />
4<br />
3<br />
Figure 3.1<br />
Many developed countries have increased<br />
their investment in environmental research<br />
and development<br />
Share of environmental R&D in total government R&D, 1981-2005 (percent)<br />
Korea, Rep.<br />
Germany<br />
France<br />
There also appears to be a correlation<br />
between environmental regulations and<br />
environmental technology, with regulation<br />
spurring industries and water use sectors<br />
to address water availability and water<br />
quality. Environmental regulations may be<br />
counterproductive in facilitating environmental<br />
technology in some situations,<br />
however, since once required standards are<br />
met, incentives to engage in further technology<br />
development may dissipate.<br />
2<br />
United Kingdom<br />
1<br />
0<br />
1981 1985<br />
1990<br />
Source: Based on OECD 2008.<br />
1995<br />
Japan<br />
United States<br />
2000<br />
2005<br />
Renewable energy<br />
The renewable energy sector has seen<br />
remarkable innovation over the past two<br />
decades. Innovation has accelerated in<br />
response to recent public and political<br />
pressure to reduce greenhouse gas emissions<br />
thought to be contributing to<br />
global climate change. First-generation<br />
42 World Water Development Report 3
technological innovation<br />
PART<br />
1<br />
(hydropower and biomass combustion)<br />
and second-generation (solar heating and<br />
wind power) technologies are now being<br />
followed by third-generation technologies<br />
such as concentrated solar power, ocean<br />
energy, enhanced geothermal systems and<br />
integrated bioenergy systems. As these<br />
innovations have lowered relative costs,<br />
the use of renewable energy resources has<br />
risen worldwide (figure 3.2).<br />
If current policies are maintained, global<br />
energy demands are expected to grow by<br />
as much as 55% through 2030, according<br />
to the International Energy Agency. 2 China<br />
and India alone would account for about<br />
45% of this projected increase (based on<br />
conservative economic growth figures), and<br />
developing countries overall for 74%. Electricity<br />
generation from hydroelectric and<br />
other renewable energy resources is projected<br />
to increase at an average annual rate of<br />
1.7% between 2004 and 2030, for an overall<br />
increase of 60%. Although renewable<br />
energy would still account for only a small<br />
part of total energy demand, the increase in<br />
renewable energy production could have a<br />
large impact on water resources, especially<br />
increases in hydropower generation.<br />
Future development of hydropower will<br />
be limited by two main factors. One is<br />
the spatial and geophysical potential for<br />
new hydropower installations. In many<br />
developed countries, including Australia,<br />
the United States and much of Western<br />
Europe, most of the suitable sites for hydropower<br />
installations have already been<br />
developed (see map 7.6 in chapter 7). The<br />
second limiting factor is financial investment<br />
capacity, which has been the primary<br />
constraint in developing countries,<br />
including in most of Africa. Pressure from<br />
environmental groups opposed to dams,<br />
particularly to large dams, may also constrain<br />
future hydropower development.<br />
Since renewable energy resources alone are<br />
not sufficient to meet the predicted dramatic<br />
increase in energy demands through<br />
2030, fossil fuel extraction and development<br />
of nuclear energy will continue to<br />
increase, as will their impacts on water<br />
resources and the environment. Coal consumes<br />
about 2 cubic metres (m 3 ) of water<br />
per megawatt hour of electricity generated,<br />
nuclear power about 2.5 m 3 and petroleum<br />
about 4 m 3 . Extracting petroleum from<br />
Canada’s tar sands, which have received<br />
much criticism as an ‘unclean’ source of<br />
oil, consumes an estimated 20-45 m 3 of<br />
water per megawatt hour, nearly 10 times<br />
that for conventional oil extraction. Thus,<br />
as fossil fuel sources become increasingly<br />
Figure 3.2<br />
Average annual change in renewable energy production, 1990-2004 (percent)<br />
25<br />
20<br />
15<br />
10<br />
5<br />
0<br />
World<br />
OECD<br />
Solid<br />
biomass<br />
Geothermal<br />
Source: Based on OECD 2008.<br />
The use of renewable energy sources rose<br />
worldwide between 1990 and 2004<br />
Hydro<br />
Waste/biogas/<br />
liquid biomass<br />
inaccessible, the water footprint of oil tar<br />
sands is likely to increase dramatically.<br />
Information and communications<br />
technology<br />
Advances in information and communications<br />
technology can affect the cost and<br />
effectiveness of monitoring ecosystem<br />
health and quality. Reductions in the costs<br />
of sensors, coupled with satellite-based<br />
wireless data transfer, have greatly facilitated<br />
the monitoring of water resources<br />
(water quality, water levels, flow rates and<br />
so on) and the delivery of water-related<br />
services, all in real time.<br />
Improved monitoring through advanced<br />
information and communications technology<br />
can intensify the environmental<br />
effectiveness of policy measures, from the<br />
improved tracking of potentially hazardous<br />
materials to the monitoring of emissions<br />
from large stationary and smaller diffuse<br />
(non-point) and mobile sources. The<br />
greatest number of patents for monitoring<br />
environmental impacts between 1978<br />
and 2002 was granted for water pollution<br />
treatment, attesting to the importance of<br />
information and communications technology<br />
innovations in the sustainable management<br />
of water resources. Still lacking,<br />
however, are adequate original field data<br />
required for ground-proofing, monitoring<br />
and forecasting data and for informed<br />
decision-making (see also chapter 14).<br />
Biotechnology and genetically<br />
modified organisms<br />
Plant and animal breeding has increased<br />
agricultural productivity and therefore<br />
affected water productivity. Progress has<br />
been concentrated in crop and animal productivity<br />
and resistance to pests, disease<br />
and weather extremes.<br />
Solar<br />
Wind<br />
Total primary<br />
energy supply<br />
Water in a changing world 43
PART<br />
1<br />
Chapter 3<br />
Biotechnology can<br />
have a valuable<br />
role in addressing<br />
water scarcity and<br />
quality challenges<br />
in both developed<br />
and developing<br />
countries,<br />
especially in<br />
agriculture<br />
The green revolution of the 1970s and<br />
1980s is an example of the dramatic effects<br />
of how taking advantage of technological<br />
advances can improve the livelihoods and<br />
incomes of the poor. The principal technologies<br />
involved in the green revolution<br />
were irrigation, fertilizer and pest control,<br />
together with high-yielding varieties of<br />
maize, wheat and rice. The green revolution<br />
in Asia doubled cereal production<br />
during 1970-95, while increasing the land<br />
area devoted to cereals by only 4%. By the<br />
late-1990s it was clear that many people,<br />
including segments of the poorest population<br />
groups, had reaped substantial benefits<br />
from higher incomes, less expensive<br />
food and increased demand for their labour<br />
associated with the green revolution.<br />
The green revolution also demonstrates<br />
that unintended consequences can accompany<br />
new technologies. The excessive<br />
use of agrochemicals has polluted<br />
waterways, while wasteful irrigation has<br />
contributed to water scarcity in some areas<br />
and to water logging and soil salinization<br />
in others. High livestock concentrations<br />
have contributed to the spread of disease.<br />
As monoculture of crops for export or for<br />
use as animal feed replaced traditional<br />
polyculture techniques, the economic outcomes<br />
for some small farmers deteriorated<br />
as increased production of cereal crops<br />
caused prices to fall and crop susceptibility<br />
to pests and plant diseases spread. Increased<br />
agricultural production also led to<br />
higher water demands, exacerbating water<br />
scarcity problems in some arid and semiarid<br />
regions (see chapter 8).<br />
Genetically modified organisms are a more<br />
recent agricultural advance. A genetically<br />
modified organism is an organism whose<br />
genome has been altered through genetic<br />
engineering. A large share of food crops,<br />
such as corn, cotton and soybeans, have<br />
been genetically modified to increase<br />
yields and resistance to pests and chemical<br />
herbicides. Although this technology offers<br />
the potential for developing droughtresistant<br />
crops, with obvious advantages<br />
for water-scarce regions, little progress<br />
has been made towards this goal, and<br />
no breakthrough is expected in the near<br />
future.<br />
Micro-organisms are an especially promising<br />
avenue, since there is considerable<br />
knowledge and experience in genetic<br />
experimentation with them. As decomposers<br />
of organic material, they are capable<br />
of breaking down or otherwise neutralizing<br />
many types of polluting materials<br />
in the environment. Micro-organisms are<br />
currently used, for example, in biological<br />
processes in municipal wastewater treatment<br />
plants to treat or break down organic<br />
materials in wastewater. Micro-organisms<br />
that can more efficiently break down oil<br />
pollution in aquatic ecosystems and soils<br />
following oil spills or other industrial<br />
accidents are receiving attention. Similar<br />
avenues may become evident for research<br />
into the treatment of other types of water<br />
pollutants.<br />
Bioenergy<br />
Bioenergy, derived most commonly from<br />
plant materials, is a renewable energy<br />
source that is less likely to increase carbon<br />
dioxide emissions that contribute to global<br />
warming (in contrast to fossil fuels, which<br />
return long-stored carbon to the atmosphere).<br />
Cellulose, including agricultural<br />
residues, waste products and woody biomass,<br />
is also showing promise as a bioenergy<br />
source (see chapter 7).<br />
This new technology is not without<br />
problems. For maize and sugarcane used<br />
to create bioenergy, a major problem is the<br />
need for large quantities of water to grow<br />
the crops (see box 7.2 in chapter 7) and for<br />
considerable quantities of fossil fuel energy<br />
for tillage, fertilizers, pesticides, irrigation,<br />
harvesting and transport machinery, and<br />
processing. 3 Research is currently focused<br />
on the development of second-generation<br />
bioenergy, converting wood, crop residues<br />
and other biomass sources into liquid biofuel.<br />
Non-food crops such as jatropha do<br />
not require the intensive management and<br />
soil quality that food crops need and therefore<br />
may not compete directly with food<br />
crops for resources (water and good agricultural<br />
land). Second-generation bioenergy<br />
technology has the potential to increase<br />
energy yields significantly, but may not be<br />
commercially viable for 5-10 years.<br />
Producing bioenergy from crops traditionally<br />
grown as food will require additional<br />
agricultural production to make up for the<br />
lost food sources, and more water as well.<br />
Increased bioenergy production has also<br />
resulted in a significant increase in some<br />
food prices by diverting grain traditionally<br />
grown for food. 4 More than one-third of<br />
maize production in the United States in<br />
2008 was being used to produce ethanol 5<br />
and about half the vegetable oils produced<br />
in the European Union were being used<br />
for biodiesel fuel. 6 Although the impact<br />
is extremely difficult to assess, bioenergy<br />
production is estimated to have caused<br />
up to 70%-75% of the rise in the global<br />
prices of some food stocks, including approximately<br />
70% of the increase in maize<br />
44 World Water Development Report 3
technological innovation<br />
PART<br />
1<br />
prices. 7 Higher energy prices worldwide<br />
and a weak US dollar are believed to have<br />
caused the remainder. 8<br />
Bioenergy production also causes environmental<br />
impacts unrelated to climate, particularly<br />
impacts arising from agricultural<br />
practices (see chapter 7). Examples include<br />
tillage-based soil erosion, eutrophication<br />
from fertilizer runoff, increased pesticide<br />
loads to aquatic habitats and biodiversity<br />
loss from land use changes. Further,<br />
the use of bioenergy could spawn other<br />
problems, as reductions in greenhouse gas<br />
emissions (from switching from fossil fuels<br />
to biofuels) could be offset by the clearing<br />
of new land to make room for more crop<br />
production. Cutting down forests could release<br />
carbon dioxide and reduce biodiversity.<br />
Under conditions of water scarcity,<br />
producing fuel for automobiles instead of<br />
producing food to feed a growing population<br />
becomes less socially acceptable,<br />
especially in developing countries.<br />
Nanotechnology<br />
Nanotechnology, the design and manufacture<br />
of extremely small electronic<br />
circuits and mechanical devices built at the<br />
molecular level of matter, shows particular<br />
promise for water resources. Key areas are<br />
desalinization (see box 9.5 in chapter 9),<br />
water purification, wastewater treatment<br />
and monitoring. The first three areas involve<br />
the use of nanofiltration technology,<br />
nanomaterials and nanoparticles to remove<br />
or reduce water contaminants. Monitoring<br />
involves the use of nanosensors.<br />
Many nanotechnology-based approaches<br />
are less a major departure from traditional<br />
methods of addressing such issues than<br />
a means of improving existing applications<br />
and devices. 9 Seawater desalinization<br />
plants are already in operation around the<br />
world, and many technologies can effectively<br />
remove microbes and other contaminants<br />
from water. And although operation<br />
efficiencies vary, wastewater treatment<br />
plants also exist in many developed and<br />
developing countries.<br />
Nanotechnology has the potential to<br />
greatly improve water quality and quantity<br />
through water treatment or remediation.<br />
Nanofiltration membranes and other<br />
advanced filtration materials can facilitate<br />
water desalinization and increased water<br />
reuse and recycling, improving desalinization<br />
efficiency and reducing associated<br />
costs (especially for energy). Another<br />
emerging area is the development of nanomaterials,<br />
which can act as a ‘sponge’ to<br />
enhance the removal of specific heavy<br />
metals from water supplies. Research is<br />
exploring the use of nanoparticles as<br />
catalysts for chemical reactions of other<br />
materials as a means of degrading them<br />
and for removing salts and heavy metals.<br />
Such treatments could be targeted to<br />
chemicals for which existing technologies<br />
are inefficient or costly and could eventually<br />
permit human use of heavily polluted<br />
and saline water for drinking, sanitation<br />
and irrigation.<br />
For water monitoring nanotechnology<br />
encompasses new and enhanced sensors<br />
for detecting biological and chemical<br />
water contaminants present in very low<br />
concentrations. New sensor technology,<br />
coupled with micro- and nanofabrication<br />
technology, may eventually lead to the<br />
development of highly accurate and portable<br />
sensors.<br />
There are also impediments to the largescale<br />
use of nanotechnologies to address<br />
water resources issues. While many<br />
nanotechnologies are already in use, many<br />
are still at varying stages of research or<br />
development. Thus, although such technology<br />
could help developing countries<br />
increase water treatment or remediation<br />
efficiency and reduce costs associated with<br />
traditional treatment methodologies, it<br />
is unclear when nanotechnology-based<br />
applications will be ready for wide-scale<br />
use. And even though nanotechnologies<br />
may prove very efficient and cost-effective<br />
over the long term, initial acquisition and<br />
application costs are high in many cases.<br />
Using such technologies also will require<br />
the technical capacity to maintain and<br />
operate them.<br />
There also are some risks associated with<br />
nanotechnology-based approaches, specifically<br />
the possibility that engineered<br />
nanoparticles used to catalyse chemical<br />
reactions may end up in water systems.<br />
Little is yet known about how such<br />
materials may interact with biological<br />
organisms, so the possibility of toxicity<br />
to humans and ecosystems must be<br />
considered.<br />
The technology dissemination<br />
challenge<br />
Key message<br />
• Technology is constantly evolving,<br />
and the availability of technologies<br />
can differ widely between developed<br />
and developing countries because<br />
of impediments to dissemination<br />
of research and adaptation to local<br />
conditions.<br />
Nanotechnology<br />
shows particular<br />
promise for<br />
desalinization,<br />
water purification,<br />
wastewater<br />
treatment and<br />
monitoring<br />
Water in a changing world 45
PART<br />
1<br />
Chapter 3<br />
With the bulk<br />
of technological<br />
innovation<br />
originating<br />
in developed<br />
countries,<br />
introducing<br />
appropriate<br />
technologies<br />
into developing<br />
countries is a<br />
key challenge of<br />
development<br />
Technological progress is both a determinant<br />
and an outcome of rising incomes.<br />
At the national level it can occur through<br />
invention and innovation, the adoption<br />
and adaptation of existing but new-tothe-market<br />
technologies and the spread of<br />
technologies across individuals, firms and<br />
the public sector within a country.<br />
With the bulk of technological innovation<br />
originating in developed countries,<br />
introducing appropriate technologies into<br />
developing countries is a key challenge of<br />
development. It requires both the willingness<br />
to transfer the technology and the<br />
capacity to pay for, absorb, adapt and use<br />
the technology so that it generates longterm<br />
benefits.<br />
Exporting technology to developing<br />
countries<br />
The number of patents and scientific<br />
journal articles focusing on technology is<br />
strongly correlated with GDP per capita. 10<br />
Most developing countries lack the ability<br />
to generate innovations at the technological<br />
frontier. Moreover, relatively undeveloped<br />
domestic technology sectors and the<br />
lure of better economic and scientific opportunities<br />
abroad draw highly educated<br />
nationals from many developing countries<br />
to cutting-edge research sectors in highincome<br />
countries.<br />
The lack of advanced technological competence<br />
in developing countries means<br />
that technological progress occurs there<br />
mainly through the adoption and adaptation<br />
of existing technologies. The penetration<br />
of older technologies, such as fixedline<br />
telephones, electric power networks,<br />
transportation, health care and water<br />
services – many ultimately provided by<br />
governments – has tended to lag behind<br />
that of newer technologies (figure 3.3).<br />
Many of these older technologies require<br />
infrastructure that is expensive to create<br />
and maintain and that relies on large<br />
numbers of people with scarce technical<br />
skills. In addition, the diffusion of older<br />
technologies today depends on the intensity<br />
and efficiency with which government<br />
services were delivered in the past, many<br />
of which have a poor record.<br />
The rates of acceptance and application<br />
of newer technologies have been higher<br />
than those of older technologies because<br />
rates of acceptance and application are<br />
more directly correlated with income. The<br />
infrastructure for newer technologies such<br />
as mobile phones and the Internet is generally<br />
less expensive to create and requires<br />
fewer (although more skilled) workers to<br />
operate and maintain. Moreover, with<br />
regulatory reform in many countries the<br />
private sector now offers these services in<br />
a competitive environment, rather than<br />
in the state-owned, monopolistic environments<br />
of the past. Supplying such new<br />
technologies has thus been more responsive<br />
to market demands and less constrained<br />
by the stringencies of government<br />
budgets or state enterprises. Furthermore,<br />
demands for such products have been<br />
boosted by low end-user costs, resulting<br />
from competitive pricing strategies, and<br />
the characteristics of some newer technologies<br />
that lend themselves to sharing more<br />
readily than do some older technologies.<br />
Absorptive capacity for technology<br />
Most technological progress in developing<br />
countries has been achieved through<br />
absorption and adaptation. A country’s<br />
ability to absorb, adapt and apply foreign<br />
technologies depends mainly on its exposure<br />
to foreign technologies (the pace at<br />
Figure 3.3<br />
The absorption of older and more recent technologies depends on more than income<br />
Index<br />
0.8<br />
0.6<br />
Absorption of older innovations, 2000-05<br />
Absorption of newer innovations, 2000-03<br />
0.4<br />
0.2<br />
0.0<br />
High-income<br />
countries<br />
Upper-middle-income<br />
countries<br />
Lower-middle-income<br />
countries<br />
Low-income<br />
countries<br />
Note: Each bar represents a single country.<br />
Source: Based on World Bank 2008.<br />
46 World Water Development Report 3
technological innovation<br />
PART<br />
1<br />
which technologies diffuse across countries)<br />
and its ability to absorb, adapt and<br />
use the technologies to which it is exposed<br />
(the pace at which technologies diffuse<br />
within a country). Successful use depends<br />
on the technological absorptive capacity<br />
of the economy – the macroeconomic and<br />
governance environment, which influences<br />
the willingness of entrepreneurs to<br />
take risks on new and new-to-the-market<br />
technologies – and the level of technological<br />
literacy and advanced skills in the<br />
population.<br />
Government policy also has a crucial<br />
role. Governments are often the primary<br />
delivery channel for technologies such as<br />
electricity, fixed-line telephones, transportation<br />
infrastructure and medical and<br />
educational services. And government<br />
policy can create a business environment<br />
that facilitates firm entry and exit<br />
and that is not hostile to exploiting new<br />
technologies. Too often, government<br />
regulations or features of the domestic<br />
market prevent firms from making<br />
money by exploiting a new technology,<br />
thus impeding the spread of technology<br />
within a country. Policy should also ensure<br />
that R&D and dissemination efforts<br />
give priority to creating and introducing<br />
products for which a market (domestic<br />
or foreign) exists and to helping firms<br />
exploit those opportunities.<br />
Investing in research and<br />
development<br />
Countries do well to invest in technology<br />
research and development. Research and<br />
extension programmes in agriculture, the<br />
sector that consumes the most water, have<br />
exceptionally high internal economic rates<br />
of return (table 3.1).<br />
Many resource constraints can be overcome<br />
by technological capital and supporting<br />
institutions. Productivity gains,<br />
including genetic improvements that<br />
enable more production per unit of land,<br />
also enable more production per unit of<br />
water. For most developing countries gains<br />
in agricultural productivity arise from<br />
investments in adaptations of inventions<br />
produced in developed countries.<br />
Challenges<br />
A major technology challenge is how<br />
to balance the benefits and risks of new<br />
technologies. For the first time in human<br />
history, technology has provided humanity<br />
with the means to reshape the<br />
structure and functioning of the natural<br />
environment and thus to alter the possibilities<br />
for future development. The natural<br />
environment has an internal system of<br />
checks and balances for its own maintenance<br />
and that of the animals and plants<br />
that inhabit it. Humanity has acquired<br />
technologies that can radically affect these<br />
natural checks and balances.<br />
Many positive impacts are associated with<br />
technological advances, such as a reduced<br />
burden of disease and loss of life due to<br />
medical advances, decreased malnutrition<br />
due to the green revolution and other agricultural<br />
advances, and increased economic<br />
livelihoods due to industrialization and<br />
urbanization and attendant technologies.<br />
But maintaining a sustainable relationship<br />
between people and the natural environment<br />
requires maintaining a balance<br />
between the technologies we develop to<br />
meet human needs and nature’s ability to<br />
supply them. And there is ample evidence<br />
that this balance is not being achieved in<br />
many places around the world, as demonstrated<br />
by excessive water abstractions,<br />
degraded water quality, and damaged<br />
aquatic ecosystems and biological communities.<br />
Some of these impacts result from<br />
ignoring the environmental consequences<br />
of human development actions. Others<br />
result from ignorance of the many, often<br />
subtle, interactions between the natural<br />
environment and the human activities<br />
that fundamentally affect it.<br />
Consider crop-based bioenergy production.<br />
The increased production and use<br />
of bioenergy to reduce greenhouse gas<br />
emissions associated with the burning of<br />
fossil fuels must be balanced against the<br />
rising need for water resources, associated<br />
pollution and sufficient agricultural<br />
land on which to grow the crops to supply<br />
crop-based bioenergy. An unintended impact<br />
has been rising prices for some foods,<br />
as cereal crops are currently used for the<br />
production of bioenergy rather than for<br />
food. Our choices of technology require<br />
appropriate consideration of their benefits<br />
and costs, including their negative environmental<br />
impacts.<br />
Table 3.1<br />
Investment<br />
maintaining<br />
a sustainable<br />
relationship<br />
between people<br />
and the natural<br />
environment<br />
requires<br />
maintaining a<br />
balance between<br />
the technologies<br />
we develop to<br />
meet human needs<br />
and nature’s ability<br />
to supply them<br />
Return on investments in agricultural research<br />
and extension<br />
Median internal rate of return<br />
(percent) a<br />
Agricultural extension programmes 41<br />
Applied research 49<br />
Pre-invention science 60<br />
a. The internal rate of return is the rate of discount at which the present value of benefits is<br />
equal to the present value of costs.<br />
Source: FAO 2000.<br />
Water in a changing world 47
PART<br />
1<br />
Chapter 3<br />
Notes<br />
1.<br />
2.<br />
3.<br />
4.<br />
5.<br />
6.<br />
7.<br />
8.<br />
9.<br />
Bergkamp and Sadoff 2008.<br />
IEA 2007.<br />
Pimentel and Patzek 2005.<br />
Mitchell 2008.<br />
US Department of Agriculture 2008.<br />
Mitchell 2008.<br />
Mitchell 2008.<br />
FAO 2008.<br />
Hillie et al. 2005, p. 43; Berger 2008.<br />
10. World Bank 2008.<br />
References<br />
Berger, M. 2008. Nanotechnology and<br />
Water Treatment. Nanowerk website.<br />
www.nanowerk.com/spotlight/<br />
spotid=4662.php.<br />
Bergkamp, G., and C. W. Sadoff. 2008.<br />
Water in a Sustainable Economy. In State<br />
of the World: Innovations for a Sustainable<br />
Economy. Washington, DC: Worldwatch<br />
Institute.<br />
FAO (Food and Agriculture Organization<br />
of the United Nations). 2000. Agricultural<br />
Production and Productivity in<br />
Developing Countries. In The State of<br />
Food and Agriculture 2000. Rome: Food<br />
and Agriculture Organization of the<br />
United Nations.<br />
———. 2008. Soaring Food Prices: Facts,<br />
Perspectives, Impacts and Actions<br />
Required. HLC/08/<strong>IN</strong>F/1. Background<br />
paper for the High-Level Conference on<br />
World Food Security: The Challenges of<br />
Climate Change and Bioenergy, Rome,<br />
3-5 June 2008.<br />
Hillie, T., M. Munasinghe, M. Hlope, and<br />
Y. Deraniyagala. 2005. Nanotechnology,<br />
Water and Development. Global<br />
Dialogue on Nanotechnology and the<br />
Poor: Opportunities and Risks. Meridian<br />
Institute, Washington, DC.<br />
———. 2007. World Energy Outlook 2007.<br />
Paris: Organisation for Economic Cooperation<br />
and Development and International<br />
Energy Agency.<br />
Mitchell, Donald. 2008. A Note on Rising<br />
Food Prices. Policy Research Working<br />
Paper 4682, Development Prospects<br />
Group, World Bank, Washington, DC.<br />
OECD (Organisation for Economic Cooperation<br />
and Development). 2008.<br />
OECD Environmental Outlook to 2030.<br />
Paris: Organisation for Economic Cooperation<br />
and Development.<br />
Pimentel, D., and T. W. Patzek. 2005.<br />
Ethanol Production Using Corn, Switchgrass,<br />
and Wood; Biodiesel Production<br />
Using Soybean and Sunflower. Natural<br />
Resources Research 14 (1, March): 65-76.<br />
US Department of Agriculture. 2008.<br />
Grain and Oilseeds Outlook for 2008.<br />
Prepared for the Agricultural Outlook<br />
Forum, February 21-22, Crystal<br />
City, VA. www.usda.gov/oce/<br />
forum/2008_Speeches/Commodity/<br />
GrainsandOilseeds.pdf.<br />
World Bank. 2008. Global Economic<br />
Prospects 2008: Technology Diffusion in<br />
the Developing World. Washington, DC:<br />
World Bank.<br />
48 World Water Development Report 3
technological innovation<br />
Chapter 4<br />
Policies, laws<br />
and finance<br />
PART<br />
1<br />
Authors: Gunilla Björklund, Stefano Burchi, Richard Connor,<br />
William Cosgrove, Sarah Hendry, Patrick Moriarty,<br />
Walter Rast, Léna Salamé and James Winpenny<br />
Contributors: Jack Moss, Monica Scatasta, Jon Martin Trondalen and<br />
World Water Assessment Programme Expert Group on Legal Issues<br />
Coordinator: Tim Kasten (UNEP)<br />
Facilitator: Richard Connor<br />
Key messages<br />
Effective policy and legal frameworks are necessary to develop,<br />
carry out and enforce the rules and regulations that govern<br />
water use and protect the resource.<br />
Water policy operates within a context of local, national, regional<br />
and global policy and legal frameworks that must all<br />
support sound water management goals.<br />
Legitimate, transparent and participatory processes can effectively<br />
mobilize input for designing and implementing water resources<br />
policy and create a strong deterrent to corruption.<br />
Although water is often described as a ‘gift of nature’, harnessing<br />
and managing it for the wide variety of human and ecological<br />
needs entail financial costs.<br />
While there may appear to be many financing options for water<br />
resources development, governments still have only three basic<br />
means of financing them: tariffs, taxes and transfers through<br />
external aid and philanthropy.<br />
Policy-makers need to make political decisions on socially and<br />
environmentally acceptable trade-offs among different objectives<br />
and on who bears the costs of such compromise.<br />
Policies and laws<br />
Authors: Gunilla Björklund, William<br />
Cosgrove, Patrick Moriarty, Walter<br />
Rast and Léna Salamé<br />
Contributors: Richard Connor, Jon Martin<br />
Trondalen and World Water Assessment<br />
Programme Expert Group on Legal Issues<br />
Effective policy and legal frameworks<br />
are necessary to develop, implement and<br />
enforce rules and regulations for controlling<br />
water uses. Although policy and law<br />
go hand in hand, they are fundamentally<br />
different. Policy serves mainly as a guide<br />
for decision-makers. Law provides a set of<br />
enforceable rules.<br />
Water policy, developed at international<br />
and national levels, can lead to the establishment<br />
of international, national and<br />
local laws. Effective implementation and<br />
enforcement require an adequate institutional<br />
and governance framework – one<br />
that is legitimate, transparent and participatory<br />
and that has proper safeguards<br />
against corruption. The legal system<br />
within which water law operates can be a<br />
strong instrument of change – or a severe<br />
impediment to progress.<br />
Water law sets the framework for stakeholders’<br />
use of water resources and<br />
responds to pressures from demographic,<br />
economic and social drivers. Policy‐makers<br />
Water in a changing world 49
PART<br />
1<br />
Chapter 4<br />
Because<br />
the political<br />
negotiations<br />
involved in global<br />
and regional<br />
conventions or<br />
water-sharing<br />
agreements are<br />
meant to avoid<br />
conflicts between<br />
different uses or<br />
users of water, they<br />
serve as drivers for<br />
water management<br />
Box 4.1<br />
use water law to establish the rules of the<br />
game for water users within a given community,<br />
country or region.<br />
International and regional water<br />
policy<br />
International goals and objectives for<br />
water resources, negotiated at UN meetings,<br />
conferences and summits or in<br />
ministerial-level sessions of the World<br />
Water Forum, can be viewed as political<br />
benchmarks. Because the political negotiations<br />
involved in global and regional<br />
conventions or water-sharing agreements<br />
are meant to avoid conflicts between different<br />
water uses or users, they serve as<br />
drivers for water management. The global<br />
policy framework for water began with the<br />
Stockholm Declaration of 1972, followed<br />
by other important international milestones<br />
over the years (see appendix 2).<br />
Ratifying conventions means assenting<br />
to implement the actions and activities<br />
agreed to by the involved parties. Implementation<br />
requires that the proper institutions<br />
exist, that national laws are compatible<br />
with convention requirements and<br />
that political and financial measures are<br />
in place to ensure popular participation.<br />
It also requires a policy framework with<br />
operational goals, objectives and follow-up<br />
The EU Water Framework Directive – uneven<br />
implementation<br />
The EU Water Framework Directive<br />
for water protection and management<br />
provides for the identification<br />
of European waters and their characteristics<br />
on the basis of individual<br />
river basin districts and the adoption<br />
of management plans and measures<br />
for each water body. Entered<br />
into force 22 December 2000, the<br />
directive seeks to prevent and reduce<br />
pollution, promote sustainable water<br />
use, protect the aquatic environment,<br />
improve the status of aquatic<br />
ecosystems and mitigate the effects<br />
of floods and droughts through the<br />
management of inland surface waters,<br />
groundwater, transitional waters<br />
and coastal waters.<br />
Within four years of the directive’s<br />
entry into force, member states were<br />
to complete an analysis of the characteristics<br />
of each river basin district,<br />
a review of the impacts of human<br />
activities on their water resources, an<br />
economic analysis of water use and<br />
a registry of areas requiring special<br />
protection. Within nine years they<br />
were to produce a management plan<br />
and programme for each river basin<br />
district.<br />
In a 2007 report the European Commission<br />
noted that several EU member<br />
states may fail to meet the targets,<br />
particularly because of the physical<br />
deterioration of aquatic ecosystems as<br />
a result of overexploitation of water<br />
resources, and the high levels of pollution<br />
from diffuse sources. The report<br />
also cited problems in meeting the<br />
deadlines for incorporating the directive<br />
into national law. However, the<br />
establishment of river basin districts<br />
and the designation of competent<br />
national authorities appear to be well<br />
under way. The European Commission<br />
finished with recommendations for<br />
addressing the reported shortcomings,<br />
integrating sustainable management<br />
of water resources into national<br />
policies, maximizing public participation<br />
and giving advance notice of<br />
its plans for future European water<br />
management policy.<br />
Source: European Parliament and Council<br />
2000; CEC 2007.<br />
processes. As an example, the EU Water<br />
Framework Directive, negotiated by the<br />
EU member states, requires intranational,<br />
multilevel institutional structures, including<br />
legal systems, to ensure implementation<br />
of the directive for transboundary<br />
river basins and groundwater as well as<br />
national river basins (box 4.1).<br />
International and regional legal<br />
frameworks<br />
International water law is part of public international<br />
law. The rules of international<br />
law apply to sovereign states. But because<br />
there is generally no higher authority to<br />
enforce such rules, individual countries<br />
must generally ensure their own compliance.<br />
The first step in enforcement is<br />
identifying the applicable rules.<br />
These rules are found in treaties, international<br />
custom, general principles of law<br />
and the writings of ‘learned publicists’. 1<br />
Treaties usually provide the most accessible<br />
source of law, but the other sources cannot<br />
be ignored. In the non-navigational uses<br />
of international watercourses, rules of customary<br />
law are often invoked by countries<br />
in the absence of codified law. A treaty applies<br />
only to parties to the treaty and only<br />
after the treaty has come into force and is<br />
thus legally binding. Finally, the normative<br />
content (requirements) of the treaty<br />
rules must be established and agreed to by<br />
all parties involved to determine whether<br />
a country’s actions are in accordance with<br />
its treaty obligations.<br />
Law may also be developed at a regional<br />
level. Such law typically supersedes national<br />
law. Treaties may operate regionally<br />
between two or more countries. Regional<br />
bodies such as the European Union may<br />
also create law for their members. EU law,<br />
unlike international law, can be directly<br />
binding on its members and has strong<br />
enforcement mechanisms.<br />
In most cases the directly applicable law is<br />
national law, which ensures implementation<br />
of any international treaties that a<br />
country has signed. Within national law<br />
the specific law-making powers and hierarchies<br />
of laws are determined by the constitutional<br />
arrangements within a jurisdiction.<br />
National law also includes customary<br />
law as well as water laws directly relating<br />
to water resources (for example, pollution<br />
control and water abstraction permits).<br />
In addition to the formal legal framework<br />
and the customary laws that national law<br />
formally codifies and recognizes, there are<br />
also water rules and rights by which water<br />
user collectives and other actors abide.<br />
50 World Water Development Report 3
Policies, laws and finance<br />
PART<br />
1<br />
These hybrid sets of water rules, common<br />
in most parts of the world, are often crucial<br />
in everyday water affairs and conflict<br />
resolution.<br />
There are also many other areas of law<br />
not directly addressed to water issues that<br />
nevertheless affect management of the<br />
water environment. These include land<br />
use planning, environmental assessment,<br />
nature conservation and environmental<br />
law. Public health laws influence the supply<br />
of water and sanitation, as does land<br />
tenure reform. Individuals are reluctant to<br />
invest in sanitation where they have no security<br />
of tenure, nor will water companies<br />
lay pipes in such land. Legal provisions<br />
on freedom of information and access to<br />
justice, human rights and other constitutional<br />
measures are also important parts of<br />
a governance framework.<br />
Conflicts and regional instability (or<br />
stability) can influence water demand and<br />
use, particularly in water-scarce regions.<br />
This is the case where competition arises<br />
between different water uses within a<br />
country or where water disputes exist<br />
between countries, as between Bangladesh<br />
and India over the Ganges River and<br />
among the riparian countries along the<br />
Danube River. (This subject is discussed<br />
further in chapter 9.) There are more than<br />
400 registered agreements over shared<br />
watersheds, 2 most between two riparian<br />
countries. Although the UN Convention<br />
on the Law of the Non-navigational Uses<br />
of International Watercourses was adopted<br />
by the UN General Assembly in 1997, it<br />
has not yet been ratified by a sufficient<br />
number of countries to enter into force.<br />
One of the most successful conventions<br />
on water resources is the regional United<br />
Nations Economic Commission for Europe<br />
Convention on the Protection and Use of<br />
Transboundary Watercourses and International<br />
Lakes, convened in Helsinki in<br />
March 1992. 3 This convention, entered<br />
into force in 1996 and currently ratified by<br />
35 countries, serves as a driver for water<br />
management in participating countries.<br />
National legal framework: managing<br />
water resources and service delivery<br />
Law and policy are interconnected, with<br />
particular legislation derived from water<br />
policy in many cases. 4 Making laws operational<br />
is often a painstaking process,<br />
because of the need to develop implementation<br />
regulations and manuals on interpreting<br />
the law. Often implementation is<br />
by trial and error, requiring feedback and<br />
the establishment of practices and cases<br />
on how to interpret aspects of water law.<br />
For developing countries the long-term<br />
goal of such legislation is poverty reduction<br />
through a well managed and sustainable<br />
water sector. Associated goals include<br />
efficient service delivery, protection of<br />
consumer rights, financial sustainability<br />
and service coverage to the poor in both<br />
urban and rural areas.<br />
Governance of the water sector is complex<br />
and involves actors beyond the water sector.<br />
The actors can be national legislatures<br />
and governments, other sector agencies,<br />
local governments, river basin authorities,<br />
representatives of indigenous peoples,<br />
consumer bodies, private companies<br />
and others. Who is involved may differ<br />
with the issues concerned – for example,<br />
surface waters, groundwater, coastal waters<br />
or wetlands. Effective action on such a<br />
complex group of interests requires open<br />
communication and strong coordination<br />
facilitated by an appropriate legislative and<br />
regulatory framework. The Government<br />
of Australia recognized this need when it<br />
adopted the Commonwealth Water Act<br />
in 2007 and subsequent regulations (box<br />
4.2). 5<br />
There are fundamental differences between<br />
managing water resources and<br />
delivering water services. Managing water<br />
resources involves a wide range of institutions<br />
at local, state, national, regional<br />
and international levels. Delivering water<br />
services (including administration) usually<br />
falls under the authority of elected local<br />
officials and specific local institutions. It is<br />
misleading, therefore, to discuss resources<br />
management and services delivery in the<br />
same institutional context.<br />
Decentralization, for example, can affect<br />
how water resources and water distribution<br />
services are managed. It is a political<br />
process, however, not necessarily a waterspecific<br />
solution to providing improved<br />
water services. It requires that water institutions<br />
integrate the physical watershed<br />
and administrative boundaries, nesting<br />
these within each other at different scales.<br />
Success with such integration for catchment<br />
bodies below the river basin scale<br />
has been limited, however, with evidence<br />
from countries like South Africa suggesting<br />
that such integration may often be too<br />
complex to implement.<br />
Table 4.1 shows the range of measures<br />
required to address water rights and water<br />
management. Table 4.2 shows additional<br />
measures that may be required to address<br />
the provision of water services. The tables<br />
draw from a study across four jurisdictions<br />
There are<br />
fundamental<br />
differences<br />
between managing<br />
water resources<br />
and delivering<br />
water services.<br />
It is misleading,<br />
therefore, to<br />
discuss resources<br />
management<br />
and services<br />
delivery in the<br />
same institutional<br />
context<br />
Water in a changing world 51
PART<br />
1<br />
Chapter 4<br />
Box 4.2<br />
Australian water law reform<br />
Australian states have been reforming their<br />
water laws within a framework set out by<br />
the Commonwealth government, called<br />
the National Water Initiative. The initiative<br />
is intended to provide security of entitlements<br />
to water, including ecosystems use.<br />
It has a formula for sharing risk between<br />
government and users should water availability<br />
change in the future due to climate<br />
change or other factors.<br />
The National Water Initiative and related<br />
policies require water trading, which<br />
enables water to be properly valued<br />
and allocated to higher-value uses. But<br />
this means that water rights have to be<br />
separated from land rights, which can in<br />
turn make it difficult for small-scale farms<br />
to survive. This has implications for equity<br />
and the potential need for structural adjustment<br />
funds. It also has consequences<br />
for supportive legal regimes. For example,<br />
there may be a need for a secure registry<br />
of water rights, similar to a registry of land<br />
rights.<br />
There are also consequences for infrastructure.<br />
For example, Queensland separates<br />
the ownership and management of distribution<br />
facilities (irrigation networks) from<br />
the storage infrastructure (dams), and<br />
users of the irrigation networks cannot opt<br />
out of operating costs without the consent<br />
of the licence holder, to avoid leaving the<br />
system without an owner. If water were<br />
to be traded out of an irrigation area, the<br />
previous owners might no longer pay for<br />
the system, leaving the new owners with a<br />
liability but no income.<br />
However, Australian states do not rely on<br />
water trading to manage water. In every<br />
state there will be a structure for river<br />
basin management and stakeholder engagement<br />
through water resources plans<br />
produced by the states. These plans will<br />
allocate water, and only when a plan is in<br />
place will it be possible to trade water, as<br />
for example under the Queensland Water<br />
Act of 2000.<br />
The first requirement is thus to have a<br />
sound system to manage water and allocate<br />
it to users, which should be the focus<br />
of water law reforms, especially where<br />
human and financial resources are limited.<br />
Only a planned system can account for the<br />
public good elements of water. Markets<br />
alone cannot.<br />
Source: www.nwc.gov.au/nwi/index.cfm;<br />
Roper, Sayers, and Smith 2006; Queensland<br />
Government 2000; Hendry 2006.<br />
Figure 4.1<br />
Technical and<br />
biophysical<br />
domain<br />
Organizational<br />
domain<br />
– Scotland, England, South Africa and<br />
Queensland, Australia. 6<br />
Key policy and regulatory issues<br />
Although water allocation systems can be<br />
difficult to establish, managing competing<br />
water uses requires clear, widely accepted<br />
allocation rules, especially where water is<br />
scarce. Water allocation systems should<br />
balance equity and economic efficiency.<br />
Environmental concerns also require<br />
equal attention, though they are often<br />
neglected in the process. In Chile, for<br />
National<br />
and<br />
international<br />
law<br />
Market<br />
law<br />
Source: Based on Boelens 2008.<br />
Formal and informal legal framework of<br />
water rights<br />
Local<br />
water<br />
law<br />
Development<br />
project<br />
law<br />
Normative<br />
domain<br />
Ancestral<br />
law<br />
Religious<br />
law<br />
Political and<br />
economic<br />
domain<br />
Cultural and<br />
spiritual<br />
domain<br />
example, the environment is not granted<br />
any water licences, while in South Africa<br />
decision-makers are debating how to put<br />
water law on environmental protection<br />
into practice. Lawmakers must address<br />
public policy implications, including<br />
equity and water reallocations in times of<br />
drought or other emergencies. And permit<br />
systems should be sufficiently flexible<br />
to adapt to global changes and climate<br />
variability.<br />
Much water governance takes place outside<br />
formalized legal systems, particularly in<br />
developing countries (figure 4.1). Such<br />
‘traditional’ rights systems form a dynamic<br />
mixture of rules, principles and organizational<br />
forms of different origins. They<br />
combine local, national and global rules<br />
and often mix indigenous, colonial and<br />
contemporary norms and rights. Important<br />
sources for these complex, local rights<br />
systems tend to be state laws, religious<br />
laws (whether formal or indigenous),<br />
ancestral laws, market laws and the rights<br />
frameworks of multiple water project<br />
interventions, which often set their own<br />
regulations.<br />
Local water rights thus exist in conditions<br />
of legal pluralism, where rules and principles<br />
of different origins and legitimization<br />
coexist and interact. 7 In the eyes of water<br />
users in many parts of the world, legitimate<br />
water authority and water rights are<br />
not restricted to official law. Water users<br />
also clearly distinguish water rights as<br />
defined by lawyers (officially codified or<br />
recognized) from their own, living rights<br />
systems.<br />
52 World Water Development Report 3
Policies, laws and finance<br />
PART<br />
1<br />
Table 4.1<br />
Laws addressing water rights and water management<br />
Options for provision<br />
Legislative<br />
requirement<br />
Integrated water resources<br />
management and river<br />
basin planning<br />
Water rights and<br />
abstraction licensing<br />
Water quality and<br />
water pollution<br />
High-level<br />
principles,<br />
purposes and<br />
duties<br />
• Primary law<br />
• Ownership or trusteeship of<br />
resource<br />
• Equity, water efficiency and<br />
integration<br />
• Priority uses in law or policy (e.g.,<br />
basin plans)<br />
• Ownership or trusteeship of<br />
resource if not in water resources<br />
management law<br />
• High-level duties on water users<br />
(e.g., sustainable and beneficial<br />
use)<br />
• Priority uses in law or policy (e.g.,<br />
basin plans)<br />
• High-level duties on water users<br />
(e.g., sustainable and beneficial<br />
use, no waste, efficiency)<br />
Catchment<br />
planning<br />
• Catchment based<br />
• Alignment with administrative<br />
boundaries<br />
• Coordination with other strategic<br />
planning processes (e.g., land<br />
use, biodiversity)<br />
• Licence in accordance with<br />
catchment plans if they exist<br />
• Licence in accordance with<br />
catchment plans if they exist<br />
Define water<br />
environment<br />
• Surface and groundwater<br />
• Coastal waters<br />
• Wetlands<br />
Control all waters:<br />
• Surface and groundwater<br />
• Coastal waters<br />
• Wetlands<br />
Control all waters:<br />
• Surface and groundwater<br />
• Coastal waters<br />
• Wetlands<br />
Regulatory<br />
structure<br />
Water authority:<br />
• Government department<br />
• Agency<br />
• Stakeholder-led<br />
Water authority:<br />
• Government department<br />
• Agency<br />
• Stakeholder-led<br />
Water authority or environmental<br />
authority:<br />
• Coordination mechanisms<br />
Participation<br />
Stakeholder engagement for<br />
planning in primary law<br />
Stakeholder engagement through<br />
water resources management<br />
framework<br />
Stakeholder engagement through<br />
water resources management<br />
framework<br />
Licensing<br />
Status of plan:<br />
• Regulatory (direct licensing)<br />
• Indirect (sets targets)<br />
• Managerial (sets targets,<br />
incentives)<br />
Integrated water use licences for<br />
abstraction and discharge?<br />
Integrated water use licences<br />
for abstraction and discharge<br />
(dependent on regulatory structure)?<br />
Tiered system<br />
(proportionate)<br />
• Tiered system (e.g., general rules<br />
and full licences)<br />
• Exemptions (e.g., domestic use,<br />
subsistence use, volume limits)<br />
• Tiered system (e.g., general rules<br />
and full licences)<br />
• Emission, quality and ecological<br />
standards – progressive approach<br />
• Management of diffuse pollution<br />
Licence<br />
conditions<br />
Duration, review periods and tests<br />
for grant, review and reallocation<br />
Duration, review periods and tests<br />
for grant, review and reallocation<br />
Water trading<br />
Prohibit, permit and encourage<br />
Source: Hendry 2008.<br />
Understanding the nature of water rights<br />
in each system and water territory thus<br />
requires taking into account their multilayered<br />
bundles: their rights to use and<br />
withdraw, operate, supervise and manage,<br />
and control. Focusing only on the local<br />
level is clearly inadequate. Multistakeholder<br />
platforms or other arenas for achieving<br />
common goals and establishing patterns<br />
of governance – which include recognizing<br />
informal water rights, empowering<br />
marginalized social and ethnic groups<br />
and representing all interested parties in<br />
allocation and decision-making – have the<br />
potential to ensure fairer and smoother<br />
reallocation of water resources (box 4.3).<br />
Participatory water management<br />
Participants in the consensus-building<br />
World Water Vision exercise indicated<br />
that the Vision could be achieved only if<br />
empowered individuals and communities<br />
participated at all levels of decision-making<br />
on water resources management. Their<br />
concerns were pragmatic, driven more by<br />
considerations of governance systems than<br />
by equity. Thus the World Water Vision<br />
report concluded that<br />
Both public and private management<br />
of water will improve through<br />
greater accountability, transparency,<br />
and rule of law. Incentives<br />
Water in a changing world 53
PART<br />
1<br />
Chapter 4<br />
Table 4.2<br />
Laws addressing provision of water services<br />
Legislative requirement<br />
Regulators<br />
Economic, duties of supply and quality standards<br />
Environmental<br />
Providers<br />
Vertical disintegration and integration<br />
Horizontal disaggregation and aggregation<br />
Private sector involvement<br />
Constitutional and<br />
human rights<br />
High-level duties<br />
(on regulators, providers and users)<br />
Duties of supply<br />
Tariffs, metering and disconnections<br />
Emergency powers<br />
Storm water<br />
Conservation and demand management<br />
Options for provision<br />
• Ministry, sector agency (e.g., water industry commission, office of water<br />
services) or multiutility (e.g., competition authority)<br />
• Ministry or environment agency<br />
• Separate consumer body?<br />
• Local government<br />
• Private company<br />
• Water board or agency<br />
• Abstraction, treatment, distribution and supply<br />
• Regional (‘competition by comparison’?)<br />
• Forbidden?<br />
• Build-operate-transfer<br />
• Public sector preference?<br />
• Leases and concessions<br />
• Short-term contracts<br />
• Divestiture<br />
• High level<br />
• Additional enforcement mechanisms<br />
• Universal service obligation • Consumer protection<br />
• Conservation, efficient use (water • Competition<br />
efficiency)<br />
• Economic efficiency and return on<br />
• Sustainable and secure supply<br />
capital<br />
• Universal (progressive?)<br />
• Reasonable cost<br />
• In service areas<br />
• Drinking water customer service<br />
standards<br />
• Banded<br />
• Presumption of metering<br />
• Two-part<br />
• Powers to disconnect or limit supply<br />
• Free basic service<br />
for non-payment<br />
• Participation in tariff-setting<br />
• Climate and drought<br />
• Infrastructure failure<br />
• Pollution incident<br />
• Ministers, water providers and<br />
regulators<br />
• Incorporate storm water management into water services provision (and<br />
potentially into abstraction licensing and pricing)<br />
• High-level duties on conservation and efficient use<br />
• Highest appropriate standards for built environment, grey water reuse<br />
Source: Hendry 2008.<br />
must improve for all stakeholders.<br />
More community participation will<br />
provide a sense of ownership and<br />
empowerment to local stakeholders.<br />
The role of education in making<br />
this process possible cannot<br />
be overestimated. Public access to<br />
information will provide an incentive<br />
to elected officials and private<br />
operators, who will be held responsible<br />
for results, including maximizing<br />
social welfare. It will also<br />
reduce opportunities for corruption<br />
and for capture of the system by<br />
powerful elites. 8<br />
Role of non-governmental organizations. Nongovernmental<br />
organizations (NGOs) can<br />
play a valuable role in a country or local<br />
community. Normally operating outside<br />
the formal government, NGOs may be<br />
community-based organizations, povertyfocused<br />
large external organizations<br />
such as Oxfam and the Bill and Melinda<br />
Gates Foundation, and charities funded<br />
by religious organizations. Issue-related<br />
organizations such as the Council of<br />
Canadians and IUCN–International Union<br />
for Conservation of Nature may also be<br />
important contributors at a national or<br />
regional scale. Where such organizations<br />
exist, they should be involved in the participatory<br />
processes. A thorough analysis<br />
of the contributions of the NGO sector to<br />
the Millennium Development Goals and<br />
to water management, showing the unique<br />
characteristics of different kinds of NGOs,<br />
their contributions, their limitations and<br />
a perspective on their future role would<br />
be a useful contribution to the related<br />
literature.<br />
Participation in the irrigation sector. Along<br />
with market tools (such as privatization<br />
and removal of subsidies), water management<br />
policies have been shaped by calls<br />
for a more participatory development<br />
approach that advocates smaller government<br />
and local participation in governance,<br />
management and financing. At the<br />
54 World Water Development Report 3
Policies, laws and finance<br />
PART<br />
1<br />
same time, to comply with the structural<br />
adjustments required by international<br />
financial institutions in the last few decades,<br />
governments have decreased public<br />
spending in most sectors and disengaged<br />
from them. Such strategies have led to<br />
major changes in water management, particularly<br />
in irrigation, where governments<br />
have embarked on reform. 9<br />
One of the most important and farreaching<br />
reforms is the irrigation management<br />
transfer that has been taking place<br />
in more than 57 countries on 5 continents<br />
(box 4.3). Overall, this transferring of<br />
responsibility and authority for managing<br />
irrigation systems from the public sector<br />
to the community has forced a new look<br />
at how services are provided to users and a<br />
move from supply-driven to demand-driven<br />
approaches. And the closer involvement<br />
of water user associations has resulted in<br />
increased accountability, transparency<br />
and responsibility, as has been reported in<br />
China and Mexico, for example. 10<br />
Participation reduces corruption<br />
Global Corruption Report 2008: Corruption in<br />
the Water Sector estimates that corruption<br />
in the water sector can raise the investment<br />
costs of achieving the Millennium<br />
Development Goals target for water and<br />
sanitation by almost $50 billion. 11 Corruption<br />
in the sector includes falsified<br />
meter readings, distorted site selection of<br />
boreholes or abstraction points for irrigation,<br />
collusion and favouritism in public<br />
procurement and nepotism in the allocation<br />
of public positions.<br />
Corruption remains a poorly addressed<br />
governance issue in the water domain.<br />
This domain is a high-risk sector for corruption<br />
because water service provision<br />
is a near natural monopoly. The resource<br />
is becoming increasingly scarce in many<br />
countries, and the water domain involves<br />
large and often complex construction<br />
contracts. Furthermore, water has multifunctional<br />
characteristics and is used and<br />
managed by a mix of private and public<br />
stakeholders. 12<br />
Corruption – on a petty or grand scale<br />
– occurs across the water spectrum and<br />
among all water sector actors. According<br />
to Global Corruption Report 2008, in some<br />
countries corruption siphons off as much<br />
as 30% of the budget. 13 By diverting funds<br />
from investment or operation and maintenance,<br />
corruption reduces access to water.<br />
And for many poor people, paying bribes<br />
is the only means of securing access to<br />
water supplies.<br />
Corruption undermines poverty reduction<br />
efforts and impedes economic, social<br />
and sustainable development. Poor people<br />
generally suffer most from corruption,<br />
overpaying for water service delivery or<br />
bearing the health burdens arising from<br />
lack of sustainable access to safe drinking<br />
water. The indirect costs of corruption are<br />
also high. There is a strong correlation<br />
between access to adequate water and sanitation<br />
and infant mortality (see chapter 6).<br />
Corruption can lead to uncontrolled pollution<br />
of water sources, overpumping and<br />
depletion of groundwater, lack of planning,<br />
uncontrolled degradation of ecosystems,<br />
weakened flood protection, urban<br />
expansion leading to heightened water<br />
tensions, and other harmful effects. In<br />
water-scarce southern Spain tens of thousands<br />
of properties have been developed<br />
illegally, particularly in seaside resorts.<br />
In the Andalucian city of Ronda this<br />
practice led to a severe governance crisis,<br />
and pollution now jeopardizes water supplies.<br />
14 Where corruption is widespread,<br />
achieving the Millennium Development<br />
Goals will take much longer – not only<br />
with much higher cost in direct investment<br />
in services and management, but<br />
also in indirect costs, such as water-related<br />
diseases and loss of lives, ecosystems and<br />
productive capacities. It also threatens<br />
Box 4.3<br />
Irrigation management transfer is the<br />
transfer of responsibility and authority<br />
for managing irrigation systems<br />
to water user associations. It began<br />
in the 1960s in Taiwan, Province of<br />
China; Bangladesh; and the United<br />
States; in the 1970s in Mali, New<br />
Zealand and Colombia; and in the<br />
1980s in the Philippines, Mexico,<br />
Tunisia and the Dominican Republic.<br />
It peaked in the 1990s in Turkey,<br />
Morocco, Australia, Peru, Albania<br />
and Zimbabwe, but still continues<br />
in countries such as Pakistan and<br />
Sudan (2000), India (2001) and China<br />
(2002), each with unique experiences<br />
and results.<br />
The Food and Agriculture Organization<br />
of the United Nations and<br />
International Water Management<br />
Institute database on experience<br />
with irrigation management transfer<br />
provides information on the key factors<br />
that motivated adoption of the<br />
new policy. The most commonly cited<br />
is a shortage of government funds<br />
for operating and maintaining the<br />
Corruption remains<br />
a poorly addressed<br />
governance issue in<br />
the water domain<br />
Experience with irrigation management<br />
transfer<br />
system, followed by difficulties with<br />
fee recovery.<br />
Overall, the results have been mixed.<br />
Financial sustainability and lack of<br />
clarity about the financial and technical<br />
assistance provided to water user associations<br />
by the government have been<br />
a concern. Monitoring and evaluation<br />
are essential. The concept of ‘farmer<br />
participation’ was often translated<br />
into a fixed set of principles, such as<br />
volumetric control, cost recovery, water<br />
pricing, economic, water use efficiencies<br />
and downstream control, that<br />
were not relevant in all contexts. For<br />
example, Andean farmer-managed irrigation<br />
systems typically have upstream<br />
control techniques and management<br />
structures, which provide transparency<br />
and ease of operation. For them, participating<br />
in water distribution usually<br />
means involving everyone in the system’s<br />
management and decisions on<br />
water distribution to individual fields.<br />
Source: Garces-Restrepo, Vermillion, and<br />
Muñoz 2007; Boelens 2008.<br />
Water in a changing world 55
PART<br />
1<br />
Chapter 4<br />
Corruption is an<br />
important driver<br />
of uncontrolled<br />
pollution of<br />
water sources,<br />
overpumping<br />
and depletion<br />
of groundwater,<br />
lack of planning<br />
and uncontrolled<br />
degradation<br />
of ecosystems,<br />
diminishing flood<br />
protection, urban<br />
expansion leading<br />
to heightened<br />
water tensions<br />
and other<br />
harmful effects<br />
existing achievements by undermining<br />
institutions and the sustainability of<br />
infrastructure.<br />
Legitimate, transparent and participatory<br />
processes can be effective in garnering<br />
support for the design and implementation<br />
of water resources policy and of<br />
deterring corruption. But participatory<br />
processes require adequate institutional,<br />
policy, legal and economic instruments.<br />
Political leadership is required to put these<br />
processes in place and demonstrate support<br />
for them. International assistance and<br />
interventions to reduce corruption will<br />
have only limited effect if political will is<br />
absent.<br />
Implementing regulations<br />
Water resources management is underpinned<br />
by a functioning legal system that<br />
includes:<br />
• Water resources legislation, the<br />
province of the legislature and the<br />
executive.<br />
• Implementation and administration<br />
of legislation, the province of the<br />
executive.<br />
• Adjudication of civil disputes among<br />
water litigants, the province of the<br />
judiciary.<br />
• Prosecution of criminal offenders by<br />
the executive and the judiciary.<br />
Following adoption of a law by the<br />
legislature, the executive needs to address<br />
relevant details not included in the<br />
legislation by preparing implementation<br />
regulations. Neither legislation nor<br />
implementation regulations will make<br />
much difference, however, unless they<br />
are effectively administered by the water<br />
resources administration. Nor will they<br />
secure rights in the resource unless a judiciary<br />
can adjudicate disputes effectively,<br />
impartially, expeditiously and transparently.<br />
Finally, the legislation needs<br />
vigorous enforcement and systematic<br />
monitoring, using a set of indicators to<br />
gauge effectiveness and improve system<br />
performance.<br />
Challenges<br />
Water resources development and management<br />
in the interests of national<br />
development objectives require effective<br />
policy and legal frameworks that also<br />
respect deeply rooted customary practices.<br />
Participatory processes that take account<br />
of the social, economic and cultural<br />
characteristics of the country or community<br />
will make a significant contribution<br />
to meeting this challenge. But a greater<br />
challenge is to ensure that such laws and<br />
the regulations that support them make a<br />
difference on the ground by effectively administering<br />
and enforcing them. And the<br />
security of rights in the resource must be<br />
adjudicated by an effective, impartial, expeditious<br />
and transparent judicial system.<br />
Financing – the missing link<br />
Authors: Richard Connor, William Cosgrove,<br />
Walter Rast and James Winpenny<br />
Contributors: Jack Moss and Monica Scatasta<br />
Virtually all water-related activities,<br />
whether structural (infrastructure) or<br />
not (planning, data collection, regulation,<br />
public education and so on), require<br />
money to develop, implement and carry<br />
out. Even if all the necessary policies and<br />
laws are in place, lack of funding will<br />
bring necessary actions to a standstill.<br />
Adequate funding and the willingness to<br />
invest in water management and infrastructure<br />
are therefore major determinants<br />
of the availability of sufficient quantities<br />
of water of acceptable quality.<br />
Although water is often described as a<br />
‘gift of nature’, harnessing and managing<br />
water for human and ecological needs<br />
entail financial costs. These costs are often<br />
widely ignored, underestimated or underfunded,<br />
with the result that important<br />
functions and assets are neglected and<br />
under provided, while existing assets and<br />
services deteriorate.<br />
Three functions are involved in water<br />
management, each with associated costs:<br />
• Water resources management and<br />
development, including watershed<br />
and river basin development, storage,<br />
flood-risk management, environmental<br />
protection and pollution<br />
abatement.<br />
• Water services to municipalities and<br />
households, commerce and industry,<br />
agriculture, and other economic sectors,<br />
including the costs of wastewater<br />
treatment, rehabilitation, operations<br />
and maintenance and inadequate<br />
infrastructure.<br />
• Integrative functions, such as water<br />
sector policy development, research,<br />
monitoring, administration, legislation<br />
(including compliance and enforcement)<br />
and public information.<br />
56 World Water Development Report 3
Policies, laws and finance<br />
PART<br />
1<br />
The costs associated with these functions<br />
are either capital (investment) costs<br />
or annual recurrent costs, both variable<br />
and fixed. To function properly, the water<br />
sector must cover all costs – not just those<br />
of major physical infrastructure – in a<br />
sustainable way. That means ensuring reliable,<br />
predictable finance from government<br />
revenues (taxes), the sale of water services<br />
or long-term aid commitments.<br />
Financing is often a limiting factor in effectively<br />
managing the water sector. The<br />
solution is to focus not only on increasing<br />
flows of funds to the sector but also on<br />
achieving a realistic balance between the<br />
demand for and supply of financing to ensure<br />
financial sustainability. Demand for<br />
funds needs to be rationalized by developing<br />
realistic investment plans, minimizing<br />
the recurrent costs of service delivery<br />
and ensuring the sustainability of water<br />
resources and the safe and reliable delivery<br />
of services to maintain users’ willingness<br />
to pay.<br />
The logic differs for the three sources of<br />
finance for the water sector. The rationale<br />
for local user financing is users’<br />
consumption of the resource and local<br />
authorities’ responsibility in most cases<br />
for the main decisions about water services<br />
and tariffs. The rationale for national<br />
government finance is often the national<br />
or regional benefits to be gained from<br />
managing the resource. Capital investment<br />
costs tend to be covered largely<br />
by governments, except where assets<br />
are privately owned (for example, farmers<br />
who have their own infrastructure).<br />
The international community provides<br />
mainly ‘catalytic’ funding to jumpstart<br />
projects, which includes providing<br />
financial guarantees. Decisions made at<br />
the international and national government<br />
levels are most likely to be outside<br />
the ‘water box’, while local user concerns<br />
more directly address specific systems for<br />
water supply and sanitation.<br />
Investment in water management<br />
capacity<br />
The water sector has been plagued by<br />
lack of political support, poor governance,<br />
under resourcing and underinvestment.<br />
These ills are manifested in<br />
non- transparency, lack of accountability,<br />
unsustainable economics, high levels of<br />
unaccounted for water and low revenue<br />
collection. They have led to infrastructure<br />
deterioration, the breakdown of services<br />
and ultimately customer dissatisfaction.<br />
Figure 4.2 illustrates how this combination<br />
of factors creates a vicious cycle of low<br />
funding, weak political support and poor<br />
service provision. Breaking this vicious<br />
cycle will require more than investments<br />
in hardware.<br />
lack of political<br />
support, poor<br />
governance,<br />
underresourcing<br />
and<br />
underinvestment<br />
in the water<br />
sector have led<br />
to infrastructure<br />
deterioration,<br />
the breakdown<br />
of services<br />
and ultimately<br />
customer<br />
dissatisfaction<br />
Figure 4.2<br />
If the vicious cycle of low funding is reversed, the benefits to society will be enormous<br />
Potential investments<br />
driven away by<br />
perception of high<br />
risk and low returns<br />
Inadequate<br />
investment<br />
Funds lost to system:<br />
• Non-recovery<br />
• Corruption<br />
• Rents<br />
Operational<br />
inefficiency<br />
Inadequate<br />
maintenance<br />
Infrastructure<br />
degradation<br />
Low<br />
perception of<br />
value<br />
Low fee revenues<br />
and low willingness<br />
to increase taxbased<br />
water<br />
funding<br />
Good quality human<br />
resources driven away<br />
by lack of opportunity<br />
and low achievement<br />
Low service<br />
quality<br />
Loss of positive<br />
externalities<br />
and increase of<br />
negative<br />
externalities<br />
Source: J. Moss based on ideas from A. Mathys; Moss et al. 2003.<br />
Water in a changing world 57
PART<br />
1<br />
Chapter 4<br />
In most urban<br />
public water<br />
systems charges<br />
barely cover the<br />
recurrent costs<br />
of operation and<br />
maintenance.<br />
In rural areas<br />
neglect of<br />
operation and<br />
maintenance and<br />
cost recovery<br />
contribute to<br />
widespread<br />
non- functionality<br />
Figure 4.3<br />
100<br />
75<br />
50<br />
25<br />
0<br />
Austria<br />
Investment is also required in the operation<br />
and maintenance of physical<br />
infrastructure so that it meets appropriate<br />
standards and functions efficiently.<br />
Operations and maintenance are neglected<br />
nearly everywhere in favour of<br />
new infrastructure investments, regardless<br />
of the country’s level of development. In<br />
the United States bringing water supply<br />
and sewerage infrastructure up to current<br />
standards will cost more than $1 trillion<br />
over the next 20 years, with hundreds of<br />
billions more required for dams, dikes and<br />
waterway maintenance. 15 The World Business<br />
Council for Sustainable Development<br />
estimates that the total costs of replacing<br />
ageing water supply and sanitation infrastructure<br />
in industrial countries may be as<br />
high as $200 billion a year. 16 Investment<br />
in physical infrastructure must be accompanied<br />
by the ‘soft’ infrastructure of policies<br />
and legal systems (as described earlier)<br />
and human capacity. 17 Yet much bilateral<br />
aid for sanitation and drinking water fails<br />
to achieve a balance between soft and<br />
hard infrastructure (figure 4.3).<br />
In most urban public water systems charges<br />
often barely cover the recurrent costs of<br />
operation and maintenance, leaving little<br />
or no funds to recover the capital costs of<br />
modernization and expansion. A survey of<br />
such systems in 132 cities in high-, middleand<br />
low-income countries found that 39%<br />
did not recover even their operation and<br />
maintenance costs (true of 100% of cities<br />
in South-East Asia and the Maghreb). 18<br />
Moreover, water infrastructure deteriorates<br />
over time. To keep it functioning properly<br />
requires routine repairs, service and replacement<br />
of worn parts. These activities,<br />
New infrastructure seems to dominate donor<br />
investments in drinking water and sanitation<br />
Share of investment (percent) Infrastructure ‘Soft’ support<br />
Germany<br />
Sanitation<br />
France<br />
European<br />
Commission<br />
Austria<br />
Drinking water<br />
France<br />
European<br />
Commission<br />
Note: Soft support includes support for policies, legal systems and human capacity building.<br />
Source: Based on data from UN-Water 2008.<br />
easy to postpone, are widely neglected.<br />
The result is infrastructure that deteriorates<br />
to a level that can no longer provide<br />
reliable access to safe drinking water to<br />
those who are nominally receiving the<br />
service. Leakage (loss) rates of 50% are not<br />
uncommon in urban distribution systems.<br />
Much of the apparatus for treating wastewater<br />
is also failing. According to a report<br />
by the Task Force for the Implementation<br />
of the Environmental Action Program<br />
for Eastern Europe, Caucasus and Central<br />
Asia, municipal water utilities have now<br />
become the main polluters of surface<br />
waters in many East European, Caucasus<br />
and Central Asian countries. The task<br />
force reports that up to 90% of nitrogen<br />
and phosphorus discharges into the Black<br />
and Caspian Seas originate from riverine<br />
inputs, which mostly transport municipal<br />
wastewaters. 19<br />
In rural areas neglect of operation and<br />
maintenance budgets and cost recovery<br />
contribute to widespread non- functionality.<br />
A recent survey of almost 7,000 rural water<br />
schemes in Ethiopia found that 30%-<br />
40% were non-functional. 20 A shortage of<br />
finance for wages, fuel, materials and spare<br />
parts was a common factor.<br />
The deficit in financing, especially for<br />
operation and maintenance costs, is a substantial<br />
addition to the investment costs<br />
of achieving the Millennium Development<br />
Goals. Although governments often<br />
turn to external aid to fill financing gaps,<br />
donors also seem to favour financing new<br />
infrastructure over operation and maintenance<br />
(see figure 4.3).<br />
High costs of new and remedial<br />
infrastructure<br />
While operation and maintenance costs<br />
have been especially neglected, water<br />
infrastructure has not been funded at<br />
anything close to the required level. Many<br />
networks and installations in mature<br />
economies are ageing and deteriorating.<br />
Member states of the European Union are<br />
committed to upgrading their water and<br />
wastewater treatment systems to comply<br />
with EU environmental legislation. But<br />
many urban water systems in Eastern<br />
Europe, Caucasus and Central Asia are in<br />
poor condition, with no similar plans for<br />
upgrades. In developing and emerging<br />
market economies the pace of growth and<br />
urbanization, combined with rising environmental<br />
expectations, is creating the<br />
need for costly new investments.<br />
Table 4.3 gives a sense of the magnitude<br />
of investment requirements over the next<br />
58 World Water Development Report 3
Policies, laws and finance<br />
PART<br />
1<br />
20 years for water supply and wastewater<br />
services infrastructure and the gap<br />
between financing needs and projected<br />
revenues, by region. These calculations do<br />
not include other sizeable funding requirements,<br />
such as water resources development<br />
and management and water governance.<br />
21 Raising and spending these huge<br />
sums will require quickening the pace of<br />
reform (including water pricing) across the<br />
water services industry, with implications<br />
for both regulators and consumers.<br />
The cost of rehabilitating or decommissioning<br />
existing infrastructure is likely to<br />
be enormous. Repairing, strengthening or<br />
modifying older dams, for instance, will<br />
entail sizeable outlays. In extreme cases<br />
decommissioning a dam may be a rational<br />
decision (where it has outlived its purpose,<br />
where it is old and unsafe, where sedimentation<br />
is high or where river flows need<br />
to be maintained for fisheries and other<br />
ecosystems). Rehabilitating or decommissioning<br />
also depends on whether the costs<br />
of maintaining the dam exceed its expected<br />
future economic and financial benefits.<br />
Both rehabilitation and decommissioning<br />
costs are site specific. 22<br />
The cost of new water supply is rising. In<br />
developed countries and in many places<br />
elsewhere, the easiest investments for exploiting<br />
water resources have already been<br />
made. With available dam sites decreasing,<br />
water tables falling and the distances<br />
between the point of abstraction and<br />
water use increasing, the costs of exploitation<br />
and supply are rising. Costs are also<br />
pushed up by the growing need to treat<br />
water before use.<br />
Sanitation has been severely neglected. Estimates<br />
of the cost of achieving the 2015<br />
Millennium Development Goal target for<br />
sanitation vary widely, due to differences<br />
in approach and a weak information base.<br />
The World Health Organization estimates<br />
the total annual cost of meeting the target<br />
at just over $9.5 billion. 23 If estimates<br />
of current costs are correct, resources in<br />
the sanitation sector would have to be<br />
almost doubled to meet the 2015 target<br />
(although estimates of current spending<br />
probably underestimate the contributions<br />
by households to their own sanitation<br />
services). If the full cost of tertiary<br />
wastewater treatment for waste streams<br />
in urban areas is added, the total rises to<br />
$100 billion, the current value of total<br />
annual official development assistance.<br />
More cost-effective alternatives need to<br />
be explored – urgently – if the sanitation<br />
target is to be met.<br />
Table 4.3<br />
(US$ billions)<br />
Region<br />
Annual capital requirements for water supply<br />
and wastewater services and water financing<br />
gaps, by region, 2006-25<br />
Capital<br />
needed<br />
Low<br />
gap<br />
UN-Water Global Annual Assessment of<br />
Sanitation and Drinking-Water: 2008 Pilot<br />
Report – Testing A New Reporting Approach<br />
(GLAAS report) looks at the constraints to<br />
progress towards the sanitation target from<br />
the human resources, institutional capacity<br />
and financial system capacity perspectives<br />
(figure 4.4).<br />
Operation, maintenance and rehabilitation<br />
remain critical challenges. Respondents<br />
to the GLAAS survey indicated that<br />
flooding events and earthquakes were the<br />
main causes of damage to infrastructure. 24<br />
Increased weather variability linked to<br />
Medium<br />
gap<br />
High<br />
gap<br />
Eastern Europe,<br />
Caucasus and<br />
Central Asia 28.1-40.5 13.4 20.0 26.1<br />
North America 23.9-46.8 3.3 4.9 21.4<br />
Latin America 4.3-6.5 2.9 4.0 5.1<br />
Developed Asia<br />
and China 38.2-51.4 29.5 32.9 36.5<br />
Rest of world 14.3-22.6 18.5 22.4 26.1<br />
Total 92.4-148.0 67.5 84.2 115.2<br />
Note: The gaps refer to the difference in projected investment needs for three different<br />
estimates of their size and existing sources of revenue from tariffs, official development<br />
assistance and government budgets and loans.<br />
Source: Owen 2006.<br />
7<br />
6<br />
5<br />
4<br />
3<br />
2<br />
1<br />
0<br />
Figure 4.4<br />
Human<br />
resources<br />
In the few countries surveyed financial system<br />
constraints weighed heavily on achieving the<br />
Millennium Development Goals sanitation<br />
target<br />
Sanitation sector capacity in GLAAS pilot countries with data; latest available data, 2005-07<br />
(number of countries)<br />
Very high High Medium Low Very low<br />
Institutional<br />
capacity<br />
Financial system<br />
capacity<br />
Note: GLAAS is Global Annual Assessment of Sanitation and Drinking-Water.<br />
Source: Based on data from UN-Water 2008.<br />
Water in a changing world 59
PART<br />
1<br />
Chapter 4<br />
Figure 4.5<br />
75<br />
50<br />
25<br />
0<br />
Ghana<br />
Household expenditure and private sector<br />
investments in drinking water supply are<br />
generally unknown<br />
Funding sources for drinking water in GLAAS pilot countries with data, latest<br />
available data, 2006-07 (percent)<br />
Internal private sector Households<br />
Internal government External funding<br />
100<br />
Madagascar<br />
Mongolia<br />
Nepal<br />
Uganda<br />
Note: GLAAS is Global Annual Assessment of Sanitation and Drinking-Water.<br />
Source: Based on data from UN-Water 2008.<br />
Viet Nam<br />
climate change and armed conflict bring<br />
added risk.<br />
African countries, recognizing the urgency<br />
of the situation, signed the eThekwini<br />
Declaration in February 2008 in Durban,<br />
South Africa, committing them to prepare<br />
or update national sanitation and hygiene<br />
policies, allocate budget funds for sanitation,<br />
improve sanitation information and<br />
monitoring tools and increase capacity. The<br />
declaration also called on external support<br />
agencies to provide financial and technical<br />
assistance for sanitation and hygiene promotion<br />
and to improve aid coordination.<br />
Sources of financing<br />
There are three sources of revenue for<br />
financing water supply and sanitation<br />
services:<br />
• User tariffs, including payment for<br />
environmental services, which can<br />
include cross-subsidies within the sector<br />
or from other sectors (for example,<br />
electricity or other municipal services).<br />
• Public expenditures funded by taxation.<br />
• Transfers in the form of external aid,<br />
from official or philanthropic sources.<br />
External borrowing (debt, equity and<br />
bonds, facilitated by risk-management<br />
instruments such as guarantees) can help<br />
spread payments over time for large upfront<br />
investments and manage the overall<br />
cost of financing.<br />
The 2008 GLAAS pilot report raises concerns<br />
about countries’ limited resources<br />
to invest in operation, maintenance and<br />
capital rehabilitation for drinking water<br />
and sanitation systems. 25 These expenditures<br />
are difficult to assess because many<br />
are hidden in sector budgets or are not<br />
accounted for, as in the case of many<br />
private sector and household investments<br />
(figure 4.5). Data in the GLAAS report,<br />
available for three of the seven pilot countries,<br />
indicate that external funding – for<br />
many countries the main source of funds<br />
for drinking water and sanitation system<br />
investments – is directed mainly to infrastructure<br />
projects.<br />
Reviewing and revising investment needs<br />
(the demand side of financing) by reducing<br />
costs are as important in closing the<br />
financing gap as finding new sources of<br />
funds. The full cycle of expenditures has<br />
to be considered, from operation and<br />
maintenance to technological choices<br />
about equipment and its eventual replacement<br />
or upgrading. For example, improving<br />
collection efficiency and reducing<br />
unaccounted for losses in distribution<br />
systems can make more water available for<br />
new consumers and help fund operations.<br />
Demand-side considerations also include<br />
such under lying determinants as coverage<br />
levels, services levels and environmental<br />
regulations.<br />
Fund disbursements can also be accelerated,<br />
so that disbursement delays do not<br />
cause new funding to be postponed. Inefficient<br />
budgeting and budget allocation<br />
processes can lead to such disbursement<br />
delays. To ensure that funds are disbursed<br />
more efficiently during the budget period,<br />
funds can be allocated to regions of a<br />
country or to local authorities according<br />
to their relative capacity to implement<br />
projects. Finalizing the budget process<br />
before the budget year starts makes it possible<br />
to begin disbursements in the first<br />
quarter of the year.<br />
A strategic financial plan, based on an<br />
in-depth examination of all demand- and<br />
supply-side aspects affecting the financing<br />
gap, will help ensure the financial sustainability<br />
of projects. It will direct investment<br />
choices towards the most financially and<br />
functionally appropriate processes and<br />
technologies, thus maximizing benefits.<br />
And it will make projects more attractive<br />
to external financiers by reducing the<br />
perception of risk.<br />
A lot of funds move through the water<br />
system but is used inefficiently. Examples<br />
include high payments to informal providers<br />
outside the public networks, payments<br />
60 World Water Development Report 3
Policies, laws and finance<br />
PART<br />
1<br />
to corrupt operators to obtain water from<br />
networks and large public subsidies that<br />
end up in the wrong hands. Households<br />
spend large sums on coping strategies,<br />
such as time and money spent on alternative<br />
sources of water and on household<br />
water filters.<br />
Tariffs – pricing water and willingness to<br />
pay. The obvious source of finance for the<br />
recurrent costs of water services is user<br />
charges, supplemented by government<br />
subsidies. The continuing underpricing<br />
of water to consumers encourages waste<br />
and use of water for low-value purposes in<br />
all sectors, depriving the sector of essential<br />
funds. This is a major contributor to<br />
underinvestment in water infrastructure,<br />
management and services and imposes<br />
heavy costs on society.<br />
Maintaining the quality and reliability of<br />
services is essential (box 4.4), even if there<br />
is a parallel push for increased access, since<br />
these characteristics affect users’ willingness<br />
to pay. Transparency, accountability<br />
and operational efficiency in service provision<br />
are also essential to user satisfaction.<br />
Affordability also needs to be determined.<br />
It is based on macroaffordability – of investment<br />
choices (driven by coverage, service<br />
levels, technology and other choices)<br />
and the cost efficiency of service provision<br />
– and household affordability, determined<br />
by current expenditure on water and sanitation<br />
services (including the hidden costs<br />
of securing access when people lack access<br />
to formal services and the consequences of<br />
access to unsafe services) and their willingness<br />
to pay for improved service levels.<br />
Charging for water. Although prices can be<br />
strong drivers of positive change in a well<br />
functioning economic system, in practice,<br />
prices have had a relatively minor role in<br />
managing water demand. Many people are<br />
deeply ambivalent about using water prices<br />
to manage water resources or are strongly<br />
opposed to pricing water at the cost required<br />
to deliver it to consumers, especially<br />
in the politically sensitive segments<br />
of agriculture and urban households. As a<br />
result, water is often grossly underpriced.<br />
One survey of municipal water utilities<br />
in low-income countries found that 89%<br />
had no cost recovery measures in place,<br />
9% had partial cost recovery of operation<br />
and maintenance costs, and only 3% made<br />
any effort to recoup the costs of capital<br />
outlays. 26<br />
A common yardstick for assessing the affordability<br />
of water charges for households<br />
Box 4.4 Dalian water supply project in China –<br />
successful expansion of services<br />
Dalian, a port city at the southern<br />
end of the Liaodong Peninsula, in<br />
northeastern China, was declared<br />
an ‘open’ coastal city in 1984 and<br />
given considerable autonomy in<br />
its economic planning. The Dalian<br />
Economic and Technology Development<br />
Zone, established in 1988,<br />
has become one of China’s most<br />
successful economic zones. By the<br />
early 1990s, however, water shortages<br />
had become a serious constraint<br />
to economic growth. Many areas had<br />
water service for only a few hours a<br />
day. Frequent service disruptions had<br />
major public health implications. The<br />
Dalian Water Supply Project, begun<br />
in the mid-1990s, provided new<br />
infrastructure to address the water<br />
shortages and meet increasing water<br />
demands.<br />
is that payments should not exceed 3% (in<br />
some cases 5%) of net household income.<br />
In practice, surveys show that in developed<br />
countries households connected to<br />
urban public systems pay on average 1% of<br />
incomes on water bills, including the cost<br />
of sewerage, which may be double that for<br />
water. Such an average is not a very reliable<br />
indicator, however, especially given<br />
the wide variability among income levels<br />
in a country. Generally speaking, poorer<br />
groups tend to pay a higher share of<br />
household income for water. In developing<br />
countries the picture is complicated by the<br />
widespread use of informal and small-scale<br />
private water distributors charging full<br />
market prices; in these cases the poorest<br />
households can pay 3%–11% of income on<br />
water. 27<br />
As recognition of this inequitable economic<br />
burden on the poor has spread,<br />
pressure on governments and service<br />
providers has increased to ensure delivery<br />
of a minimal supply of potable water to all<br />
households at a reasonable price. Achieving<br />
this objective would require tariff<br />
rates based on a household’s ability to pay<br />
and subsidies that cover the excess cost of<br />
service delivery for those who can least<br />
afford to pay.<br />
Where pricing is used to cover water supply<br />
costs (for example, cities committed<br />
to water demand management, private<br />
irrigation schemes, markets for irrigation<br />
water and penalties for water pollution), it<br />
is an important driver of reforms. Where<br />
The project achieved its objectives. All<br />
constructed facilities were operating<br />
satisfactorily, and the 73,000<br />
residential water connections in Dalian<br />
exceeded the predicted number. The<br />
project also increased water supply to<br />
commerce and industry, removing potential<br />
constraints to economic expansion<br />
and improving the investment<br />
environment. The project evaluation<br />
confirmed two important findings.<br />
Local government commitment was<br />
the most important contributor to the<br />
success of the project. And water consumers<br />
will accept the need for higher<br />
tariffs once they are convinced that<br />
services are adequate and reliable.<br />
Water tariffs were increased substantially<br />
from 1995 to 2001, at an average<br />
annual rate of 12.8%.<br />
Source: ADB 2004.<br />
Water in a changing world 61
PART<br />
1<br />
Chapter 4<br />
Where prices<br />
cannot adjust<br />
to financial<br />
realities, stresses<br />
emerge as water<br />
shortages, water<br />
waste, inefficient<br />
water use,<br />
inadequate water<br />
infrastructure<br />
investments<br />
and poor waterrelated<br />
services<br />
prices cannot adjust to financial realities,<br />
stresses emerge as water shortages, water<br />
waste, inefficient water use, inadequate<br />
water infrastructure investments and<br />
poor water-related services. Water quality<br />
may be inconsistent, and maintenance<br />
and rehabilitation of distribution systems<br />
may be neglected. Capital investment<br />
may also be inadequate, resulting in the<br />
failure to develop adequate water supply<br />
and sanitation services. However, even<br />
in situations where pricing is actively<br />
used to cover water supply costs, the long<br />
history of water as a public good means<br />
that water prices have been heavily subsidized<br />
by tax- funded distributions from<br />
individuals and corporations that may<br />
not be direct beneficiaries of the services<br />
provided.<br />
In agriculture some farmers rely on public<br />
irrigation systems while others have private<br />
arrangements (for example, groundwater<br />
and water harvesting systems). In<br />
privately owned systems energy subsidies<br />
(for pumping water) are a key factor affecting<br />
efficiency. Farmers using public<br />
irrigation systems often pay little or nothing<br />
towards recurrent costs and usually<br />
nothing towards the capital costs of the<br />
irrigation infrastructure. This affects how<br />
farmers use water, as one survey in India<br />
discovered:<br />
Farmers have no incentive to use<br />
water efficiently as charges are<br />
too low and are based on the area<br />
irrigated. Inefficient water use<br />
has led to severe environmental<br />
problems – rising groundwater<br />
levels, water-logging and soil salinity.<br />
Administration is ineffective.<br />
Assessment and collection of fees<br />
is often carried out by different<br />
departments, or a department not<br />
related to irrigation. Farmers need<br />
to be involved in setting rates,<br />
because at present they simply oppose<br />
any suggestion of an increase<br />
in price. 28<br />
Though widely accepted, the ‘polluter<br />
pays’ principle has not had a major impact<br />
on polluters’ behaviour or on raising funds<br />
that could be allocated for environmental<br />
purposes, with the exception of developed<br />
countries and a much smaller number<br />
of developing countries. Although not a<br />
financing source, the alternative method<br />
of water pollution quotas has similarly<br />
been limited to the industrial, urbanized<br />
economies, with almost negligible successful<br />
examples from developing countries<br />
(see chapter 8). 29<br />
Multipurpose water projects that crosssubsidize<br />
irrigation and household water<br />
use from hydropower revenues are another<br />
form of tariff-based financing. The hydropower<br />
components of dams and water<br />
storage schemes tend to perform better<br />
financially than the associated irrigation<br />
projects, which often fail to recover both<br />
operating and capital costs. Thus, the<br />
power element cross-subsidizes irrigation<br />
and other water users – and often navigation,<br />
flood control and other public goods<br />
as well. In the United States this kind of<br />
cross-subsidy was a planned part of the<br />
management of the Grand Coulee Dam in<br />
the Columbia River Basin and of the major<br />
river basin development works of the Tennessee<br />
Valley Authority. 30<br />
Role of the private sector. Several reports<br />
conclude that the private sector provides<br />
very few water supply and sanitation services<br />
in developing countries. The United<br />
Nations Development Programme’s Human<br />
Development Report 2006, for example,<br />
estimates that although the number of<br />
people served by the private water sector<br />
grew from roughly 50 million in 1990<br />
to 300 million in 2002, less than 3% of<br />
people in developing countries are covered<br />
by private or partially private companies.<br />
31 These figures almost certainly<br />
understate the real scale of private sector<br />
service provision, since they consider only<br />
larger-scale private operations and investments.<br />
Private operators also include small<br />
and medium-size companies with fixed or<br />
mobile distribution systems as well as the<br />
much larger spread of informal operators<br />
that cover huge swathes of low-income<br />
urban areas.<br />
The substantial role of small and mediumsize<br />
entrepreneurs and operators is just<br />
beginning to be studied (figure 4.6). A<br />
World Bank report found 10,000 small<br />
service providers in a limited sample of 49<br />
countries, 32 while an International Institute<br />
for Environment and Development<br />
study estimates that the global number<br />
may exceed 1 million. 33 In addition, the<br />
provision of infrastructure by property developers<br />
has not been examined but could<br />
be substantial.<br />
The landscape for private water operators<br />
today is very different from that of<br />
a decade ago. Several major multinationals<br />
have withdrawn from international<br />
projects, leaving just two or three to<br />
pursue system concessions, build-operatetransfer<br />
and management contracts,<br />
especially in the Middle East, China and<br />
South-East and East Asia. The gap is being<br />
62 World Water Development Report 3
Policies, laws and finance<br />
PART<br />
1<br />
filled by new private water companies<br />
based mainly in China, South-East Asia,<br />
the Russian Federation and Latin America,<br />
servicing emerging local and regional<br />
markets. Small-scale and informal water<br />
providers have continued to enlarge their<br />
share of urban markets in developing<br />
countries.<br />
A high proportion of the contracts won<br />
by the new market entrants are for desalination<br />
and wastewater treatment, which<br />
address the growing water scarcity in arid<br />
regions and the serious pollution caused<br />
by untreated municipal wastewater. The<br />
diversity of the new market entrants, their<br />
access to local sources of finance and their<br />
typically good political connections augur<br />
well for successful implementation.<br />
External private investment in the water<br />
sector is significant, of the same order as<br />
that of official development assistance<br />
(figures 4.7 and 4.8). The domestic private<br />
sector is becoming a water funding source<br />
in some middle-income countries, where<br />
powerful local conglomerates are moving<br />
into water services, drawing on their own<br />
equity and that of other local commercial<br />
sources. Further down the financial scale<br />
small informal operators dominate large<br />
portions of the water market in urban and<br />
peri-urban communities. Although some<br />
of these operators invest in networks, most<br />
use mobile facilities, financed by their<br />
own equity or short-term credit. At the<br />
street level bottled water sellers have proliferated.<br />
A necessity in many areas across<br />
developing countries, where failing public<br />
supply systems are often contaminated by<br />
wastewater or storm water, the use of bottled<br />
water is a lifestyle choice in developed<br />
countries.<br />
Figure 4.6<br />
Urban residents served, 1991-2007 (millions)<br />
200<br />
150<br />
100<br />
50<br />
0<br />
1991<br />
1993<br />
1995<br />
1997<br />
Source: Based on data from Marin 2009.<br />
Figure 4.7<br />
US$ billions<br />
12<br />
10<br />
8<br />
6<br />
4<br />
2<br />
0<br />
1991<br />
1993<br />
Private water operators have a substantial<br />
role in developing and developed countries<br />
1995<br />
1997<br />
1999<br />
1999<br />
United Kingdom<br />
2001<br />
2001<br />
2003<br />
2005<br />
Developing<br />
countries<br />
Spain<br />
Other developed countries<br />
2003<br />
2005<br />
France<br />
External private investment in the water<br />
sector, though variable, has been significant<br />
since the early 1990s<br />
2007<br />
2007<br />
Note: Refers to management and lease contracts, concessions (or management and operation<br />
contracts with major private capital commitments), greenfield projects and divestitures<br />
for potable water generation and distribution and sewerage collection and treatment.<br />
Source: World Bank Private Participation in Infrastructure Database (http://ppi.worldbank.<br />
org).<br />
Government financing from public revenues.<br />
The public sector accounts for more than<br />
70% of investment in the water sector. 34<br />
There are marked differences in how – and<br />
how much – governments finance and<br />
subsidize the water sector. In many poor<br />
countries, where fiscal constraints are<br />
severe, water supply is only one of many<br />
priority sectors that governments are<br />
under domestic pressure or international<br />
commitment to finance.<br />
Funding for infrastructure has varied with<br />
economic development and urbanization.<br />
At earlier stages the central government<br />
generally supports infrastructure provision<br />
through subsidies and administrative<br />
assistance (box 4.5). As countries develop,<br />
the portion of central government support<br />
declines, and the cost of environmental<br />
Figure 4.8<br />
Official development assistance to the water sector ($ billions)<br />
5<br />
4<br />
3<br />
2<br />
1<br />
Development Assistance Committee<br />
countries, moving average<br />
0<br />
1971<br />
1976<br />
1981<br />
Source: Based on OECD-DAC 2008.<br />
Official development assistance to the water<br />
supply and sanitation sector is rising again<br />
after a decline during the 1990s<br />
Development Assistance Committee countries, annual<br />
Multilateral agencies, moving average<br />
1986<br />
Multilateral agencies, annual<br />
1991<br />
1996<br />
2001<br />
2006<br />
Water in a changing world 63
PART<br />
1<br />
Chapter 4<br />
G-8 leaders in<br />
June 2002 made<br />
a commitment to<br />
give priority to<br />
the water sector<br />
Box 4.5<br />
Table 4.4<br />
(US$ millions)<br />
services is transferred to users, polluters<br />
and local governments.<br />
Some countries that have benefited from<br />
debt relief or from the oil and commodities<br />
boom have transformed their public<br />
finances, but this has not necessarily<br />
translated into improved water service<br />
provision. Several emerging market<br />
economies, with large concentrations<br />
of poor, unserved populations, are in<br />
stronger budgetary positions than they<br />
were a decade ago, though this is being<br />
placed at risk by the recent fluctuations<br />
in the cost of oil, power and food and the<br />
global financial crisis, with subsidies rising<br />
accordingly. Improving budgetary circumstances<br />
provide opportunities for increasing<br />
investments in the development of the<br />
water sector.<br />
Financing through external aid. Official<br />
development assistance from donor countries<br />
and multilateral donors to the water<br />
supply and sanitation sector increased<br />
Commitments of official development assistance<br />
from bilateral and multilateral agencies, 2004-06<br />
Sector 2004 2005 2006<br />
Water transport 416 503 304<br />
Hydropower plants 755 480 652<br />
Agricultural water resources 608 830 790<br />
Water supply and sanitation 3,127 4,405 3,879<br />
Total water sector 4,951 6,218 5,625<br />
Total all sectors 79,431 107,078 104,369<br />
Water sector as share of all sectors (%) 6.2 5.8 5.4<br />
Source: OECD, DCD/DAC 2007.<br />
Subsidizing water supply and sanitation in<br />
the Republic of Korea<br />
In the Republic of Korea the central<br />
government provides direct subsidies<br />
for water supply and sanitation<br />
infrastructure to local governments<br />
or service providers. The amount<br />
of the subsidy depends on the size<br />
of the city and the type of facility.<br />
Subsidies differ for construction and<br />
operation. Typically, subsidies are<br />
50%-80% for water source development<br />
in rural areas and 50% for local<br />
waterworks improvements. Wastewater<br />
treatment is eligible for a 50%<br />
grant, and sludge treatment for loans<br />
of 30%-70%.<br />
For municipal water supply, revenue<br />
from tariffs now covers an increasing<br />
share of production costs, rising from<br />
69% in 1997 to 83% in 2005. For regional<br />
water supply systems supplied<br />
by the national water company, Korea<br />
Water Resources Corporation (Kwater),<br />
full cost recovery was achieved<br />
by 2004. Tariffs still fall short of actual<br />
costs for sewage treatment. During<br />
1997-2004 the central government<br />
paid 53% of the total investment costs<br />
for sewage treatment, using proceeds<br />
from the national liquor tax.<br />
Source: OECD forthcoming.<br />
during the 1970s and 1980s but decreased<br />
during the 1990s, with less aid for large<br />
infrastructure, before rising again in 2000<br />
(see figure 4.8).<br />
Support from multilateral agencies remained<br />
relatively stagnant from the 1970s<br />
– when it was about the same as bilateral<br />
assistance – until about 2000, when both<br />
sources of financial aid began to increase.<br />
But it still remained substantially less than<br />
official development assistance from bilateral<br />
sources.<br />
Leaders at the meeting of the G-8 in<br />
Evian, France, in June 2002 made a commitment<br />
to give priority to the water<br />
sector. Official development assistance<br />
increased substantially in the years immediately<br />
thereafter. While the amount<br />
going to the water supply and sanitation<br />
sector increased, aid to the other water<br />
sectors remained relatively unchanged<br />
(table 4.4). However, overall lending for<br />
water remained at less than 6% of total<br />
official development assistance, and the<br />
share of total lending declined.<br />
External assistance from philanthropic<br />
sources, such as foundations and religious<br />
groups, highlights an awareness of<br />
the importance of water and sanitation.<br />
Although these funds are generally much<br />
lower than those from multilateral and<br />
bilateral sources, a few of the largest foundations<br />
(for example, the Bill and Melinda<br />
Gates Foundation) can rival some bilateral<br />
sources.<br />
Recent financing initiatives – a new<br />
financing agenda<br />
Over the last five years there have been<br />
several key initiatives on shaping the agenda<br />
of international water financing, notably<br />
the World Panel on Financing Water<br />
Infrastructure (chaired by Michel Camdessus),<br />
the Task Force on Financing Water<br />
for All (chaired by Angel Gurria) and the<br />
UN Secretary-General’s Advisory Board on<br />
Water and Sanitation (UNSGAB). Financing<br />
Water for All, the report of the World<br />
Panel on Financing Water Infrastructure,<br />
addresses the financial architecture of<br />
the global water sector, including many<br />
proposals to improve its governance. 35 The<br />
Gurria task force report focuses on factors<br />
influencing the demand for finance<br />
and the scope for developing the financial<br />
capacity of subnational entities. 36 The<br />
UNSGAB stresses the importance of capacity<br />
building, especially in local authorities,<br />
and inspired creation of the Global Water<br />
Operators Partnership Alliance for peer<br />
group support. 37<br />
64 World Water Development Report 3
Policies, laws and finance<br />
PART<br />
1<br />
These initiatives occurred while domestic<br />
savings in emerging market economies<br />
were growing rapidly and local capital<br />
markets were developing. Sharp rises in<br />
the price of oil and other primary commodities<br />
had enriched producer countries<br />
and transformed their public finances,<br />
while causing budgetary problems in<br />
primary-commodity-importing countries.<br />
International commercial finance<br />
for water has become sharply polarized.<br />
Lenders and portfolio 38 investors have<br />
eagerly pursued opportunities in sound<br />
water companies, solvent municipalities<br />
and profitable projects (such as desalination),<br />
but many countries and municipalities<br />
have been relegated to financial<br />
backwaters.<br />
Recent policy developments<br />
A number of policies and financing tools<br />
have been developed to respond to this<br />
new agenda: 39<br />
• Increasing commitments of official development<br />
assistance for water – and in<br />
more user-friendly forms. International<br />
aid for water has bottomed out and<br />
commitments are starting to rise, led<br />
by a few donor agencies.<br />
• Using official development assistance<br />
to leverage other financial sources. An<br />
approach that has made a promising<br />
beginning in Kenya and elsewhere is<br />
to use output-based aid to promote<br />
microfinance.<br />
• Establishing national water financing<br />
strategies. Governments in Africa,<br />
Eastern Europe and the Caucasus and<br />
Central Asia and elsewhere are producing<br />
coherent financing strategies,<br />
supported by programmes of the Organisation<br />
for Economic Co- operation<br />
and Development, the EU Water<br />
Institute, the World Bank Water and<br />
Sanitation Program and other agencies<br />
and programmes.<br />
• Promoting finance to subsovereign entities.<br />
In most countries responsibility<br />
for water services is devolved to<br />
subsovereign layers of administration.<br />
Donors have been adapting their<br />
products and procedures to facilitate<br />
the provision of finance to subsovereign<br />
agencies.<br />
• Establishing facilities to provide finance<br />
at decentralized levels. Much of the<br />
development of household water<br />
and sanitation services arises from<br />
community initiatives, organization<br />
and finance. Among recently created<br />
finance facilities that operate at this<br />
level are the African Water Facility,<br />
the EU Water Facility and the Rural<br />
Water Supply and Sanitation Initiative<br />
of the African Development<br />
Bank.<br />
• Developing guarantees and risk-sharing<br />
instruments. Guarantees and other<br />
forms of credit enhancement can lift<br />
local borrowers and bond issuers over<br />
the critical threshold of creditworthiness<br />
and mitigate specific risks.<br />
International financial institutions<br />
and other agencies have improved<br />
their capacity for risk sharing, and<br />
several new bodies have been formed<br />
specifically for this purpose (such as<br />
GuarantCo). 40<br />
• Developing local capital markets and<br />
local-currency finance. A number of<br />
countries (such as India and South Africa,<br />
some countries in Latin America<br />
and South-East and East Asia) have<br />
municipalities and utilities with sufficient<br />
financial standing to attract loan<br />
finance or to issue their own bonds. A<br />
significant proportion of the unserved<br />
populations (almost a half for water<br />
and more than a third for sanitation)<br />
live in countries classified as middle<br />
income, with the potential to raise<br />
subsovereign finance of this type.<br />
• Increasing role of small-scale local water<br />
providers. It is estimated that smallscale<br />
providers serve 25% of the urban<br />
population in Latin America and East<br />
Asia and 50% in Africa and South East<br />
Asia. 41<br />
• Instituting tariff reform and the principle<br />
of sustainable cost recovery. In most<br />
cases tariffs will be the main source<br />
of revenue for covering the recurrent<br />
costs of water services, although full<br />
cost recovery through tariffs is rarely<br />
feasible in poor countries. Sustainable<br />
cost recovery focuses on securing all<br />
three of the basic sources of revenue<br />
for water and sanitation services<br />
(tariffs, taxes and external aid) as predictable<br />
sources of revenue for water<br />
operators, which can be used to leverage<br />
other sources of funding.<br />
• Paying for environmental services.<br />
Environmental goods and services<br />
take many forms, including potable<br />
water supply, irrigation water, flood<br />
control benefits, water for transportation<br />
and aesthetic benefits. Payment<br />
Lenders and<br />
investors<br />
have pursued<br />
opportunities<br />
in sound water<br />
companies, solvent<br />
municipalities<br />
and profitable<br />
projects, but many<br />
countries and<br />
municipalities have<br />
been relegated<br />
to financial<br />
backwaters<br />
Water in a changing world 65
PART<br />
1<br />
Chapter 4<br />
systems for such environmental<br />
services are easier to implement and<br />
administer for more visible and direct<br />
uses (such as admission costs for recreational<br />
uses).<br />
Challenges<br />
Developing and managing water resources<br />
to meet human needs and maintain essential<br />
ecosystems entail financial costs.<br />
The challenge is both to have more funds<br />
flow to the water sector and to ensure its<br />
financial sustainability. Sound, strategic<br />
financial planning is needed to balance<br />
funding requirements with cost-effective<br />
management that focuses on demand<br />
as well as supply. Full cost recovery has<br />
been advocated as a solution to the water<br />
financing crisis for many years. In the<br />
real world, however, water resources<br />
management and services delivery always<br />
receive some level of subsidy. Keeping<br />
in mind the obligation to meet the basic<br />
water services needs of all, the challenge<br />
for policy- makers is to make decisions<br />
about the acceptable trade-offs among<br />
different objectives and about who bears<br />
the costs.<br />
Notes<br />
1.<br />
United Nations 1945.<br />
2. Transboundary Freshwater Dispute<br />
Database (www.transboundarywaters.<br />
orst.edu).<br />
3. www.unece.org/env/water/.<br />
4. This section draws on Boelens 2008.<br />
5. Government of Australia 2008.<br />
6. Hendry 2008.<br />
7. See von Benda-Beckmann, von Benda-<br />
Beckmann, and Spiertz 1998.<br />
8. Cosgrove and Rijsberman 2000, p. 64.<br />
9. Garces-Restrepo, Vermillion, and Muñoz<br />
2007.<br />
10. Garces-Restrepo, Vermillion, and Muñoz<br />
2007.<br />
11. Transparency International 2008.<br />
12. Stålgren 2006.<br />
13. Transparency International 2008.<br />
14. Transparency International 2008.<br />
15. ASCE 2008.<br />
16. WBCSD 2005.<br />
17. United Nations 2008, p. vii.<br />
18. Global Water Intelligence 2004.<br />
19. EAP Task Force 2007.<br />
20. Winpenny 2008.<br />
21. Rees, Winpenny, and Hall 2008.<br />
22. World Commission of Dams 2000.<br />
23. Hutton and Haller 2004.<br />
24. UN-Water 2008.<br />
25. UN-Water 2008.<br />
26. Olivier 2007.<br />
27. UNDP 2006.<br />
28. Bosworth et al. 2002.<br />
29. Kraemer et al. 2003.<br />
30. World Commission on Dams 2000.<br />
31. UNDP 2006.<br />
32. Kariuki and Schwartz 2005.<br />
33. McGranahan and Owen 2006.<br />
34. UNDP 2006.<br />
35. Winpenny 2003.<br />
36. van Hofwegan and Task Force on<br />
Financing Water for All 2006.<br />
37. UNSGAB 2006.<br />
38. Purchase of a fixed-interest security,<br />
such as a bond, or equity shares giving<br />
less than 10% ownership of a company.<br />
39. For a full description of these and other<br />
policies and tools, see Winpenny 2003<br />
and van Hofwegen and Task Force on<br />
Financing Water for All 2006.<br />
40. Winpenny 2005.<br />
41. Dardenne 2006; McIntosh 2003.<br />
References<br />
ADB (Asian Development Bank). 2004.<br />
Evaluation Highlights of 2003. Manila,<br />
Philippines: Asian Development Bank.<br />
ASCE (American Society of Civil Engineers).<br />
2008. 2005 Report Card on<br />
America’s Infrastructure. 2008 Update.<br />
American Society of Civil Engineers.<br />
www.asce.org/reportcard/2005/index.<br />
cfm.<br />
Boelens, R. 2008. The Rules of the Game<br />
and the Game of the Rules: Normalization<br />
and Resistance in Andean Water<br />
Control. PhD diss., Wageningen University,<br />
The Netherlands.<br />
Bosworth, B., G. Cornish, C. Perry, and F.<br />
van Steenbergen. 2002. Water Charging<br />
in Irrigated Agriculture: Lessons<br />
from the Literature. Report OD 145, HR<br />
Wallingford, Ltd., Wallingford, UK. www.<br />
dfid-kar-water.net/w5outputs/electronic_<br />
outputs/od145.pdf.<br />
CEC (Commission of the European Communities).<br />
2007. Towards Sustainable<br />
Water Management in the European<br />
Union – First Stage in the Implementation<br />
of the Water Framework Directive<br />
2000/60/EC. Communication from the<br />
Commission to the European Parliament<br />
and the Council [SEC(2007) 362]<br />
[SEC(2007) 363], Brussels.<br />
Cosgrove, W., and F. Rijsberman. 2000.<br />
World Water Vision: Making Water Everybody’s<br />
Business. London: Earthscan.<br />
Dardenne, B. 2006. The Role of the Private<br />
Sector in Peri-urban or Rural Water Services<br />
in Emerging Countries. ENV/EPOC/GF/<br />
SD(2006)2. Organisation for Economic<br />
Co-operation and Development, Environment<br />
Directorate, Paris.<br />
EAP Task Force for the Implementation of<br />
the Environmental Action Program for<br />
Eastern Europe, Caucasus and Central<br />
Asia. 2007. Financing Water Supply<br />
and Sanitation in EECCA Countries and<br />
Progress in Achieving the Water-Related<br />
Millennium Development Goals. Paris:<br />
Organisation for Economic Co-operation<br />
and Development.<br />
European Parliament and Council. 2000.<br />
Directive 2000/60/EC of the European<br />
Parliament and of the Council of 23<br />
October 2000: Establishing a Framework<br />
for Community Action in the Field<br />
of Water Policy. Official Journal of the<br />
European Communities 22 (12). http://<br />
eur-lex.europa.eu/LexUriServ/LexUriServ.<br />
do?uri=OJ:L:2000:327:0001:0072:EN:<br />
PDF.<br />
Garces-Restrepo, C., D. Vermillion, and<br />
G. Muñoz. 2007 Irrigation Management<br />
Transfer: Worldwide Efforts and Results.<br />
FAO Water Reports No. 32. Rome: Food<br />
and Agriculture Organization of the<br />
United Nations.<br />
Global Water Intelligence. 2004. Tariffs:<br />
Half Way There. Oxford, UK: Global<br />
Water Intelligence.<br />
Government of Australia. 2008. Water Act<br />
2007. Act 137. C2007A00137. www.<br />
comlaw.gov.au/ComLaw/Legislation/<br />
Act1.nsf/0/80C5168EF63926C2CA2574<br />
1200026703/$file/1372007.pdf.<br />
Hendry, S. 2008. Analytical Framework for<br />
National Water Law Reform/Analytical<br />
Framework for Reform of Water Services<br />
Law. PhD diss., University of Dundee,<br />
United Kingdom.<br />
Hutton, Guy, and Laurence Haller. 2004.<br />
Evaluation of the Costs and Benefits of<br />
Water and Sanitation Improvements at<br />
the Global Level. Geneva: World Health<br />
Organization.<br />
66 World Water Development Report 3
Policies, laws and finance<br />
PART<br />
1<br />
Kariuki, M., and J. Schwartz. 2005. Small-<br />
Scale Private Service Providers of Water<br />
Supply and Electricity. World Bank Working<br />
Paper 074, World Bank, Washington,<br />
DC.<br />
Kraemer, R. A., Z. G. Castro, R. S. da<br />
Motta, and C. Russell. 2003. Economic<br />
Instruments for Water Management:<br />
Experiences from Europe and Implications<br />
for Latin America and the Caribbean.<br />
Washington, DC: Inter-American Development<br />
Bank.<br />
Marin, Philippe. 2009. Public-Private<br />
Partnerships for Urban Water Utilities:<br />
A Review of Experiences in Developing<br />
Countries. Public-Private Infrastructure<br />
Advisory Facility and World Bank, Washington,<br />
DC.<br />
McGranahan, G., and D. L. Owen. 2006.<br />
Local Water and Sanitation Companies<br />
and the Urban Poor. Human Settlements<br />
Discussion Paper (Water 04). London:<br />
International Institute for Environment<br />
and Development.<br />
McIntosh. A. C. 2003. Asian Water Supplies:<br />
Reaching the Urban Poor. Manila: Asian<br />
Development Bank, and London: International<br />
Water Association.<br />
Moss, J., G. Wolff, G. Gladden, and E. Guttieriez.<br />
2003. Valuing Water for Better<br />
Governance: How to Promote Dialogue<br />
to Balance Social, Environmental, and<br />
Economic Values. White paper for the<br />
Business and Industry CEO Panel for<br />
Water. Presented at the CEO plenary<br />
session of the Third World Water Forum,<br />
10 March, Osaka, Japan. www.wbcsd.<br />
org/DocRoot/8d4hpTlQ6FCa4jn7Y5Cl/<br />
Valuing_water_report.pdf.<br />
OECD (Organisation for Economic Cooperation<br />
and Development). Forthcoming.<br />
Strategic Financial Planning for<br />
Water Supply and Sanitation [provisional<br />
title]. Paris: Organisation for Economic<br />
Co-operation and Development.<br />
OECD (Organisation for Economic Cooperation<br />
and Development)-DAC<br />
(Development Assistance Committee).<br />
2008. Measuring Aid to Water<br />
Supply and Sanitation, Statistics on<br />
Aid to the Water Sector. Organisation<br />
for Economic Co-operation and<br />
Development, Paris. www.oecd.org/<br />
dataoecd/32/37/41750670.pdf.<br />
OECD, DCD/DAC (Organisation for Economic<br />
Co-operation and Development,<br />
Development Co-operation Directorate,<br />
Development Assistance Committee).<br />
2007. Development Database on<br />
Aid Activities: Creditor Reporting System:<br />
Aid Activities in Support of Water Supply<br />
and Sanitation. Paris. www.oecd.org/<br />
document/0/0,2340,en_2649_34447<br />
_37679488_1_1_1_1,00.html.<br />
Olivier, A. 2007. Affordability: Principles and<br />
Practice. Presentation to Organisation for<br />
Economic Co-operation and Development<br />
Expert Meeting on Sustainable Financing<br />
for Affordable Water Services: From Theory<br />
to Practice, 14-15 November, Paris.<br />
Owen, David Lloyd. 2006. Financing Water<br />
and Wastewater to 2025: From Necessity<br />
to Sustainability. New York: Thomson<br />
Financial.<br />
Queensland Government. 2000. Water<br />
Act 2000. Act 34. Brisbane, Queensland.<br />
www.legislation.qld.gov.au/LEGISLTN/<br />
ACTS/2000/00AC034.pdf.<br />
Rees, J., J.Winpenny, and A. Hall. 2008.<br />
Water Financing and Governance. GWP<br />
Technical Committee, Background Paper<br />
12, Global Water Partnership.<br />
Roper, H., C. Sayers, and A. Smith. 2006.<br />
Stranded Irrigation Assets. Staff Working<br />
Paper, Australian Government Productivity<br />
Commission, Melbourne. www.<br />
pc.gov.au/research/staffworkingpaper/<br />
strandedirrigation<br />
Stålgren, P. 2006. Worlds of Water: Worlds<br />
Apart. How Targeted Domestic Actors<br />
Transform International Regimes. Göteborg<br />
University, Göteborg, Sweden.<br />
Transparency International. 2008. Global<br />
Corruption Report 2008: Corruption in the<br />
Water Sector. Cambridge, UK: Cambridge<br />
University Press.<br />
UNDP (United Nations Development<br />
Programme). 2006. Human Development<br />
Report 2006: Beyond Scarcity: Power,<br />
Poverty and the Global Water Crisis. New<br />
York: Palgrave Macmillan.<br />
———. 2008. Creating Value for All: Strategies<br />
for Doing Business with the Poor. New York:<br />
United Nations Development Programme.<br />
United Nations. 1945. Statute of the<br />
International Court of Justice. Charter of<br />
the United Nations. United Nations, New<br />
York. www.icj-cij.org/documents/index.<br />
php?p1=4&p2=2&p3=0.<br />
———. 2008. World Economic and Social Survey<br />
2008: Overcoming Economic Insecurity.<br />
New York: Department of Economic<br />
and Social Affairs, United Nations.<br />
UNSGAB (United Nations Secretary General’s<br />
Advisory Board on Water and<br />
Sanitation). 2006. Hashimoto Action<br />
Plan (formerly known as The Compendium<br />
of Actions). United Nations Secretary<br />
General’s Advisory Board on Water and<br />
Sanitation, New York.<br />
UN-Water. 2008. UN-Water Global Annual<br />
Assessment of Sanitation and Drinking-<br />
Water (GLAAS): 2008 Pilot – Testing a<br />
New Reporting Approach. Geneva: World<br />
Health Organization.<br />
van Hofwegan, Paul, and Task Force on Financing<br />
Water for All. 2006. Enhancing<br />
Access to Finance for Local Governments:<br />
Financing Water for Agriculture. Chaired<br />
by Angel Gurria. Marseille, France: World<br />
Water Council.<br />
von Benda-Beckmann, K., F. von Benda-<br />
Beckmann, and J. Spiertz. 1998. Equity<br />
and Legal Pluralism: Taking Customary<br />
Law into Account in Natural Resource<br />
Policies. In Searching for Equity: Conceptions<br />
of Justice and Equity in Peasant Irrigation,<br />
ed. R. Boelens and G. Dávila. Assen,<br />
The Netherlands: Van Gorcum.<br />
WBCSD (World Business Council for Sustainable<br />
Development). 2005. Water<br />
Facts and Trends. World Business Council<br />
on Sustainable Development, Washington,<br />
DC.<br />
WCD (World Commission of Dams).<br />
2000. Dams and Development: A New<br />
Framework for Decision-Making. London:<br />
Earthscan.<br />
Winpenny, James. 2003. Financing Water<br />
For All. Report of the World Panel on Financing<br />
Water Infrastructure, chaired by<br />
Michel Camdessus. Kyoto: World Water<br />
Council, 3rd World Water Forum, and<br />
Global Water Partnership.<br />
———. 2005. Guaranteeing Development?<br />
The Impact of Financial Guarantees. Paris:<br />
Organisation for Economic Co-operation<br />
and Development, Development Centre<br />
Studies, Paris.<br />
———. 2008. Financing Strategies for Water<br />
Supply and Sanitation: A Report from the<br />
OECD Task Team on Sustainable Financing<br />
to Ensure Affordable Access to Water<br />
Supply and Sanitation. COM/ENV/EPOC/<br />
DCD/DAC(2008)4. Paris: OECD Environment<br />
Directorate and OECD Development<br />
Co-operation Directorate.<br />
Water in a changing world 67
PART<br />
1<br />
Chapter 5<br />
Climate change<br />
and possible<br />
futures<br />
Authors: Richard Connor, Gilberto Gallopín, Molly Hellmuth and Walter Rast<br />
Contributors: Joeseph Alcamo, BertJan Heij and World Water<br />
Assessment Programme Expert Group on Scenarios<br />
Coordinator: Tim Kasten (UNEP)<br />
Facilitator: Richard Connor<br />
Key messages<br />
There is evidence that the global climate is changing. The main<br />
impacts of climate change on humans and the environment<br />
occur through water.<br />
Climate change is a fundamental driver of changes in water resources<br />
and an additional stressor through its effects on other external<br />
drivers.<br />
Policies and practices for mitigating climate change or adapting<br />
to it can have impacts on water resources, and the way we manage<br />
water can affect the climate.<br />
Chapters 2-4 have described how external<br />
drivers exert pressure on water resources.<br />
These drivers of change are strongly interconnected,<br />
creating complex challenges<br />
and opportunities for water managers<br />
and decision-makers. Apart from extreme<br />
events (such as droughts and floods),<br />
climate change is seldom the main stressor<br />
on sustainable development, although the<br />
direct and indirect impacts of increasing<br />
climate variability can impede and even<br />
reverse development gains (see figure 5.1<br />
for a depiction of climate change processes,<br />
characteristics and major threats).<br />
Climate change may not fundamentally<br />
alter most of the world’s water challenges,<br />
but as an additional stressor it makes<br />
achieving solutions more pressing.<br />
All of the potential impacts of climaterelated<br />
disasters, including economic<br />
losses, health problems and environmental<br />
disruptions, will also affect – and be affected<br />
by – water.<br />
Climate change differs from the other<br />
drivers. It is the only supply-side driver,<br />
ultimately determining how much water<br />
we have; the other drivers are demand-side<br />
drivers, influencing how much water we<br />
need. Climate change can directly affect<br />
the hydrologic cycle and, through it, the<br />
quantity and quality of water resources<br />
(see chapter 11). It can lower minimum<br />
flows in rivers, affecting water availability<br />
and quality for its flora and fauna and for<br />
drinking water intake, energy production<br />
(hydropower), thermal plant cooling<br />
and navigation. Anthropogenic climate<br />
change can also directly affect demand for<br />
water, when demand for crops increases in<br />
certain seasons, for instance (see chapter 7<br />
for the implications of climate change on<br />
uncertainty in agriculture). The other drivers,<br />
by contrast, exert pressure on various<br />
water use sectors that, in turn, affect water<br />
resources.<br />
Managing water has always been about<br />
managing naturally occurring variability.<br />
Climate change threatens to make this<br />
variability greater, shifting and intensifying<br />
the extremes, and introduces greater<br />
uncertainty in the quantity and quality<br />
of supply over the long term (see part 3).<br />
More subtly, climate change may alter the<br />
timing, magnitude and duration of precipitation<br />
events, which could pose problems<br />
68 World Water Development Report 3
Climate change and possible futures<br />
PART<br />
1<br />
Figure 5.1<br />
Climate change: processes, characteristics and threats<br />
Main climate characteristics<br />
Ice cap<br />
melting<br />
Changes in<br />
precipitation<br />
Clouds<br />
Salinity<br />
Water<br />
temperature<br />
Ocean<br />
circulation<br />
upheaval<br />
Human activities<br />
Urbanization<br />
Deforestation<br />
Increase in<br />
impermeable<br />
surface<br />
Transport<br />
Land use<br />
changes<br />
Greenhouse<br />
gas emissions<br />
Climate change processes<br />
Carbon<br />
cycle<br />
disturbances<br />
Carbon<br />
dioxide<br />
Nitrous<br />
oxide<br />
Methane<br />
(enhanced)<br />
Greenhouse<br />
effect<br />
A spanner in<br />
the climate wheel<br />
Average<br />
temperature<br />
rise<br />
“global<br />
warming”<br />
Sea level<br />
rise<br />
Diseases<br />
spread<br />
Abrupt<br />
climate<br />
change<br />
Disasters<br />
Cyclones<br />
Floods<br />
Heat<br />
waves<br />
Droughts<br />
Gulf Stream<br />
modification<br />
Europe<br />
cooling<br />
Loss of<br />
traditional<br />
lifestyles<br />
Biodiversity<br />
losses<br />
Fossil fuel<br />
burning<br />
Heating<br />
Agriculture<br />
Industry<br />
Casualties<br />
Famines<br />
Economic<br />
losses<br />
Major threats<br />
Source: Based on UNFCCC 2007a.<br />
for the sustainability of water supplies and<br />
the continuity of treatment.<br />
interlinking pressures into account in<br />
identifying scenarios, or ‘possible futures’.<br />
The decisions and policies put in place<br />
today for mitigation (such as reducing<br />
greenhouse gas emissions, applying clean<br />
technologies and protecting forests) and<br />
adaptation (such as expansion of rainwater<br />
storage and water conservation practices)<br />
can have profound consequences<br />
for water supply and demand both today<br />
and over the long term. 1 Climate change<br />
also adds to the uncertainty surrounding<br />
all the other drivers. Thus, examining<br />
climate change forces considerations of the<br />
interconnectedness of all the drivers. This<br />
chapter focuses on the pressures that climate<br />
change can exert on the other drivers<br />
and outlines a process for taking these<br />
The influence of climate change<br />
on the other drivers of change<br />
The relationships between climate change<br />
and the other drivers are complex and<br />
interwoven. This section summarizes the<br />
influence of climate change on the other<br />
five major drivers: demographic processes,<br />
economic growth, social change, technological<br />
innovation and policies, laws and<br />
finance.<br />
Demographic processes<br />
The impacts of anthropogenic climate<br />
change, including increased water scarcity<br />
and flooding and accelerated glacial<br />
Water in a changing world 69
PART<br />
1<br />
Chapter 5<br />
Weather-related<br />
disasters such<br />
as floods and<br />
droughts are<br />
undermining<br />
economic<br />
development<br />
in many of the<br />
world’s least<br />
developed<br />
countries, causing<br />
human suffering<br />
and disrupting<br />
economic activities<br />
Ethiopia<br />
Rainfall variability (percent deviation from the mean)<br />
60<br />
40<br />
20<br />
Figure 5.2<br />
0<br />
melting and sea level rise, have the<br />
potential to accelerate human migration.<br />
Drought, desertification and other forms<br />
of water scarcity are already estimated to<br />
affect as many as one-third of the world’s<br />
people and are predicted to worsen.<br />
The recent Intergovernmental Panel on<br />
Climate Change (IPCC) report notes that<br />
millions of people in densely populated<br />
low-lying coastal areas risk increasing<br />
exposure to flooding by storm surges<br />
over the 21st century. 2 The IPCC expects<br />
sea level rise to exacerbate floods, storm<br />
surges, erosion and other coastal hazards.<br />
Global warming can expand the endemic<br />
zones of water-related infectious diseases<br />
like dengue, malaria and schistosomiasis,<br />
making it increasingly difficult for people<br />
to remain in affected areas. Recurring<br />
floods or storm surges, if not managed<br />
effectively, could drive large numbers of<br />
people permanently from their homes.<br />
Current IPCC projections of rising temperatures<br />
and sea levels and increased<br />
intensity of droughts and storms suggest<br />
GDP growth tracks rainfall variability in<br />
Ethiopia (1983-2000) and Tanzania (1989-99)<br />
GDP growth (percent)<br />
8<br />
6<br />
4<br />
that substantial population displacements<br />
will take place within the next 30-50<br />
years, particularly in coastal zones. All of<br />
these climate change refugees will require<br />
shelter, water and sanitation services.<br />
Economic growth<br />
Climate change and its accompanying risks<br />
have direct and indirect effects on development<br />
and economic growth. Sea level rise,<br />
climate variability and weather extremes<br />
such as heat waves, floods and droughts<br />
are severe, direct threats to human life and<br />
property (see chapter 12). Tackling them<br />
requires mobilizing resources that may<br />
have to be reallocated from other investments.<br />
Their damage can substantially<br />
harm a country’s gross domestic product<br />
(GDP). Economic performance is especially<br />
affected in developing countries because of<br />
their high and direct dependence on natural<br />
resources, notably rain-fed agriculture<br />
(see chapter 7), and their inadequate access<br />
to economic and technological resources.<br />
Adverse climate conditions such as increased<br />
floods and droughts can also result<br />
in the underperformance of investments.<br />
Climate uncertainty and unpredictability<br />
can be powerful barriers to investments,<br />
and ultimately to economic growth, even<br />
in years when climate conditions are<br />
favourable. The changing climate also<br />
complicates infrastructure design and<br />
long-term investment planning. And internal<br />
and cross-border migration, driven by<br />
growing pressure on natural resources, can<br />
create tension among population groups<br />
and between countries. 3<br />
–20<br />
–40<br />
–60<br />
1983 1986 1988 1990 1992<br />
Tanzania<br />
Rainfall variability (percent deviation from the mean)<br />
20<br />
10<br />
1994<br />
2<br />
0<br />
1996 1998 2000<br />
GDP growth (percent)<br />
30<br />
20<br />
10<br />
There is clear evidence of a relationship<br />
between climate variability and economic<br />
performance in countries in which agriculture<br />
is a large share of GDP, as in Ethiopia<br />
and Tanzania (figure 5.2). Evidence also<br />
suggests a strong relationship between<br />
economic development and vulnerability<br />
to disaster. Across developing countries<br />
losses associated with disasters are so large<br />
as to undermine development and poverty<br />
reduction goals. And yet climate risks are<br />
seldom adequately considered in infrastructure<br />
designs, agriculture investments<br />
and water management plans.<br />
0<br />
–10<br />
–20<br />
1989 1990 1991 1992 1993 1994 1995 1996<br />
Source: Based on van Aalst, Hellmuth, and Ponzi 2007.<br />
1997<br />
1998<br />
1999<br />
0<br />
–10<br />
–20<br />
–30<br />
Weather-related disasters such as floods<br />
and droughts are undermining economic<br />
development in many of the world’s least<br />
developed countries, causing human<br />
suffering (see table 12.1 in chapter 12)<br />
and disrupting economic activities (table<br />
5.1). And substantial financial and other<br />
development resources are being diverted<br />
each year to post-disaster relief, emergency<br />
70 World Water Development Report 3
climate change and possible futures<br />
PART<br />
1<br />
assistance, reconstruction and rehabilitation.<br />
Poorly managed climate risks also<br />
exact an indirect toll by discouraging<br />
private investment. With climate change<br />
and inadequate climate risk management,<br />
investors lack the reliable infrastructure,<br />
predictable human resources and stable<br />
markets needed to promote investment.<br />
An estimated 40% of development investments<br />
are currently at risk, according to<br />
analyses by the Organisation for Economic<br />
Co-operation and Development (OECD). 4<br />
These analyses indicate that while many<br />
development efforts contribute to reducing<br />
vulnerability to climate variability and<br />
change, climate risks are seldom explicitly<br />
factored into development projects and<br />
programmes. Similar issues affect sector<br />
and national development strategies.<br />
The potential impacts of climate change<br />
on the global economy received international<br />
attention with the release of The<br />
Stern Review in 2006. 5 It concluded that by<br />
2050 extreme weather could reduce global<br />
GDP by 1% and that, unabated, climate<br />
change could cost the world at least 5% in<br />
GDP each year. If even more dramatic predictions<br />
come to pass, the cost could rise<br />
to more than 20% of GDP. Such declines<br />
could in turn lead to an overall drop in official<br />
development assistance, exacerbating<br />
the struggle of poor people and countries<br />
to adapt and develop their water resources.<br />
Some other estimates of the costs of adapting<br />
to climate change are in box 5.1.<br />
Social change<br />
Unlike the more obvious effects of climate<br />
change on demographic processes or the<br />
global economy, the additional pressures<br />
that climate change is likely to exert on<br />
social change are often more subtle. Managing<br />
climate-related risk is a key enabler<br />
of development. Identifying and reducing<br />
the risks associated with climate-related<br />
hazards – including droughts, floods,<br />
cyclones, rising sea levels and extreme<br />
temperatures – can help to protect people,<br />
livelihoods and assets, thereby promoting<br />
the achievement of economic development<br />
goals.<br />
Climate change and greater climate variability<br />
will increasingly affect the poorest<br />
and most marginalized groups, making<br />
them even more vulnerable to the impacts<br />
of climate change. Climate uncertainty –<br />
the inability to anticipate climate extremes<br />
– hurts investment and innovation and<br />
limits the success of other development<br />
interventions. In inhabited hazard-prone<br />
areas disasters and losses are inevitable<br />
Table 5.1<br />
Impact area<br />
Box 5.1<br />
Economic impacts of flood and drought in Kenya,<br />
1997-2000<br />
The cost of adapting to climate change<br />
Estimates of the costs of climate change<br />
impacts vary because they depend<br />
on future greenhouse gas emissions,<br />
mitigation measures and assumptions<br />
about anthropogenic climate change itself<br />
and about how effectively countries<br />
will adapt to it. The following are some<br />
estimates of the costs of adaptation for<br />
developing countries:<br />
• World Bank estimates of the<br />
additional costs to adapt or<br />
climate-proof new investments<br />
range from $9 to $41 billion a<br />
year. And a recent update by the<br />
United Nations Development<br />
Programme put the mid-range of<br />
the costs of adaptation at about<br />
$37 billion a year in 2015.<br />
• The United Nations Framework<br />
Convention on Climate Change<br />
estimates additional investments<br />
for adaptation to climate change<br />
unless societal exposure and vulnerability<br />
are reduced.<br />
The most likely societal effects of climate<br />
change will come from changes in lifestyle<br />
and consumption patterns. Reflecting<br />
human needs and wants, changes in lifestyle<br />
and consumption patterns are among<br />
the most important drivers of change (see<br />
chapter 2). In emerging market economies<br />
rising standards of living are boosting<br />
demand for high-level goods and services,<br />
many with a large ecological and water<br />
Costs<br />
($ millions)<br />
Share of total<br />
(percent)<br />
1997-98 El Niño flood impact<br />
Transport infrastructure 777 89<br />
Health sector 56 6<br />
Water supply infrastructure 45 5<br />
Total flood impact 878<br />
Share of GDP 1997-98 (percent) 11<br />
1998-2000 La Niña drought impacts<br />
Industrial production 1,400 58<br />
Hydropower 640 26<br />
Agricultural production 240 10<br />
Livestock 137 6<br />
Total drought impact 2,417<br />
Share of GDP 1998-2000 (percent) 16<br />
Source: World Bank 2004.<br />
at $28-$67 billion and as high as<br />
$100 billion a year several decades<br />
from now. Estimates of the<br />
additional investments needed<br />
in water supply infrastructure in<br />
2030 are $11 billion, 85% of it in<br />
developing countries.<br />
• Oxfam estimates the current costs<br />
of adaptation to climate change<br />
for all developing countries at<br />
more than $50 billion a year.<br />
While there is considerable debate<br />
about these estimates, they provide<br />
useful order-of-magnitude numbers<br />
for assessing resources available for adaptation.<br />
Current Global Environment<br />
Facility funds (about $160 million) are<br />
several orders of magnitude too little<br />
to meet these projected needs.<br />
Source: World Bank 2006; UNDP 2007;<br />
UNFCCC 2007b; Oxfam 2007.<br />
Water in a changing world 71
PART<br />
1<br />
Chapter 5<br />
Some interventions<br />
in the water<br />
system might be<br />
counterproductive<br />
when evaluated in<br />
terms of mitigation<br />
of climate change<br />
Box 5.2<br />
footprint. In the world’s richest countries,<br />
meanwhile, growing awareness of climate<br />
change is slowly inducing people to alter<br />
their lifestyles and live in a more sustainable<br />
manner. Large cars are being replaced<br />
by smaller, more energy-efficient vehicles<br />
in some places, and governments are offering<br />
subsidies for purchasing energy‐efficient<br />
appliances. But these changes alone<br />
are unlikely to substantially counteract the<br />
pressure from rising living standards in<br />
emerging market economies.<br />
Technological innovation<br />
Climate change will be a major driver of<br />
technological innovation and transfer. 6<br />
Massive amounts of new investments will<br />
be required over the next 30 years to meet<br />
the growing energy needs of developing<br />
countries. Investments in adaptation<br />
will be necessary to safeguard vulnerable<br />
groups and infrastructure.<br />
The relationship between climate change<br />
mitigation measures and water can be reciprocal.<br />
Mitigation measures can adversely<br />
influence the quantity and condition<br />
of water resources and their management,<br />
while some water management policies<br />
and measures can increase greenhouse gas<br />
emissions and affect other sectoral mitigation<br />
measures. Thus, interventions in the<br />
water system might be counterproductive<br />
when evaluated in terms of mitigation of<br />
climate change.<br />
For example, many developed countries<br />
are shifting energy production from thermal<br />
energy plants that burn fossil fuels<br />
and emit large quantities of greenhouse<br />
gases to ‘clean’ energy sources. Thus,<br />
significant increases in the development<br />
of hydroelectric installations, a source of<br />
clean electricity, could be anticipated as<br />
Micro-hydro plants in Nepal are expected to<br />
provide electricity access to 142,000 households<br />
and to reduce greenhouse gas emissions<br />
Nepal has vast hydro resources.<br />
And while only about 27% of rural<br />
households are connected to a power<br />
grid (the urban share is 90%), off-grid<br />
power generated by micro-hydro<br />
plants provides many rural households<br />
with electricity for lighting, milling<br />
and other needs. The generating<br />
capacity of these plants varies from 5<br />
to 500 kilowatts.<br />
Through a project supported by the<br />
World Bank, the United Nations Development<br />
Programme and the governments<br />
of Denmark and Norway,<br />
micro-hydro plants are being installed<br />
for local communities by prequalified<br />
private companies that receive<br />
subsidies and technical assistance.<br />
Installation of micro-hydro plants will<br />
be phased in until 2011. The microhydro<br />
power plants, which qualify for<br />
emission reduction credits under the<br />
Clean Development Mechanism, will<br />
reduce greenhouse gas emissions by<br />
replacing diesel fuel used for lighting<br />
and milling.<br />
Source: http://go.worldbank.org/<br />
9G19LTLEH0.<br />
the global community unites to combat<br />
climate change, although in many developed<br />
countries most of the ‘best’ sites for<br />
hydropower installations have already<br />
been developed (see map 7.6 in chapter<br />
7). Some of the climate- related benefits of<br />
hydropower are illustrated in box 5.2.<br />
However, there is evidence that hydroelectricity<br />
generation can also generate<br />
considerable amounts of greenhouse gases,<br />
which are released from sediment and<br />
decaying organic matter at the bottom<br />
waters of reservoirs. 7 Artificially flooded<br />
reservoirs of sufficient depth can experience<br />
anaerobic conditions as organic<br />
matter decomposes and, when the bottom<br />
waters are disturbed, emits large quantities<br />
of methane and other greenhouse<br />
gases. The problem arises most frequently<br />
in warmer climates, where reservoirs are<br />
prone to stratification and where there is<br />
year-round algal growth.<br />
Biofuels, an alternative to fossil fuels in<br />
transport, are another means of reducing<br />
greenhouse gas emissions. Higher oil<br />
prices in recent years have made bioenergy<br />
more competitive. World Energy Outlook<br />
2006 projected an average rate of growth<br />
of bioenergy production of 7% a year. 8 By<br />
2030 biofuels are expected to meet 4% of<br />
road-transport fuel demand worldwide,<br />
up from 1% today. But careful attention<br />
also must be given to minimizing negative<br />
externalities associated with producing<br />
bioenergy, such as upward pressure<br />
on food prices and the impact on food<br />
security. 9<br />
Developing countries will need to rely<br />
on technology development and transfer<br />
in mitigating and adapting to climate<br />
change. That will require removing obstacles<br />
to technology transfer and providing<br />
incentives for accelerating and scaling<br />
up transfers, along with cooperating on<br />
research and development (see chapter 3).<br />
According to the United Nations Framework<br />
Convention on Climate Change<br />
(UNFCCC), most technologies for adapting<br />
to climate change are already available<br />
in developing countries, and examples of<br />
successful implementation and operation<br />
abound, from coastal revetment to vaccination<br />
programmes. 10<br />
Policies, laws and finance<br />
Climate change can stress political governance<br />
structures by increasing management<br />
and budget requirements for public services<br />
to mitigate climate change or to cope<br />
with its impacts, including public health<br />
care (box 5.3), disaster risk reduction and<br />
72 World Water Development Report 3
climate change and possible futures<br />
PART<br />
1<br />
public security. As stress mounts, the<br />
resilience of already unstable social and<br />
political structures lessens, especially in<br />
countries with limited resources. At the<br />
international level pressures build on<br />
governance systems to combat climate<br />
change, mainly through the UNFCCC and<br />
growing public awareness.<br />
Most efforts have focused on mitigation<br />
strategies, which are especially important<br />
for policies in energy (a major water use<br />
sector), international trade and transportation.<br />
In many countries climate change<br />
issues fall under the authority of the ministry<br />
for environment or natural resources.<br />
But as regional carbon trading markets<br />
emerge and as economies become ever<br />
more carbon-constrained, the ministries of<br />
finance and planning will need to become<br />
more directly involved.<br />
Most governance structures today are too<br />
weak to tackle current water problems,<br />
much less prepare for emerging problems,<br />
including climate change. And there is<br />
still very little evidence about which types<br />
of governance responses work in which<br />
contexts and what their impacts are on<br />
water equity, efficiency and sustainability.<br />
Water reforms in most countries have not<br />
considered the implications of climate<br />
change or other major drivers of water use<br />
and the need for long-term planning.<br />
Effective funding mechanisms are lacking<br />
for developing countries to support adaptation<br />
to climate change, which affects<br />
development at many levels. In Africa the<br />
impacts of climate change are expected<br />
to range from increased energy shortages,<br />
reduced agricultural production,<br />
worsening food security and malnutrition<br />
to the increasing spread of disease,<br />
more humanitarian emergencies, growing<br />
migratory pressures and increased risks<br />
of conflict over scarce land and water<br />
resources. Africa is least able to meet the<br />
costs of adapting to these impacts, yet<br />
it receives the least from current carbon<br />
finance mechanisms. Its governance<br />
structures and capacity are not ready for<br />
the inter sectoral action that adaptation<br />
requires. 11<br />
Supporting developing country efforts to<br />
design adaptation strategies also requires<br />
better analysis. Information is needed at<br />
the local level, incorporating countryspecific<br />
characteristics and sociocultural<br />
and economic conditions. At the macrolevel<br />
information on both rich and poor<br />
countries is required to support international<br />
negotiations and to identify<br />
Box 5.3<br />
Health and climate change<br />
Climate change can affect health<br />
through multiple pathways, such as<br />
greater frequency and intensity of<br />
heat waves, fewer cold-related illnesses,<br />
increased floods and droughts,<br />
changes in the distribution of vectorborne<br />
diseases and effects on the risk<br />
of disasters and malnutrition. The<br />
overall balance of impacts on health<br />
is likely to be negative, and populations<br />
in low-income countries are<br />
likely to be particularly vulnerable to<br />
the adverse effects. However, many<br />
the overall costs of adapting to climate<br />
change.<br />
Challenges for the impact of climate<br />
change on water resources and<br />
management<br />
One of the most pressing challenges of climate<br />
change is addressing the vulnerability<br />
of human populations, particularly the<br />
poor, to the impacts of extreme hydrologic<br />
events, such as floods, storm surges and<br />
droughts. Over the longer term the effects<br />
of incremental climate change are likely<br />
to influence decisions about food security,<br />
energy security and land use, all with vital<br />
implications for water resources and management<br />
and environmental sustainability<br />
(see chapter 7). In this context climate<br />
change can intensify existing pressures,<br />
thereby increasing risk, vulnerability and<br />
uncertainty.<br />
For water managers anthropogenic climate<br />
change poses a new set of challenges –<br />
because they can no longer plan, design<br />
and operate hydrologic systems based on<br />
historical statistics. Climate change means<br />
learning to manage under increased<br />
uncertainty. Climate change is a new risk<br />
to be taken into account in policy development,<br />
planning and operations at the<br />
global, basin, national, local and company<br />
levels. It calls for increasing use of ‘climate<br />
knowledge’ to better understand climate<br />
variability at different time scales, to assess<br />
the socioeconomic impacts observed in<br />
the past, to monitor current conditions of<br />
relevant environmental factors (climate,<br />
vegetation, water, diseases) and to provide<br />
the best possible information on future<br />
climate, from seasons to decades, for specific<br />
decisions and activities. Addressing<br />
the threats and opportunities of climate<br />
change and its impacts on water resources<br />
and supplies is vital for even the most<br />
remote rural areas as part of a broader<br />
developmental agenda.<br />
of the projected impacts of climate<br />
change on health are avoidable.<br />
Climate change is expected to exacerbate<br />
some health problems rather<br />
than cause new diseases to emerge.<br />
Strengthening public health prevention<br />
strategies, including improving<br />
water supply and sanitation services<br />
and disease surveillance, would be an<br />
essential part of any effective response.<br />
Source: Haines et al. 2006; Campbell-<br />
Lendrum, Corvelan, and Neira 2007.<br />
Water in a changing world 73
PART<br />
1<br />
Chapter 5<br />
the water<br />
drivers interact<br />
and can have<br />
even more of an<br />
impact on future<br />
water resources<br />
collectively<br />
than they can<br />
individually<br />
Although water is an important component<br />
in most energy-generating processes,<br />
its role in climate change mitigation policy<br />
is minor. Where water and climate change<br />
are most strongly linked is in adaptation<br />
policy, which functions in highly dynamic<br />
hydrologic, social, economic and demographic<br />
contexts. For water adaptation<br />
measures to be effective, however, there<br />
must be complementary climate change<br />
mitigation measures outside the water<br />
sector.<br />
Because climate variability and change affect<br />
all the major water drivers, adaptation<br />
measures are needed in all sectors. Over<br />
the long term adaptation means applying<br />
a long-term, climate-focused approach<br />
to existing policies and programmes. But<br />
because the poor are the most vulnerable<br />
and the least able to cope with change, it<br />
is particularly important to strengthen the<br />
link between adaptation to climate change<br />
and economic development – a difficult<br />
challenge. Over the shorter term the best<br />
approach might be to manage climate<br />
variability by prioritizing risk-reduction<br />
strategies and reinforcing the capacity of<br />
hydrometeorological services to provide<br />
information for development needs.<br />
Each country will face its own challenges<br />
and must determine how to respond in<br />
the short, medium and long run. With<br />
multiple challenges but limited financial<br />
and natural resources and capacities, countries<br />
will need to make hard choices about<br />
water use and allocation.<br />
There tends to be a push and pull effect<br />
between identifying adaptation needs<br />
based on a climate change rationale and<br />
anchoring response options in baseline<br />
development activities. This separation<br />
between climate adaptation and development<br />
is artificial. Governments need to<br />
design climate-smart development policies<br />
and programmes, in part by strengthening<br />
sectoral capacities.<br />
Identifying possible futures: the<br />
need for scenarios<br />
Each of the water drivers is dynamic and<br />
continues to evolve, as do the direct and<br />
indirect pressures they exert on water<br />
resources. Thus, it is difficult to draw a<br />
comprehensive picture of the future by<br />
examining each driver independently. The<br />
drivers interact and can have even more of<br />
an impact on future water resources collectively<br />
than they can individually. Future<br />
scenarios that consider these interactions<br />
offer a more holistic picture.<br />
Scenarios, which are sets of equally plausible<br />
futures, differ from forecasts, which<br />
are individual interpretations of a most<br />
probable future based on extrapolation of<br />
the best available information. Scenarios<br />
are not forecasts. Because the real world<br />
is so complex, forecasts are often wrong –<br />
especially those involving a time horizon<br />
of 20 years or more. Scenarios provide a<br />
means of looking beyond the water sector<br />
in search for an adequate causal understanding<br />
of different water issues.<br />
Scenarios can contribute to several goals in<br />
the pursuit of sustainable water resources:<br />
• The need for a long-term view. A longterm<br />
view of water for sustainable<br />
development requires taking into<br />
account the slow unfolding of some<br />
hydrologic, environmental and social<br />
processes and allowing time for waterworks<br />
investments and water mitigation<br />
schemes to yield results.<br />
• The need to make decisions in a context<br />
of high uncertainty. Decision-makers in<br />
the water sector must often address<br />
water management issues against a<br />
background of rapidly changing environmental<br />
conditions and increasing<br />
uncertainty. The uncertainty results<br />
from both a limited understanding of<br />
human and ecological processes and<br />
the intrinsic indeterminism of complex<br />
dynamic systems. Further, water<br />
resources futures depend on future<br />
human choices, which are unknown.<br />
• The need to include non-quantifiable<br />
factors. The world’s water system<br />
includes and is influenced by many<br />
factors that are difficult to quantify<br />
(such as cultural and political variables<br />
and processes), as well as factors<br />
that can be quantified and modelled<br />
mathematically (such as hydrologic<br />
and climatological dynamics and economic<br />
factors). Qualitative scenario<br />
analyses can provide insight into<br />
these factors that simulation models<br />
cannot.<br />
• The need for integration and breadth.<br />
Water resources must be viewed holistically,<br />
considering both their natural<br />
state and the need to balance competing<br />
demands – domestic, agricultural,<br />
industrial and environmental – to<br />
ensure sustainability. Decisions on<br />
land use can affect the availability and<br />
condition of water resources, while<br />
decisions about water resources can<br />
also affect the environment and land<br />
74 World Water Development Report 3
climate change and possible futures<br />
PART<br />
1<br />
use. Decisions about economic and<br />
social futures can affect hydrology<br />
and ecosystems. And decisions at the<br />
international, national and local levels<br />
are connected. Sustainable management<br />
of water resources requires<br />
systemic, integrated decision-making<br />
that recognizes the interdependence<br />
of decisions; scenarios are particularly<br />
helpful for this purpose.<br />
• The need for perspective. Qualitative<br />
scenarios provide guidance, perspective<br />
and context for computer models<br />
and sectoral studies, while models<br />
and studies provide consistency and<br />
feasibility checks for some elements of<br />
water scenarios, as well as numerical<br />
estimates of the modelled variables.<br />
Further, global scenarios provide a<br />
context for scenarios on a smaller<br />
geographic scale (local, watershed,<br />
national or regional). Many important<br />
changes in a river basin are determined<br />
by factors from outside the<br />
study area.<br />
• The need to organize understanding<br />
for decision-making. Decision-makers<br />
may have difficulty identifying the<br />
elements from different studies that<br />
are most relevant for their decisions.<br />
Scenarios are developed with decisionmaking<br />
in mind. They are constructed<br />
to focus attention on causal processes<br />
and decision points, the unfolding of<br />
alternatives and the branching points<br />
at which human actions can significantly<br />
affect the future.<br />
• The need for an arena for conversation<br />
among water stakeholders. Scenarios<br />
provide common frameworks for<br />
mapping and highlighting critical<br />
concerns of diverse stakeholders and<br />
identifying alternatives – setting the<br />
stage for discussions, debates and<br />
negotiation.<br />
Over the past decade several global scenarios<br />
have been developed for the water sector.<br />
One of the most comprehensive was<br />
the scenario work for the World Water Vision<br />
in 2000. 12 The Vision generated three<br />
scenarios: a technology, economics and<br />
private sector scenario in which private<br />
sector initiatives lead research and development<br />
and globalization drives economic<br />
growth, but the poorest countries are left<br />
behind; a values and lifestyles scenario in<br />
which sustainable development is a global<br />
priority, with emphasis on research and<br />
development in the poorest countries; and<br />
a business-as-usual scenario.<br />
In 2006 the World Business Council for<br />
Sustainable Development (WBCSD) produced<br />
three scenarios focusing on the role<br />
of business and water. 13 Its three storylines<br />
focus on efficiency (more value per drop),<br />
security (meeting the basic needs of all)<br />
and interconnectivity (a ‘whole system’<br />
approach; table 5.2). In another example<br />
using driver categories similar to those in<br />
this Report, the Global Environment Outlook<br />
(GEO4) report of 2007 generated four different<br />
scenarios: markets first, policy first,<br />
security first and sustainability first. 14<br />
Despite these recent endeavours, experience<br />
indicates that new global water<br />
scenarios are needed. Existing global water<br />
scenarios do not fully incorporate each of<br />
the drivers described in this chapter. The<br />
scenarios are either outdated (those of the<br />
World Water Vision) or partial, incomplete<br />
or sectoral (WBCSD, GEO4). In addition,<br />
the evolution of the drivers and the logic<br />
behind their storylines need to be examined<br />
and possibly redefined in view of<br />
developments both inside and outside the<br />
water sector since 2000. Finally, important<br />
new policy initiatives have emerged since<br />
the last world water scenarios, such as the<br />
adoption of the Millennium Development<br />
Goals.<br />
Challenges for summarizing the<br />
pressures of external drivers on<br />
water resources<br />
Multiple external drivers exert pressures<br />
on water resources through changes in<br />
water demands and uses. Some of these<br />
pressures are summarized in the table at<br />
Table 5.2<br />
new global water<br />
scenarios are<br />
needed. Existing<br />
global water<br />
scenarios do not<br />
fully incorporate<br />
each of the<br />
drivers described<br />
in this chapter<br />
The three water scenarios of the World Business<br />
Council for Sustainable Development, to 2025<br />
Scenario ‘Hydro’ ‘Rivers’ ‘Ocean’<br />
Water challenge<br />
Efficiency (more<br />
drops for less and<br />
more value per<br />
drop)<br />
Security<br />
(quantity and<br />
quality for all)<br />
Business challenge Innovation Social license to<br />
operate<br />
The five key story • Hard times in • The security<br />
themes<br />
huge towns deficit<br />
• Huge<br />
• Two sides of<br />
opportunities the river<br />
• High-stakes • The trust<br />
innovation deficit<br />
• Hydro economy • Access and<br />
• Beyond legacy equity<br />
systems • Political<br />
reallocation –<br />
local solutions<br />
Source: WBCSD 2006.<br />
Interconnectivity<br />
(taking the whole<br />
system into<br />
account)<br />
Business role in<br />
water governance<br />
• Unintended<br />
consequences<br />
• Global Fair Water<br />
Movement<br />
• The tipping<br />
point<br />
• Accountability<br />
tools<br />
• Networked<br />
global water<br />
governance<br />
Water in a changing world 75
PART<br />
1<br />
Chapter 5<br />
the beginning of part 2. The challenge is<br />
to get decision-makers inside and outside<br />
the water sector to adopt appropriate measures<br />
to reduce the negative pressures on<br />
water and increase the positive pressures.<br />
Making this challenge more difficult are<br />
the links between drivers (as illustrated<br />
by the pressures imposed by rising living<br />
standards), which involve demographic,<br />
social and economic factors but are also<br />
influenced by technology and governance.<br />
Generating a picture of this complex<br />
future would be greatly assisted<br />
by the development of a set of future<br />
scenarios.<br />
Notes<br />
1.<br />
2.<br />
IPCC 2008.<br />
Nicholls et al. 2007.<br />
3. van Aalst, Hellmuth, and Ponzi 2007.<br />
4.<br />
5.<br />
6.<br />
7.<br />
8.<br />
9.<br />
OECD 2005.<br />
Stern 2006.<br />
IPCC 2008.<br />
Giles 2006.<br />
IEA 2006<br />
FAO 2008.<br />
10. UNFCCC 2006.<br />
11. van Aalst, Hellmuth, and Ponzi 2007.<br />
12. Cosgrove and Rijsberman 2000.<br />
13. WBCSD 2006.<br />
14. UNEP 2007.<br />
References<br />
Campbell-Lendrum, D., C. Corvalán, and<br />
M. Neira. 2007. Global Climate Change:<br />
Implications for International Public<br />
Health Policy. Bulletin of the World Health<br />
Organization 85: 235-37.<br />
Cosgrove, W., and F. Rijsberman. 2000.<br />
World Water Vision: Making Water Everybody’s<br />
Business. London: Earthscan.<br />
FAO (Food and Agriculture Organization<br />
of the United Nations). 2008. The State<br />
of Food and Agriculture 2008: Biofuels:<br />
Prospects, Risks, and Opportunities. Rome:<br />
Food and Agriculture Organization.<br />
Giles, J. 2006. Methane Quashes Green<br />
Credentials of Hydropower. Nature 444<br />
(7119): 524-25.<br />
Haines, A., R. S. Kovats, D. Campbell-<br />
Lendrum, and C. Corvalan. 2006.<br />
Climate Change and Human Health:<br />
Impacts, Vulnerability and Public Health.<br />
Public Health 120 (7): 585-96.<br />
IEA (International Energy Agency). 2006.<br />
World Energy Outlook 2006. Paris: Organisation<br />
for Economic Co-operation and<br />
Development, and International Energy<br />
Agency.<br />
IPCC (Intergovernmental Panel on Climate<br />
Change). 2008. Technical Paper<br />
on Climate Change and Water. IPCC-<br />
XXVIII/Doc.13, Intergovernmental Panel<br />
on Climate Change, Geneva. www.ipcc.<br />
ch/meetings/session28/doc13.pdf.<br />
Nicholls, R. J., P. P. Wong, V. R. Burkett, J.<br />
O. Codignotto, J. E. Hay, R. F. McLean,<br />
S. Ragoonaden, and C. D. Woodroffe.<br />
2007. Coastal Systems and Low-lying<br />
Areas. In Climate Change 2007: Impacts,<br />
Adaptation, and Vulnerability, eds. M.<br />
L. Parry, O. F. Canziani, J. P. Palutikof,<br />
P. J. van der Linden, and C. E. Hanson.<br />
Cambridge, UK: Cambridge University<br />
Press.<br />
OECD (Organisation for Economic Cooperation<br />
and Development). 2005.<br />
Bridge over Troubled Waters: Linking<br />
Climate Change and Development. Paris:<br />
Organisation for Economic Co-operation<br />
and Development.<br />
Oxfam. 2007. Adapting to Climate Change<br />
– What’s Needed in Poor Countries, and<br />
Who Should Pay. Oxfam Briefing Paper<br />
104, Oxfam International, Oxford, UK.<br />
Stern, N. 2006. The Stern Review: The<br />
Economics of Climate Change. London:<br />
Cabinet Office, HM Treasury.<br />
UNDP (United Nations Development<br />
Programme). 2007. Human Development<br />
Report 2007/2008: Fighting Climate<br />
Change. Human Solidarity in a Divided<br />
World. New York: Palgrave Macmillan.<br />
UNEP (United Nations Environment<br />
Programme). 2007. Global Environment<br />
Outlook 4 (GEO4): Environment for<br />
Development. Nairobi: United Nations<br />
Environment Programme.<br />
UNFCCC (United Nations Framework<br />
Convention on Climate Change). 2006.<br />
Application of Environmentally Sound<br />
Technologies. Technical Paper FCCC/<br />
TP/2006/2, United Nations Framework<br />
Convention on Climate Change,<br />
New York. http://unfccc.int/resource/<br />
docs/2006/tp/tp02.pdf.<br />
———. 2007a. Climate Change: Impacts, Vulnerabilities<br />
and Adaptation in Developing<br />
Countries. Bonn, Germany: United Nations<br />
Framework Convention on Climate<br />
Change.<br />
———. 2007b. Investment and Financial<br />
Flows to Address Climate Change. Background<br />
paper, United Nations Framework<br />
Convention on Climate Change,<br />
New York.<br />
van Aalst, M., M. Hellmuth, and D.<br />
Ponzi. 2007. Come Rain or Shine: Integrating<br />
Climate Risk Management into<br />
African Development Bank Operations.<br />
African Development Bank Working<br />
Paper 89, African Development Bank,<br />
Tunis.<br />
WBCSD (World Business Council for<br />
Sustainable Development). 2006.<br />
Business in the World of Water: WBCSD<br />
Scenarios to 2025. Washington, DC:<br />
World Business Council for Sustainable<br />
Development.<br />
World Bank. 2004. Towards a Water-Secure<br />
Kenya. Water Resources Sector Memorandum,<br />
Report 28398-KE. World Bank,<br />
Washington, DC.<br />
———. 2006. Clean Energy and Development:<br />
Towards an Investment<br />
Framework. Paper DC2006-0002.<br />
Development Committee, World Bank,<br />
Washington, DC.<br />
76 World Water Development Report 3
Using water<br />
climate change and possible futures<br />
PART<br />
2<br />
Chapter<br />
6 Water’s many benefits<br />
7 Evolution of water use<br />
8 Impacts of water use on water systems and the environment<br />
9 Managing competition for water and the pressure on ecosystems<br />
Chapters 6-9<br />
Coordinator<br />
Jean-Marc Faurès<br />
(FAO)<br />
Facilitator<br />
Domitille Vallée
PART<br />
2<br />
Author: Domitille Vallée<br />
History shows a strong link between<br />
economic development and water resources<br />
development. Abundant examples<br />
can be drawn of how water has<br />
contributed to economic development<br />
and how development has demanded<br />
increased harnessing of water. Such<br />
benefits came at a cost and in some<br />
places led to increasing competition<br />
and conflicts between users and pressure<br />
on the environment.<br />
While demand from all sectors is on<br />
the rise, in most places it is agriculture<br />
that accounts for the bulk of water use.<br />
Steadily rising demand for agricultural<br />
products to satisfy the diverse needs<br />
of a fast growing population (for food,<br />
fibre and now fuel) has been the main<br />
driver behind agricultural water use –<br />
and such demand is expected to continue<br />
to grow. In parallel, changing lifestyles<br />
and consumption patterns and<br />
rapidly growing cities and industries<br />
are claiming increasing amounts of<br />
water and are putting heavy pressure<br />
on local resources. The effects of water<br />
depleting and polluting activities on<br />
human and ecosystem health remain<br />
largely unreported or difficult to measure,<br />
and the need grows stronger for<br />
effective protection of ecosystems and<br />
the goods and services they produce –<br />
on which life and livelihoods depend.<br />
As competition among demands on<br />
water increases, society will need to<br />
respond with improved water management,<br />
more effective policies and transparent<br />
and efficient water allocation<br />
mechanisms. The drivers described in<br />
part 1 create pressures on society that<br />
lead to changes in water use (see table).<br />
The 2003 and 2006 editions of The<br />
United Nations World Water Development<br />
Reports examined many aspects<br />
of water use. Some, such as the use<br />
of groundwater, are covered more<br />
extensively in this edition. Similarly,<br />
the availability of new information is<br />
reflected in the treatment here of water<br />
supply and sanitation.
PART<br />
2<br />
Drivers create pressures that influence water use patterns<br />
Users<br />
Demographic<br />
growth<br />
Economic<br />
growth<br />
Social<br />
change<br />
Technological<br />
innovation<br />
Policies, laws<br />
and finance<br />
Climate<br />
change<br />
Agriculture<br />
Rising demand<br />
for food and<br />
subsequent<br />
pressure on<br />
land and water<br />
resources<br />
Rising demand<br />
for meat, fish<br />
and high-value<br />
agricultural<br />
products<br />
Environmentally<br />
sensitive<br />
behavioural<br />
changes can<br />
lead to more<br />
vegetarian<br />
diets<br />
Greater agricultural<br />
water<br />
productivity<br />
Agriculture and<br />
trade policy<br />
(subsidies,<br />
import/<br />
export quotas,<br />
etc.) dictates<br />
crop yields<br />
and water<br />
requirements<br />
Shifts in crop<br />
patterns,<br />
greater reliance<br />
on irrigation in<br />
places, generally<br />
greater<br />
crop evapotranspiration<br />
Energy<br />
Rising demand<br />
and pressure to<br />
develop more<br />
energy sources<br />
Rising demand<br />
and pressure<br />
to develop<br />
more energy<br />
sources, sometimes<br />
‘dirty’<br />
resources (e.g.,<br />
tar sands)<br />
Awareness can<br />
lower demand<br />
Consumption<br />
lifestyles<br />
can increase<br />
demand<br />
Greater<br />
efficiency (production<br />
and<br />
supply)<br />
Development<br />
of new or<br />
‘dirty’ sources<br />
Energy policy<br />
(and price<br />
speculation)<br />
dictates supply<br />
sources (hydro<br />
and renewables,<br />
fossil,<br />
nuclear)<br />
Change in<br />
production<br />
patterns, with<br />
different water<br />
demands<br />
(quantity<br />
and quality<br />
implications)<br />
Health<br />
Urbanization<br />
and potential<br />
for increased<br />
disease<br />
transmission<br />
Greater access<br />
to medical<br />
services, safe<br />
water and<br />
sanitation<br />
Education<br />
increases<br />
good health<br />
possibilities<br />
Increasing<br />
quality of<br />
health care<br />
Unexpected<br />
negative<br />
impacts (e.g.,<br />
pesticides)<br />
Health care<br />
and education<br />
policy (e.g.,<br />
universal coverage,<br />
subsidies)<br />
Shifting limits<br />
and timing of<br />
vector-borne<br />
diseases<br />
Greater vulnerability<br />
of the<br />
poor (floods,<br />
droughts, disease<br />
outbreaks)<br />
Industry<br />
Increased<br />
demand for<br />
basic goods<br />
and services<br />
Positive feedback<br />
loop<br />
Greater<br />
resources<br />
needs and<br />
environmental<br />
degradation<br />
Rising living<br />
standards<br />
change<br />
demands for<br />
consumer<br />
products<br />
Can increase<br />
or decrease<br />
environmental<br />
impacts (both<br />
in some cases)<br />
Can promote<br />
or impose<br />
standards<br />
Increased<br />
uncertainty<br />
and risk<br />
Can prompt<br />
energy<br />
and water<br />
efficiency<br />
Environment<br />
Increased<br />
competition<br />
for land and<br />
resources<br />
Can increase<br />
natural<br />
resource use<br />
and pollution<br />
Awareness can<br />
lower impact<br />
Consumption<br />
lifestyles<br />
can increase<br />
impact<br />
Can increase<br />
or decrease<br />
impacts –<br />
sometimes<br />
both<br />
Can impose<br />
protection<br />
measures<br />
Threatens<br />
ecological<br />
balances<br />
Leads to shifting<br />
habitats<br />
Poverty<br />
focus<br />
Growth of<br />
informal<br />
human<br />
settlements<br />
Can aid in poverty<br />
reduction<br />
if services and<br />
opportunities<br />
are available<br />
Increased need<br />
for natural<br />
resources to<br />
fuel economic<br />
growth<br />
Increasing<br />
expectations<br />
for poor<br />
communities<br />
Low-cost<br />
technologies<br />
are increasingly<br />
accessible<br />
Can impose<br />
equity rules on<br />
allocation and<br />
pricing policies<br />
May hinder<br />
efficient provision<br />
of needed<br />
services<br />
Will affect the<br />
poor the most<br />
Impacts will<br />
affect developing<br />
countries<br />
(with limited<br />
resources)<br />
more than<br />
developed<br />
countries<br />
Source: Compiled by Richard Connor.
PART<br />
2<br />
Chapter 6<br />
Water’s many benefits<br />
Authors: Gunilla Björklund, Andy Bullock, Molly Hellmuth,<br />
Walter Rast, Domitille Vallée and James Winpenny<br />
Contributors: Moses Abukari, Cecile Brugère, Rudolf Cleveringa,<br />
Richard Connor, Jennifer Hauc, Walter Huppert, Jean Margat,<br />
Audrey Nepveu, Mary Renwick, Guido Santini, Eva Schiffer and World<br />
Water Assessment Programme Expert Group on Storage<br />
Coordinator: Jean-Marc Faurès (FAO)<br />
Facilitator: Domitille Vallée<br />
Key messages<br />
Water has always played a key role in economic development,<br />
and economic development has always been accompanied by<br />
water development.<br />
Investment in water management has been repaid through livelihood<br />
security and reductions in health risks, vulnerability<br />
and ultimately poverty.<br />
Water contributes to poverty alleviation in many ways –<br />
through sanitation services, water supply, affordable food and<br />
enhanced resilience of poor communities faced with disease,<br />
climate shocks and environmental degradation.<br />
Water of the right quality can improve health through better<br />
sanitation and hygiene and, when applied at the right time, can<br />
enhance the productivity of land, labour and other productive<br />
inputs. In addition, healthy freshwater ecosystems provide multiple<br />
goods and services essential to life and livelihoods.<br />
People have traditionally settled near<br />
water sources. An adequate and dependable<br />
source of water is needed to sustain<br />
humanity and to support future growth<br />
and development. Investment in water<br />
management has been repaid through increased<br />
livelihood security and reductions<br />
in health risks, vulnerability and ultimately<br />
poverty. 1 Poverty reduction is closely<br />
linked to enhanced access to water. 2<br />
Where economic growth has been strong<br />
and prosperity has been fairly equitably<br />
distributed, poor individuals and households<br />
have been able to reach the targets<br />
of the Millennium Development Goals.<br />
Conversely, where governments are unable<br />
or unwilling to deliver the basic services,<br />
water emerges among the most pressing<br />
issues (box 6.1).<br />
Experience shows that access to water is<br />
fundamental for economic growth and<br />
livelihoods. In rural and agriculture-based<br />
economies water is often the most important<br />
factor for agricultural production<br />
and other livelihood activities. 3 In urbanbased,<br />
labour-intensive manufacturing<br />
economies water is needed for nearly all<br />
productive activities. 4 Secure access to<br />
water with reliable storage and irrigation<br />
has boosted economic growth in many of<br />
the developed economies of the Americas<br />
and Europe, and through the green revolution<br />
in Asia has enabled the transformation<br />
of agriculture-based economies to industrial<br />
and emerging market economies. 5<br />
Past efforts of development and water<br />
use have often ignored the water needs<br />
of life on Earth and have placed at risk<br />
the resources on which life depends (see<br />
chapter 8). The links connecting water<br />
resources, the environment and economic<br />
sectors are complex. As a result, our understanding<br />
of all the ways that natural processes<br />
influence human well-being remains<br />
incomplete, impeding our ability to ensure<br />
80 World Water Development Report 3
Water’s many benefits<br />
PART<br />
2<br />
sustainable economic and social development.<br />
This chapter explores our current<br />
understanding of the links between water<br />
and growth, poverty reduction, health and<br />
the environment.<br />
Water for economic<br />
development<br />
Water development is essential to growing<br />
economies. Over the centuries the world has<br />
witnessed an unprecedented expansion in<br />
urban water supply, irrigation, dam storage,<br />
drainage, water transport facilities and other<br />
water schemes as development has occurred<br />
at different rates in different regions.<br />
Water development and growth<br />
Water infrastructure supports growth and<br />
poverty reduction and should be planned<br />
by taking the possible impacts into account<br />
(box 6.2). The principal drivers of growth<br />
and change have often come from outside<br />
the domain of water managers. Water<br />
development has largely responded to and<br />
been affected by developments in the wider<br />
political economy, such as market-oriented<br />
Box 6.1<br />
Water services are a crucial element of<br />
nation-building in fragile states<br />
The importance of water services is<br />
especially apparent in societies where<br />
normal social life and political structures<br />
have broken down. Categorizing<br />
them as fragile states, the UK Department<br />
for International Development<br />
defines these as countries ‘where the<br />
government cannot or will not deliver<br />
core functions to the majority of its<br />
people, including the poor’. Among<br />
the most important functions of the<br />
state for poverty reduction is ‘the ability<br />
to protect and support the ways<br />
in which the poorest people sustain<br />
reforms, openness to global trading systems<br />
and advances, supply chains and regional<br />
production networks. Storage, irrigation,<br />
urban water supply and wastewater have all<br />
been part of the enabling infrastructure.<br />
These have been led by public policies and<br />
microeconomic developments (productivity<br />
changes, capital and input accumulation,<br />
and technology). In some cases<br />
themselves’. While each fragile state<br />
is fragile in different ways and for<br />
different reasons – war, post-conflict<br />
recovery, major natural catastrophe,<br />
prolonged mismanagement and political<br />
repression – a striking commonality<br />
in reports from aid agencies is the<br />
prominence of water and sanitation in<br />
relief and reconstruction programmes.<br />
The rapid restoration of viable water<br />
services is often a crucial ingredient of<br />
nation-building in these fragile states.<br />
Source: DfID 2005, p. 7; OECD 2008.<br />
Box 6.2<br />
Storing water for development<br />
For millennia people have tried to control<br />
and store irregular water flows by creating<br />
reservoirs and storing water to regulate<br />
seasonal flows, limit floods and overcome<br />
dry spells.<br />
Today, in parts of many countries demand<br />
exceeds available runoff. These countries<br />
depend on dams and water harvesting<br />
systems to control irregular storm runoff.<br />
The situation is particularly acute in arid<br />
and semi-arid areas where rainfall periods<br />
are short and floods can be especially<br />
destructive. Demands are often seasonal,<br />
relating not only to agriculture, but also to<br />
peak demands for tourism and hydropower<br />
production. Increasingly, it will be<br />
impossible to do without some form of<br />
water storage, either surface (reservoirs or<br />
water-harvesting systems) or underground<br />
(cisterns and aquifers). Global changes, in<br />
particular the impacts of climate change,<br />
elevate the need for water storage to a<br />
higher priority.<br />
Food production has always been an<br />
important driver of water storage. In<br />
countries where the majority of the people<br />
live in rural areas, irrigation is increasingly<br />
indispensable to ensure reliable supplies of<br />
water during the growing season.<br />
Satisfying demand for energy through hydropower<br />
has also led to the construction<br />
of dams. This becomes more imperative<br />
with the highly fluctuating cost of fossil<br />
fuels and the need to shift towards cleaner<br />
energy production. Emerging market economies<br />
with fast-growing industries and<br />
cities need to secure more energy. China,<br />
India and Thailand and many countries in<br />
Latin America are looking to invest in water<br />
infrastructure in neighbouring countries (as<br />
South Africa has done in Lesotho), if necessary<br />
to secure their water futures.<br />
Water storage is a particularly important<br />
component of flood management. Its importance<br />
will likely increase in a changing<br />
global climate, especially in regions where<br />
the severity of storms is projected to<br />
intensify and where precipitation may be<br />
higher. The potential for increased storms<br />
and extreme rainfall events means that<br />
dams and other large-scale infrastructure<br />
will need to be built to higher engineering<br />
standards, to withstand future risks.<br />
Small- and large-scale storage complement<br />
one another. Smaller decentralized<br />
and participatory water harvesting<br />
systems have increased water availability<br />
and, consequently, agricultural production,<br />
at household and community levels,<br />
especially among the poor. A diversity<br />
of storage types and capacities reduces<br />
vulnerability to catastrophic events.<br />
Large storage projects may represent<br />
a more appropriate solution for multipurpose<br />
projects that provide hydropower,<br />
irrigation, flood control and drought<br />
management, and water supply for large<br />
urban areas. Their management is complex<br />
because storage can frequently compromise<br />
needs for other uses (for example,<br />
the need to lower reservoir water levels for<br />
flood control, maintain levels for energy<br />
production and replicate natural flows for<br />
protection of species). Integrated water<br />
management at the basin level using realtime<br />
hydrologic information from weather<br />
radar and computer models of individual<br />
reservoirs allows optimum management<br />
of storage and release to satisfy domestic,<br />
agricultural, industrial and environmental<br />
requirements.<br />
Dams, especially large dams, are controversial,<br />
as they leave a heavy footprint on<br />
the natural environment and often displace<br />
large numbers of people, sometimes disrupting<br />
traditional societies. Nevertheless,<br />
many countries continue to plan for such<br />
large infrastructure projects to increase<br />
storage capacities and meet other needs<br />
considered vital to improve development<br />
and avoid crises. Such projects should<br />
strive to balance the desired objectives –<br />
economic growth and reduced vulnerability<br />
– with the likely associated environmental<br />
and social costs. Each storage project must<br />
evaluate the trade-offs involved. The World<br />
Commission on Dams has provided a basic<br />
framework for such an assessment.<br />
Source: WWAP Expert Group on Storage 2008;<br />
WCD 2000.<br />
Water in a changing world 81
PART<br />
2<br />
Chapter 6<br />
Figure 6.1<br />
Agriculture’s contribution to growth in three types of economies, 1990-2005 (percent)<br />
80<br />
60<br />
40<br />
Actual poverty data<br />
Predicted poverty data<br />
Poverty data over time<br />
The shift of economies from agriculture-based<br />
to industrialized, 1965-2001<br />
Rural poor/total poor, 2002<br />
Agriculture-based<br />
countries<br />
20<br />
Brazil (1970-96)<br />
Indonesia (1970-96)<br />
0<br />
China<br />
Transforming<br />
(1981-2001)<br />
countries<br />
Urbanized countries<br />
-20<br />
0.0 0.2 0.4 0.6 0.8 1.0<br />
Note: Arrows show paths for Brazil, China, India and Indonesia.<br />
Source: Based on World Bank 2007.<br />
India (1965-94)<br />
infrastructure development has been promoted<br />
by specific sectors in the economy<br />
that directly benefit from them, while the<br />
costs are usually borne by society at large.<br />
Agriculture – especially food production –<br />
has historically been a first stage of national<br />
development (figure 6.1). For example, the<br />
Republic of Korea’s industrial take-off in the<br />
1960s was preceded by decades of rapid agricultural<br />
growth, with productivity driven<br />
by comprehensive land reform that saw<br />
smallholdings displace traditional tenant<br />
farming. In Thailand poverty fell from 57%<br />
in 1962 to 10% in 2002, with initial declines<br />
led by growth in agricultural production.<br />
Viet Nam laid the foundation for rapid<br />
post-war economic growth through liberalization<br />
of markets and macroeconomic<br />
stability, together with increased security<br />
of land tenure that permitted transfers of<br />
land-use rights. Between 1990 and 2003,<br />
as the economy grew at 7.5% a year and<br />
agriculture at 4.2%, the $1 a day poverty<br />
index dropped from 50.7 to 13.1. Agricultural<br />
productivity improvements largely<br />
drove gains in the early reform period as<br />
Viet Nam became the world’s second largest<br />
exporter of rice, coffee and pepper. During<br />
this period of sustained economic growth,<br />
Asia witnessed a major expansion in irrigation<br />
infrastructure in water storage, urban<br />
water supply and wastewater treatment.<br />
Development in a country or community<br />
is constrained by the abilities to gain access<br />
to water and – should the resource<br />
become scarce – to make the necessary<br />
economic, social and environmental tradeoffs<br />
(see chapter 16). Changes in rainfall<br />
and more variable runoff as a result of<br />
climate change are likely to reduce water<br />
availability and represent a clear challenge<br />
for development (see chapter 11). Where<br />
runoff is extremely variable, the potential<br />
ability to store floodwater has the dual<br />
advantage of saving water for later use<br />
while protecting human settlements and<br />
development infrastructure.<br />
Can we afford not to invest in water?<br />
Evidence of the macroeconomic returns to<br />
investment in water is growing. The cost<br />
of a series of major typhoons and resulting<br />
flood damage in post-war Japan has been<br />
estimated at 5%-10% of GNP. Investment<br />
in soil conservation and flood control<br />
following legislation in the early 1960s<br />
reduced the impact of flood damage to less<br />
than 1% of GNP. 6 A rise in investment in<br />
domestic water use was accompanied by a<br />
sharp drop in reported illnesses and death<br />
from infectious water-borne diseases and a<br />
virtual end to related infant deaths. 7<br />
There are even more examples of the<br />
economic cost of lack of investment in<br />
water. In Kenya the combined impact of<br />
the winter floods of 1997/98 and drought<br />
between 1998 and 2008 has been estimated<br />
at $4.8 billion – effectively a 16%<br />
reduction in GDP (see table 5.1 in chapter<br />
5). 8 Evidence suggests that floods and<br />
drought in Kenya translate into a direct<br />
annual loss of 22% of GDP over a 2.5 year<br />
period. The Mozambique floods of 2000<br />
caused a 23% reduction in GDP and a<br />
44% rise in inflation. Inability to tackle<br />
hydrologic variability in Ethiopia has been<br />
estimated to cause a 38% decline in GDP<br />
and a projected 25% increase in poverty<br />
for 2003-15. 9 Worldwide, more than 7,000<br />
major disasters have been recorded since<br />
1970, causing at least $2 trillion in damage<br />
and killing at least 2.5 million people. 10<br />
Improving water management would help<br />
countries reduce the damage of climate<br />
variability and the extreme events that<br />
can cripple economies. Year after year, the<br />
human costs of delayed investments are<br />
mounting.<br />
GDP, water investments and water use<br />
While the links between water development<br />
and GDP are strong, they are also<br />
complex. Asian Water Development Outlook<br />
2007 emphasizes the need for a multidisciplinary<br />
and multisector perspective on<br />
water in the Asia and Pacific region to face<br />
the challenges of sustaining growth. 11 The<br />
report highlights the need to address the<br />
links between water and other important<br />
development-related sectors, such as energy,<br />
food and the environment.<br />
Actions that target rural economies will<br />
benefit the largest number of people. As of<br />
82 World Water Development Report 3
Water's many benefits<br />
PART<br />
2<br />
2007, 3 billion people live in rural areas,<br />
most of them dependent on agriculture for<br />
their livelihood. Agricultural economies<br />
are especially vulnerable to lack of water<br />
during critical crop-growing seasons. Their<br />
performance is influenced by the ability to<br />
secure and control water through infrastructure,<br />
such as water harvesting storage,<br />
reservoirs and canals, and the ability to<br />
transport it to crops when required.<br />
Investments in physical infrastructure<br />
must be accompanied by investments in<br />
‘soft’ infrastructure, the dense network of<br />
institutions and human capacity needed to<br />
secure spaces in which individuals, households,<br />
firms and communities are able to<br />
pursue their day-to-day activities with a<br />
reasonable degree of predictability and stability<br />
and with due regard for the interests<br />
of others. 12 Investments are also required<br />
for the operation and maintenance of<br />
physical infrastructure (see chapter 9).<br />
However, while there is a strong relation<br />
between water investment and growth, the<br />
relation between the quantity of water used<br />
and a country’s level of development is<br />
inconclusive (figure 6.2). Many water-poor<br />
economies have developed, while the ratio<br />
of water use to GDP in many developed<br />
countries has been declining (figure 6.3).<br />
Water and poverty reduction<br />
The relationship between water and poverty<br />
is widely discussed in the development<br />
literature. 13 Water contributes to poverty<br />
alleviation in many ways – through<br />
sanitation services, water supply, affordable<br />
food and enhanced resilience of poor<br />
communities to disease, climate shocks<br />
and environmental degradation. Water<br />
of appropriate quantity and quality can<br />
improve health and, when applied at the<br />
right time, can enhance the productivity<br />
of land, labour and other inputs.<br />
The daily water supply for multiple<br />
household uses is determined by the<br />
time, labour and financial costs required<br />
to access water. The economic and social<br />
returns from water access for different uses<br />
determine net livelihood benefits or losses.<br />
2,500<br />
2,000<br />
1,500<br />
1,000<br />
Figure 6.2<br />
500<br />
The relation between freshwater use and level<br />
of development is inconclusive<br />
Freshwater withdrawal per capita, 2002 (cubic metres per year)<br />
0<br />
0 10,000 20,000 30,000 40,000 50,000<br />
GDP per capita, 2002<br />
Source: Data on water withdrawal, AQUASTAT; data on GDP per capita, World Bank.<br />
Figure 6.3<br />
The ratio of water use to GDP has been declining in many countries<br />
Cubic metres of water per dollar of GDP<br />
6<br />
5<br />
4<br />
3<br />
Egypt<br />
India<br />
Iraq<br />
China<br />
Morocco<br />
Iran, Islamic<br />
Rep.<br />
Cyprus<br />
Jordan<br />
Turkey<br />
Tunisia<br />
Algeria<br />
Libyan Arab<br />
Jamahiriya<br />
Saudi Arabia<br />
Malta<br />
0.5<br />
0.4<br />
0.3<br />
0.2<br />
Portugal<br />
Spain<br />
Russian<br />
Federation<br />
United<br />
States<br />
Italy<br />
Japan<br />
Greece<br />
Canada<br />
Israel<br />
United<br />
Kingdom<br />
France<br />
Germany<br />
Sweden<br />
Norway<br />
2<br />
1<br />
0.1<br />
0<br />
1975<br />
1980<br />
1985<br />
1990<br />
1995<br />
1997<br />
2000<br />
0.0<br />
1975<br />
1980<br />
1985<br />
1990<br />
1997<br />
2000<br />
Source: Based on Margat and Andréassian 2008.<br />
Water in a changing world 83
PART<br />
2<br />
Chapter 6<br />
The poorest<br />
populations in the<br />
world have the<br />
lowest access to<br />
water supply and<br />
sanitation services<br />
and are the most<br />
dependent on<br />
water resources<br />
for sustainable<br />
livelihoods.<br />
They are at the<br />
losing end of<br />
the equity curve,<br />
most vulnerable<br />
to changing<br />
environmental and<br />
social conditions<br />
and most likely<br />
to be adversely<br />
affected by the<br />
vagaries of climate<br />
Benefits or losses may take the form of<br />
reduced vulnerability to shocks, increased<br />
productive capacity, increased social<br />
benefits and increased capacity to maintain<br />
service levels. Studies in India show<br />
clear evidence of poverty alleviation and<br />
income gains for all rural groups, even the<br />
landless, through increased working days<br />
as a result of improved access to water. 14<br />
Distributing the benefits of growth<br />
A major lesson of Human Development<br />
Report 2006 on poverty and the global<br />
water crisis is that the distribution of<br />
economic growth affects the rate at which<br />
the growth is converted into poverty<br />
reduction. 15 Thus, every 1% increase in<br />
growth has reduced poverty by about 1.5%<br />
in Viet Nam – twice the 0.75% reduction<br />
in Mexico, with its larger income gap. The<br />
report records that some countries, such as<br />
Bangladesh and Thailand (for sanitation)<br />
and Sri Lanka and Viet Nam (for water),<br />
have performed far better than expected<br />
solely on the basis of income, as compared<br />
with others, such as India and Mexico (for<br />
sanitation). The lesson is that income matters<br />
but that policy shapes the conversion<br />
of income into human development.<br />
The poorest populations in the world have<br />
the lowest access to water supply and sanitation<br />
services and are the most dependent<br />
on water resources for sustainable livelihoods.<br />
They are at the losing end of the<br />
equity curve, most vulnerable to changing<br />
environmental and social conditions and<br />
most likely to be adversely affected by the<br />
vagaries of climate. As noted in Human<br />
Development Report 2006, access to water<br />
in many developing countries mirrors the<br />
distribution of wealth. The Millennium<br />
Development Goals and other poverty reduction<br />
efforts such as Poverty Reduction<br />
Strategy Papers have been designed specifically<br />
to address these types of inequities.<br />
One clear message from the past decade of<br />
poverty reduction initiatives is the diversity<br />
of approaches to development. Unlike<br />
health and education, which are firmly<br />
ensconced in the arena of social services,<br />
water management has often tended to fall<br />
between the economic and growth agenda<br />
or the human development and basic services<br />
agenda. Neither agenda has held sway<br />
across all countries.<br />
Human Development Report 2006 unequivocally<br />
identifies the crises in drinking water<br />
and sanitation as a crisis for the poor, on<br />
the evidence that almost two in three<br />
people lacking access to safe drinking water<br />
survive on less than $2 a day and one in<br />
three on less than $1 a day. 16 More than 660<br />
million people without adequate sanitation<br />
live on less than $2 a day, and more than<br />
385 million on less than $1 a day. This evidence<br />
highlights clearly the financing difficulties<br />
of improving access through household<br />
investment. This is important because<br />
households, not public agencies, often make<br />
the largest investment in basic sanitation,<br />
with the ratio of household to government<br />
investment typically being 10 to 1. 17<br />
With household poverty widespread, the<br />
burden has shifted to governments. A<br />
strong social and economic case has been<br />
made over the past decade for investments<br />
in water supply and sanitation as essential<br />
prerequisites for economic growth.<br />
There is also evidence that more equitable<br />
economic growth in Asia has delivered improved<br />
water supply and sanitation – with<br />
rising wealth making possible household<br />
investments in basic services and higher<br />
government expenditure for basic services.<br />
WaterAid in its 2005 response to the Camdessus<br />
Report of 2003 points to growth as<br />
an enabler of government finance for the<br />
provision of basic services: ‘For national<br />
governments in developing countries to<br />
double their allocations to water, their<br />
national incomes need to rise substantially.<br />
This requires, amongst other things,<br />
a healthy balance of trade and a growing<br />
national economy.’ 18<br />
Rising levels of income inequality may<br />
make access to services more difficult for<br />
those who most need it. The UN Department<br />
of Economic and Social Affairs suggests<br />
a package of universal social policies<br />
and targeted economic policies tailored to<br />
individual country conditions. The package<br />
would be based on a strong ‘social contract’<br />
to provide a ‘global social floor’ that<br />
provides a minimum level of security –<br />
including water security – in line with the<br />
Universal Declaration of Human Rights. 19<br />
The different situations and water<br />
needs of the urban and rural poor<br />
Some 1.4 billion people are classified as<br />
poor: 20 44% in South Asia, about 24% each<br />
in sub-Saharan Africa and East Asia, and<br />
6.5% in Latin America and the Caribbean.<br />
The water-related needs of poor people differ<br />
in urban and rural contexts.<br />
The urban poor often live in informal settlements<br />
following rapid urban growth: 77%<br />
of the population in Latin America is urban;<br />
38% in Africa. Those figures are expected to<br />
rise over the next few decades with projected<br />
urban expansion. People in informal<br />
settlements live without many of life’s basic<br />
84 World Water Development Report 3
Water's many benefits<br />
PART<br />
2<br />
necessities: safe drinking water, adequate<br />
sanitation services, access to health services,<br />
durable housing and secure tenure. 21 Affordable,<br />
safe, piped water is available to only a<br />
small share of low-income urban dwellers.<br />
The financing of water services is the key to<br />
expanding access, but the illegal status of<br />
the large majority of slum dwellers is often<br />
a barrier to access to finance or support<br />
(box 6.3). Many informal settlements are in<br />
flood-prone areas and are especially vulnerable<br />
to environmental hazards. 22 Thus, large<br />
populations of slum dwellers live at high<br />
risk of disease.<br />
For the rural poor, who make up some 75%<br />
of the world’s poorest people, access to<br />
water is essential both for basic needs and<br />
for productive purposes. Lack of access is<br />
often the main factor limiting their ability<br />
to secure their livelihoods. The Food and<br />
Agriculture Organization of the United<br />
Nations and the International Fund for Agricultural<br />
Development have been working<br />
on a response matrix for rural poverty in<br />
Africa to provide planners and policy-makers<br />
with a conceptual framework to identify<br />
appropriate context-specific interventions<br />
tailored to the needs of diverse groups of<br />
rural people (table 6.1 and figure 6.4). 23<br />
Although interventions are needed in<br />
several areas, water is a key factor because<br />
it plays a central role in agriculture, it is a<br />
frequent constraint on production and it<br />
provides a focal point around which other<br />
interventions can be organized (box 6.4).<br />
Strategies to reduce rural poverty need<br />
to focus on improving productivity in<br />
agriculture – for most, the main source of<br />
income. Gains require substantial interventions<br />
to improve farm-level access and control<br />
and management of water resources.<br />
There are many links between rural and<br />
urban areas, and in most places there are<br />
no sharp boundaries between rural and<br />
urban spaces. Families often depend on<br />
both urban and rural locales to make<br />
a living. The share of rural household<br />
incomes from non-farm sources, including<br />
migrants’ remittances, is 60% in South<br />
Asia, 40% in Latin America and 30-50%<br />
in sub-Saharan Africa (reaching as high as<br />
80%-90% in Southern Africa). 24<br />
Questions remain about how best to realize<br />
the potential benefits of water management<br />
opportunities to assist the poor – particularly<br />
about how to most effectively engage<br />
the potential of limited water resources<br />
for all poor people. For example, evidence<br />
from the Zambezi Basin shows that even<br />
full development of the basin’s irrigation<br />
Box 6.3<br />
Provision of safe water and adequate<br />
sanitation is often affected by systems<br />
of land tenure. Where sanitation is<br />
provided by individuals, as is common<br />
in rural areas, there is little incentive<br />
to invest without security of tenure.<br />
Where governments seek to improve<br />
the provision of public services<br />
through government provision, which<br />
may involve contracts with private sector<br />
providers, service providers usually<br />
require a land right (ownership or lease<br />
tenure) before concluding a contract<br />
to provide services.<br />
Resolving these issues requires an<br />
integrated approach across government<br />
departments and related institutions<br />
to ensure that the agencies responsible<br />
for land and property rights recognize<br />
the public and personal health benefits<br />
of sanitation and consequent improvements<br />
in the social and economic standing<br />
of the poor. In Manila, a megacity<br />
Table 6.1<br />
Characteristic of<br />
rural livelihood<br />
Land tenure and access to water and sanitation<br />
potential could benefit no more than 18%<br />
of the basin’s rural poor, even considering<br />
off-farm multipliers. 25 This argues for a<br />
dual approach, with interventions to reduce<br />
farmers’ vulnerabilities to rain-fed agriculture<br />
as an essential accompaniment to the<br />
development of both smallholder irrigation<br />
and large-scale infrastructure to support<br />
macroeconomic growth.<br />
Unless the growth and poverty-reducing<br />
contributions of water resources are made<br />
more explicit and specific at the country<br />
level, development-oriented finances are<br />
unlikely to follow. Those specifics will<br />
influence decisions about the sources,<br />
costs, viability, sustainability and instruments<br />
of development finance. But only<br />
national and local action plans can secure<br />
with a large informal population, the<br />
utilities offered to extend water lines<br />
to the perimeter of slums. Metered<br />
connections to the households would<br />
be managed by resident associations or<br />
non-governmental organizations and<br />
paid for by residents. The residents and<br />
the utilities gained from this solution<br />
as both water costs in slums and illegal<br />
connections were cut by 25%. There<br />
are other examples where improved<br />
land tenure led to better service to the<br />
poorest and to better performance by<br />
public agencies, such as strategies to<br />
facilitate access to tenure title (India)<br />
or integrated land tenure security or<br />
improvement programmes (Morocco,<br />
South Africa, Thailand and Zambia).<br />
Source: Ben Fawcett and Diana Mitlin,<br />
International Water Association, based on<br />
UNDP 2006; http://esa.un.org/iys; World<br />
Water Assessment Programme Expert Group<br />
on Legal Issues.<br />
Water and the characteristics of rural livelihoods<br />
Manifestation<br />
of characteristic<br />
among low-income<br />
populations<br />
Manifestation<br />
of characteristic<br />
among high-income<br />
populations<br />
Agricultural output (crops<br />
and livestock yield) Low High<br />
Health and water access Poor Good<br />
Direct natural resource<br />
dependency High Low<br />
Susceptibility to flood and<br />
drought risk High Low<br />
Knowledge and adaptive<br />
capacity Traditional Sophisticated<br />
Source: Sullivan et al. forthcoming.<br />
Water in a changing world 85
PART<br />
2<br />
Chapter 6<br />
Figure 6.4<br />
Different categories of rural inhabitants in Africa<br />
Water's many benefits<br />
PART<br />
2<br />
household production system, stimulating<br />
household income growth. 26<br />
Poor households use water from natural<br />
streams, from human-made structures<br />
(irrigation canals and wells) and from rainwater<br />
harvested for small-scale irrigation<br />
or domestic purposes. Although few water<br />
sources have a single use or user, a singleuse<br />
perspective has dominated thinking<br />
on water development and services (box<br />
6.5), particularly where communities<br />
provide water supply systems in rural and<br />
poor peri-urban areas.<br />
Multiple-use water systems yield both<br />
financial and non-financial benefits (figure<br />
6.5). Evidence from around the world<br />
indicates that if the multiple-use reality<br />
were acknowledged and investments were<br />
made to upgrade single-purpose systems<br />
to serve multiple functions, more than 1<br />
billion poor people could benefit. 27 For<br />
example, upgrading domestic systems to<br />
provide 100 litres per person per day could<br />
generate income of $40-$80 per capita per<br />
year. In South Africa this approach resulted<br />
in improved income as the productive use<br />
of domestic water rose from 17% of average<br />
household income in villages with limited<br />
water to 31% in villages with adequate provision.<br />
28 The income generated by multipleuse<br />
services can enable repayment of initial<br />
and ongoing costs for most service levels<br />
and technology options, making multipleuse<br />
services more likely to be sustained.<br />
When poor people can access water for<br />
such household use and for small-scale<br />
productive water points, they are better<br />
able to avoid hunger and survive droughts.<br />
A multiple-use approach can improve<br />
health and reduce the incidence of waterborne<br />
diseases and lower child mortality.<br />
It can also contribute to gender equity by<br />
reducing the time women spend fetching<br />
water. In rural areas this approach could<br />
Box 6.5<br />
Defining water services: single or multiple uses?<br />
Water services are defined as the<br />
provision of water of a given quality,<br />
quantity and reliability at a specified<br />
place. The definition emphasizes<br />
outputs – what people receive – rather<br />
than infrastructure.<br />
Single-use approaches involve design,<br />
finance and arrangement of water<br />
services for a single intended use, such<br />
as for irrigation or domestic purposes,<br />
the most important single-use services<br />
in rural areas. Single-use approaches<br />
are the standard model of water service<br />
delivery.<br />
Multiple-use approaches involve planning,<br />
finance and management of<br />
integrated water services for multiple<br />
domestic and productive uses based<br />
on consumer demand. ‘Domestic +’<br />
approaches involve provision of<br />
water services for domestic as well<br />
as productive activities. ‘Irrigation +’<br />
approaches involve provision of water<br />
services for irrigation as well as domestic<br />
and non-irrigation productive<br />
activities.<br />
Source: Renwick et al. 2007.<br />
Figure 6.5<br />
Benefits of a multiple-use approach to water<br />
Domestic+ irrigation+ services progressively and<br />
synergistically broaden benefits of single-use<br />
services and more comprehensively address the<br />
multidimensional aspects of poverty.<br />
Size of benefit/poverty impact<br />
Domestic+<br />
Low<br />
High<br />
Irrigation+<br />
Low<br />
High<br />
Health<br />
Time<br />
savings<br />
Income<br />
Improved<br />
food security/<br />
nutrition<br />
Diversification<br />
of livelihoods;<br />
reduced<br />
vulnerability<br />
Equity and<br />
empowerment<br />
Highest-level<br />
multiple-use services<br />
Intermediate-level<br />
multiple-use services<br />
Basic-level<br />
multiple-use services<br />
Basic domestic or<br />
basic irrigation a<br />
a. Assumes no unplanned uses as they cannot ensure sustainable generation of benefits.<br />
Source: Renwick et al. 2007.<br />
Water in a changing world 87
PART<br />
2<br />
Chapter 6<br />
Access to safe<br />
water and<br />
adequate<br />
sanitation services<br />
has proved to be<br />
one of the most<br />
Table 6.2<br />
efficient ways<br />
of improving<br />
human health<br />
Intervention<br />
provide water for garden plots to meet<br />
household needs.<br />
Water and health<br />
Access to safe water and adequate sanitation<br />
services has proved to be one of the<br />
most efficient ways of improving human<br />
health. The World Health Organization<br />
has estimated the economic costs that can<br />
be avoided through adequate sanitation<br />
and the economy-wide returns to various<br />
levels of investment in water supply<br />
and sanitation services (table 6.2). Every<br />
$1 invested in improved water supply and<br />
sanitation yields gains of $4-$12, depending<br />
on the type of intervention.<br />
Almost one-tenth of the global disease<br />
burden could be prevented by improving<br />
water supply, sanitation, hygiene and<br />
management of water resources. Such<br />
improvements reduce child mortality and<br />
improve health and nutritional status in a<br />
sustainable way. They yield multiple social<br />
and economic benefits, enhancing wellbeing<br />
and, indirectly, people’s access to<br />
health-related services. Upgrading water<br />
supply and sanitation services could also<br />
improve education outcomes by enabling<br />
more girls to attend school instead of<br />
fetching water, while providing sanitary<br />
facilities in schools encourages higher<br />
female enrolment in secondary schools<br />
and improves the working environment<br />
for female teachers. There is thus a strong<br />
conceptual case that improved coverage of<br />
drinking water and sanitation contributes<br />
to meeting the Millennium Development<br />
Goals and to accelerated growth.<br />
Benefit-cost ratio by water and sanitation<br />
intervention in developing regions and Eurasia<br />
Annual<br />
benefits<br />
($ millions)<br />
Benefit-cost<br />
ratio<br />
Halving the proportion of people without<br />
access to improved water sources by 2015 18,143 9<br />
Halving the proportion of people without<br />
access to improved water sources and<br />
improved sanitation by 2015 84,400 8<br />
Universal access to improved water<br />
and sanitation services by 2015 262,879 10<br />
Universal access to improved water<br />
and improved sanitation and water<br />
disinfected at the point of use by 2015 344,106 12<br />
Universal access to a regulated piped water<br />
supply and sewerage connection by 2015 555,901 4<br />
Note: Benefit-cost ratio is total benefits divided by total costs. The higher the ratio, the<br />
greater the benefits relative to the costs. Projects with a benefit-cost ratio greater than 1<br />
have greater benefits than costs.<br />
Source: Prüss-Üstün et al. 2008.<br />
Saving children<br />
The under-five mortality rate is an important<br />
social indicator of development. It is<br />
an indicator of the quality of life, including<br />
the income and education of parents,<br />
the efficacy of health services and access to<br />
safe drinking water and sanitation services.<br />
It is also easily measured and so is considered<br />
a good indicator of progress towards<br />
the Millennium Development Goals. In<br />
2000 diarrhoea accounted for 17% of the<br />
10.6 million deaths in children younger<br />
than five, and malaria for 8%. 29 Undernutrition<br />
is an underlying cause of 53% of all<br />
deaths in children younger than five.<br />
Global under-five mortality has fallen<br />
from 93 per 1,000 live births in 1990 to 72<br />
per 1,000 in 2005 – a decline of 22.5% –<br />
but the pace of progress has been uneven<br />
across regions and countries. The decline<br />
has been slowest in sub-Saharan Africa.<br />
Benefits of improved access to water and<br />
sanitation for health<br />
Improvements in drinking water, sanitation,<br />
hygiene and water resources management<br />
could have a particularly large impact<br />
on diarrhoea, malaria and malnutrition<br />
(table 6.3). But investments in improved<br />
water supply and sanitation would also<br />
make a difference for many neglected tropical<br />
diseases (such as intestinal nematode<br />
infections, lymphatic filariasis, trachoma<br />
and schistosomiasis) that have environmental<br />
transmission pathways. Another<br />
water health issue of increasing concern is<br />
naturally occurring chemical contaminants<br />
– notably arsenic and fluoride (see box 8.3<br />
in chapter 8). Such contaminants underline<br />
the need for simple and reliable water quality<br />
monitoring systems and have important<br />
implications for the definition of ‘safe’<br />
drinking water used to monitor progress<br />
towards international targets, such as the<br />
Millennium Development Goals.<br />
Benefits go well beyond human health<br />
Access to safe drinking water and adequate<br />
sanitation services is vital to human<br />
health but has other important benefits<br />
ranging from the easily identifiable and<br />
quantifiable (costs avoided, time saved)<br />
to the more intangible and difficult to<br />
measure (convenience, well-being, dignity,<br />
privacy and safety).<br />
In cost-benefit analyses the major benefits<br />
of improving access to water and sanitation<br />
derive from the time savings associated<br />
with closer location of facilities. Easy<br />
access translates into increased production,<br />
higher school attendance and more<br />
leisure time. The case is exceptionally<br />
88 World Water Development Report 3
Water's many benefits<br />
PART<br />
2<br />
Table 6.3<br />
Major diseases attributable to environmental factors<br />
Disease<br />
Annual global burden<br />
attributable to water,<br />
sanitation and hygiene<br />
Deaths<br />
(thousands)<br />
DALY a<br />
(thousands)<br />
Percent of<br />
total burden<br />
attributable to<br />
environmental<br />
factors<br />
Environmental pathways<br />
Diarrhoea 1,523 52,460 94 Water supply, sanitation, hygiene<br />
Malnutrition 863 35,579 50 Water supply, sanitation, hygiene,<br />
water resources management<br />
Malaria 526 19,241 42 Water resources management<br />
Lymphatic filariasis 0 3,784 66 Water supply, sanitation<br />
Intestinal nematodes 12 2,948 100 Sanitation<br />
Trachoma 0 2,320 100 Water supply, hygiene, flies<br />
Schistosomiasis 15 1,698 100 Water supply, sanitation, water resources management<br />
Japanese encephalitis 13 671 95 Water resources management<br />
Dengue 18 586 95 Water supply, sanitation<br />
a. Disability adjusted life year, a summary measure of population health. One DALY represents one lost year of healthy life.<br />
Source: Adapted from Prüss-Üstün and Corvalán 2006; Prüss-Üstün et al. 2008.<br />
strong for sanitation, where the economic<br />
cost of inaction is enormous. Without<br />
improving sanitation, it will be difficult<br />
to fully achieve the Millennium Development<br />
Goals.<br />
In addition, urban sanitation systems<br />
comprise a range of processes that represent<br />
new business opportunities. These<br />
may include small-scale service provision<br />
for construction of system components<br />
and the collection, transport, storage and<br />
processing of products from sanitation systems<br />
(into biogas, fertilizer, soil conditioners<br />
or irrigation water, for example).<br />
Reducing diarrhoeal diseases<br />
Some 1.4 million children die each year<br />
from preventable diarrhoeal diseases. Ordinary<br />
diarrhoea remains the major killer<br />
among water-, sanitation- and hygienerelated<br />
diseases, contributing to 43% of<br />
deaths. 30 Sub-Saharan Africa and South<br />
Asia are the most affected regions (map 6.1).<br />
Map 6.1 Diarrhoea deaths in 2004<br />
Sub-Saharan Africa<br />
1,024,000<br />
South Asia<br />
733,000<br />
East Asia and Pacific<br />
177,000<br />
Middle East and North Africa<br />
82,000<br />
Latin America and Caribbean<br />
64,000<br />
Europe and Central Asia<br />
34,000<br />
High-income countries<br />
12,000<br />
Source: WHO 2008.<br />
Water in a changing world 89
PART<br />
2<br />
Chapter 6<br />
Adequate<br />
sanitation and<br />
hand- washing after<br />
defecation helps<br />
break the chain<br />
of transmission of<br />
fæcal-oral disease<br />
Adequate sanitation and hand- washing<br />
after defecation helps break the chain<br />
of transmission of fæcal-oral disease. 31<br />
There is strong evidence that handwashing<br />
with soap prevents not only<br />
diarrhoea but also acute respiratory<br />
infections, both major killers of children<br />
ages 1 month to 5 years. For example, in<br />
squatter settlements of Karachi, Pakistan,<br />
hand- washing with soap cut episodes of<br />
diarrhoea and acute respiratory infections<br />
in half. 32 Hand- washing even<br />
without water (in sand, for example), also<br />
significantly reduces the likelihood of<br />
diarrhoea, emphasizing the importance<br />
of hygiene as well as water provision in<br />
improving health.<br />
Combating malnutrition<br />
Malnutrition accounts for about a third<br />
of the disease burden in low- and middleincome<br />
countries. 33 Lack of access to<br />
adequate, safe food, partly related to water<br />
resources management, is one cause of<br />
malnutrition, but up to 50% of malnutrition<br />
is related to repeated diarrhoea or<br />
intestinal nematode infections as a result<br />
of unclean water, inadequate sanitation or<br />
poor hygiene (see table 6.3).<br />
Low height-for-age (stunting), an indicator<br />
of chronic undernutrition, is useful for<br />
long-term monitoring of the cumulative<br />
effects of poverty, unclean water and inadequate<br />
sanitation and a high infectious<br />
disease burden (map 6.2).<br />
Fighting malaria<br />
World Malaria Report 2005 states that<br />
malaria continues to exact an unacceptable<br />
toll on the health and economic<br />
welfare of the world’s poorest communities.<br />
34 During the past decade malaria<br />
resurged or increased in intensity in Africa<br />
and South-East Asia after interruption<br />
of eradication efforts and re-emerged in<br />
several Central Asian and Transcaucasian<br />
countries. Of the estimated 350-500 million<br />
clinical disease episodes occurring<br />
annually, around 60% are in sub-Saharan<br />
Africa, as are 80% of the deaths. Most of<br />
the more than 1 million Africans who die<br />
from malaria each year are children under<br />
age five.<br />
How much malaria could be eliminated by<br />
managing the environment – by eliminating<br />
stagnant water bodies, modifying<br />
reservoir contours, introducing drainage<br />
or improving irrigation management –<br />
differs across regions with variations in<br />
vector habitats, with a global average of<br />
42% (see table 6.3). Malaria control programmes<br />
that emphasize environmental<br />
management are therefore highly effective<br />
in reducing malaria illness and malariarelated<br />
death. 35 Much of the attention in<br />
international malaria research and control<br />
has focused on medical solutions, such as<br />
drugs and vaccines, but developing new<br />
tools and approaches for malaria prevention<br />
and control, including innovation in<br />
vector control, is essential.<br />
Map 6.2<br />
Geographical pattern of stunting in children under age five on a country basis<br />
40.0% and higher<br />
30.0%–39.9%<br />
20.0%–29.9%<br />
Less than 20.0%<br />
No data<br />
Source: WHO 2007.<br />
90 World Water Development Report 3
Maintaining ecosystem services<br />
How water is managed affects the health<br />
of ecosystems. Growing pressure on water<br />
resources affects ecosystems and threatens<br />
the ecosystem goods and services on<br />
which life and livelihoods depend.<br />
The natural environment provides food,<br />
essential natural resources and other lifesupporting<br />
goods, services and benefits<br />
for people, animals and plants. In addition<br />
to supporting the production of food<br />
and fibres, freshwater ecosystems regulate<br />
environmental flows, purify wastewater<br />
and detoxify wastes, regulate climate,<br />
provide protection from storms, mitigate<br />
erosion and offer cultural benefits, including<br />
significant aesthetic, educational and<br />
spiritual benefits.<br />
The diversity of ecosystem services varies<br />
with the type of ecosystem and the ways<br />
in which this multifunctionality is managed<br />
(figure 6.6). 36 Aquatic ecosystems produce<br />
significant economic benefits, including<br />
flood control, groundwater recharge,<br />
Water's many benefits<br />
shoreline stabilization and protection,<br />
nutrition cycling and retention, water<br />
purification, preservation of biodiversity,<br />
and recreation and tourism. The Nakivubo<br />
swamp, for example, provides wastewater<br />
treatment services worth some $363 million<br />
to the citizens of Kampala, Uganda. 37<br />
In Uganda alone the use of inland water<br />
resources is worth almost $300 million<br />
a year in forest catchment protection,<br />
erosion control and water purification<br />
services. Almost 1 million urban dwellers<br />
rely on natural wetlands for wastewater<br />
retention and purification services. 38<br />
Natural wetlands in the Zambezi Basin in<br />
Southern Africa have a net present value<br />
of more than $64 million – $16 million<br />
in groundwater recharge, $45 million in<br />
water purification and treatment services<br />
and $3 million in attenuation of flood-related<br />
damage costs. 39 Rice fields – humanmade<br />
wetlands in the Ramsar Convention<br />
typology – offer a large range of ecosystem<br />
services that can be enhanced or<br />
diminished depending on management<br />
decisions about the use of water and its<br />
productive functions (see figure 6.6).<br />
PART<br />
2<br />
Growing pressure<br />
on water resources<br />
affects ecosystems<br />
and threatens the<br />
ecosystem goods<br />
and services on<br />
which life and<br />
livelihoods depend<br />
Figure 6.6<br />
Agricultural systems can be managed to produce one<br />
ecosystem function or a range of ecosystem services<br />
Provisioning services Regulating services Supporting services Cultural services<br />
Natural ecosystem<br />
Intensive cropland<br />
Recreation<br />
Crop<br />
production<br />
Fuel<br />
wood<br />
Recreation<br />
Crop<br />
production<br />
Fuel<br />
wood<br />
Nutrient<br />
cycling<br />
Regulation<br />
of water<br />
balance<br />
Nutrient<br />
cycling<br />
Regulation<br />
of water<br />
balance<br />
Soil<br />
formation<br />
Climate<br />
regulation<br />
Pest<br />
control<br />
Soil<br />
formation<br />
Climate<br />
regulation<br />
Pest<br />
control<br />
Multifunctionality in rice fields<br />
Alder-cardamom system<br />
Religious landscape<br />
values<br />
Rice<br />
production<br />
Fish<br />
Fertility transfer<br />
to other systems<br />
Commercial timber<br />
and fuel wood<br />
Cardamom<br />
seed<br />
Biodiversity<br />
enhancement<br />
in humandominated<br />
landscapes<br />
Ducks,<br />
frogs,<br />
snails<br />
Soil<br />
conservation<br />
Fodder for<br />
livestock<br />
Climate<br />
air temperature<br />
Prevention of<br />
soil erosion<br />
Water storage,<br />
lowering of<br />
peak floods,<br />
groundwater<br />
recharge<br />
Watershed<br />
conservation<br />
Nitrogen<br />
fixation<br />
Soil fertility<br />
improvement<br />
Source: Comprehensive Assessment of Water Management in Agriculture 2007, figure 6.4.<br />
Water in a changing world 91
PART<br />
2<br />
Chapter 6<br />
It is critical that<br />
allocations to the<br />
‘environment’ or<br />
‘nature’ not be<br />
considered ‘wasted<br />
water’. Most such<br />
allocations can<br />
be considered in<br />
terms of benefits<br />
to people<br />
Across developing countries 10% of undernourished<br />
people depend on direct access<br />
to natural resources, in particular freshwater<br />
ecosystems. 40 They are vulnerable to<br />
any degradation of these ecosystems or to<br />
changes in the water cycle that affect their<br />
functioning. This is the case for pastoralists<br />
moving with their herds from one<br />
water source and pasture area to another,<br />
for capture fishers vulnerable to water<br />
pollution and river water depletion and<br />
for forest-dependent people who are hurt<br />
when forests are cleared for agriculture<br />
or for construction of dams or other large<br />
infrastructure. These people are often as<br />
voiceless as ecosystems in the water allocation<br />
process.<br />
Because of the interconnection between<br />
freshwater ecosystems and their services,<br />
developing one service (for example, food<br />
production through increased irrigation)<br />
automatically affects others. The management<br />
objective is to balance the delivery<br />
of all services collectively so that ecosystems<br />
are used optimally and development<br />
becomes sustainable.<br />
Nature has to be recognized as a water<br />
stakeholder because it provides important<br />
services to society. Ways of valuing<br />
ecosystem services remain highly controversial,<br />
however, and implementation of<br />
environmental regulations is still limited<br />
(see chapter 9). In any case, defining<br />
an environmental water requirement –<br />
even if imperfect – provides a voice for<br />
nature in allocation decisions for water<br />
withdrawal at the basin level. It is critical<br />
that allocations to the ‘environment’ or<br />
‘nature’ not be considered ‘wasted water’.<br />
Most such allocations can be considered<br />
in terms of benefits to people, recognizing<br />
that these in-situ uses may constrain<br />
other uses, particularly during dry periods.<br />
Concerns for environmental services<br />
often happen too late, when water use has<br />
gone beyond the capacity of the environment<br />
to cope and when competition<br />
is critical. This is the result of decision<br />
processes that do not promote informed,<br />
impartial and balanced outcomes – and<br />
would not do so even if better valuations<br />
were at hand. Water still continues to<br />
often be allocated on a first-come, firstserved<br />
sector basis.<br />
Map 6.3 pinpoints areas where respecting<br />
environmental water requirements has become<br />
urgent because water use is reaching<br />
limits that threaten to undermine our life<br />
and development support base – particularly<br />
for people who are most vulnerable<br />
and dependent on the environment for<br />
their livelihood.<br />
Our reliance on nature and its abundance<br />
must be matched by the care we<br />
take of the agro-ecosystems on which<br />
we depend. There are pastures in the<br />
Alps, oases in Morocco and irrigation<br />
systems in the Philippines that have<br />
been used for centuries with no diminution<br />
of their productive capacities or<br />
beauty. Rice terraces cascading down the<br />
Ifugao in the Philippines represent the<br />
Map 6.3 Water stress level of major river basins, around 2002<br />
Water stress indicator<br />
Huang-He<br />
(Yellow River) Basin,<br />
China<br />
Low < 0.3<br />
0.3-0.4<br />
0.4-0.5<br />
0.5-0.6<br />
0.6-0.7<br />
0.7-0.8<br />
0.8-0.9<br />
0.9-1.0<br />
High ≥1.0<br />
No discharge<br />
Major river basins<br />
Orange River Basin,<br />
Africa (Botswana, Lesotho,<br />
Namibia, South Africa)<br />
Murray-Darling Basin,<br />
Australia<br />
Source: Based on Smakhtin, Revenga, and Döll 2004.<br />
92 World Water Development Report 3
Water's many benefits<br />
PART<br />
2<br />
Box 6.6<br />
Agro-ecosystems and sustainability: an example from Peru<br />
The central Andes are a primary centre of origin<br />
for potatoes. Up to 177 varieties have been<br />
domesticated by generations of Aymara and<br />
Quechua in the Cusco and Puno valleys. Many<br />
cultural and agricultural treasures from the Inca<br />
civilization have been carefully preserved and<br />
improved over centuries to guarantee living conditions<br />
in areas that are more than 4,000 metres<br />
above sea level.<br />
One of these is the terracing system used to control<br />
land degradation and that allows cultivation<br />
of steep slopes at altitudes ranging from 2,800<br />
metres to 4,500 metres. Maize is cultivated in<br />
the lower areas (2,500-3,500 metres above sea<br />
level), and potatoes mainly at medium altitudes<br />
(3,500-3,900 metres above sea level). Areas at and<br />
above 4,000 metres are used mostly as rangeland<br />
but are also cultivated with high-altitude crops.<br />
In the high plateau, around Lake Titicaca, farmers<br />
dig trenches around their fields and fill them with<br />
water. Warmed by sunlight during the day, the<br />
water gives off warm steam when temperatures<br />
drop at night. the steam serves as frost protection<br />
for several varieties of potatoes and other<br />
native crops, such as quinoa. This method is under<br />
consideration for use in irrigation areas in Peru as<br />
an adaptation to climate change.<br />
Source: www.fao.org/sd/giahs.<br />
collective efforts of countless generations<br />
of farmers who developed an ingenious<br />
irrigation system that allowed them to<br />
share water and develop rice varieties<br />
that survive at over 1,000 metres. In the<br />
combination rice-fish systems of Zhejiang<br />
Province in China, which date from<br />
the Han Dynasty 2,000 years ago, fish<br />
not only provide food, but they also eat<br />
larvae and weeds in the flooded fields,<br />
reducing the cost, labour and pollution<br />
risks involved in fertilization and insect<br />
control. 41 The sophisticated terracing system<br />
in the central Andes in Peru allows<br />
cultivation of steep slopes at different<br />
altitudes (box 6.6).<br />
Notes<br />
1.<br />
2.<br />
Poverty Environment Partnership 2006.<br />
World Bank 2007.<br />
3. Comprehensive Assessment of Water<br />
Management in Agriculture 2007.<br />
4. UNIDO 2007.<br />
5. World Bank 2007.<br />
6. Japan Water Forum and World Bank<br />
2005.<br />
7. Prüss-Üstün et al. 2008.<br />
8. Gichere, Davis, and Hirji 2006.<br />
9. Biemans et al. 2006; Grey and Sadoff<br />
2008.<br />
10. United Nations 2008.<br />
11. APWF 2007.<br />
12. United Nations 2008.<br />
13. GWP Technical Committee 2003; Hussain<br />
and Hanjra 2003; Lipton, Litchfield,<br />
and Faurès 2003; UNDP 2006.<br />
14. World Bank 2005a.<br />
15. UNDP 2006.<br />
16. UNDP 2006.<br />
17. DfID 2008. Research in India has shown<br />
that between 1985/86 and 1991/92 government<br />
investment in the construction<br />
of latrines increased coverage by 2.2%.<br />
At the same time, a national census<br />
found that access to latrines was much<br />
higher, suggesting that about 8% of rural<br />
households across the country had invested<br />
their own time and money in the<br />
construction of latrines (DfID 2008).<br />
18. Narayanan 2005; Winpenny 2003.<br />
19. United Nations 2008.<br />
20. World Bank 2007.<br />
21. UN-HABITAT 2006.<br />
22. Worldwatch Institute 2007.<br />
23. Faurès and Santini 2008.<br />
24. Tacoli 2007.<br />
25. World Bank 2005b.<br />
26. Faurès and Santini 2008.<br />
27. Renwick et al. 2007.<br />
28. Renwick et al. 2007.<br />
29. WHO 2007.<br />
30. Prüss-Üstün et al. 2008.<br />
31. Ejemot et al. 2008; Fewtrell et al. 2005.<br />
32. Luby et al. 2005.<br />
33. Laxminarayan, Chow, and Shahid-Salles<br />
2006.<br />
34. Roll Back Malaria, WHO, and UNICEF<br />
2005.<br />
35. Keiser et al. 2005.<br />
36. MEA 2005.<br />
37. Worldwatch Institute 2007.<br />
38. UNEP 2007.<br />
39. Turpie et al. 1999.<br />
40. Comprehensive Assessment of Water<br />
Management in Agriculture 2007.<br />
41. Lu and Li 2006.<br />
References<br />
APWF (Asia-Pacific Water Forum). 2007.<br />
Asian Water Development Outlook 2007:<br />
Achieving Water Security for Asia. Manila,<br />
Philippines: Asian Development Bank.<br />
Biemans, Hester, Ton Bresser, Henk<br />
van Schaik, and Pavel Kabat. 2006.<br />
Water and Climate Risks: A Plea for<br />
Climate Proofing of Water Development<br />
Strategies and Measures. 4th World<br />
Water Forum, Cooperative Program on<br />
Water and Climate, Wageningen, The<br />
Netherlands.<br />
Comprehensive Assessment of Water<br />
Management in Agriculture. 2007.<br />
Water for Food, Water for Life: A Comprehensive<br />
Assessment of Water Management<br />
in Agriculture. London: Earthscan, and<br />
Colombo: International Water Management<br />
Institute.<br />
DfID (Department for International<br />
Development). 2005. Why We Need to<br />
Work More Effectively in Fragile States.<br />
London: Department for International<br />
Development.<br />
DfID (Department for International Development)<br />
Sanitation Reference Group.<br />
2008. Water Is Life, Sanitation Is Dignity,<br />
Final Draft1. DfID Sanitation Policy Background<br />
Paper, Department for International<br />
Development, London. www.dfid.<br />
gov.uk/consultations/past-consultations/<br />
water-sanitation-background.pdf.<br />
Ejemot, R., J. Ehiri, M. Meremikwu, and<br />
J. Critchley. 2008. Hand Washing for<br />
Preventing Diarrhoea. Cochrane Database<br />
of Systematic Reviews, Issue 3. Art. No:<br />
CD004265. DOI: 10.1002/14651858.<br />
CD004265.pub2.<br />
Water in a changing world 93
PART<br />
2<br />
Chapter 6<br />
Faurès, J.-M., and G. Santini, ed. 2008.<br />
Water and the Rural Poor – Interventions<br />
for Improving Livelihoods in Sub-Saharan<br />
Africa. Rome: Food and Agriculture<br />
Organization of the United Nations<br />
and International Fund for Agricultural<br />
Development.<br />
Fewtrell, L., R. B. Kaufmann, D. Kay, W.<br />
Enanoria, L. Haller, and J. M. Colford.<br />
2005. Water, Sanitation, and Hygiene<br />
Interventions to Reduce Diarrhoea in Less<br />
Developed Countries: A Systematic Review<br />
and Meta-analysis. Lancet Infectious<br />
Diseases 5 (1): 42-52.<br />
Gichere, Samuel, Richard Davis, and<br />
Rafik Hirji. 2006. Climate Variability and<br />
Water Resources Degradation in Kenya:<br />
Improving Water Resources Development<br />
and Management. World Bank Working<br />
Paper Series 69, World Bank, Washington,<br />
DC.<br />
———. 2008. Power point presentation at<br />
session on Infrastructure Platform for<br />
Achieving Water Security 2008. First<br />
African Water Week, Tunis.<br />
GWP (Global Water Partnership) Technical<br />
Committee. 2003. TEC Background<br />
Paper 8: Poverty Reduction and IWRM.<br />
Sweden: Global Water Partnership.<br />
Hussain, I., and M. A. Hanjra. 2003. Does<br />
Irrigation Water Matter for Rural Poverty<br />
Alleviation? Evidence from South and<br />
South-East Asia. Water Policy 5 (5-6):<br />
429-42.<br />
Japan Water Forum and World Bank.<br />
2005. A Study on Water Infrastructure<br />
Investment and Its Contribution to<br />
Socioeconomic Development in Modern<br />
Japan. World Bank, Washington, DC.<br />
Keiser, J., B. Singer, and J. Utzinger.<br />
2005. Reducing the Burden of Malaria<br />
in Different Settings with Environmental<br />
Management: A Systematic Review. The<br />
Lancet Infectious Diseases 5 (11): 695-<br />
708.<br />
Laxminarayan, R., J. Chow, and S. A.<br />
Shahid-Salles. 2006. Intervention<br />
Cost-Effectiveness: Overview and Main<br />
Messages. In Disease Control Priorities in<br />
Developing Countries, 2nd edition, ed. D.<br />
T. Jamison, J. G. Breman, A. R. Measham,<br />
G. Alleyne, M. Claeson, D. B. Evans, P.<br />
Jha, A. Mills, and P. Musgrove. Washington,<br />
DC: World Bank, and New York:<br />
Oxford University Press.<br />
Lipton, M., J. Litchfield, and J.-M. Faurès.<br />
2003. The Effects of Irrigation on Poverty:<br />
A Framework for Analysis. Water<br />
Policy 5 (5-6): 413-27.<br />
Lu Jianbo and Xia Li. 2006. Review of Rice-<br />
Fish Farming Systems in China – One<br />
of the Globally Important Ingenious<br />
Agricultural Heritage Systems (GIAHS).<br />
Aquaculture 260 (2): 106-13.<br />
Luby, S. P., M. Agboatwalla, D. R. Feikin,<br />
J. Painter, W. Billhimer, A. Altaf,<br />
and R. M. Hoekstra. 2005. Effect of<br />
Handwashing on Child Health: A Randomised<br />
Controlled Trial. Lancet 366<br />
(9481): 225-33.<br />
Margat, J., and V. Andréassian. 2008.<br />
L’eau, les Idées Reçues. Paris: Editions le<br />
Cavalier Bleu.<br />
MEA (Millennium Ecosystem Assessment).<br />
2005. Ecosystems and Human<br />
Well-Being: Wetlands and Water Synthesis.<br />
Washington, DC: World Resources<br />
Institute.<br />
Narayanan, Ravi. 2005. Financial Water<br />
Report – Critical Issues to Be Addressed.<br />
Letter. Third World Water Forum and<br />
Water Aid. www.financingwaterforall.<br />
org/fileadmin/Financing_water_for_all/<br />
Stakeholders_responses/Narayanan_<br />
Response_to_Camdessus_Report.pdf.<br />
OECD (Organisation for Economic Cooperation<br />
and Development). 2008.<br />
Service Delivery in Fragile Situations: Key<br />
Concepts, Findings and Lessons. OECD/<br />
DAC Discussion Paper. Off-print of the<br />
Journal on Development 9 (3). Organisation<br />
for Economic Co-operation and<br />
Development, Paris. www.oecd.org/<br />
dataoecd/11/8/40581496.pdf.<br />
Poverty-Environment Partnership. 2006.<br />
Linking Poverty Reduction and Water<br />
Management. Poverty-Environment<br />
Partnership. http://esa.un.org/iys/docs/<br />
san_lib_docs/povety%20reduction%20<br />
and%20water.pdf.<br />
Prüss-Üstün, A., and C. Corvalán. 2006.<br />
Preventing Disease through Healthy<br />
Environments. Towards an Estimate of the<br />
Environmental Burden of Disease. Geneva:<br />
World Health Organization. www.who.<br />
int/quantifying_ehimpacts/publications/<br />
preventingdisease/en/index.html.<br />
Prüss-Üstün, A., R. Bos, F. Gore, and J. Bartram.<br />
2008. Safer Water, Better Health:<br />
Costs, Benefits and Sustainability of Interventions<br />
to Protect and Promote Health.<br />
Geneva: World Health Organization.<br />
Renwick, M., D. Joshi, M. Huang, S. Kong,<br />
S. Petrova, G. Bennett, R. Bingham, C.<br />
Fonseca, et al. 2007. Multiple Use Water<br />
Services for the Poor: Assessing the State<br />
of Knowledge. Final Report, Winrock<br />
International, Arlington, VA.<br />
Roll Back Malaria, WHO (World Health<br />
Organization), and UNICEF (United<br />
Nations Children’s Fund). 2005. World<br />
Malaria Report 2005. Geneva: World<br />
Health Organization.<br />
Smakhtin, V. U., C. Revenga, and P. Döll.<br />
2004. Taking into Account Environmental<br />
Water Requirements in Global-Scale Water<br />
Resources Assessments Comprehensive<br />
Assessment Research Report 2. Colombo,<br />
Sri Lanka: Comprehensive Assessment<br />
Secretariat, International Water Management<br />
Institute.<br />
Sullivan, C. A. 2002. Calculating a Water<br />
Poverty Index. World Development 30 (7):<br />
1195-210.<br />
Sullivan C. A., A. Cohen, J.-M. Faurès, and<br />
G. Santini. Forthcoming. The Rural Water<br />
Livelihoods Index: A Tool to Prioritize Waterrelated<br />
Interventions for Poverty Reduction.<br />
Rome: Food and Agriculture Organization<br />
of the United Nations and International<br />
Fund for Agricultural Development.<br />
Sullivan, C. A., J. R. Meigh, A. M. Giacomello,<br />
T. Fediw, P. Lawrence, M.<br />
Samad, S. Mlote, C. Hutton, J. A. Allan,<br />
R. E. Schulze, D. J. M. Dlamini, W.<br />
Cosgrove, J. Delli Priscoli, P. Gleick, I.<br />
Smout, J. Cobbing, R. Calow, C. Hunt,<br />
A. Hussain, M. C. Acreman, J. King,<br />
S. Malomo, E. L Tate, D. O’Regan,<br />
S. Milner, and I. Steyl. 2003. The Water<br />
Poverty Index: Development and Application<br />
at the Community Scale. Natural<br />
Resources 27 (3): 189-99.<br />
Tacoli, Cecilia. 2007. Links between Rural<br />
and Urban Development in Africa and<br />
Asia. Paper presented at United Nations<br />
Expert Group Meeting on Population Distribution,<br />
Urbanization, Internal Migration<br />
and Development, United Nations Secretariat,<br />
New York, 21-23 January, 2008.<br />
Turpie, J., B. Smith, L. Emerton, and J.<br />
Barnes. 1999. Economic Valuation of the<br />
Zambezi Basin Wetlands. Harare: IUCN–<br />
The World Conservation Union Regional<br />
Office for Southern Africa.<br />
UNDP (United Nations Development<br />
Programme). 2006. Human Development<br />
Report 2006. Beyond Scarcity: Power,<br />
Poverty and the Global Water Crisis. New<br />
York: Palgrave MacMillan.<br />
UNEP (United Nations Environment<br />
Programme). 2007. Global Environment<br />
Outlook GEO 4: Environment for Development.<br />
Nairobi: United Nations Environment<br />
Programme.<br />
UN-HABITAT (United Nations Human<br />
Settlements Programme). 2006. State<br />
of the World Cities 2006/7. London:<br />
Earthscan.<br />
UNIDO (United Nations Industrial Development<br />
Organization). 2007. Symposium<br />
Report on Water Productivity in the<br />
Industry of the Future for Technology<br />
Foresight Summit, 27-29 September<br />
2007, Budapest.<br />
United Nations. 2008. World Economic and<br />
Social Survey 2008: Overcoming Economic<br />
Insecurity. New York: Department<br />
of Economic and Social Affairs, United<br />
Nations. www.un.org/esa/policy/wess/<br />
wess2008files/wess08/overview_en.pdf.<br />
WCD (World Commission on Dams).<br />
2000. Dams and Development. A New<br />
Framework for Decision-Making. London:<br />
Earthscan.<br />
WHO (World Health Organization). 2007.<br />
World Health Statistics 2007. Geneva:<br />
World Health Organization.<br />
———. 2008. The Global Burden of Disease:<br />
2004 Update. Geneva: World Health<br />
Organization.<br />
94 World Water Development Report 3
Water's many benefits<br />
2 PART<br />
Winpenny, James. 2003. Financing Water for<br />
All. Report of the World Panel on Financing<br />
Water Infrastructure. Chaired by Michel<br />
Camdessus. Kyoto: World Water Council,<br />
3rd World Water Forum, and Global<br />
Water Partnership.<br />
World Bank. 2005a. India’s Water Economy:<br />
Bracing for a Turbulent Future.<br />
World Bank, Washington, DC. http://<br />
go.worldbank.org/QPUTPV5530.<br />
———. 2005b. Zambezi River Basin, Sustainable<br />
Water Resources Development<br />
for Irrigated Agriculture. Draft Report,<br />
TFESSD Africa Poverty and Environment<br />
Program, Environment, Rural and Social<br />
Development Department – AFTS1,<br />
Finance, Private Sector and Infrastructure<br />
Department – AFTU1, Regional Integration<br />
and Cooperation Department -<br />
AFC16, Africa Region, World Bank,<br />
Washington, DC.<br />
———. 2007. World Development Report<br />
2008: Agriculture for Development. Washington,<br />
DC: World Bank.<br />
Worldwatch Institute. 2007. State of<br />
the World: Our Urban Future. London<br />
and New York: Norton Institute.<br />
WWAP (World Water Assessment Programme)<br />
Expert Group on Storage.<br />
2008. Summary Paper of Online Discussion<br />
on Storage. World Water Assessment<br />
Programme.<br />
Water in a changing world 95
PART<br />
2<br />
Chapter 7<br />
Evolution of<br />
water use<br />
Authors: Richard Connor, Jean-Marc Faurès, Johan Kuylenstierna,<br />
Jean Margat, Pasquale Steduto, Domitille Vallée and Wim van der Hoek<br />
Contributors: José Aguilar-Manjarrez, Rizaldi Boer, Robert Bos,<br />
Cécile Brugère, Ann Cann, Olivier Dubois, Karen Frenken, Arjen Y. Hoekstra,<br />
Jippe Hoogeveen, John Jorgensen, Jon Lane, Darren Saywell and Stefania Vannuccini<br />
Key messages<br />
Coordinator: Jean-Marc Faurès (FAO)<br />
Facilitator: Domitille Vallée<br />
While most of the old challenges of water supply, sanitation and environmental<br />
sustainability remain, new challenges such as adaptation to<br />
climate change, rising food and energy prices, and ageing infrastructure<br />
are increasing the complexity and financial burden of water management.<br />
Population growth and rapid economic development have led<br />
to accelerated freshwater withdrawals.<br />
Trends in access to domestic water supply indicate substantial improvement<br />
in the past decade, putting most countries on track to achieve the<br />
water supply target of the Millennium Development Goals. However,<br />
sanitation is lagging well behind, and most sub-Saharan African countries<br />
and many rural areas still show unsatisfactory records for both<br />
water supply and sanitation.<br />
Steadily increasing demand for agricultural products to satisfy the<br />
needs of a growing population continues to be the main driver behind<br />
water use. While world population growth has slowed since the 1970s<br />
and is expected to continue its downward trend, steady economic development,<br />
in particular in emerging market economies, has translated<br />
into demand for a more varied diet, including meat and dairy products,<br />
putting additional pressure on water resources.<br />
After agriculture, the two major users of water for development are industry<br />
and energy (20% of total water withdrawals), which are transforming<br />
the patterns of water use in emerging market economies. Water and energy<br />
share the same drivers: demographic, economic, social and technological<br />
processes put pressure on both energy and water. The recent acceleration<br />
in the production of biofuels and the impacts of climate change bring new<br />
challenges and add to the pressures on land and water resources.<br />
Freshwater ecosystems provide an extensive array of vital services to<br />
support human well-being. A variety of economic and recreational<br />
activities such as navigation, fisheries and pastoral activities depend<br />
on direct use of water in healthy ecosystems. Yet some environmental<br />
services receive inadequate policy attention and are endangered by the<br />
way development sectors use water.<br />
The previous chapters have demonstrated<br />
the multiple benefits of water: its use as<br />
an economic backbone and an essential<br />
element for industrial and energy production<br />
systems, its use in human activities<br />
and its vital importance to the well-being<br />
of people and ecosystems. Water plays<br />
a strategic role for both on-stream uses<br />
(navigation, fisheries and freshwater ecosystems)<br />
and off-stream ones (productive<br />
sectors, human well-being and terrestrial<br />
ecosystems).<br />
96 World Water Development Report 3
Evolution of water use<br />
PART<br />
2<br />
While most of the old challenges of<br />
water supply, sanitation and environmental<br />
sustainability remain unsolved,<br />
new challenges – including adaptation to<br />
climate change, volatile food and energy<br />
prices and ageing infrastructure – are<br />
adding to the complexity and financial<br />
burden of water management.<br />
The 2003 and 2006 editions of the World<br />
Water Development Report detailed the<br />
multiple sectoral uses of water for human<br />
well-being and ecosystems. Over the last<br />
three years exhaustive reviews of selected<br />
issues have brought to light additional<br />
information on water supply and sanitation,<br />
1 agriculture 2 and the environment. 3<br />
This chapter summarizes some of the<br />
findings of these studies, focusing on the<br />
main challenges confronting the water<br />
community in the immediate and longterm<br />
future.<br />
Water use in the world<br />
Population growth and rapid economic<br />
development have accelerated freshwater<br />
withdrawals (see map 10.1 in chapter 10<br />
on mismatch in distribution of runoff and<br />
population). Our somewhat patchy knowledge<br />
of water use shows high variability<br />
of use globally, both within sectors and<br />
across users. Growing uncertainty regarding<br />
water resources – particularly linked<br />
to climate change (described in chapter 5)<br />
– is expected to exacerbate water scarcity<br />
trends.<br />
A challenge in managing water resources<br />
is our scattered knowledge of patterns of<br />
water use (box 7.1; see also chapter 13).<br />
Monitoring systems and modelling abilities<br />
require substantial improvement to<br />
measure progress in addressing challenges<br />
for water uses.<br />
Total global freshwater use is estimated at<br />
about 4,000 cubic kilometres (km 3 ) a year. 4<br />
Another 6,400 km 3 of rainwater is also<br />
used ‘directly’ in agriculture. Nature is the<br />
most important user of water. An estimated<br />
70,000 km 3 of water a year are evaporated<br />
from forest, natural (uncultivated)<br />
vegetation and wetlands. 5 Evaporation<br />
from human-made reservoirs is difficult to<br />
estimate but is considerable in arid areas<br />
and is estimated to be about 200 km 3 a<br />
year. For example, an estimated 10 km 3<br />
– about 12% of the total storage in Lake<br />
Nasser, upstream of the High Aswan Dam<br />
at the high storage level – are lost through<br />
evaporation each year. 6<br />
A challenge<br />
in managing<br />
water resources<br />
is our scattered<br />
knowledge<br />
of patterns of<br />
water use<br />
Box 7.1<br />
How much do we know about water uses?<br />
Our knowledge of water use is as poor as<br />
our knowledge of water resources – perhaps<br />
poorer. Information is largely incomplete –<br />
particularly for agriculture, the largest user –<br />
and is lacking altogether for some countries.<br />
Only limited disaggregated information<br />
exists, and even this shows deficiencies of<br />
validity and homogeneity and provides<br />
extremely poor information on trends.<br />
The quality of information systems varies<br />
with each country, but there are common<br />
difficulties:<br />
• Statistics on the magnitude of demand<br />
and withdrawal are often estimated<br />
rather than based on data that are<br />
measured or collected from censuses.<br />
The level of uncertainty varies, but is<br />
particularly high for agriculture.<br />
• Sectors of use are not defined homogeneously<br />
and are not well disaggregated.<br />
• Adequate historical datasets are rare,<br />
and the dates of available statistics are<br />
not always explicit.<br />
• Lack of agreed terminology leads to<br />
discrepancies in data compilation and<br />
analyses.<br />
As an example, the table below shows the<br />
extent of metering of agricultural water<br />
use and self-supplied industries in the six<br />
major French river basins. Only half the<br />
water used in agriculture is effectively<br />
metered by a volumetric device. That<br />
means that water withdrawal figures are a<br />
mix of measurements and estimates (when<br />
no metering is available).<br />
Uncertainty of statistics on water uses: importance of metering agriculture<br />
and industrial withdrawals in France<br />
(Percentage of water withdrawals that is metered unless otherwise indicated)<br />
Basin<br />
Use for agriculture<br />
or irrigation<br />
From<br />
surface<br />
water<br />
From<br />
groundwater<br />
Use for selfsupplied<br />
industries<br />
From<br />
surface<br />
water<br />
From<br />
groundwater<br />
Total use<br />
(cubic<br />
kilometres<br />
a year)<br />
Adour-Garonne 72 62 82 66 2.30<br />
Artois-Picardie 90 100 95 100 0.67<br />
Loire-Brittany 80 95 40 69 3.62<br />
Rhine-Meuse 0 0 90 81 5.05<br />
Rhone-Mediterranean 30 57 87 86 17.13<br />
Seine-Normandy 75 89 37 91 3.06<br />
Total 43 74 73 84 31.81<br />
Total volume (cubic<br />
kilometres a year) 3.39 1.38 2.72 1.48<br />
No metering Less than 45% of<br />
withdrawals metered<br />
Source: IFEN 2006, based on 2001 data from the basin agencies.<br />
Less than 75% of<br />
withdrawals metered<br />
Water in a changing world 97
PART<br />
2<br />
Chapter 7<br />
But we know only part of what humans use:<br />
only the volume of water used off‐stream<br />
(withdrawn) is generally measured (or estimated),<br />
and only a part of what is withdrawn<br />
is effectively consumed. Most of the<br />
flow is returned – usually at a lower quality<br />
– to the water systems, where it can be<br />
reused. Agriculture is by far the most significant<br />
consumer of water, particularly in dry<br />
areas where irrigation has been developed.<br />
The consumptive uses of freshwater from<br />
agriculture, industry and domestic sectors<br />
place the greatest pressures on natural<br />
systems (see table 10.5 in chapter 10), both<br />
in quantity (withdrawals) and quality<br />
(returns of lower quality; for definitions<br />
of key terms relating to water use, see box<br />
7.2). For this reason these are discussed in<br />
greater detail in the rest of chapter 7 (uses)<br />
and in chapter 8 (impacts).<br />
The many realities of water use<br />
Water use is uneven across countries. The 10<br />
largest water users (in volume) are India,<br />
China, the United States, Pakistan, Japan,<br />
Thailand, Indonesia, Bangladesh, Mexico<br />
and the Russian Federation (map 7.1).<br />
Total water use at the country level ranges<br />
from 646 km 3 a year (India) to less than<br />
Box 7.2<br />
Water withdrawal, demand and consumption<br />
Water use refers to water that is being put<br />
to beneficial use by humans. Detailed<br />
water accounting, however, requires more<br />
precise definition of terms.<br />
Water withdrawal is the gross amount of<br />
water extracted from any source in the<br />
natural environment for human purposes.<br />
Differentiating withdrawals by<br />
type of source is useful to understand<br />
the pressure put on different parts of the<br />
system.<br />
Water demand is the volume of water<br />
needed for a given activity. If supply is<br />
unconstrained, water demand is equal to<br />
water withdrawal.<br />
Water consumption or consumptive use refers<br />
to that part of water withdrawn that is<br />
Consumption by sector<br />
Uses<br />
evaporated, transpired, incorporated into<br />
products or crops, consumed by humans<br />
or livestock, or otherwise removed from<br />
the immediate water environment.<br />
Water consumption is high in agriculture,<br />
where water is consumed by evapotranspiration<br />
of crops, and typically low<br />
Consumption of water withdrawn (percent)<br />
Domestic (urban) 10-20<br />
Industry 5-10<br />
Energy (cooling) 1-2<br />
Agriculture (irrigation)<br />
Surface irrigation 50-60<br />
Localized irrigation 90<br />
in other sectors (domestic industries; see<br />
table). The return flow may be restored to<br />
the water system either as groundwater<br />
infiltrated through permeable soils or<br />
directly drained into rivers or other freshwater<br />
bodies.<br />
Source: Margat and Andréassian 2008.<br />
Map 7.1<br />
Water withdrawals highlight discrepancies between regions and between the largest<br />
and smallest consumers, around 2001<br />
EU/25<br />
479<br />
248<br />
169<br />
630<br />
646<br />
Cubic kilometres a year<br />
More than 100<br />
50-100<br />
10-50<br />
Less than 10<br />
Source: FAO-AQUASTAT.<br />
98 World Water Development Report 3
evolution of water use<br />
PART<br />
2<br />
30 million cubic metres (m 3 ) a year in some<br />
tropical African countries (Cape Verde and<br />
the Central African Republic). National<br />
averages may hide large discrepancies in<br />
water resources and withdrawals between<br />
and within countries. In large countries<br />
such as China and the United States water<br />
demands are concentrated in limited<br />
parts of the country, in general where<br />
agriculture needs to be irrigated or where<br />
economic development is occurring. In<br />
addition, long-term annual or multiannual<br />
averages mask large temporal differences.<br />
Water withdrawals per person is a better<br />
indicator of the impact of population on water.<br />
Water withdrawals per person range from<br />
20 m 3 a year in Uganda to more than<br />
5,000 m 3 in Turkmenistan, with a world<br />
average of 600 m 3 (map 7.2). Water withdrawals<br />
are highest in arid and semi-arid<br />
areas, where irrigation is most needed for<br />
agricultural production, and are lowest in<br />
tropical countries.<br />
Water use is uneven across sectors. Agriculture<br />
is by far the main user of water.<br />
Irrigated agriculture accounts for 70%<br />
of water withdrawals, which can rise to<br />
more than 80% in some regions (table<br />
7.1). Although increasing in urbanized<br />
economies, industrial (including energy)<br />
use accounts for only 20% of total water<br />
use and domestic use for about 10%. 7<br />
Water withdrawals for energy generation –<br />
hydropower and thermo-cooling – are on<br />
the rise, but energy is one of the economic<br />
sectors that consumes the least water and<br />
Map 7.2 Annual water withdrawals per person by country, world view, 2000<br />
Cubic metres a year<br />
Less than 100<br />
100-250<br />
250-500<br />
500-1,000<br />
More than 1,000<br />
No data<br />
Source: Based on FAO-AQUASTAT global maps (www.fao.org/nr/water/aquastat/globalmaps/index.stm).<br />
Table 7.1 Water resources and withdrawals, 2000<br />
(Cubic kilometres per year unless otherwise indicated)<br />
Region<br />
Renewable<br />
water<br />
resources<br />
Total<br />
water<br />
withdrawals<br />
Water withdrawals<br />
Agriculture Industry Domestic (urban)<br />
Amount Percent Amount Percent Amount Percent<br />
Withdrawals<br />
as percent of<br />
renewable<br />
resources<br />
Africa 3,936 217 186 86 9 4 22 10 5.5<br />
Asia 11,594 2,378 1,936 81 270 11 172 7 20.5<br />
Latin America 13,477 252 178 71 26 10 47 19 1.9<br />
Caribbean 93 13 9 69 1 8 3 23 14.0<br />
North America 6,253 525 203 39 252 48 70 13 8.4<br />
Oceania 1,703 26 18 73 3 12 5 19 1.5<br />
Europe 6,603 418 132 32 223 53 63 15 6.3<br />
World 43,659 3,829 2,663 70 784 20 382 10 8.8<br />
Source: Based on Comprehensive Assessment of Water Management in Agriculture 2007.<br />
Water in a changing world 99
PART<br />
2<br />
Chapter 7<br />
Around 20% of<br />
total water used<br />
globally is from<br />
groundwater<br />
sources (renewable<br />
or not), and this<br />
share is rising<br />
rapidly, particularly<br />
in dry areas<br />
it returns most of the water withdrawn<br />
back to the water system (about 95%). This<br />
is only a partial picture of sectoral usage as<br />
there are many unaccounted-for uses. Little<br />
is known about water use in informal<br />
urban settlements or informal irrigation<br />
systems, both of which are generally unaccounted<br />
for in official statistics.<br />
Finally, there are numerous on-stream uses<br />
(such as fishing, navigation and ecosystems),<br />
which although generally nonconsumptive,<br />
depend on a certain level of<br />
flows and water quality to function. Such<br />
uses cannot be measured in volume terms,<br />
and these uses are therefore not reflected<br />
in statistics on water use.<br />
From a water use perspective the world<br />
can be divided into two groups. In one<br />
group of countries (in Africa, most of Asia,<br />
Oceania, Latin America and the Caribbean)<br />
agriculture is by far the main water<br />
user, while in the other group (in Europe<br />
and North America) withdrawals are<br />
related mostly to industry and energy. The<br />
domestic supply is essential to life (drinking,<br />
hygiene and bathing) but remains the<br />
smallest water user for both groups.<br />
Most (99%) of the 4,000 km 3 a year in offstream<br />
water uses – irrigation, domestic,<br />
industry and energy – are met by withdrawals<br />
from renewable sources, either surface<br />
water or groundwater. Less than 1% (currently<br />
estimated at 30 km 3 a year) comes<br />
from non-renewable (fossil) aquifers mainly<br />
in three countries – Algeria, Libyan Arab<br />
Jamahiriya and Saudi Arabia – which are<br />
the main source of water in these countries.<br />
Around 20% of total water used globally<br />
is from groundwater sources (renewable<br />
or not), and this share is rising rapidly,<br />
particularly in dry areas. 8 This rise has been<br />
stimulated by the development of low-cost<br />
pumps and by individual investment for irrigation<br />
and urban uses. Private investment<br />
in self-supply of groundwater – essentially<br />
uncontrolled and unmonitored – has mushroomed<br />
in response to inadequate public<br />
services. As a result, groundwater withdrawals<br />
rose fivefold during the 20th century,<br />
leading to a rapid drawdown of aquifers in<br />
some areas, putting at risk the sustainability<br />
of the uses that rely on it (see chapter 8).<br />
In areas of scarce freshwater resources,<br />
brackish water and wastewater are often<br />
used to meet water demand. While accounting<br />
for less than 5% of global water<br />
use, the potential is substantially greater<br />
(figure 7.1; see also figure 9.3 and box 9.5<br />
in chapter 9).<br />
Figure 7.1 Sources of water use globally and for major sectors, 2000<br />
Withdrawals by supply source<br />
All uses<br />
Drinking water use<br />
Drainage water returns<br />
4.82%<br />
Groundwater<br />
(non-renewable)<br />
0.77%<br />
Wastewater reuse<br />
2.41%<br />
Desalination 0.34%<br />
Groundwater<br />
(non- renewable) 2.54%<br />
Desalination 3.55%<br />
Groundwater<br />
18.25%<br />
Surface water<br />
73.42%<br />
Groundwater<br />
45.69%<br />
Surface water<br />
48.22%<br />
Agriculture (irrigation)<br />
Energy and industry<br />
Drainage water returns<br />
7.24%<br />
Groundwater<br />
(non-renewable)<br />
0.72%<br />
Wastewater reuse<br />
3.62%<br />
Groundwater<br />
12.48%<br />
Groundwater<br />
(non-renewable)<br />
0.25%<br />
Groundwater<br />
17.37%<br />
Surface water<br />
71.06%<br />
Surface water<br />
87.26%<br />
Source: FAO-AQUASTAT.<br />
100 World Water Development Report 3
evolution of water use<br />
PART<br />
2<br />
Trends in water use<br />
Recent trends. With rapid population<br />
growth water withdrawals have tripled<br />
over the last 50 years. This trend is<br />
explained largely by the rapid increase<br />
in irrigation development stimulated by<br />
food demand in the 1970s and by the<br />
continued growth of agriculture-based<br />
economies. 9<br />
Emerging market economies (such as<br />
China, India and Turkey) still have an<br />
important rural population dependent on<br />
water supply for food production. They<br />
are also experiencing rapid growth in<br />
domestic and industrial demands linked<br />
to urbanization and related changes in<br />
lifestyle. There are hot spots in these countries<br />
where rural and urban demands are<br />
in competition. Urbanized and industrial<br />
economies (such as the European Union<br />
and the United States) import increasing<br />
amounts of food and manufactured products,<br />
while water use in industrial processes<br />
and urban environments has been<br />
declining, thanks to both technological<br />
changes in production processes and pollution<br />
mitigation efforts.<br />
Expected trends over the next 50 years. There<br />
is general agreement that population<br />
growth, economic growth, urbanization,<br />
technological change and changing<br />
consumption patterns are the main<br />
factors influencing water use (see chapter<br />
2). There is still substantial uncertainty,<br />
however, on the scale of future demands.<br />
Between 2000 and 2050 the world’s<br />
population is projected to grow from 6<br />
billion to 9 billion, and demand for food<br />
and other goods will increase significantly.<br />
Will water resources be adequate?<br />
How will the level of development affect<br />
demand? How will urbanization influence<br />
changes in diet and lifestyle? Where will<br />
demands be highest? How will societies<br />
address the competition among growing<br />
demands? These are difficult questions for<br />
water managers, who are planning water<br />
development works for future decades,<br />
particularly because of the rapid rate of<br />
global change and the many uncertainties<br />
that lie ahead.<br />
One of the biggest uncertainties is the effect<br />
of climate change on water resources,<br />
uses and users (see chapter 5), which calls<br />
for a complete revisiting of past scenarios<br />
(such as the World Water Vision scenarios<br />
of 2000, the Millennium Ecosystem scenarios<br />
of 2005, and the Comprehensive<br />
Assessment of Water Management in Agriculture<br />
of 2007 10 ) to explore hypotheses<br />
and options for action. 11 At the national<br />
level countries are already revising their<br />
long-term plans. The Mediterranean Action<br />
Plan is exploring possible futures for<br />
agriculture-based economies that are most<br />
vulnerable to anticipated climate change<br />
effects (figure 7.2). 12<br />
Water footprints. The concept of a water<br />
footprint helps show the extent and locations<br />
of water use in relation to consumption<br />
patterns (see chapter 2). The water<br />
footprint is defined as the total volume of<br />
water used in the production of the goods<br />
and services consumed by an individual<br />
or community or produced by a business.<br />
A country’s water footprint is the volume<br />
of water used in the production of all the<br />
goods and services consumed by inhabitants<br />
of the country. The United States has<br />
a water footprint of 2,480 m 3 per capita a<br />
year; China has a footprint of 700 m 3 per<br />
capita a year. The global water footprint is<br />
1,240 m 3 per capita a year. The four major<br />
factors determining a country’s water<br />
footprint are volume of consumption,<br />
consumption pattern (for example, high or<br />
low meat consumption), climate (growing<br />
conditions) and agricultural practices<br />
(water use efficiency).<br />
A country’s internal water footprint is the<br />
volume of water used from domestic water<br />
resources; its external footprint is the<br />
water used in other countries to produce<br />
the goods it imports (‘virtual water’, discussed<br />
in box 2.1 in chapter 2). Whether<br />
water consumed by rainfed agriculture<br />
should be accounted for in calculating<br />
water footprints is a subject of debate.<br />
The ratio of internal to external water<br />
Figure 7.2<br />
Cubic kilometres a year<br />
120<br />
100<br />
80<br />
60<br />
40<br />
20<br />
0<br />
Egypt<br />
Italy<br />
Turkey<br />
Spain<br />
France Syrian Morocco Tunisia<br />
Arab<br />
Republic<br />
With rapid<br />
population growth<br />
water withdrawals<br />
have tripled over<br />
the last 50 years<br />
Future water demands in Mediterranean<br />
region countries for 2025 in Blue Plan<br />
business as usual scenario (trend scenario)<br />
2000<br />
2025<br />
2050<br />
Israel<br />
Cyprus<br />
Note: Projections for 2025 are based on Blue Plan 2005 scenarios established on the basis<br />
of national planning documents. Projections for 2050 are based on the optimistic assumption<br />
that 2050 water demand per inhabitant is similar to that for 2025.<br />
Source: Based on Margat 2008.<br />
Water in a changing world 101
PART<br />
2<br />
Chapter 7<br />
externalizing the<br />
water footprint<br />
means increasing<br />
dependence on<br />
foreign water<br />
resources but<br />
also passing on<br />
environmental<br />
impacts<br />
footprints is relevant, because externalizing<br />
the water footprint means increasing<br />
dependence on foreign water resources but<br />
also passing on environmental impacts.<br />
With increasing globalization, it is no<br />
longer sufficient to examine water issues<br />
only in a national context. Local decisions<br />
on water use in agriculture and industry<br />
are increasingly driven by decisions outside<br />
the local water domain. For example, the<br />
water footprint of inhabitants of Europe<br />
and North America has been externalized<br />
to other parts of the world (map 7.3).<br />
Europe is a large importer of cotton, which<br />
is produced in many water-scarce areas<br />
(and elsewhere) though it is one of the<br />
thirstiest crops. Through the global market<br />
European and U.S. consumption relies on<br />
water resources available outside Europe’s<br />
boundaries, and thus European and North<br />
American consumers influence agricultural<br />
and industrial strategies elsewhere. About<br />
80% of virtual water flows relate to trade in<br />
agricultural products (see box 2.1 in chapter<br />
2). 13 Water-scarce countries such as Greece<br />
and Spain use large volumes of water to<br />
produce fruit and oil crops for export. The<br />
rationale for such uses will become increasingly<br />
questionable where climate change<br />
leads to reductions in water availability.<br />
Domestic water supply and<br />
sanitation<br />
While rapid progress has recently been<br />
made in water supply in all regions except<br />
sub-Saharan Africa, sanitation coverage<br />
still lags. To highlight the problem,<br />
the UN General Assembly declared 2008<br />
the International Year of Sanitation in<br />
response to the recommendations of the<br />
UN Secretary-General’s Advisory Board on<br />
Water and Sanitation. 14 The goal is to raise<br />
awareness and accelerate progress towards<br />
the target set for the Millennium Development<br />
Goal of reducing by half the proportion<br />
of people without access to basic<br />
sanitation between 1990 and 2015.<br />
Current state of water supply and<br />
sanitation<br />
In 2006, 54% of the world’s population<br />
had a piped connection to their dwelling,<br />
plot or yard, and 33% used other improved<br />
drinking water sources. The remaining<br />
13% (884 million people) relied on unimproved<br />
sources. Progress has been greatest<br />
in East Asia, with an increase in coverage<br />
of improved drinking water sources from<br />
68% in 1990 to 88% in 2006. 15<br />
Except for sub-Saharan Africa and Oceania,<br />
all regions are on track to meet the<br />
Millennium Development Goal drinking<br />
water target. But if current trends continue,<br />
2.4 billion people will still be without<br />
access to basic sanitation. 16 Coverage is<br />
much higher in urban than in rural areas<br />
for both water supply (figure 7.3) and sanitation<br />
(figure 7.4). Global and regional aggregates<br />
for water and sanitation coverage<br />
do not show the large differences between<br />
countries.<br />
Map 7.3 Average national water footprint per capita, 1997-2001<br />
Cubic metres a year<br />
per capita<br />
600-800<br />
800-1,000<br />
1,000-1,200<br />
1,200-1,300<br />
1,300-1,500<br />
1,500-1,800<br />
1,800-2,100<br />
2,100-2,500<br />
No data<br />
Source: Hoekstra and Chapagain 2008.<br />
102 World Water Development Report 3
evolution of water use<br />
PART<br />
2<br />
The forgotten challenge of small towns.<br />
Efforts to increase the number of people<br />
benefiting from improved water and<br />
sanitation services have focused on two<br />
areas: rural areas, where the favoured<br />
approach is community-based management<br />
of appropriate systems, and urban<br />
centres, where utilities (public or private)<br />
operate a range of services tailored to<br />
customer groups. The grey area between<br />
the two is small towns with populations<br />
of 2,000-50,000, where neither community<br />
management nor utility-based<br />
solutions are fully suitable. 17 Populations<br />
in these towns account for a large share of<br />
the overall population. Improving services<br />
will therefore require greater attention to<br />
management models, engineering designs,<br />
financing arrangements and professional<br />
support options that offer the demanded<br />
services and that can be expanded incrementally<br />
and sustained over the long<br />
term. Other aspects of success include<br />
financial and management autonomy,<br />
transparency and accountability, demand<br />
responsiveness, cost-effective design and<br />
operation, and professional capacity, as<br />
well as elements of competition and the<br />
ability to expand.<br />
Monitoring water supply and sanitation.<br />
Before 2000 coverage data came primarily<br />
from government water and sanitation<br />
agencies. There were no common definitions<br />
for access to safe water and basic<br />
sanitation, so data were not comparable.<br />
Since 2000 the Joint Monitoring Programme<br />
18 has reported on water supply<br />
and sanitation using population-based<br />
data gathered through household surveys<br />
and national censuses (box 7.3). Its<br />
assessments categorize water supply and<br />
sanitation technologies as ‘improved’ or<br />
‘unimproved’.<br />
The Joint Monitoring Programme defines<br />
‘access to drinking water’ as the availability<br />
of at least 20 litres of drinking water<br />
per person per day within 1 km of the<br />
dwelling (a 30 minute round-trip journey).<br />
In urban areas the distance to a source<br />
is usually not a problem, and in such<br />
densely populated areas a water-hauling<br />
trip of 30 minutes or less, including queuing<br />
time, is a more appropriate indicator<br />
of access. ‘Safe’ drinking water is water<br />
that meets accepted quality standards<br />
and poses no significant health risks. But<br />
determining the microbiological safety<br />
of drinking water in each household is<br />
impractical, and it is therefore assumed<br />
that water is safe if it comes from an<br />
‘improved’ source such as piped water,<br />
a protected well or spring, or rainwater.<br />
Figure 7.3<br />
Regional and global water supply coverage,<br />
by urban and rural areas, 1990 and 2006<br />
Urban<br />
Developed regions<br />
Commonwealth of<br />
Independent States<br />
Eastern Asia<br />
Latin America and<br />
Caribbean<br />
Northern Africa<br />
Oceania<br />
South-Eastern Asia<br />
Southern Asia<br />
Sub-Saharan Africa<br />
Western Asia<br />
World<br />
100 75 50 25 0 Percent<br />
Rural<br />
1990 2006<br />
0 25 50 75 100<br />
Note: For charting progress towards the Millennium Development Goals, the United<br />
Nations has classified countries into three regions: developed regions, countries in the<br />
Commonwealth of Independent States, and developing regions. The developing regions<br />
are further divided into subregions.<br />
Source: WHO and UNICEF 2008b.<br />
Figure 7.4<br />
Regional and global sanitation coverage, by<br />
urban and rural areas, 1990 and 2006<br />
Urban<br />
Developed regions<br />
Commonwealth of<br />
Independent States<br />
Eastern Asia<br />
Latin America and<br />
Caribbean<br />
Northern Africa<br />
Oceania<br />
South-Eastern Asia<br />
Southern Asia<br />
Sub-Saharan Africa<br />
Western Asia<br />
World<br />
100 75 50 25 0 Percent<br />
Rural<br />
1990 2006<br />
0 25 50 75 100<br />
Note: For charting progress towards the Millennium Development Goals, the United<br />
Nations has classified countries into three regions: developed regions, countries in the<br />
Commonwealth of Independent States, and developing regions. The developing regions<br />
are further divided into subregions.<br />
Source: WHO and UNICEF 2008b.<br />
Box 7.3<br />
Rapid assessment of drinking water quality<br />
The World Health Organization<br />
(WHO) and the United Nations Children’s<br />
Fund (UNICEF) have developed<br />
the Rapid Assessment of Drinking<br />
Water Quality (RADWQ) survey<br />
method, which they pilot-tested in<br />
China, Ethiopia, Jordan, Nicaragua,<br />
Nigeria and Tajikistan. It uses cluster<br />
sampling across a country to select<br />
individual drinking water sources for<br />
testing. The parameters to be tested<br />
depend on the extent of the survey<br />
and on local health hazards. The<br />
output is a snapshot of drinking water<br />
quality for each improved source<br />
tested.<br />
The study in Tajikistan involved 1,620<br />
samples in 53 clusters over a sixmonth<br />
period during 2004/05. The<br />
samples were taken from utility piped<br />
supplies and protected springs. Overall,<br />
87% of the sites complied with the<br />
WHO guideline value for microbiological<br />
quality and arsenic, fluoride and<br />
nitrate concentrations.<br />
Source: Aliev et al. 2006.<br />
Water in a changing world 103
PART<br />
2<br />
Chapter 7<br />
Despite strong<br />
epidemiological<br />
evidence that<br />
universal access<br />
to improved<br />
sanitation would<br />
dramatically reduce<br />
the global burden<br />
of diarrhoea,<br />
worm infections<br />
and malnutrition,<br />
sanitation receives<br />
substantially<br />
less priority and<br />
funding than water<br />
supply in virtually<br />
every country<br />
While the assumption that improved<br />
sources are also safe generally holds with<br />
respect to fæcal contamination, it has<br />
been challenged by the emerging problem<br />
of arsenic and fluoride contamination of<br />
drinking water.<br />
The Joint Monitoring Programme defines<br />
‘access to basic sanitation’ as the proportion<br />
of the population (total, urban and<br />
rural) with access to an improved sanitation<br />
facility for defecation. Improved<br />
means that human excreta are hygienically<br />
separated from human contact or<br />
the immediate environment, essential for<br />
preventing fæcal-oral disease transmission.<br />
Although the formulation of common<br />
definitions was a major step, controversies<br />
remain regarding the availability<br />
and quality of data sources. The global<br />
coverage of improved drinking water in<br />
urban areas is estimated at 95%, 19 but that<br />
figure seems difficult to reconcile with<br />
the reality of millions of people in slums<br />
in developing countries. These people<br />
might be connected to a piped water supply<br />
system and therefore benefit from an<br />
‘improved’ technology according to the<br />
Joint Monitoring Programme criteria. In<br />
reality, however, the piped water supply<br />
system might be poorly maintained,<br />
be inoperable many hours of the day or<br />
provide polluted water. This is the controversy<br />
of ‘served’ and ‘unserved’. Another<br />
problem is that many people remain<br />
unaccounted for in the data. Again, these<br />
are the poor people living in informal settlements<br />
that are not officially recognized<br />
by governments. As a result, millions of<br />
people are probably missing from the<br />
national statistics. 20<br />
Three key issues need to be addressed in<br />
monitoring programmes for water and<br />
sanitation services: access, quality and<br />
sustainability. A challenge is developing<br />
appropriate indicators that can be used in<br />
household surveys to collect information<br />
about disparities in access, affordability,<br />
per capita use and the sustainability and<br />
reliability of services. Also needed are<br />
simple and inexpensive water quality tests<br />
as a cross-check on the safety of improved<br />
drinking water sources and on safety at<br />
point of use.<br />
Monitoring has traditionally focused on<br />
the household, overlooking the fact that<br />
household members are outside the house<br />
for most of the day. Across developing<br />
countries there are 600 million children<br />
of primary school age, and roughly half<br />
attend schools that lack safe drinking<br />
water and sanitation. In two of the pilot<br />
countries for the UN-Water Global Annual<br />
Assessment of Sanitation and Drinking-<br />
Water (GLAAS): 2008 Pilot Report, average<br />
sanitation coverage is 26% in schools and<br />
75% in hospitals. 21 Sanitation in schools<br />
has indirect benefits as well as health<br />
benefits. In particular, separate facilities<br />
for boys and girls have been shown to<br />
stimulate girls’ school attendance and to<br />
lead to greater attention in class by all<br />
pupils.<br />
Putting sanitation in the spotlight. Despite<br />
strong epidemiological evidence that universal<br />
access to improved sanitation would<br />
dramatically reduce the global burden of<br />
diarrhoea, worm infections and malnutrition,<br />
sanitation receives substantially less<br />
priority and funding than water supply in<br />
virtually every country. 22<br />
Human Development Report 2006 analysed<br />
the sanitation problems facing the<br />
world and the reasons why sanitation<br />
lags behind water supply in attention and<br />
resources allocated. 23 The main barrier<br />
has been political reluctance. Sanitation<br />
is usually a low-priority item in national<br />
policy-making, planning, budgeting and<br />
implementation. As a result, it is often<br />
delegated to the lowest level of governance<br />
– struggling municipalities. There are,<br />
however, encouraging signs of change. In<br />
response to findings that in 2006, 62%<br />
of Africans lacked access to an improved<br />
sanitation, 24 32 African ministers signed<br />
the eThekwini Declaration in February<br />
2008 pledging to create separate budget<br />
lines for sanitation and hygiene and to<br />
commit at least 0.5% of GDP. 25<br />
Significantly, five countries along with<br />
private sector and voluntary sources have<br />
made contributions totalling $60 million<br />
to the Global Sanitation Fund launched<br />
in March 2008 by the Water Supply and<br />
Sanitation Collaborative Council and<br />
its partners – with an annual target of<br />
$100 million – to help meet the Millennium<br />
Development Goal sanitation target.<br />
Trends in water and sanitation<br />
provision<br />
Before the 1990s water industries were<br />
national monopolies in many countries.<br />
Since then, major water service reforms<br />
have taken place, mostly from centralized<br />
to decentralized public provision. 26 Asian<br />
countries, including Indonesia, Pakistan<br />
and the Philippines, undertook radical<br />
decentralization programmes. In many<br />
Latin American countries (for example,<br />
Argentina, Chile, Colombia, Panama and<br />
104 World Water Development Report 3
Peru) national monopolies were broken<br />
into hundreds of municipal providers as<br />
part of a wider process of devolution across<br />
all areas of government. Rapid decentralization<br />
after the political turnaround in<br />
Eastern Europe and Central Asia devolved<br />
responsibilities to lower tiers of government,<br />
but financial means and capacity<br />
remained mainly at the central level. In<br />
Africa the picture is mixed, with many<br />
countries remaining centralized while<br />
some (such as Ethiopia and Tanzania) are<br />
decentralizing rapidly.<br />
Decentralization was not a studied response<br />
to the specific problems of the<br />
water sector, but rather a by-product of<br />
wider state reforms. As a result, local<br />
governments often found themselves in<br />
charge of service delivery while lacking<br />
the capacity to fulfil this function. Private<br />
sector participation has proved difficult to<br />
implement. In larger urban centres this has<br />
been primarily for political reasons, while<br />
in smaller cities and rural areas economic<br />
viability is an additional problem. Thus,<br />
the real transition for most water consumers<br />
has not been from public to private,<br />
but rather from unregulated centralized<br />
public provision to regulated decentralized<br />
public provision. Today, most urban and<br />
peri-urban areas in the world are served by<br />
publicly owned and managed utilities, a<br />
model that is likely to continue. 27<br />
In many developing countries public utilities<br />
do not perform well because of low<br />
motivation, poor management, inadequate<br />
cost recovery and political interference.<br />
Public sector reform is one of the most<br />
important avenues for sustaining and<br />
increasing coverage and service. In addition,<br />
encouraging public sector utilities to<br />
extend services to informal urban settlements<br />
(in partnership with citizens groups<br />
or informal private sector operators) is a<br />
priority in cities where slum populations<br />
account for a large share of the urban<br />
population.<br />
Lessons from the sanitation sector call for<br />
a shift in thinking:<br />
• Technological solutions are available<br />
to satisfy almost any requirement<br />
within the sector, but technology<br />
interventions are very unlikely to<br />
succeed on an upscalable and sustainable<br />
basis without assessment of their<br />
relevance and full local social, political<br />
and economic ownership.<br />
• To succeed, technology interventions<br />
must incorporate carefully considered<br />
evolution of water use<br />
approaches (‘software’) as well as technologies<br />
(‘hardware’). Implicit is the<br />
realization that technologies should be<br />
demand-driven and that demand for<br />
certain technologies can be stimulated<br />
more effectively by using appropriate<br />
approaches – for example, through<br />
social marketing or the development<br />
of entrepreneurial local capacities.<br />
• Providing the technology is not<br />
enough. The health gains of universal<br />
access to basic sanitation accrue only<br />
if people use the sanitary facilities<br />
properly and practice proper hygiene.<br />
This means that hygiene promotion<br />
and social marketing are always needed<br />
along with technology provision. 28<br />
• Household decision-making is crucial.<br />
Because behaviour change is central to<br />
achieving health gains from sanitation,<br />
service providers need to focus<br />
on this level. This means that hygiene<br />
promotion is central to any sanitation<br />
strategy and that the technology<br />
should be appropriate. In simple<br />
terms, it is no good promoting a type<br />
of toilet that people will not use.<br />
• Change is needed across the entire<br />
community. While household behaviour<br />
is critical, individual households<br />
alone may not be able to influence<br />
health outcomes. For the majority of<br />
households in poor rural settings or<br />
overcrowded urban settlements, the<br />
actions of the community as a whole<br />
have great influence. Excreta need to<br />
be removed from the environment in<br />
which children play and adults labour.<br />
For this reason, interventions at the<br />
household level need to be coordinated<br />
across the community.<br />
• Public and private (personal, household)<br />
benefits of sanitation need to be<br />
in balance. The public nature of sanitation<br />
remains important (primarily<br />
environmental protection and public<br />
health). Despite calls to scale down all<br />
public provision, it is not feasible for<br />
households or local communities to<br />
take responsibility for wider societal<br />
concerns. Governments have to find<br />
pragmatic ways of balancing local and<br />
household needs with wider societal<br />
ones. Linking household service provision<br />
with community-level planning<br />
can be vital in creating local mechanisms<br />
to achieve this balance. 29<br />
We need to transform the way we look at<br />
wastewater, recognizing it as a resource<br />
PART<br />
2<br />
In many developing<br />
countries public<br />
utilities do not<br />
perform well<br />
because of low<br />
motivation, poor<br />
management,<br />
inadequate<br />
cost recovery<br />
and political<br />
interference<br />
Water in a changing world 105
PART<br />
2<br />
Chapter 7<br />
Steadily increasing<br />
demand for<br />
agricultural<br />
products to<br />
satisfy the needs<br />
of a growing<br />
population is<br />
the main driver<br />
behind agricultural<br />
water use<br />
rather than a problem, and manage it accordingly.<br />
Its various possible uses, such as<br />
farming, aquaculture, gardening and forest<br />
planting, need to be planned, and risk<br />
mitigation measures put in place to avoid<br />
the health costs (see chapter 8).<br />
While technically and financially appropriate<br />
sanitation services are available,<br />
little is known about community perceptions,<br />
demand and acceptability of different<br />
sanitation solutions. There are many<br />
taboos surrounding defecation behaviour,<br />
making it difficult to study. Sanitation<br />
services, far more than water supply, must<br />
be adapted to the local situation to ensure<br />
that they are used by men, women and<br />
children. Sociocultural factors are fundamental<br />
to sustainability. Women need to<br />
be consulted when toilets are built and<br />
must be allowed to manage their sanitation<br />
facilities.<br />
An example of the shift from supplyled<br />
to demand-driven approaches is the<br />
community-led total sanitation campaign<br />
in South Asia, which seeks to end open<br />
defecation by highlighting the problems<br />
caused to everyone in the community. It<br />
also ensures that every household either<br />
builds and uses its own low-cost toilet or<br />
has access to a shared toilet. In Bangladesh<br />
the total sanitation campaign was begun<br />
by local non-governmental organizations<br />
and has since been scaled up into a national<br />
programme, and in India the Sulabh<br />
Sanitation Movement has successfully<br />
scaled up a non-governmental organization<br />
model, 30 but elsewhere it has proved<br />
difficult for governments to scale up<br />
similar successes. The 2008 pilot survey of<br />
the UN-Water Global Annual Assessment<br />
of Sanitation and Drinking-Water (GLAAS)<br />
suggests that there is a need to reinforce<br />
education programmes with actions that<br />
provide better hygiene and sanitation in<br />
schools and hospitals. 31<br />
Water use in agriculture<br />
Steadily increasing demand for agricultural<br />
products to satisfy the needs of a<br />
growing population is the main driver<br />
behind agricultural water use. Although<br />
population growth has slowed since the<br />
1970s, economic development, in particular<br />
in emerging market economies, is<br />
translating into demand for a more varied,<br />
water-intensive diet, including meat and<br />
dairy products (see chapter 2 and box 7.4).<br />
To meet these future food needs, pressure<br />
to develop new supply sources or increase<br />
water allocation to agriculture will continue.<br />
This challenge was highlighted in<br />
the first two United Nations World Water<br />
Development Reports, and its implication<br />
for an emphasis on water for agriculture<br />
was clearly drawn by the International<br />
Water Management Institute 32 and the<br />
World Bank. 33 Climate change and the<br />
recent acceleration in biofuel production<br />
bring new challenges to agriculture and<br />
put further pressure on land and water<br />
resources. In a tighter global food market,<br />
where an increasing number of major<br />
agricultural systems are reaching the<br />
limits of their productive capacity, climate<br />
events increasingly influence food prices,<br />
with devastating social and humanitarian<br />
consequences.<br />
Why is so much water needed for<br />
food production?<br />
Agriculture accounts for 70% of freshwater<br />
withdrawals from rivers, lakes and<br />
aquifers – up to more than 90% in some<br />
developing countries. Furthermore, unlike<br />
in industrial and domestic uses, where<br />
most of the water returns to rivers after<br />
use, in agriculture a large part of water is<br />
consumed by evapotranspiration. Many<br />
irrigation systems, however, return a large<br />
amount of water to the system after use.<br />
Biomass cannot be produced without<br />
water. The source of all food is photosynthesis,<br />
a process by which plants transform<br />
energy captured from the sun, carbon dioxide<br />
from the air and minerals from the<br />
ground into biomass. Water, stored in the<br />
soil, is pumped by the roots and transpired<br />
into the atmosphere through the leaves.<br />
Transpiration cools the leaves and enables<br />
mass flows of mineral nutrients and water<br />
from roots.<br />
Biomass is processed through the food<br />
chain, which describes the flow of energy<br />
and feeding relationship between species:<br />
from primary producers (plants) to herbivores<br />
to carnivores. Despite substantial<br />
progress in agricultural research, energy<br />
flow efficiency in the food chain remains<br />
extremely low: about 10% for herbivores<br />
and 20% for carnivores. About 10 kilocalories<br />
(kcal) of grass are needed to produce<br />
1 kcal of beef (box 7.4).<br />
Rainfed agriculture covers 80% of the<br />
world’s cultivated land, and is responsible<br />
for about 60% of crop production.<br />
In rainfed agriculture the soil stores the<br />
rain and releases it slowly to the plants.<br />
Rainwater used in agriculture, part of what<br />
is called ‘green water’, is a characteristic<br />
of the land on which it falls and is not<br />
usually subject to competition from other<br />
sectors.<br />
106 World Water Development Report 3
evolution of water use<br />
PART<br />
2<br />
Box 7.4<br />
How much water is needed to produce food for a single day?<br />
We can estimate how much water is<br />
needed to sustain our diets by calculating<br />
the water lost in evapotranspiration based<br />
on crop physiology. Depending on local<br />
climate, varieties and agronomical practices,<br />
it takes 400-2,000 litres of evapotranspiration<br />
daily to produce 1 kilogram<br />
(kg) of wheat, and 1,000-20,000 litres per<br />
kilogram of meat, depending on the type<br />
of animal, feed and management practices.<br />
Based on these values, researchers<br />
have estimated daily water requirements<br />
to support diets, ranging from 2,000 to<br />
5,000 litres of water per person per day.<br />
The Food and Agriculture Organization of<br />
the United Nations uses 2,800 kilocalories<br />
(kcal) per person at the national level as<br />
a threshold for food security. As a rule<br />
of thumb, it can therefore be estimated<br />
that 1 litre of water is needed to produce<br />
1 kcal of food. Because of the low energy<br />
efficiency of the food chain, protein-rich<br />
diets require substantially more water than<br />
vegetarian diets.<br />
Value produced from a unit of water for selected commodities<br />
Product<br />
Cereal<br />
Kilograms per<br />
cubic metre<br />
Dollars per<br />
cubic metre<br />
Water productivity<br />
Protein grams<br />
per cubic metre<br />
Kilocalories per<br />
cubic metre<br />
Wheat ($0.2 per kilogram) 0.2-1.2 0.04-0.24 50-150 660-4,000<br />
Rice ($0.31 per kilogram) 0.15-1.6 0.05-0.18 12-50 500-2,000<br />
Maize ($0.11 per kilogram) 0.30-2.00 0.03-0.22 30-200 1,000-7,000<br />
Legumes<br />
Lentils ($0.3 per kilogram) 0.3-1.0 0.09-0.30 90-150 1,060-3,500<br />
Fava beans ($0.3 per kilogram) 0.3-0.8 0.09-0.24 100-150 1,260-3,360<br />
Groundnut ($0.8 per kilogram) 0.1-0.4 0.08-0.32 30-120 800-3,200<br />
Vegetables<br />
Potatoes ($0.1 per kilogram) 3-7 0.3-0.7 50-120 3,000-7,000<br />
Tomatoes ($0.15 per kilogram) 5-20 0.75-3.0 50-200 1,000-4,000<br />
Onions ($0.1 per kilogram) 3-10 0.3-1.0 20-67 1,200-4,000<br />
Fruits<br />
Apples ($0.8 per kilogram) 1.0-5.0 0.8-4.0 Negligible 520-2,600<br />
Olives ($1.0 per kilogram) 1.0-3.0 1.0-3.0 10-30 1,150-3,450<br />
Dates ($2.0 per kilogram) 0.4-0.8 0.8-1.6 8-16 1,120-2,240<br />
Others<br />
Beef ($3.0 per kilogram) 0.03-0.1 0.09-0.3 10-30 60-210<br />
Fish (aquaculture a ) 0.05-1.0 0.07-1.35 17-340 85-1,750<br />
a. Includes extensive systems without additional nutritional inputs to superintensive systems.<br />
Source: Based on Comprehensive Assessment of Water Management in Agriculture 2007.<br />
In irrigation, by contrast, water is extracted<br />
from rivers, lakes and aquifers (also<br />
called ‘blue water’) and applied on land,<br />
where most of it is consumed by evapotranspiration.<br />
Irrigation thus competes<br />
with other sectors (including the environment)<br />
for blue water. The importance of<br />
irrigated and rainfed agriculture varies<br />
across regions (map 7.4), for the most part<br />
following climate patterns. While the<br />
contribution of irrigation to total crop<br />
production is modest (about 10%-20%), it<br />
allows crop growth in many permanently<br />
water-scarce or temporarily water-stressed<br />
environments.<br />
More efficient use of water – higher socioeconomic<br />
returns and more crops per<br />
drop – can be obtained primarily through<br />
intensification (improved crop varieties<br />
plus better agronomic practices). Over<br />
the last 40 years major food yields have<br />
increased progressively and crop water<br />
productivity has doubled. However, yields<br />
in rainfed agriculture are still far from<br />
their potential (figure 7.5). Opportunities<br />
therefore exist to contain future increases<br />
in water use in agriculture by reducing the<br />
yield gap. In 2005 cereal yields were about<br />
1-1.5 tonnes per hectare in sub-Saharan<br />
Africa, compared with 5 tonnes per hectare<br />
in Europe. 34 However, where land or<br />
water constrain future development, the<br />
yield gap is closing rapidly, leaving little<br />
prospect for easy improvement. China and<br />
Egypt, for instance, are close to realizing<br />
their maximum potential for major food<br />
crops.<br />
Trends and current situation of<br />
water use in agriculture<br />
The last 50 years have seen rapid acceleration<br />
in water resources development for<br />
agriculture. 35 Development in hydraulic<br />
infrastructure (dams and large-scale public<br />
surface irrigation), as well as private and<br />
Water in a changing world 107
PART<br />
2<br />
Chapter 7<br />
Map 7.4<br />
Relative importance of rainfed and irrigated agriculture<br />
Irrigated<br />
650<br />
220<br />
780<br />
Rainfed<br />
Global total:<br />
7,130 cubic kilometres<br />
(80% rainfed, 20% irrigated)<br />
905<br />
235<br />
1,080 1,480<br />
1,670<br />
More than half of production from rainfed areas<br />
More than 75% of production from rainfed areas<br />
More than half of production from irrigated areas<br />
More than 75% of production from irrigated areas<br />
110<br />
Source: Based on Comprehensive Assessment of Water Management in Agriculture 2007.<br />
Figure 7.5<br />
Actual yields as percent of obtainable yields in selected countries, 2005<br />
100<br />
80<br />
60<br />
40<br />
20<br />
0<br />
Gaps are large between farmer’s actual yields<br />
and achievable yields for major rainfed cereal<br />
crops<br />
Viet Nam<br />
Thailand<br />
India<br />
Ethiopia<br />
Zambia<br />
Syria<br />
Kenya<br />
Bostwana<br />
Niger<br />
Morocco<br />
Burkina Faso<br />
Tanzania<br />
Uganda<br />
Zimbabwe<br />
Jordan<br />
Iran<br />
Iraq<br />
Pakistan<br />
Yemen<br />
Source: Based on Comprehensive Assessment of Water Management in Agriculture 2007.<br />
community schemes (particularly groundwater<br />
pumping; see chapter 8), have put<br />
water at the service of populations as part<br />
of the global effort to rapidly increase staple<br />
food production, ensure food self‐sufficiency<br />
and avoid famines. As the global<br />
population grew from 2.5 billion in 1950 to<br />
6.5 billion at the beginning of the 21st century,<br />
food production growth outstripped<br />
population growth, 36 irrigated area doubled<br />
(particularly in Asia), and water withdrawals<br />
tripled. Today, irrigated agriculture<br />
covers 275 million hectares – about 20% of<br />
cultivated land – and accounts for 40% of<br />
global food production (map 7.5).<br />
This success in agricultural production led<br />
to a 30-year decline in food prices in most<br />
countries (figure 7.6), a trend that lasted<br />
until very recently. In real terms, food<br />
prices declined, until recently, to their<br />
lowest levels in history, so that consumers<br />
in many countries could eat better while<br />
spending less of their budget on food.<br />
Today, food supply accounts for a very<br />
small part of household income in rich<br />
countries, but it can constitute as much as<br />
80% of income of poor people in developing<br />
countries.<br />
Declining food prices, high agricultural<br />
productivity, improved trade and markets<br />
and progressive reduction in the risk of<br />
food shortage and famines also led to reduced<br />
investment in agriculture, particularly<br />
in irrigation, resulting in neglect of<br />
maintenance of public irrigation schemes<br />
and a sharp slowdown in the growth of<br />
irrigated agriculture.<br />
Future water demand in agriculture<br />
As population continues to grow and<br />
demand for food intensifies, pressure<br />
on water from agricultural activities are<br />
expected to increase, although at a slower<br />
pace. Agriculture is also facing competition<br />
for water from other sectors, and its<br />
allocation is decreasing in water-scarce<br />
areas, especially around urban centres.<br />
Growth in world demand for food will<br />
mirror population growth, progressively<br />
declining from 2.2% a year in the last<br />
decades of the 20th century, to 1.6%<br />
in 2015, 1.4% in 2015-30, and 0.9% in<br />
2030-50. 37 However, these global figures<br />
hide extremely large variations, with<br />
developing countries growing faster than<br />
108 World Water Development Report 3
evolution of water use<br />
PART<br />
2<br />
Map 7.5 Percentage of cultivated areas equipped for irrigation, around 2003<br />
Less than 1<br />
1-5<br />
5-10<br />
10-50<br />
More than 50<br />
No data<br />
Source: FAO-AQUASTAT.<br />
developed countries. Niger, the country<br />
with the highest population growth rate,<br />
is expected to grow from 10.7 million in<br />
2000 to 53 million in 2050. Countries<br />
with high population growth rates and<br />
limited agricultural resources will likely<br />
see their food deficit increase, with serious<br />
implications for economic and food<br />
security.<br />
The increasing number of areas where<br />
water has become a limiting factor for<br />
irrigated agriculture, associated with<br />
rising claims for releasing water to guarantee<br />
or restore environmental services,<br />
has tightened food production in some<br />
regions. The Middle East, for example, can<br />
no longer satisfy its food requirements and<br />
relies increasingly on food imports.<br />
Part of the current pressure on water resources<br />
comes from increasing demands<br />
for animal feed (figure 7.7). Meat production<br />
requires 8-10 times more water than<br />
cereal production. With the increase<br />
in consumption of dairy products and<br />
meat, the production of feed grains has<br />
expanded rapidly, at the expense of other<br />
crops. With rising living standards and<br />
urbanization, consumption of meat and<br />
dairy products will continue to rise (it<br />
has more than tripled in China over past<br />
decades).<br />
The latest projections available show an<br />
average increase of 0.6% a year in irrigated<br />
land from 1998 until 2030, compared<br />
with 1.5% over the 1950s-1990s. In the<br />
same period (1998-2030), because of continued<br />
increases in agricultural productivity,<br />
36% more food will be produced<br />
Figure 7.6<br />
Irrigation (millions of hectares)<br />
Food price index (1990 = 100)<br />
300<br />
250<br />
200<br />
150<br />
100<br />
50<br />
0<br />
1960<br />
Annual growth rate<br />
of irrigation (by decade)<br />
1961-1970: 2.1%<br />
1965<br />
As irrigation area expanded, food price fell<br />
for 30 years before starting to rise again<br />
1970<br />
1971-1980: 2.2%<br />
1975<br />
1980<br />
1981-1990: 1.6%<br />
1985<br />
Food price index<br />
1990<br />
1991-2000: 1.2%<br />
1995<br />
Irrigation<br />
2000<br />
2000–03: 0.1%<br />
Source: Based on Comprehensive Assessment of Water Management in Agriculture 2007;<br />
FAO FAOSTAT.<br />
Figure 7.7<br />
Kilograms per person per year<br />
600<br />
500<br />
400<br />
300<br />
200<br />
100<br />
Food<br />
Feed<br />
Other<br />
Feed demand drives future demand for grains<br />
2008<br />
0<br />
1975 2000 2025 2050 1975 2000 2025 2050 1975 2000 2025 2050 1975 2000 2025 2050<br />
World Sub-Saharan Africa East Asia OECD countries<br />
Source: Based on Comprehensive Assessment of Water Management in Agriculture 2007.<br />
Water in a changing world 109
PART<br />
2<br />
Chapter 7<br />
Recent increases<br />
in the prices of the<br />
main agricultural<br />
commodities have<br />
caused the number<br />
of people suffering<br />
from hunger to rise<br />
from 850 million<br />
to 963 million<br />
with 13% more water. 38 Crop and animal<br />
breeding and biotechnology have already<br />
resulted in tremendous gains in yields,<br />
along with savings in production costs<br />
and pesticide use through improved resistance<br />
of genetically modified crops. Common<br />
grains such as wheat, maize and rice,<br />
which achieved significant gains from the<br />
1960s to 1980s, are unlikely to see further<br />
gains.<br />
The implications of food prices for<br />
food security<br />
The old challenge of increasing and securing<br />
food supply remains a priority in<br />
many countries as the number of people<br />
suffering from hunger remains desperately<br />
high, most of them in rural areas<br />
of South Asia and sub-Saharan Africa. 39<br />
Recent increases in the prices of the main<br />
agricultural commodities have caused the<br />
number of people suffering from hunger<br />
to rise from 850 million to 963 million.<br />
Between September 2007 and March 2008<br />
the price of wheat, corn, rice and other<br />
cereals rose an average of 41% on the<br />
international market. While the increase<br />
in food commodity prices started in 2000,<br />
previous price increases have never been<br />
this rapid. The rising demand for highvalue<br />
commodities has also resulted in<br />
surging prices for meat and dairy products.<br />
From the beginning of 2000 to the middle<br />
of 2008, butter and milk prices tripled,<br />
and poultry prices have almost doubled.<br />
The rapid surge in the prices of the main<br />
food and feed commodities in 2007 and<br />
2008 arose from a combination of causes,<br />
including long-term increases in demand<br />
for meat and dairy products in emerging<br />
market economies, a progressive reduction<br />
in the stocks of the main commodities<br />
and unfavourable climate in some of the<br />
largest exporting countries. The effects of<br />
these factors have likely been amplified<br />
by incentives for bioenergy production in<br />
OECD countries and speculation on food<br />
trade. 40 Prices have fallen since mid-2008<br />
thanks to good prospects for world food<br />
production, the overall slowdown of the<br />
world economy and reductions in the<br />
price of oil. Future trends in food prices<br />
remain uncertain. The Food and Agriculture<br />
Organization of the United Nations<br />
(FAO) estimates that in the medium term<br />
tight markets and higher costs of production<br />
inputs will keep prices higher and<br />
more volatile than in the past. 41 This<br />
situation will hurt both producers and<br />
consumers. In addition, domestic prices<br />
of food in developing countries have not<br />
followed downward trends from the international<br />
market, and the prices of major<br />
staple commodities remain high in many<br />
places.<br />
The effects of price increases on consumption<br />
vary by country and consumer group.<br />
Consumers in low-income countries are<br />
much more responsive and vulnerable<br />
to price changes than are consumers in<br />
high-income countries, because food expenditure<br />
can represent 50%-75% of their<br />
income. 42 Surges in food prices thus hurt<br />
the poorest populations the most. Should<br />
food prices remain high, investment in<br />
agriculture, including water development<br />
for irrigation, is likely to grow. Higher food<br />
prices may represent an opportunity for<br />
smallholder farmers if the right policies<br />
are adopted. 43<br />
How will bioenergy affect<br />
agricultural water use?<br />
Bioenergy is energy derived from biological<br />
origins, such as grains, sugar crops, oil<br />
crops, starch, cellulose (grasses and trees)<br />
and organic waste. Liquid biofuel (bioethanol<br />
and biodiesel), while representing<br />
only a small percentage of all bioenergy<br />
products, currently dominates the debate<br />
because of its capacity to substitute for<br />
fossil fuel and because most of its source<br />
feedstock can also be used to produce food<br />
(see chapter 3). 44<br />
Current and projected trends in bioenergy.<br />
Around 10% of the total energy supply<br />
comes from biomass, and most of that<br />
(80%) comes from the ‘traditional’ biomass<br />
sources of wood, dung and crop residues.<br />
These represent a significant part of the<br />
energy used in many developing countries.<br />
Of commercial or ‘modern’ bioenergy,<br />
two-thirds is produced from fresh<br />
vegetable material and organic residue<br />
used to produce electricity and heat. About<br />
5% of biomass is used to produce liquid<br />
biofuel for transport, which currently<br />
accounts for less than 2% of transport<br />
energy worldwide.<br />
The quest for greater energy autonomy,<br />
the rise in oil prices until the second half<br />
of 2008 and concerns about the impacts<br />
of greenhouse gas emissions in OECD<br />
countries are behind a recent surge in<br />
transport bioenergy. 45 The production of<br />
bioethanol, from sugarcane, corn, sugar<br />
beet, wheat and sorghum, tripled between<br />
2000 and 2007 to an estimated 77 billion<br />
litres in 2008. 46 Brazil (using sugarcane)<br />
and the United States (using mostly maize)<br />
are the main producers, accounting for<br />
77% of global supply. Biodiesel production,<br />
derived from oil- or tree-seeds such<br />
as rapeseed, sunflower, soybean, palm oil,<br />
110 World Water Development Report 3
evolution of water use<br />
PART<br />
2<br />
coconut or jatropha, increased 11-fold between<br />
2000 and 2007, with 67% produced<br />
in the European Union.<br />
In 2007 approximately 23% of maize<br />
production in the United States was used<br />
to produce ethanol, as was about 54%<br />
of Brazil’s sugarcane crop. In the European<br />
Union about 47% of vegetable oil<br />
produced was used in the production of<br />
biodiesel, necessitating higher imports of<br />
vegetable oil to meet domestic consumption<br />
needs. In energy equivalence the<br />
2008 ethanol share of the gasoline transport<br />
fuel market in these economies was<br />
estimated at 4.5% for the United States,<br />
40.0% for Brazil and 2.2% for the European<br />
Union. The biodiesel share of the diesel<br />
transport fuel market was estimated at<br />
0.5% for the United States, 1.1% for Brazil<br />
and 3.0% for the European Union. 47<br />
The international policy environment,<br />
national policy support and oil prices will<br />
strongly influence future demand for biofuel.<br />
Global ethanol production is projected<br />
to increase rapidly to 127 billion litres<br />
in 2017, with production concentrated in<br />
the United States, Brazil and, to a lesser<br />
extent, the European Union and China.<br />
Global biodiesel production is expected to<br />
reach 24 billion litres in 2017. 48<br />
The global potential of conventional<br />
biofuel is limited by the availability of<br />
suitable land and water for crops and the<br />
high cost of most conventional technologies.<br />
Technically, up to 20 exajoules from<br />
conventional ethanol and biodiesel, meeting<br />
11% of total demand for liquid fuels<br />
in the transport sector, could be possible<br />
by 2050. 49 Energy yield is highest for<br />
feedstock grown in tropical conditions, in<br />
particular, sugarcane and palm oil.<br />
Implication of increased crop demands for<br />
land, water and the environment. The potential<br />
impact of biofuel production on<br />
land and water resources varies with local<br />
agroclimatic conditions and policies. The<br />
potential impact on freshwater resources<br />
is greatest where agricultural production<br />
depends on irrigation and is practically<br />
negligible where rainfed production is<br />
practiced. Where agriculture requires irrigation,<br />
increased production of biofuel<br />
could result in reduced water allocation to<br />
other crop commodities.<br />
Globally, irrigation water allocated to biofuel<br />
production is estimated at 44 km 3 , or<br />
2% of all irrigation water. 50 Under current<br />
production conditions it takes an average<br />
of roughly 2,500 litres of water (about<br />
820 litres of it irrigation water) to produce<br />
1 litre of liquid biofuel (the same amount<br />
needed on average to produce food for one<br />
person for one day). But regional variations<br />
can be substantial, depending primarily<br />
on the relative percentage of irrigation in<br />
biofuel crop production. The share of irrigation<br />
water used for biofuel production<br />
is negligible in Brazil and the European<br />
Union and is estimated to be 2% in China<br />
and 3% in the United States. 51 In India,<br />
where sugarcane is fully irrigated, nearly<br />
3,500 litres of water are withdrawn for each<br />
litre of ethanol produced. The markets<br />
for biofuel and agricultural products are<br />
strongly meshed. Because of crop substitutability,<br />
all crops tend to compete for the<br />
same inputs, land, fertilizers and irrigation<br />
water, and farmers select crops that offer<br />
the best return on their investment. 52<br />
Implementing all current national biofuel<br />
policies and plans would take 30 million<br />
hectares of cropland and 180 km 3 of additional<br />
irrigation water. Although globally<br />
less than a few percentage points of total<br />
area and water use, the impacts could<br />
be large for some countries, including<br />
China and India, and for some regions of<br />
large countries, such as the United States.<br />
There could also be significant implications<br />
for water resources, with possible<br />
feedback into global grain markets. The<br />
volume of water and area of land used for<br />
biofuel production depend on the crop<br />
and the agricultural system (table 7.2).<br />
Private investors are showing increasing<br />
interest in land and irrigated schemes in<br />
Africa for agricultural products for biofuel<br />
production.<br />
According to the OECD, growth of the<br />
bioenergy industry is likely to place additional<br />
pressure on the environment and<br />
biodiversity. 53 The potential of bioenergy<br />
to mitigate climate change is complex<br />
and varies by type of crop and farming<br />
system. Among current technologies<br />
only ethanol produced from sugarcane in<br />
Brazil, ethanol produced as a by-product<br />
of cellulose production (as in Sweden<br />
and Switzerland) and biodiesel produced<br />
from animal fats and used cooking oil can<br />
substantially reduce greenhouse gas emissions<br />
compared with gasoline and mineral<br />
diesel. The study concludes that all other<br />
conventional bioenergy technologies<br />
typically deliver greenhouse gas emissions<br />
reductions of less than 40% compared<br />
with their fossil fuel alternatives. When<br />
impacts such as soil acidification, fertilizer<br />
use, biodiversity loss and the toxicity of<br />
agricultural pesticides are taken into account,<br />
the adverse environmental impacts<br />
The international<br />
policy environment,<br />
national policy<br />
support and oil<br />
prices will strongly<br />
influence future<br />
demand for biofuel<br />
Water in a changing world 111
PART<br />
2<br />
Chapter 7<br />
Table 7.2<br />
Different types of biofuel and quantity of water needed to produce them in rainfed or<br />
irrigated conditions<br />
Crop<br />
Fuel product (energy density:<br />
biodiesel 35 megajoules<br />
per litre; ethanol 20<br />
megajoules per litre)<br />
Annual<br />
obtainable<br />
yield (litres<br />
per hectare)<br />
Rainfed or<br />
irrigated<br />
Evapotranspiration<br />
(litres per litre<br />
of fuel)<br />
Irrigation water<br />
withdrawn (litres<br />
per litre of fuel)<br />
Sugarcane Ethanol (from sugar) 6,000 Irrigated 2,000 1,000<br />
Sugar beet Ethanol (from sugar) 7,000 Irrigated 786 571<br />
Cassava Ethanol (from starch) 4,000 Rainfed 2,250 na<br />
Maize Ethanol (from starch) 3,500 Irrigated 1,360 857<br />
Oil palm Biodiesel 5,500 Rainfed 2,360 na<br />
Rapeseed/<br />
mustardseed Biodiesel 1,200 Rainfed 3,330 na<br />
Soybean Biodiesel 400 Rainfed 10,000 na<br />
na is not applicable.<br />
Note: Values are indicative only.<br />
Source: Hoogeveen, Faurès, and van de Giesse forthcoming, adapted from Müller et al. 2008.<br />
Box 7.5<br />
Arid and semi-arid conditions and<br />
widespread water scarcity prevail in<br />
the Near East Region. Agricultural<br />
production is projected to grow more<br />
than 60% between 2003/05 and 2030<br />
and to more than double by 2050 as a<br />
result of increased food demand. Most<br />
of the increase will come from yield increases<br />
and higher cropping intensities.<br />
Irrigation is crucial, with about 80% of<br />
production originating from irrigated<br />
agriculture and with irrigated land<br />
accounting for about a third of arable<br />
land. Irrigation water withdrawals<br />
could increase 29% by 2050. Under<br />
pressures of water scarcity water use<br />
efficiency is expected to improve from<br />
52% in 2003/05 to 66% by 2050, as<br />
irrigation water requirements grow<br />
from 64% to 83% of renewable water<br />
resources – all very high values compared<br />
with global averages.<br />
The situation may become critical<br />
if the expected impacts of climate<br />
of ethanol and biodiesel can exceed those<br />
of petrol and mineral diesel. An exception<br />
was biofuel produced from woody biomass,<br />
which rated better than gasoline. A<br />
key question is how to ensure that production<br />
will be sustainable. One answer being<br />
explored is certification of conformity to a<br />
set of environmental and social standards<br />
on a life-cycle basis. 54<br />
More uncertainty for agriculture<br />
under climate change<br />
The issues of agricultural production<br />
are complicated by increasing climate<br />
Coping with water scarcity and climate<br />
change in agriculture in the Near East<br />
change are considered, including the<br />
combined effect of changes in precipitation<br />
and evapotranspiration. These<br />
changes will alter current patterns of<br />
soil moisture deficits, groundwater<br />
recharge and runoff. Second-order<br />
impacts on streamflow, groundwater<br />
and lake and dam storage levels will<br />
translate into reduced availability of<br />
water for irrigation and other purposes.<br />
Under the Intergovernmental Panel<br />
and Climate Change B2 scenario the<br />
overall availability of renewable water<br />
resources may fall from 416 km 3 in<br />
the base situation to 397 km 3 in 2050,<br />
while irrigation water withdrawals<br />
would need to raise an additional 20<br />
km 3 . Total water withdrawals would<br />
represent the equivalent of 92% of the<br />
region’s renewable water resources<br />
– even higher if the leaching requirements<br />
of agricultural areas affected by<br />
saltwater intrusion and leakages from<br />
brackish aquifers are considered.<br />
Source: FAO 2008b; IPCC 2000.<br />
uncertainty. The relationship between<br />
agriculture and climate change is complex.<br />
Agriculture contributes to global<br />
warming through emissions of methane<br />
and nitrous oxide. Changes in land use<br />
practices (management of cropland and<br />
grazing land) are considered to be the best<br />
mitigation options. 55 Agriculture is also<br />
extremely sensitive to climate change, and<br />
it is anticipated that large areas of croplands,<br />
in particular in semi-arid zones,<br />
will need to adapt to new conditions with<br />
lower precipitation.<br />
Climate change is expected to alter hydrologic<br />
regimes and patterns of freshwater<br />
resource availability (see chapter 5), with<br />
impacts on both rainfed and irrigated<br />
agriculture. 56 Projections converge in<br />
indicating a reduction in precipitation<br />
in semi-arid areas, greater variability in<br />
rainfall distribution, greater frequency of<br />
extreme events and rising temperature,<br />
particularly affecting agriculture in low<br />
latitudes. Severe reductions in river runoff<br />
and aquifer recharge (see chapter 11) are<br />
expected in the Mediterranean basin and<br />
in the semi-arid areas of Southern Africa,<br />
Australia and the Americas, affecting water<br />
availability for all uses (box 7.5).<br />
The projected increase in the frequency of<br />
droughts and floods will hurt crop yields<br />
and livestock, with greater impacts coming<br />
earlier than previously predicted. 57 While<br />
climate change does not seem to threaten<br />
global food production, it will alter the<br />
distribution of agricultural potential. Most<br />
of the increase in cereal production will be<br />
concentrated in the Northern Hemisphere,<br />
while more frequent and severe droughts<br />
and floods will hurt local production,<br />
especially in subsistence sectors at low<br />
112 World Water Development Report 3
evolution of water use<br />
PART<br />
2<br />
latitudes. 58 Several densely populated<br />
farming systems in developing countries<br />
are at risk from the impacts of climate<br />
change. A combination of reduced river<br />
base flows, increased flooding and rising<br />
sea levels is expected to impact highly productive<br />
irrigated systems that help maintain<br />
the stability of cereal production.<br />
The production risks will be amplified in<br />
alluvial plains dependent on glacier melt<br />
(Colorado, Punjab) and, in particular, in<br />
lowland deltas (the Ganges and Nile). Table<br />
7.3 shows the expected impact of climate<br />
change on some major agricultural systems<br />
and analyses their vulnerability and<br />
adaptive capacities.<br />
Table 7.3<br />
Typology of climate change impacts on major agricultural systems<br />
System Current status Climate change drivers Vulnerability Adaptability<br />
Snow melt systems<br />
Indus<br />
Ganges-Brahmaputra<br />
Northern China<br />
Red and Mekong Rivers<br />
Highly developed, water<br />
scarcity emerging.<br />
Sediment and salinity<br />
constraints<br />
High potential for<br />
groundwater, established<br />
water quality problems.<br />
Low productivity<br />
Extreme water scarcity,<br />
high productivity<br />
High productivity, high<br />
flood risk, poor water<br />
quality<br />
20-year increasing flows<br />
followed by substantial<br />
reductions in surface<br />
water and groundwater<br />
recharge. Changed<br />
seasonality of runoff<br />
and peak flows. More<br />
rainfall in place of snow.<br />
Increased peak flows<br />
and flooding. Increased<br />
salinity. Declining<br />
productivity in places.<br />
Colorado River Water scarcity, salinity Low<br />
Deltas<br />
Ganges-Brahmaputra<br />
Nile River<br />
Densely populated.<br />
Shallow groundwater,<br />
extensively used. Flood<br />
adaptation possible; low<br />
productivity<br />
Highly dependent on<br />
runoff and Aswan Storage<br />
– possibly sensitive to<br />
upstream development<br />
Rising sea level.<br />
Storm surges, and<br />
infrastructure damage.<br />
Higher frequency of<br />
cyclones (East and<br />
South-East Asia).<br />
Saline intrusion in<br />
groundwater and<br />
rivers. Increased flood<br />
frequency. Potential<br />
increase in groundwater<br />
recharge.<br />
Very high (run of river),<br />
medium high (dams)<br />
High (falling<br />
groundwater tables)<br />
High (global<br />
implications, high food<br />
demand with great<br />
influence on prices)<br />
Medium<br />
Very high (flood,<br />
cyclones)<br />
High (population<br />
pressure)<br />
Yellow River Severe weather scarcity High Low<br />
Red River<br />
Mekong River<br />
Currently adapted but<br />
expensive pumped<br />
irrigation and drainage<br />
Adapted groundwater<br />
use in delta; sensitive to<br />
upstream development<br />
Semi-arid and arid tropics: limited snow melt and limited groundwater<br />
Monsoonal: Indian<br />
subcontinent<br />
Non-monsoonal:<br />
sub-Saharan Africa<br />
Non-monsoonal:<br />
Southern and<br />
Western Australia<br />
Low productivity.<br />
Overdeveloped basin<br />
(surface water and<br />
groundwater)<br />
Poor soils. Flashy water<br />
systems. Overallocation<br />
of water and population<br />
pressure in places. Widespread<br />
food insecurity<br />
Flashy water systems.<br />
Over-allocation of water.<br />
Competition from other<br />
sectors<br />
Increased rainfall.<br />
Increased rainfall<br />
variability. Increased<br />
drought and flooding.<br />
Higher temperature.<br />
Increased rainfall<br />
variability. Increased<br />
frequency of droughts<br />
and flooding.<br />
Lower rainfall,<br />
higher temperature.<br />
Decreasing runoff.<br />
Medium<br />
High<br />
High<br />
Very high. Declining<br />
yields in rainfed<br />
systems. Increased<br />
volatility of production<br />
High<br />
Limited possibility<br />
for adaptation (all<br />
infrastructure already<br />
built)<br />
Medium (still<br />
possibilities for<br />
groundwater<br />
development)<br />
Medium (adaptability<br />
is increasing due to<br />
increasing wealth)<br />
Medium<br />
Medium, excessive<br />
pressure on resources<br />
Poor except salinity<br />
Medium<br />
High, except salinity<br />
Medium<br />
Low (surface<br />
irrigation); medium<br />
(groundwater<br />
irrigation)<br />
Low<br />
Low<br />
(continued)<br />
Water in a changing world 113
PART<br />
2<br />
Chapter 7<br />
Table 7.3<br />
Typology of climate change impacts on major agricultural systems (continued)<br />
System Current status Climate change drivers Vulnerability Adaptability<br />
Humid tropics<br />
Rice: Southeastern Asia<br />
Rice: Southern China<br />
Mediterranean<br />
Southern Europe<br />
Surface irrigation.<br />
High productivity but<br />
stagnating.<br />
Conjunctive use of surface<br />
water and groundwater.<br />
Low output compared<br />
with Northern China<br />
Increasing pressure on<br />
water<br />
Increased rainfall.<br />
Marginally increased<br />
temperatures. Increased<br />
rainfall variability and<br />
occurrence of droughts<br />
and floods.<br />
Significantly lower<br />
rainfall and higher<br />
temperatures. Increased<br />
water stress. Decreased<br />
runoff. Loss of<br />
groundwater reserves.<br />
High<br />
High<br />
Medium<br />
Northern Africa High water scarcity High Low<br />
West Asia Heavy pressure on water Low Low<br />
Small islands<br />
Small islands<br />
Fragile ecosystems.<br />
Groundwater depletion<br />
Seawater rise. Saltwater<br />
intrusion. Increased<br />
frequency of cyclones<br />
and hurricanes.<br />
High<br />
Medium<br />
Medium<br />
Low<br />
Variable<br />
Source: FAO 2008b.<br />
Box 7.6<br />
In key food-insecure areas, dominated by<br />
rainfed agriculture (sub-Saharan Africa<br />
and peninsular India, in particular),<br />
anticipated reductions in production may<br />
have multiple impacts, including loss of<br />
livelihoods and displacement of rural<br />
populations. This will accentuate demand<br />
Impacts of water shortage on rice production<br />
in Indonesia<br />
Many of the extreme climate events<br />
in Indonesia, particularly droughts,<br />
are associated with the el Niño<br />
Southern Oscillation. The end of the<br />
dry season occurs later than normal<br />
during el Niño and earlier during<br />
la Niña years, the onset of the wet<br />
season is delayed during el Niño and<br />
advanced during la Niña years, a<br />
substantial reduction of dry season<br />
rainfalls occur during el Niño and a<br />
substantial increase during la Niña<br />
years, and long dry spells occur during<br />
the monsoon period, particularly<br />
in Eastern Indonesia.<br />
Historical data indicate that the<br />
national rice production system is<br />
vulnerable to extreme climate events.<br />
During el Niño years rice production<br />
declined due to drought, with losses<br />
during 1991-2000 averaging three<br />
times greater than during 1980-90.<br />
It is very likely that in Bali and Java<br />
the rainy season may shorten as a<br />
result of climate change, though the<br />
amount of rainfall may be higher. This<br />
suggests exposure to higher flood<br />
and drought risks in the future. For<br />
regions north of the Equator, however,<br />
the pattern of change will be the<br />
opposite.<br />
Changes in rainfall pattern and<br />
length of the rainy season will have<br />
serious implications for the agriculture<br />
sector and current cropping<br />
patterns. In most rice-growing areas<br />
of Indonesia two rice crops are<br />
planted each year. The second planting<br />
depends heavily on irrigation<br />
water. In years of extreme drought<br />
irrigation water becomes very limited,<br />
causing severe production loss.<br />
Under a changing climate, drought<br />
will occur more frequently, and so<br />
retaining this cropping pattern may<br />
expose farmers to more frequent<br />
crop failures.<br />
Source: BertJan Heij, co-chair, WWAP<br />
Expert Group on Climate and Water, based<br />
on Government of Indonesia 2007.<br />
in global markets and put further pressure<br />
on irrigated production.<br />
Changes in runoff affect water availability<br />
in rivers and aquifers, placing an additional<br />
burden on areas where human pressure<br />
on water resources is already high. In<br />
addition, rising temperatures and lower<br />
precipitation associated with diminishing<br />
runoff will increase crop water demand<br />
in irrigated areas. The impacts of climate<br />
change on irrigation water requirements<br />
may therefore be substantial. 59<br />
In large irrigation systems that rely on<br />
high mountain glaciers for water (Andes,<br />
Himalayas and Rocky Mountains), temperature<br />
changes will cause high runoff<br />
periods to shift to earlier in the spring,<br />
when irrigation water demand is still low<br />
(see chapter 12). 60 Such changes could<br />
incite demand for new water control infrastructure<br />
to compensate for changes in<br />
river runoff. Indonesia shows how climate<br />
change can influence weather variability<br />
and make current farming and cropping<br />
systems unsustainable (box 7.6).<br />
Options for water management in<br />
agriculture<br />
It is possible to produce enough food and<br />
other agricultural products at a global<br />
level to meet demand while reducing<br />
the negative impacts of water use in<br />
agriculture. 61 But doing so will require<br />
a change from today’s food production<br />
and environmental trends, which, if<br />
114 World Water Development Report 3
continued, will lead to crises in many<br />
parts of the world. A combination of supply-<br />
and demand-side measures is needed<br />
to address the acute water challenges<br />
in the coming 50 years. The difficult<br />
task at hand is to manage the additional<br />
water supply in a way that minimizes the<br />
adverse impacts and – where possible –<br />
enhances ecosystem services and aquatic<br />
food production, while achieving the<br />
necessary gains in food production and<br />
poverty alleviation.<br />
The Comprehensive Assessment of Water<br />
Management in Agriculture scenario<br />
analysis shows opportunities and options<br />
– in rainfed, irrigated, livestock and fisheries<br />
systems – for preserving, and even<br />
restoring, healthy ecosystems. 62 But gains<br />
require major changes in the way water is<br />
managed, especially by farmers. The behaviour<br />
of different categories of farmers<br />
is shaped not only by agricultural policies<br />
but also by the capacity to allocate water<br />
according to wider financial restrictions<br />
and by local capacity to overcome<br />
pollution and environmental damage<br />
in emerging market economies. China<br />
has succeeded over the last 10 years in<br />
improving its water use efficiency by<br />
around 10% without increasing its water<br />
allocation to agriculture (see box 14.20 in<br />
chapter 14).<br />
Improved water management in agriculture<br />
includes reduced water wastage in<br />
irrigation. Irrigated agriculture is often<br />
seen as inefficient, in both water use and<br />
added value. 63 While on average only an<br />
estimated 37% of the water withdrawn<br />
for agriculture is effectively consumed by<br />
plants, a substantial share of the unused<br />
water returns to rivers and aquifers and<br />
is available for downstream uses. The net<br />
loss of water due to irrigation is therefore<br />
substantially less than may be apparent,<br />
and the potential gains from programmes<br />
aimed at increasing water use efficiency<br />
are often overestimated (see chapter 8).<br />
Programmes aimed only at reducing<br />
losses in irrigation are unlikely to have<br />
a substantial impact on water use. Most<br />
large irrigation schemes also serve other<br />
functions, such as providing water for<br />
drinking, bathing, swimming, fishing<br />
and livestock, and water savings may take<br />
water away from these uses. Management<br />
thus needs to focus instead on multipleuse<br />
strategies.<br />
Technological improvements can occur at<br />
all levels and affect all types of irrigation<br />
systems (see chapter 3). Better technologies<br />
evolution of water use<br />
are not necessarily new, expensive or<br />
sophisticated options, but rather ones<br />
that are appropriate to agricultural needs<br />
and demands, the managerial capacity<br />
of system managers and farmers, and the<br />
financial and economic capacity needed to<br />
ensure proper operation and maintenance.<br />
Better design and better matching of technologies,<br />
management and institutional<br />
arrangements are needed. Technological<br />
innovation will occur in broadly three<br />
categories:<br />
• At the irrigation system level: water<br />
level, flow control and storage management<br />
within surface irrigation<br />
systems at all scales.<br />
• On the farm: storage, reuse, water<br />
lifting (manual and mechanical) and<br />
precision application technologies<br />
such as overhead sprinklers and localized<br />
irrigation.<br />
• Across sectors: multiple-use systems in<br />
rural areas and urban agriculture with<br />
wastewater.<br />
Greater impact on irrigation efficiency<br />
can be expected from external drivers<br />
(see chapter 2) on the evolution of irrigation<br />
than from demand management<br />
programmes. The trend and forecast are<br />
for irrigation to serve an increasingly<br />
market-oriented agriculture, with progressive<br />
increases in the value of production<br />
and growing use of precision irrigation.<br />
This will lead to the progressive adoption<br />
of pressurized irrigation, thus reducing<br />
losses. 64<br />
Water for industry and energy<br />
Water use for industry and energy is growing<br />
coincident with rapid development,<br />
transforming the patterns of water use<br />
in emerging market economies. Industry<br />
and energy together account for 20% of<br />
water demand. The actual figure may be<br />
even larger, as many industries self-supply<br />
(these volumes are only partially metered<br />
and reported) or get their water directly<br />
from the urban distribution system (use<br />
that is difficult to separate from domestic<br />
use).<br />
Trends in industrial water use<br />
Water is used by industry in multiple ways:<br />
for cleaning, heating and cooling; for generating<br />
steam; for transporting dissolved<br />
substances or particulates; as a raw material;<br />
as a solvent; and as a constituent part<br />
of products (as in the beverage industry).<br />
The volume of water used by industry is<br />
PART<br />
2<br />
Industry puts<br />
pressure on water<br />
resources more<br />
by the impacts<br />
of wastewater<br />
discharges and<br />
their pollution<br />
potential than by<br />
the quantity used<br />
in production<br />
Water in a changing world 115
PART<br />
2<br />
Chapter 7<br />
Energy and water<br />
are inextricably<br />
Table 7.4<br />
linked<br />
(cubic metres per tonne)<br />
Product<br />
low, less than 10% of total water withdrawals,<br />
but there are large differences in<br />
efficiency of use. Industry creates more<br />
pressure on water resources from the<br />
impacts of wastewater discharges and their<br />
pollution potential than by the quantity<br />
used in production.<br />
There is no simple relation between a<br />
country’s production index (volume, value<br />
and jobs) and its total industrial demand<br />
for water. Demand depends first on the<br />
composition of the industrial sector, the<br />
processes in use and the degree of recycling<br />
that is in place in each sector. Different<br />
industries demand different water<br />
quality (the high-technology industry<br />
requires water of a higher quality than<br />
drinking water) and quantities (table 7.4).<br />
The diminishing quality of water supplies,<br />
increasing costs of water purchases and<br />
strict environmental effluent standards are<br />
Water use per tonne of product produced,<br />
selected industries<br />
Water use a<br />
Paper 80-2,000<br />
Sugar 3-400<br />
Steel 2-350<br />
Petrol 0.1-40<br />
Soap 1-35<br />
Beer 8-25<br />
a. Amount varies with process used.<br />
Source: Margat and Andréassian 2008.<br />
Figure 7.8<br />
1995 US$ per cubic metre per year, latest year available<br />
150<br />
125<br />
100<br />
75<br />
50<br />
25<br />
0<br />
Denmark<br />
Lithuania<br />
Latvia<br />
Czech Republic<br />
Source: Based on UNIDO 2007.<br />
Industrial water productivity varies greatly<br />
across countries<br />
United States<br />
Poland<br />
Hungary<br />
Russian Federation<br />
Ukraine<br />
Romania<br />
Moldova<br />
Bulgaria<br />
forcing industries to target greater water<br />
efficiency and report on their progress<br />
(as in the Global Reporting Initiative, for<br />
example 65 ). Industrial water productivity<br />
(ratio of value of water withdrawn to value<br />
of industrial output using the water) is a<br />
general indicator of performance in water<br />
use. The intensity of water use in industry,<br />
in overall terms, is believed to be increasing,<br />
as is the value added by industry per<br />
unit of water use. Industrial water use is<br />
only partially linked to a country’s level<br />
of industrialization, as exemplified by<br />
the large difference in water productivity<br />
between two high-income countries: more<br />
than $138 per cubic metre in Denmark<br />
and less than $10 per cubic metre in the<br />
United States (figure 7.8).<br />
After rising between 1960 and 1980, water<br />
withdrawal for industrial use in developed<br />
countries has stabilized and has even<br />
started to decline in some countries, as industrial<br />
output continues to expand while<br />
falling in absolute terms (because of efficiency<br />
gains and the energy transition). 66<br />
In Eastern Europe demand for water in the<br />
industrial sector fell following advances<br />
in production technology and structural<br />
change. 67 In emerging market economies<br />
industrial demand for water is expected<br />
to rise with the region’s rapid growth in<br />
manufacturing output.<br />
Some industries, such as tourism, show<br />
large seasonal variations in water use that<br />
can lead (on coastlines, islands and mountain<br />
areas) to supply difficulties in peak<br />
seasons. Around the Mediterranean Sea<br />
seasonal water demands from the tourism<br />
industry increase annual water demand by<br />
an estimated 5%-20% (box 7.7).<br />
Energy and water<br />
Energy and water are inextricably linked.<br />
Water is an integral part of energy resource<br />
development and use; it is needed<br />
for cooling and energy production (figure<br />
7.9) but is also consumed passively as<br />
reservoirs built for energy production<br />
and other purposes evaporate substantial<br />
amounts of water. Total evaporation<br />
from reservoirs in the 22 countries of<br />
the Mediterranean Action Plan is estimated<br />
at around 24 km 3 a year – nearly<br />
the water use of Argentina – almost half<br />
of it in Egypt. 68 For hydroelectric, wave<br />
or tidal energy production water offers<br />
an ‘active’ medium for transferring kinetic<br />
energy into electricity. For cooling<br />
thermal and nuclear plants or producing<br />
bioenergy, water plays a more passive,<br />
though equally important, role. The<br />
demand for energy is therefore a major<br />
116 World Water Development Report 3
evolution of water use<br />
PART<br />
2<br />
driver of water and agriculture development,<br />
creating pressures that strongly<br />
affect the quantity and quality of freshwater<br />
resources.<br />
Energy is important for pumping water,<br />
transporting it, processing it and using it.<br />
Desalination is also an energy-intensive<br />
process. Energy demand is affected by<br />
many of the same drivers that are putting<br />
direct pressure on water resources: demographic,<br />
economic, social and technological<br />
processes, including changes in<br />
consumption patterns. Energy consumption<br />
is also the main driver behind climate<br />
change (see chapter 5), which threatens<br />
the sustainability of water resources.<br />
Growing pressure and efforts to curb<br />
greenhouse gas emissions are leading to<br />
increasing demand for ‘cleaner’ sources of<br />
renewable energy. Hydropower has been<br />
earmarked as one of the most important of<br />
these sources.<br />
Energy requirements of the water sector.<br />
Energy can account for 60%-80% of<br />
water transportation and treatment costs<br />
and 14% of total water utility costs. 69 In<br />
2005‐06 water and wastewater companies<br />
in England and Wales spent $632 million<br />
on electric power (7,700 gigawatts), making<br />
it the largest non-staff operating cost<br />
item. 70 Efficiency and conservation are<br />
therefore not only good for water resources;<br />
they are also a means of conserving<br />
energy.<br />
Much of water resources development<br />
during the 20th century took place in a<br />
context of low water and energy prices.<br />
Substantial energy subsidies are still<br />
provided in many parts of the world. The<br />
delivery of subsidized rural electricity<br />
services has boosted agricultural production<br />
in existing irrigated areas and introduced<br />
irrigation in areas beyond those<br />
with surface water. The energy provided<br />
through electricity and fuel, together<br />
with low-cost technology for pumping,<br />
has generated tremendous changes in agricultural<br />
water management. One result<br />
of energy subsidies has been overabstraction<br />
of groundwater in many irrigated<br />
agricultural areas. When properly used,<br />
subsidies can fulfil important socioeconomic<br />
goals, but the challenge is to find<br />
a balance: to encourage efficiency and<br />
to ensure that subsidies reach intended<br />
beneficiaries.<br />
Energy prices increasingly tend to be<br />
volatile, and it will therefore be important<br />
to consider how future changes in energy<br />
prices and markets will affect water use<br />
Box 7.7<br />
With 364 million tourists in 2000 the<br />
Mediterranean region is the world’s<br />
top tourism destination, and by 2025<br />
the number of tourists could reach<br />
637 million.<br />
Knowledge of the water demands of<br />
tourism is limited because national<br />
statistics rarely distinguish between<br />
domestic water use and water for<br />
tourism. The annual additional<br />
demands from tourism are relatively<br />
modest, at 20% of domestic supply in<br />
Cyprus in 2006, 5% of total water demand<br />
in Malta during 1995-2000 and<br />
5% of domestic demand in Tunisia in<br />
2003.<br />
Daily demands are generally more<br />
important for planners and managers<br />
than annual demands because<br />
they show the timing and volume of<br />
peak demands. The daily demands<br />
Figure 7.9<br />
Tourism water demand in the Mediterranean<br />
coastal area<br />
Water for energy<br />
Energy and power<br />
production requires water:<br />
• Thermoelectric cooling<br />
• Hydropower<br />
• Minerals extraction and<br />
mining<br />
• Fuel production (fossil,<br />
non-fossil and biofuels)<br />
• Emission controls<br />
Water footprints for<br />
energy development<br />
Source: Based on DHI 2008.<br />
and production patterns and costs. Apart<br />
from the effects on production costs,<br />
rising prices are likely to influence investment<br />
in areas where the price of energy<br />
is an important factor (from farms to<br />
businesses, impacts are likely to be very<br />
heterogeneous). Rising prices may increase<br />
the willingness to make efficiency-related<br />
investments while reducing overall sector<br />
investments, with possible impacts on<br />
food production. Indirect effects can also<br />
be considerable, such as boosting transport<br />
costs.<br />
of a tourist are generally higher than<br />
those of a local resident. Tourism also<br />
creates a demand for seasonal services<br />
and leisure activities that demand a lot<br />
of water, such as golf courses.<br />
Tourist demands often occur at the<br />
same time as peak demand for agriculture,<br />
which is also seasonal, when<br />
resources are at their lowest. Satisfying<br />
such peak demands requires oversizing<br />
the drinking water production<br />
and distribution system as well as the<br />
wastewater collection and treatment<br />
infrastructure. In many places water<br />
supply for tourism relies on desalination<br />
of seawater, a promising option<br />
in places such as Cyprus, the Balearic<br />
Islands, Malta, Tunisia and certain<br />
Greek islands.<br />
Source: Blue Plan, MAP, and UNEP 2005,<br />
2007.<br />
Interlinkages between energy and water<br />
Energy for water<br />
Water collection,<br />
processing, distribution<br />
and end-use requires power:<br />
• Pumping<br />
• Transport<br />
• Treatment<br />
• Desalination<br />
Energy footprints for<br />
water development<br />
Water in a changing world 117
PART<br />
2<br />
Chapter 7<br />
Hydropower<br />
supplies about<br />
20% of the<br />
world’s electricity<br />
Figure 7.10<br />
Nuclear fuel mining and processing<br />
Water use for energy production. Cooling<br />
in the energy sector is one of the main<br />
industrial water uses, with final consumption<br />
(evaporation) estimated at around 5%<br />
of withdrawals. Outflows of water used<br />
in cooling nuclear power plants demand<br />
sufficient river flow to reduce the temperature<br />
in order to mitigate adverse ecological<br />
impacts. Thus non-directly productive but<br />
substantial flows are required.<br />
Hydropower generation requires large<br />
quantities of water, but unlike in other<br />
major water use sectors (agriculture and<br />
domestic), the nature of the use is nonconsumptive:<br />
water is returned to the river<br />
after passing through turbines. However,<br />
substantial losses occur through evaporation<br />
from reservoirs, and thus this use is<br />
not entirely non-consumptive.<br />
Water use efficiency in the energy sector<br />
differs with the power generation technology<br />
used, as illustrated by an assessment of<br />
19 power generation systems in the United<br />
States (figure 7.10). This suggests considerable<br />
potential for improving efficiency.<br />
Water consumption for various power<br />
generation technologies in the United States,<br />
2006<br />
Geothermal steam, CL tower<br />
Solar trough, CL tower<br />
Solar tower, CL tower<br />
Gas CCGT, dry<br />
Gas CCGT, CL tower<br />
Gas CCGT, open loop<br />
Natural gas supply<br />
Nuclear, dry<br />
Nuclear, CL pond<br />
Nuclear, CL tower<br />
Nuclear, open loop<br />
Coal ICGT<br />
Fossil steam, dry<br />
Fossil steam, CL pond<br />
Fossil steam, CL tower<br />
Fossil steam, open loop<br />
Coal slurry<br />
Coal mining<br />
1 10 100 1,000 10,000 100,000<br />
Gallons per megawatt hours of electricity, log scale<br />
Note: CL is closed loop cooling, CCGT is combined cycle gas turbine, and ICGT is integrated<br />
gasification combined-cycle.<br />
Source: US Department of Energy 2006.<br />
Current and projected trends in hydropower.<br />
Hydropower supplies about 20% of the<br />
world’s electricity, 71 a share that has<br />
remained stable since the 1990s. Hydropower<br />
stations are spread across the globe<br />
(map 7.6) and have shaped water infrastructure<br />
in many parts of the world.<br />
The first large hydropower stations were<br />
developed in Norway, Sweden, Switzerland,<br />
Canada, the United States, Australia<br />
and New Zealand. The largest hydropower<br />
station in operation is the Itaipu Dam<br />
on the Rio Parana River between Brazil<br />
and Paraguay, with an installed capacity<br />
of more than 14,000 megawatts. Brazil<br />
produces more than 90% of its electricity<br />
from hydropower.<br />
Hydropower development was stimulated<br />
by the oil crisis of the 1970s, fell off for<br />
a few decades and then returned to the<br />
agendas of many countries in response to<br />
the energy demands created by development.<br />
Hydropower continues to be the<br />
most important and economic source of<br />
commercial renewable energy worldwide,<br />
and its popularity is increasing with the<br />
surge of interest in clean energy prompted<br />
by concerns about climate change.<br />
Hydropower plants, when managed for<br />
multiple uses, should also allow for flow<br />
regulation and flood management, water<br />
for irrigation and drinking water supply<br />
during dry seasons and rapid response<br />
to grid demand fluctuations due to peak<br />
demands.<br />
According to the International Energy<br />
Agency, electricity generation from hydropower<br />
and other renewable energy sources<br />
is projected to increase at an average annual<br />
rate of 1.7% from 2004 to 2030, for<br />
an overall increase of 60% through 2030<br />
(figure 7.11).<br />
Development of hydropower will be limited<br />
by two main factors. The first is the<br />
modest spatial and geophysical potential<br />
for new hydropower installations. In<br />
many developed countries – including<br />
Australia, the United States and most of<br />
Western Europe – most of the suitable<br />
sites for hydropower installations have<br />
already been developed. Other limiting<br />
factors are investment capacity (including<br />
the availability of funds) and the social<br />
and environmental impacts of large dams<br />
and the controversy surrounding them,<br />
which collectively explain why so little<br />
hydroelectric potential has been tapped in<br />
developing countries.<br />
Oil prices and energy choices. Volatile prices<br />
of oil and natural gas, which are expected<br />
118 World Water Development Report 3
evolution of water use<br />
PART<br />
2<br />
Map 7.6 World potential and current hydropower production, 2004<br />
OECD North America<br />
Brazil<br />
Other Latin America<br />
OECD Europe<br />
Transition economies<br />
Russia<br />
Africa<br />
Middle East<br />
India<br />
China<br />
Rest of developing Asia<br />
OECD Pacific<br />
= 500 terawatt hours<br />
Economic potential (terawatt hours a year)<br />
Hydropower production in 2004 (terawatt hours)<br />
Source: IEA 2006.<br />
to persist over the medium term, encourage<br />
the use of renewable energy, which is<br />
also attractive for environmental reasons.<br />
Government policies and incentives can<br />
also increase the use of renewable energy<br />
sources even when renewable energy<br />
cannot compete economically with fossil<br />
fuels. Nonetheless, the renewable energy<br />
share of world electricity production is<br />
projected to fall slightly, from 19% in<br />
2004 to 16% in 2030, as growth in the<br />
consumption of coal and natural gas for<br />
electricity generation worldwide exceeds<br />
that in renewable energy sources. The<br />
capital costs of new power plants using<br />
renewable energy remain high compared<br />
with those for coal- or natural gas-fired<br />
plants.<br />
There are complex, and partly competing,<br />
challenges associated with energy production<br />
and water resources management.<br />
While average commercial energy use in<br />
high-income countries is about 5,500 kilograms<br />
of oil equivalent per capita, it is still<br />
well below 500 kilograms in low-income<br />
countries. 72 Thus, energy consumption in<br />
developing countries will need to increase<br />
as part of any development strategy. Yet<br />
major challenges remain for energy development.<br />
The pressure to extend hydropower<br />
on the basis of its comparative sustainability<br />
will continue to stir discussions<br />
Figure 7.11<br />
Global production of electricity by energy source, 1971-2030<br />
(thousands of terawatt hours)<br />
40<br />
30<br />
20<br />
10<br />
0<br />
1971<br />
1980<br />
Source: IEA 2008.<br />
Renewable energy sources are expected<br />
to meet only a small part of total energy<br />
demand to 2030<br />
1990<br />
2000<br />
of its environmental and social impacts,<br />
including the regulation of hydropower<br />
dam releases to optimize downstream uses<br />
and minimize negative impacts on aquatic<br />
ecosystems. Likewise, expansion of thermal<br />
power-producing facilities will require<br />
cooling water, with the need to discharge<br />
heated water.<br />
Emerging challenges will affect both the<br />
energy sector and water resources. The<br />
most obvious is climate change. Political<br />
Geothermal, solar, tide and wave<br />
Wind<br />
Biomass and waste<br />
Hydro<br />
2010<br />
Nuclear<br />
2020<br />
Gas<br />
Oil<br />
Coal<br />
2030<br />
Water in a changing world 119
PART<br />
2<br />
Chapter 7<br />
Freshwater<br />
ecosystems provide<br />
an extensive array<br />
of services to<br />
support human<br />
well-being<br />
pressures are mounting, and there are<br />
likely to be increased calls for action to<br />
deal with greenhouse gas emissions in<br />
coming decades in ways that can alter<br />
the energy production landscape. Yet<br />
the International Energy Agency’s World<br />
Energy Outlook 2007 forecasts that fossil<br />
fuels will continue to provide the major<br />
part of the increased energy demand. 73<br />
Nonetheless, the pressure and prospects<br />
for hydropower development may also<br />
increase as part of efforts to mitigate<br />
climate change.<br />
In-stream water uses<br />
Freshwater ecosystems provide an extensive<br />
array of services to support human<br />
well-being, many of them extremely<br />
valuable. Yet some environmental services<br />
continue to receive inadequate policy attention.<br />
Shifting attitudes away from considering<br />
the environment as a victim of<br />
human uses of water and towards viewing<br />
environmental sustainability as central to<br />
sustainable development remains a significant<br />
challenge. (For further discussion, see<br />
chapters 6 and 9.)<br />
Navigation has been critical to development<br />
and communication around<br />
the world. A variety of other economic<br />
activities such as fisheries and pastoral<br />
activities also depend on in-stream use of<br />
water. Recreational activities such as tubing<br />
and kayaking do not deplete water, but<br />
demand releases of water and maintenance<br />
of minimum flows at times that may not<br />
be compatible with demands by other<br />
users.<br />
Water for transport<br />
The 25 largest cities, the 25 largest production<br />
locations, the 25 most prosperous<br />
areas and the 25 most densely populated<br />
areas in the world are all located near<br />
waterfronts, almost all of them by the<br />
sea. 74 This has been the case for at least<br />
2,000 years. River navigation was part of<br />
the Indus Valley Civilization in Northwest<br />
India around 3300 BCE. Many major rivers<br />
of the world are used for navigation today.<br />
The development of waterways for transport<br />
lies behind many large-scale river<br />
transformations and dam constructions.<br />
Of 230 major world rivers some 60% are<br />
considered to be seriously or moderately<br />
fragmented by dams, dikes and dredging,<br />
with improved river transport often being<br />
an objective. 75<br />
However, inland shipping remains an<br />
underdeveloped sector on most waterways<br />
(map 7.7). China alone has 110,000<br />
Map 7.7 Important waterways in the world, 2007<br />
CANADA 3,000 KM<br />
UNITED STATES 41,009 KM<br />
MEXICO 2,900 KM<br />
VENEZUELA 7,100 KM<br />
GUYANA 5,900 KM<br />
COLOMBIA 18,140 KM<br />
BRAZIL 50,000 KM<br />
PERU 8,808 KM<br />
BOLIVIA 10,000 KM<br />
ARGENT<strong>IN</strong>A 10,950KM<br />
UNITED K<strong>IN</strong>GDOM 3,200 KM<br />
GERMANY 7,500 KM<br />
NETHERLANDS 5,046 KM<br />
BELGIUM 1,570 KM<br />
FRANCE 14,932 KM<br />
NIGERIA 8,575 KM<br />
ITALY 2,400 KM<br />
F<strong>IN</strong>LAND 6,675 KM<br />
SWEDEN 2,052 KM<br />
IRAQ 1,015 KM<br />
EGYPT 3,500 KM<br />
CONGO 15,000 KM<br />
MOZAMBIQUE 3,750 KM<br />
KAZAKHSTAN 3,900 KM<br />
RUSSIAN FEDERATION 95,900 KM<br />
POLAND 3,812 KM<br />
UKRA<strong>IN</strong>E 4,499 KM<br />
HUNGARY 1,373 KM<br />
ROMANIA 1,724 KM (1984)<br />
SUDAN 5,310 KM<br />
ZAMBIA 2,250 KM<br />
CH<strong>IN</strong>A 110,000 KM<br />
BANGLADESH 8,046 KM<br />
<strong>IN</strong>DIA 16,180 KM MYANMAR 3,200 KM<br />
LAO PDR 4,587 KM<br />
THAILAND 4,000 KM VIET NAM 17,702 KM<br />
CAMBODIA 3,700 KM<br />
<strong>IN</strong>DONESIA 21,579 KM<br />
Five longest waterway<br />
networks (kilometres)<br />
1. China 110,000<br />
2. Russia 95,900<br />
3. Europe 51,996<br />
4. United States 41,009<br />
5. Indonesia 21,579<br />
MALAYSIA 7,296 KM<br />
JAPAN 1,770 KM<br />
PAPUA NEW GU<strong>IN</strong>EA 10,940 KM<br />
AUSTRALIA 8,368 KM<br />
Source: Based on BVB 2008.<br />
120 World Water Development Report 3
evolution of water use<br />
PART<br />
2<br />
km of navigable waterways, the longest<br />
in the world. 76 Inland navigation is<br />
often the most cost-effective and least<br />
polluting means of transport and, with<br />
improved trade and exchange, has contributed<br />
to the development of mature<br />
economies. 77 Inland waterways can<br />
efficiently convey large volumes of bulk<br />
commodities over long distances. On the<br />
Mississippi River convoys of 30 barges<br />
(equivalent to 30 jumbo rail cars or 110<br />
normal trucks) are common, while on<br />
rivers such as the Danube and the Rhine,<br />
container fleets 23 metres wide by 135<br />
metres long can push convoys consisting<br />
of six barges, each about 64 metres by<br />
270 metres.<br />
However, developing rivers for navigation<br />
often results in irreversible transformation<br />
of river courses, with negative<br />
impacts on vulnerable groups and<br />
ecosystems (such as fish mortality from<br />
propeller impact and larvae stranding due<br />
to drawdown). Western Europe’s Rhine<br />
River is perhaps the best-known example<br />
of a river altered by navigation schemes.<br />
To make an 880 km stretch navigable,<br />
some 450 dams and thousands of kilometres<br />
of banks were built, meanders were<br />
removed, and the Rhine became 25%<br />
shorter as a result. 78<br />
Fisheries and aquaculture<br />
Inland fisheries are an important activity<br />
for many poor people in rural areas 79 and<br />
contribute significantly, at least locally, to<br />
economic development, poverty alleviation,<br />
increased protein in diets, and food<br />
security 80 – even though estimation is difficult,<br />
as many fishing activities do not fall<br />
within the economic domain. 81<br />
For small-scale fisheries, in particular, data<br />
remain patchy or not adequately disaggregated<br />
to allow detailed analysis, but<br />
case study information is available. 82 Some<br />
general indicators of the importance of the<br />
sector to national economies have been<br />
compiled (table 7.5).<br />
At national levels inland fisheries contribute<br />
to GDP through multiplier effects<br />
and generate tax revenues and foreign<br />
exchange. In Bangladesh benefits from<br />
inland fisheries represented 80% of export<br />
earnings and about 50% of daily animal<br />
protein intake. Most fish exporters have<br />
well established aquaculture industries. 83<br />
In Tanzania mainland fisheries generated<br />
$6.9 million in taxes, 97% from export<br />
taxes, and in Uganda the Nile perch from<br />
Lake Victoria accounted for 17% of the<br />
value of exports in 2002. 84<br />
Table 7.5<br />
Economy<br />
Contribution of inland and marine fisheries<br />
to exports, daily animal protein supply and<br />
employment in major fish-harvesting economies,<br />
latest year available<br />
Percent of<br />
agricultural<br />
exports<br />
Percent of average<br />
per capita daily<br />
animal proteins<br />
At the household level inland fisheries<br />
are central to livelihood strategies,<br />
providing not only direct and indirect<br />
employment for some 100 million people,<br />
most in developing countries, but<br />
also a safety net activity for the poor<br />
through catch and trade. Not included<br />
in these estimates are the hundreds of<br />
millions of people engaged in temporary<br />
fishing activities, mostly in inland<br />
areas. In Africa men and boys engage in<br />
seasonal fishing along rivers or reservoirs<br />
when agricultural activities are slow. 85<br />
In the Tonle Sap Lake area of Cambodia<br />
thousands of households split their<br />
time between fishing and cultivating<br />
crops. 86 In the floodplain areas of India<br />
occasional fishing by children, elders or<br />
women in male-headed households on<br />
the margins of water bodies or in waterways<br />
such as irrigation canals can involve<br />
up to 70%-80% of households during the<br />
flood seasons. 87<br />
Fish 88 consumption has undergone major<br />
changes over the past four decades. World<br />
fish capture and aquaculture production<br />
have grown fairly steadily (figure 7.12).<br />
Global per capita fish consumption has<br />
risen from an estimated average of 9.9 kg<br />
in the 1960s to about 16.7 kg in 2006. 89<br />
However, not all regions have experienced<br />
the same rise. Over the last three decades<br />
Percent of<br />
economically<br />
active population<br />
Argentina 7 4 0.08<br />
Bangladesh 76 51 1.90<br />
Brazil 2 4 0.37<br />
Chile 39 9 0.82<br />
Ecuador 31 8 3.29<br />
India 22 13 1.35<br />
Malaysia 3 37 1.07<br />
Mexico 9 7 0.64<br />
Morocco 58 16 0.90<br />
Pakistan 12 3 0.52<br />
Peru 62 20 0.68<br />
Philippines 23 41 3.16<br />
Thailand 38 40 0.95<br />
Viet Nam 40 34 2.45<br />
Average 30 20 1.30<br />
Source: Thorpe et al. 2005.<br />
Water in a changing world 121
PART<br />
2<br />
Chapter 7<br />
Figure 7.12<br />
Millions of tonnes<br />
50<br />
40<br />
30<br />
Aquaculture<br />
Capture<br />
Global freshwater fish production has grown<br />
rapidly in recent decades<br />
the contribution of fish to total animal<br />
protein intake in 2005 was about 20%,<br />
and may be higher than indicated by official<br />
statistics because of the unrecorded<br />
contribution of subsistence fisheries. Fish<br />
contribute to diets in many regions of the<br />
world, offering a valuable supplement for<br />
a diversified and nutritious diet, including<br />
high-value protein and a wide range<br />
of essential micronutrients, minerals and<br />
fatty acids.<br />
20<br />
10<br />
0<br />
1950<br />
1960<br />
Source: FAO forthcoming.<br />
Figure 7.13<br />
1970<br />
1980<br />
1990<br />
Inland capture fisheries vary greatly by<br />
region, 2006<br />
Percent of total inland fish capture<br />
Americas<br />
5.9%<br />
Europe<br />
3.5%<br />
Oceania 0.2%<br />
2000<br />
2006<br />
Landing more than 10 million tonnes in<br />
2006, inland capture fisheries contributed<br />
11% of global capture fisheries production.<br />
Although much lower than marine<br />
fisheries, fish and other aquatic animals<br />
from inland waters remain irreplaceable<br />
to the diets of both rural and urban<br />
inhabitants in many parts of the world,<br />
especially in developing countries. For demographic<br />
and cultural reasons, however,<br />
levels of exploitation differ considerably<br />
across major geographic regions (figure<br />
7.13). And although statistics are improving<br />
in some countries, collecting accurate<br />
information on inland fisheries can be<br />
difficult and costly, and many governments<br />
still do not gather such information<br />
or assess the status of inland fishery<br />
resources.<br />
Source: FAO forthcoming.<br />
Africa<br />
23.5%<br />
Asia<br />
66.9%<br />
the per capita fish supply has remained<br />
almost static in sub-Saharan Africa, while<br />
rising dramatically in East Asia (mainly<br />
in China) and in the Near East and North<br />
Africa.<br />
The share of fish in total protein intake<br />
was 7.8% in 2005, about the same as in<br />
the mid-1980s. The contribution of inland<br />
fish to total protein intake grew 6.5%-<br />
8.5% during 1961-89, before declining<br />
gradually as consumption of other animal<br />
proteins rose. Although consumption in<br />
low- income, food-deficit countries has increased<br />
in the last four decades, especially<br />
since the mid-1990s (1.3% a year since<br />
1993), per capita fish intake remains half<br />
that of industrial countries. Despite the<br />
relatively low level of fish consumption,<br />
The average contribution of aquaculture<br />
to per capita fish available for human<br />
consumption grew from 15% in 1996 to<br />
47% in 2006 and is expected to reach<br />
50% within the next decade. Aquaculture<br />
production has boosted consumption for<br />
several freshwater species, such as tilapia<br />
and catfish, as well as for high-value species<br />
such as shrimp, salmon and bivalves.<br />
Since the mid-1980s these species have<br />
shifted from being primarily wild-caught<br />
to being primarily aquaculture-produced,<br />
with a corresponding decline in price and<br />
a strong increase in commercialization.<br />
Aquaculture has also improved food security<br />
in several developing countries, particularly<br />
in Asia, through the production<br />
of certain low-value freshwater species destined<br />
mainly for domestic consumption.<br />
As the demand for fish is price-elastic, and<br />
with stable or declining fish prices, rising<br />
incomes and diversification of diets, there<br />
is a shift towards higher fish consumption<br />
in developing countries. These trends in<br />
fish consumption are expected to continue<br />
for the foreseeable future, driven by<br />
population and income growth, urbanization<br />
and dietary diversification. However,<br />
aquaculture has also contributed to serious<br />
water pollution when not well managed,<br />
a problem that is likely to intensify with<br />
increased aquaculture activities. 90<br />
122 World Water Development Report 3
evolution of water use<br />
PART<br />
2<br />
Capture fisheries and aquaculture are<br />
sustained by aquatic ecosystems (including<br />
rice paddies). If the ecosystem is damaged,<br />
the quantity of fish decreases. Lack of<br />
water at a certain flow for critical periods<br />
of fish life can be detrimental. The health<br />
of capture fisheries is therefore a good<br />
indicator of the health of the ecosystem.<br />
Notes<br />
1.<br />
2.<br />
3.<br />
4.<br />
5.<br />
6.<br />
7.<br />
8.<br />
9.<br />
10.<br />
11.<br />
12.<br />
13.<br />
14.<br />
15.<br />
16.<br />
17.<br />
18.<br />
19.<br />
20.<br />
21.<br />
22.<br />
23.<br />
24.<br />
25.<br />
26.<br />
27.<br />
UNDP 2006; WHO and UNICEF<br />
2008a.<br />
Comprehensive Assessment of Water<br />
Management in Agriculture 2007;<br />
World Bank 2007.<br />
MEA 2005; UNEP 2007.<br />
Margat and Andréassian 2008.<br />
Comprehensive Assessment of Water<br />
Management in Agriculture 2007.<br />
Shiklomanov and Rodda 2003.<br />
FAO-AQUASTAT database (www. fao.<br />
org/nr/water/aquastat/main/index.<br />
stm).<br />
Comprehensive Assessment of Water<br />
Management in Agriculture 2007.<br />
World Bank 2007.<br />
Cosgrove and Rijsberman 2000; MEA<br />
2005; Comprehensive Assessment of<br />
Water Management in Agriculture<br />
2007.<br />
This is one of the tasks set for the<br />
scenarios process that is under way<br />
by the World Water Assessment Programme,<br />
to be reported in the next<br />
World Water Development Report.<br />
Blue Plan, MAP, and UNEP 2005.<br />
Hoekstra and Chapagain 2007.<br />
UNSGAB 2006.<br />
WHO and UNICEF 2008b.<br />
WHO and UNICEF 2008b.<br />
Pilgrim et al. 2008.<br />
The Joint Monitoring Programme for<br />
Water Supply and Sanitation, managed<br />
by the World Health Organization<br />
(WHO) and the United Nations<br />
Children’s Fund (UNICEF), is the UN<br />
mechanism for monitoring progress<br />
towards the Millennium Development<br />
Goal target on access to water supply<br />
and sanitation.<br />
WHO and UNICEF 2006.<br />
UNDP 2006.<br />
UN-Water 2008.<br />
UN Millennium Project 2005.<br />
UNDP 2006.<br />
WHO and UNICEF 2008a.<br />
AfricanSan +5 Conference on Sanitation<br />
and Hygiene 2008.<br />
van Ginneken and Kingdom 2008.<br />
A comprehensive review of approaches<br />
and technologies for water,<br />
sanitation and hygiene was carried<br />
28.<br />
29.<br />
30.<br />
31.<br />
32.<br />
33.<br />
34.<br />
35.<br />
36.<br />
37.<br />
38.<br />
39.<br />
40.<br />
41.<br />
42.<br />
43.<br />
44.<br />
45.<br />
46.<br />
47.<br />
48.<br />
49.<br />
50.<br />
51.<br />
52.<br />
53.<br />
54.<br />
55.<br />
56.<br />
57.<br />
58.<br />
out on behalf of the Bill and Melinda<br />
Gates Foundation by a consortium of<br />
Cranfield University, Aguaconsult and<br />
IRC International Water and Sanitation<br />
Centre. Various documents can<br />
be downloaded from www.irc.nl/<br />
page/35947.<br />
EHP 2003.<br />
Wright 1997.<br />
UNDP 2006.<br />
UN-Water 2008.<br />
Comprehensive Assessment of Water<br />
Management in Agriculture 2007.<br />
World Bank 2007.<br />
FAOSTAT database (http://faostat.fao.<br />
org/).<br />
See Comprehensive Assessment of<br />
Water Management in Agriculture<br />
2007, chapter 9.<br />
WWAP 2006.<br />
FAO 2006b.<br />
FAO 2006a.<br />
FAO 2006b.<br />
FAO 2008c.<br />
FAO 2008c.<br />
Worldwatch Institute 2008.<br />
FAO 2008c.<br />
Bioethanol and biodiesel are typically<br />
mixed with gasoline and diesel,<br />
respectively, as so-called flex-fuel.<br />
Blends vary between a few percent of<br />
biofuel to nearly 25% in Brazil.<br />
Müller et al. 2008; De Fraiture,<br />
Giodano, and Yongsong 2007; OECD<br />
and FAO 2008.<br />
OECD and FAO 2008.<br />
FAO 2008a.<br />
OECD and FAO 2008.<br />
Dornbosch and Steenblik 2007.<br />
De Fraiture, Giodano, and Yongsong<br />
2007.<br />
De Fraiture, Giodano, and Yongsong<br />
2007.<br />
Dornbosch and Steenblik 2007.<br />
Dornbosch and Steenblik 2007.<br />
Zah et al. 2007; Dornbosch and<br />
Steenblik 2007.<br />
IPCC 2007b.<br />
FAO 2008b<br />
IPCC 2007a.<br />
IPCC 2007c.<br />
59.<br />
60.<br />
61.<br />
62.<br />
63.<br />
64.<br />
65.<br />
66.<br />
67.<br />
68.<br />
69.<br />
70.<br />
71.<br />
72.<br />
73.<br />
74.<br />
75.<br />
76.<br />
77.<br />
78.<br />
79.<br />
80.<br />
81.<br />
82.<br />
83.<br />
84.<br />
85.<br />
86.<br />
87.<br />
IPCC 2007a.<br />
Bennett, Haberle, and Lumley 2000.<br />
Comprehensive Assessment of Water<br />
Management in Agriculture 2007.<br />
Comprehensive Assessment of Water<br />
Management in Agriculture 2007.<br />
Water can accumulate in the soil<br />
profile through runoff and groundwater<br />
recharge and from irrigation if<br />
the rate of input exceeds the rate of<br />
crop consumption (see chapter 8).<br />
This accumulation can lead to waterlogging<br />
(when soil pores are filled<br />
with water and oxygen is lacking) and<br />
salinization (when the rising water in<br />
the soil profile brings diluted salts to<br />
the surface). Worldwide, about 10%<br />
of irrigated land suffers from waterlogging.<br />
Comprehensive Assessment of Water<br />
Management in Agriculture 2007.<br />
www.globalreporting.org/.<br />
WWAP 2006.<br />
Somlyódy and Varis 2006.<br />
Blue Plan, MAP, and UNEP 2007.<br />
Global Water Intelligence 2007.<br />
Dornbosch and Steenblik 2007.<br />
ICOLD 2007.<br />
World Development Indicators<br />
database (2005 data; http://ddp-ext.<br />
worldbank.org/ext/ddpreports/).<br />
IEA 2007.<br />
BVB 2008.<br />
WWF 2008.<br />
BVB 2008.<br />
PIANC 2008.<br />
WWF website (www.panda.org/<br />
about_wwf/what_we_do/freshwater/problems/infrastructure/<br />
river_navigation/).<br />
Comprehensive Assessment of Water<br />
Management in Agriculture 2007.<br />
Béné, Macfayden, and Allison 2007.<br />
This section is based on FAO<br />
forthcoming.<br />
For example, Southern Africa, in<br />
Béné, Macfadyen, and Allison (2007).<br />
Thorpe et al. 2005.<br />
Wilson 2004.<br />
Sana 2000.<br />
Ahmed et al. 1998.<br />
Thompson and Hossain 1998; Hoggarth<br />
et al. 1999.<br />
Water in a changing world 123
PART<br />
2<br />
Chapter 7<br />
88.<br />
89.<br />
90.<br />
Including fish, crustaceans and mollusks,<br />
and excluding aquatic mammals<br />
and aquatic plants.<br />
FAO forthcoming.<br />
Gowing 2006.<br />
References<br />
AfricaSan + 5 Conference on Sanitation<br />
and Hygiene. 2008. The eThekwini Declaration<br />
and AfricaSan Action Plan. WSP<br />
(Water and Sanitation Program) – Africa.<br />
Ahmed, M., H. Navy, L. Vuthy, and M.<br />
Tiongco. 1998. Socio-Economic Assessment<br />
of Freshwater Capture Fisheries in<br />
Cambodia. Report 185. Phnom Penh:<br />
Mekong River Commission, Department<br />
of Fisheries and Danida.<br />
Aliev, S., P. Shodmonov, N. Babakhanova,<br />
and O. Schmoll. 2006. Rapid Assessment<br />
of Drinking-Water Quality in<br />
the Republic of Tajikistan. Dushanbe,<br />
Ministry of Health of the Republic of<br />
Tajikistan, United Nations Children’s<br />
Fund, World Health Organization.<br />
Béné, C., G. Macfadyen, and E. Allison.<br />
2007. Increasing the Contribution of<br />
Small-Scale Fisheries to Poverty Alleviation<br />
and Food Security. FAO Fisheries<br />
Technical Paper 481, Food and Agriculture<br />
Organization of the United Nations,<br />
Rome.<br />
Bennett K. D., S. G. Haberle, and S. H.<br />
Lumley. 2000. The Last Glacial-Holocene<br />
Transition in Southern Chile. Science<br />
290 (5490): 325-28. DOI:10.1126/<br />
science.290.5490.325.<br />
Blue Plan, MAP (Mediterranean Action<br />
Plan), and UNEP (United Nations Environment<br />
Programme). 2005. The Blue<br />
Plan’s Sustainable Development Outlook<br />
for the Mediterranean. Sophia Antipolis,<br />
France: Blue Plan. www.planbleu.org/<br />
publications/UPM_EN.pdf.<br />
———. 2007. Water Demand Management,<br />
Progress and Policies: Proceedings of the<br />
3rd Regional Workshop on Water and<br />
Sustainable Development in the Mediterranean<br />
Zaragoza, Spain, 19-21 March.<br />
MAP Technical Reports Series 168.<br />
Athens: United Nations Environment<br />
Programme.<br />
BVB (Bureau Voorlichtin Binnenvaart).<br />
2008. The Power of Inland Navigation:<br />
The Future of Inland Navigation<br />
on European Scale. Rotterdam: Bureau<br />
Voorlichtin Binnenvaart. www.<br />
bureauvoorlichtingbinnenvaart.nl/<br />
images/download/waardevoltransport/<br />
The_power_of_inland_navigation.pdf.<br />
www.inlandshipping.com/<br />
Comprehensive Assessment of Water<br />
Management in Agriculture. 2007.<br />
Water for Food, Water for Life: A Comprehensive<br />
Assessment of Water Management<br />
in Agriculture. London: Earthscan, and<br />
Colombo: International Water Management<br />
Institute.<br />
Cosgrove, W., and F. Rijsberman. 2000.<br />
World Water Vision: Making Water Everybody’s<br />
Business. London: Earthscan.<br />
De Fraiture, C., M. Giodano, and Yongsong<br />
L. 2007. Biofuels: Implications for<br />
Agricultural Water Use: Blue Impact of<br />
Green Energy. Paper presented at the<br />
International Conference Linkages between<br />
Energy and Water Management<br />
for Agriculture in Developing Countries,<br />
28-31 January 2007, Hyderabad, India.<br />
DHI. 2008. Linking Water, Energy and<br />
Climate Change. A Proposed Water<br />
and Energy Policy Initiative for the UN<br />
Climate Change Conference, COP15, in<br />
Copenhagen 2009, Draft Concept Note,<br />
Danish Hydrological Institute, Horsholm,<br />
Denmark.<br />
Dornbosch, Richard, and Ronald Steenblik.<br />
2007. Biofuels: Is the Cure Worse<br />
than the Disease? Round Table on<br />
Sustainable Development, 11-12 September<br />
2007, Paris. SG/SD/RT(2007)3,<br />
Organisation for Economic Co-operation<br />
and Development. www.foeeurope.<br />
org/publications/2007/OECD_Biofuels_<br />
Cure_Worse_Than_Disease_Sept07.pdf.<br />
EHP (Environmental Health Project).<br />
2003. The Hygiene Improvement Framework:<br />
A Comprehensive Approach for Preventing<br />
Childhood Diarrhoea. Washington,<br />
DC: Environmental Health Project.<br />
FAO (Food and Agriculture Organization<br />
of the United Nations). 2006a. World<br />
Agriculture towards 2030/2050. Prospects<br />
for Food, Nutrition, Agriculture, and<br />
Major Commodity Groups. Interim Report.<br />
Rome: Food and Agriculture Organization<br />
of the United Nations.<br />
———. 2006b. The State of Food Insecurity<br />
in the World 2006. Eradicating World<br />
Hunger – Taking Stock Ten Years after the<br />
World Food Summit. Rome: Food and<br />
Agriculture Organization of the United<br />
Nations.<br />
———. 2008a. Report of the Co-Chairs<br />
of the Informal Open-ended Contact<br />
Group. Contribution to the High-Level<br />
Conference on World Food Security:<br />
The Challenges of Climate Change and<br />
Bioenergy, 3-5 June 2008, Rome. ftp://<br />
ftp.fao.org/docrep/fao/meeting/013/<br />
k2359e.pdf.<br />
———. 2008b. Climate Change, Water and<br />
Food Security. Technical background<br />
document from the expert consultation<br />
held in Rome, 26-28 February<br />
2008. Contribution to the High Level<br />
Conference on World Food Security:<br />
The Challenges of Climate Change and<br />
Bioenergy, 3-5 June 2008, Rome.<br />
———. 2008c. Soaring Food Prices: Facts,<br />
Perspectives, Impacts and Actions<br />
Required. Contribution to the High Level<br />
Conference on World Food Security:<br />
The Challenges of Climate Change and<br />
Bioenergy, 3-5 June 2008, Rome.<br />
———. Forthcoming. The State of World<br />
Fisheries and Aquaculture 2008. Rome:<br />
Food and Agriculture Organization of<br />
the United Nations.<br />
Global Water Intelligence. 2007. Global<br />
Water Market 2008: Opportunities in<br />
Scarcity and Environmental Regulation.<br />
Oxford: Global Water Intelligence.<br />
Government of Indonesia. 2007. Indonesia<br />
Country Report. Climate Variability and<br />
Climate Changes and Their Implications.<br />
Jakarta: Ministry of Environment, Republic<br />
of Indonesia. www.undp.or.id/pubs/<br />
docs/Final%20Country%20Report%20<br />
-%20Climate%20Change.pdf.<br />
Gowing, J. 2006. A Review of Experience<br />
with Aquaculture Integration in Large-<br />
Scale Irrigation Systems. In Integrated Irrigation<br />
and Aquaculture in West Africa:<br />
Concepts, Practices and Potential, eds.,<br />
M. Halwart and A. A. van Dam. Rome:<br />
Food and Agriculture Organization of<br />
the United Nations.<br />
Hoekstra, A. Y., and A. K. Chapagain.<br />
2007. Water Footprints of Nations:<br />
Water Use by People as a Function of<br />
Their Consumption Pattern. Water Resources<br />
Management 21 (1): 35-48.<br />
———. 2008. Globalization of Water: Sharing<br />
the Planet’s Freshwater Resources.<br />
Oxford: Blackwell Publishing.<br />
Hoggarth, D. D., V. J. Cowan, A. S. Halls,<br />
M. Aeron-Thomas, J. A. McGregor, C.<br />
A. Garaway, A. I. Payne, and R. Welcomme.<br />
1999. Management Guidelines<br />
for Asian Floodplain River Fisheries. Part<br />
1: A Spatial, Hierarchical and Integrated<br />
Strategy for Adaptive Co-management.<br />
FAO Fisheries Technical Paper, 384/1.<br />
Rome: Food and Agriculture Organization<br />
of the United Nations.<br />
Hoogeveen, J., J.-M. Faurès, and N. van<br />
de Giesse. Forthcoming. Increased<br />
Biofuel Production in the Coming Decade:<br />
to What Extent Will It Affect Global<br />
Freshwater Resources? Irrigation and<br />
Drainage Journal.<br />
ICOLD (International Commission on<br />
Large Dams). 2007. Dams and the<br />
World’s Water. An Educational Book that<br />
Explains How Dams Help to Manage the<br />
World’s Water. Paris: International Commission<br />
on Large Dams.<br />
124 World Water Development Report 3
evolution of water use<br />
2 PART<br />
IEA (International Energy Agency).<br />
2006. World Energy Outlook 2006. Paris:<br />
Organisation for Economic Co-operation<br />
and Development and International<br />
Energy Agency.<br />
———. 2007. World Energy Outlook 2007.<br />
Paris: Organisation for Economic<br />
Co-operation and Development and<br />
International Energy Agency.<br />
———. 2008. World Energy Outlook 2008.<br />
Paris: Organisation for Economic<br />
Co-operation and Development and<br />
International Energy Agency.<br />
IFEN (Institut Français de L’environnement).<br />
2006. L’environnement en<br />
France. Les Syntheses. Octobre 2006<br />
ed. Orléans, France: Institut Français de<br />
L’environnement.<br />
IPCC (Intergovernmental Panel on<br />
Climate Change). 2000. Emissions<br />
Scenarios. Cambridge, UK: Cambridge<br />
University Press.<br />
———. 2007a. Climate Change 2007:<br />
Impacts, Adaptation and Vulnerability.<br />
Contribution of Working Group II to the<br />
Fourth Assessment Report of the Intergovernmental<br />
Panel on Climate Change, eds.,<br />
M. L. Parry, O. F. Canziani, J. P. Palutikof,<br />
P. J. van der Linden, and C. E. Hanson.<br />
Cambridge, UK: Cambridge University<br />
Press.<br />
———. 2007b. Climate Change 2007:<br />
Mitigation. Contribution of Working Group<br />
III to the Fourth Assessment Report of<br />
the Intergovernmental Panel on Climate<br />
Change. Cambridge, UK: Cambridge<br />
University Press.<br />
———. 2007c. Climate Change 2007:<br />
Synthesis Report. Contribution of Working<br />
Groups I, II and III to the Fourth Assessment<br />
Report of the Intergovernmental<br />
Panel on Climate Change. Geneva:<br />
Intergovernmental Panel on Climate<br />
Change.<br />
Margat, J. 2008. Preparatory Documents to<br />
the 5th World Water Forum 2009, 16-22<br />
March, Istanbul. Internal Documents for<br />
Blue Plan/MAP/UNEP.<br />
Margat, J., and V. Andréassian. 2008.<br />
L’Eau, les Idées Reçues. Paris: Editions le<br />
Cavalier Bleu.<br />
MEA (Millennium Ecosystem Assessment).<br />
2005. Ecosystems and Human<br />
Well-Being: Wetlands and Water Synthesis.<br />
Washington, DC: World Resources<br />
Institute.<br />
Müller, A., J. Schmidhuber, J. Hoogeveen,<br />
and P. Steduto. 2008. Some Insights<br />
in the Effect of Growing Bio-energy<br />
Demand on Global Food Security and<br />
Natural Resources. Water Policy 10<br />
(Supp.1): 83-94.<br />
OECD (Organisation for Economic Cooperation<br />
and Development) and FAO<br />
(Food and Agriculture Organization of<br />
the United Nations). 2008. OECD-FAO<br />
Agricultural Outlook 2008-2017. Paris:<br />
Organisation for Economic Co-operation<br />
and Development/Food and Agriculture<br />
Organisation of the United Nations.<br />
www.fao.org/es/ESC/common/ecg/550/<br />
en/AgOut2017E.pdf.<br />
PIANC (The World Association for Waterborne<br />
Transport Infrastructure). 2008.<br />
Guidelines for Environmental Impacts<br />
of Vessels. InCom working group 27.<br />
PIANC.<br />
Pilgrim, N., B. Roche, J. Kalbermatten, C.<br />
Revels, and M. Kariuki. 2008. Principles<br />
of Town Water Supply and Sanitation.<br />
Water Working Note No. 13. Washington,<br />
DC: World Bank.<br />
Sana, B. 2000. Systèmes d’Aménagement<br />
Traditionnels des Pêches et Leur Impact<br />
dans le Cadre de la Lutte contre la Pauvreté<br />
sur les Petites Pêcheries Lacustres<br />
du Sud-Ouest du Burkina Faso. Report<br />
of the Seminar on Livelihoods and<br />
Inland Fisheries Management in the<br />
Sahelian Zone, Ouagadougou, Burkina<br />
Faso.<br />
Shiklomanov, I. A., and John C. Rodda,<br />
eds. 2003. World Water Resources at the<br />
Beginning of the 21st Century. Cambridge,<br />
UK: Cambridge University Press.<br />
Somlyódy, László, and Olli Varis. 2006.<br />
Freshwater under Pressure in Groundwater<br />
Management and Policy: Its Future<br />
Alternatives. International Review for<br />
Environmental Strategies 6 (2): 181-204.<br />
Thompson, P. M., and M. M. Hossain.<br />
1998. Social and Distributional Issues in<br />
Open Water Fisheries Management in<br />
Bangladesh. In Inland fishery enhancements:<br />
Papers Presented at the FAO/DFID<br />
Expert Consultation on Inland Fishery<br />
Enhancement, Dhaka, Bangladesh, 7-11<br />
April 1997, ed., T. Petr. Rome: Food and<br />
Agriculture Organization of the United<br />
Nations.<br />
Thorpe, A., C. Reid, R. van Anrooy, and C.<br />
Brugere. 2005. When Fisheries Influence<br />
National Policy-Making: An Analysis of<br />
the National Development Strategies<br />
of Major Fish-Producing Nations in the<br />
Developing World. Marine Policy 29 (3):<br />
211-22.<br />
UN Millennium Project. 2005. Health,<br />
Dignity, and Development: What Will It<br />
Take? Task Force on Water and Sanitation.<br />
London: Earthscan.<br />
UNDP (United Nations Development Programme).<br />
2006. Human Development<br />
Report 2006: Beyond Scarcity: Power,<br />
Poverty and the Global Water Crisis. New<br />
York: Palgrave Macmillan.<br />
UNEP (United Nations Environment<br />
Programme). 2007. Global Environment<br />
Outlook GEO4: Environment for Development.<br />
Nairobi: United Nations Environment<br />
Programme.<br />
UNIDO (United Nations Industrial<br />
Development Organization). 2007.<br />
Symposium Report on Water Productivity<br />
in the Industry of the Future for the<br />
Technology Foresight Summit, 27-29<br />
September 2007, Budapest.<br />
UNSGAB (United Nations Secretary General’s<br />
Advisory Board on Water and<br />
Sanitation). 2006. Hashimoto Action<br />
Plan (formerly known as The Compendium<br />
of Actions). United Nations Secretary<br />
General’s Advisory Board on Water and<br />
Sanitation, New York.<br />
UN-Water. 2008. UN-Water Global Annual<br />
Assessment of Sanitation and Drinking-<br />
Water (GLAAS): 2008 Pilot Report – Testing<br />
a New Reporting Approach. Geneva:<br />
World Health Organization.<br />
US Department of Energy. 2006. Energy<br />
Demands on Water Resources. Report to<br />
Congress on the Independency of Energy<br />
and Water, U.S. National Research<br />
Council, Washington, DC.<br />
van Ginneken, M., and B. Kingdom. 2008.<br />
Key Topics in Public Water Utility Reform.<br />
Water Working Note 17. Washington,<br />
DC: World Bank.<br />
WHO (World Health Organization) and<br />
UNICEF (United Nations Children’s<br />
Fund) Joint Monitoring Programme.<br />
2006. Meeting the MDG Drinking<br />
Water and Sanitation Target: The Urban<br />
and Rural Challenge of the Decade.<br />
New York: United Nations Children’s<br />
Fund, and Geneva: World Health<br />
Organization.<br />
———. 2008a. Progress on Drinking Water<br />
and Sanitation: Special Focus on Sanitation.<br />
New York: United Nations Children’s<br />
Fund, and Geneva: World Health<br />
Organization.<br />
———. 2008b. A Snapshot of Sanitation in<br />
Africa. New York: United Nations Children’s<br />
Fund, and Geneva: World Health<br />
Organization.<br />
Wilson, J. D. K. 2004. Fiscal Arrangements<br />
in the Tanzanian Fisheries Sector. FAO<br />
Fisheries Circular 1000. Rome: Food and<br />
Agriculture Organization.<br />
World Bank. 2007. World Development<br />
Report 2008: Agriculture for Development.<br />
Washington, DC: World Bank.<br />
Worldwatch Institute. 2008. State of the<br />
World. New York: Norton Institute.<br />
Water in a changing world 125
PART<br />
2<br />
Chapter 7<br />
Wright, A. M. 1997. Toward a Strategic<br />
Sanitation Approach: Improving the<br />
Sustainability of Urban Sanitation in<br />
Developing Countries. Washington, DC:<br />
World Bank.<br />
WWAP (World Water Assessment Programme).<br />
2006. The United Nations<br />
World Water Development Report 2. Water:<br />
A Shared Responsibility. Paris: United<br />
Nations Educational, Scientific and<br />
Cultural Organization, and New York:<br />
Berghahn Books.<br />
WWF. 2008. Infrastructure Problems: River<br />
Navigation Schemes. WWF. www.panda.<br />
org/about_wwf/what_we_do/freshwater/<br />
problems/infrastructure/river_navigation/<br />
index.cfm.<br />
Zah, Rainer, Heinz Böni, Marcel Gauch,<br />
Roland Hischier, Martin Lehmann, and<br />
Patrick Wäger. 2007. Life Cycle Assessment<br />
of Energy Products: Environmental<br />
Assessment of Biofuels – Executive<br />
Summary. Empa, Swiss Federal Institute<br />
for Materials Science and Technology,<br />
Technology and Society Lab, Gallen,<br />
Switzerland.<br />
126 World Water Development Report 3
evolution of water use<br />
Chapter 8<br />
Impacts of water use<br />
on water systems and<br />
the environment<br />
PART<br />
2<br />
Authors: Gunilla Björklund, Jake Burke, Stephen Foster,<br />
Walter Rast, Domitille Vallée and Wim van der Hoek<br />
Contributions: Francesca Bernardini, Rudolf Cleveringa, Alasdair Cohen,<br />
Jean-Marc Faurès, Sasha Koo-Oshima, Christopher Kuonqui, Robson<br />
Mutandi, Laurent Stracasto, Ti Le-Huu and James Winpenny<br />
Coordinator: Jean-Marc Faurès (FAO)<br />
Facilitator: Domitille Vallée<br />
Key messages<br />
The pattern and intensity of human activity have disrupted –<br />
through impacts on quantity and quality – the role of water as the<br />
prime environmental agent. In some areas depletion and pollution<br />
of economically important water resources have gone beyond the<br />
point of no-return, and coping with a future without reliable water<br />
resources systems is now a real prospect in parts of the world.<br />
While the intensity of groundwater use, partly encouraged by<br />
subsidized rural electrification, has led to the emergence of many<br />
groundwater-dependent economies, their future is now threatened<br />
by aquifer depletion and pollution. Prospects for relaxing<br />
use of these key aquifers, remediating water quality and restoring<br />
groundwater services to ecosystems look remote unless alternative<br />
management approaches are developed.<br />
Our ability to maintain the environmental services we depend on<br />
has improved but remains constrained by an incomplete understanding<br />
of the magnitude and impact of pollution, the resilience of<br />
affected ecosystems and the uses and management of water resources<br />
systems. A failure to monitor the negative impacts of water use on<br />
the environment and institutional weaknesses in many developing<br />
countries prevent effective enforcement of regulatory provisions.<br />
Relevant information about pollution loads and changes in water<br />
quality is lacking precisely where water use is most intense – in<br />
densely populated developing countries. As a result, the often serious<br />
impacts of polluting activities on the health of people and<br />
ecosystems remain largely unreported. Still, there are signs of<br />
progress in how pollution and the risks of pollution can be mitigated,<br />
and trends in environmental degradation reversed.<br />
Progress in mitigating the negative effects<br />
of water development has been slow, while<br />
accelerated economic growth has placed<br />
additional burdens on resources. There is<br />
clear evidence of the degradation of water<br />
quantity and quality: drying rivers, aquifers<br />
and groundwater basins; bioaccumulation<br />
of agrochemicals and heavy metals in fish;<br />
algal blooms from high nutrient loads; and<br />
the silting of dams and nutrient loss because<br />
of the fragmentation of rivers. Many<br />
of these impacts are caused by cities, industry<br />
and agriculture that lack incentives<br />
or obligations to act and report on their<br />
performance on water use and pollution<br />
mitigation. Overexploitation and pollution<br />
are mainly externalities of the activities<br />
of users and polluters: users and polluters<br />
Water in a changing world 127
PART<br />
2<br />
Chapter 8<br />
An increasing<br />
number of river<br />
basins lack<br />
sufficient water<br />
to meet all the<br />
demands placed<br />
on them, and<br />
competition<br />
among users<br />
can be intense<br />
seldom directly suffer the consequences<br />
of their actions. Internalizing these effects<br />
thus seems a good way to reduce misuse<br />
and pollution. Examples include providing<br />
incentives through payments for ecosystem<br />
services (such as to local communities for<br />
maintaining the integrity of forested watersheds)<br />
and for sustaining benefits provided<br />
to others (see box 14.23 in chapter 14) and<br />
applying the ‘polluter pays’ principle.<br />
How water use affects water<br />
resources<br />
Humans have settled near water bodies for<br />
millennia, and human alteration of coastlines,<br />
rivers, lakes and wetlands has gone<br />
hand in hand with social and economic<br />
development. While this has increased<br />
the demand to produce more food, urban<br />
growth and industrial development have<br />
pushed cities to look increasingly farther<br />
for the water they need, often taking water<br />
from, and perhaps hurting, other users –<br />
agriculture and nature.<br />
Disturbing impacts: ecosystems<br />
under stress<br />
Increasing water scarcity. Water scarcity<br />
occurs when so much water is withdrawn<br />
from lakes, rivers or groundwater that<br />
supplies can no longer adequately satisfy<br />
all human and ecosystem requirements,<br />
resulting in more competition among<br />
potential users (map 8.1). An increasing<br />
number of river basins lack sufficient water<br />
to meet all the demands placed on them,<br />
and competition among users can be intense<br />
(see chapter 9).<br />
Available information hides the full reality<br />
of scarcity at local or basin level. This is<br />
particularly problematic in large countries<br />
such as the United States, where average<br />
water use nationally accounts for only 25%<br />
of available resources, but can reach 80%<br />
on a subnational scale. 1<br />
Degradation of ecosystems. The Millennium<br />
Ecosystem Assessment has demonstrated<br />
how modifying landscapes to increase<br />
food production and allow development<br />
has resulted in adverse ecological changes<br />
to many ecosystems, with accompanying<br />
loss and degradation of ecosystem services.<br />
2 Synergistic and cumulative effects can<br />
make it difficult to attribute changes to a<br />
single cause. Losses have adverse effects<br />
on livelihoods and economic production, 3<br />
and some ecosystems have passed thresholds<br />
into regime shifts, with a collapse in<br />
ecosystem services, making the cost of<br />
restoration (if possible) very high.<br />
There are many instances where consumptive<br />
use and water diversion have<br />
severely degraded downstream wetlands<br />
or closed basins. Examples include the<br />
drastic shrinking Aral Sea in Central Asia<br />
and Lake Chapala in Mexico, the world’s<br />
largest shallow lake. With some of the<br />
largest rivers becoming small streams close<br />
Map 8.1<br />
Increasing water scarcity<br />
Little or no water scarcity<br />
Approaching physical water scarcity<br />
Physical water scarcity<br />
Economic water scarcity<br />
Not estimated<br />
Source: Based on Comprehensive Assessment of Water Management in Agriculture 2007.<br />
128 World Water Development Report 3
impacts of water use on water systems and the environment<br />
PART<br />
2<br />
to their mouth (such as the Colorado,<br />
Murray- Darling, Nile and Yellow), flows<br />
are no longer sufficient to maintain the<br />
health of aquatic ecosystems.<br />
Water regulation and drainage for agricultural<br />
development are the main causes<br />
of wetland habitat loss and degradation. 4<br />
Although loss and degradation should be<br />
avoided, where they have occurred recovery<br />
can sometimes be quick if the right mechanisms<br />
are put in place. An example is the<br />
Mesopotamian Marshlands, which were<br />
deliberately drained but are now being reclaimed<br />
(map 8.2). Following over a decade<br />
of decline, more than 20% of the original<br />
marshland area was reflooded in less than a<br />
year between May 2003 and March 2004. 5<br />
Double-edged impact: more control,<br />
less resiliency<br />
The Living Planet Index, developed by the<br />
United Nations Environment Programme’s<br />
World Conservation Monitoring Centre<br />
and WWF, is based on trends in populations<br />
of vertebrate species. The index<br />
shows that on average freshwater species<br />
populations were reduced by half between<br />
1970 and 2005, a sharper decline than for<br />
other biomes (figure 8.1).<br />
Dams and large interbasin transfers fuelled<br />
the prosperity of many ancient civilizations.<br />
Construction of such structures has<br />
continued throughout history. During<br />
the last century the number of such river<br />
modifications increased massively. As of<br />
2000 there were more than 50,000 large<br />
dams in operation. Some 589 large dams<br />
were built in Asia from 1999 to 2001. As of<br />
2005, 270 dams of 60 metres or larger were<br />
planned or under construction. 6 The demand<br />
for reservoirs of all sizes is expected<br />
to continue to grow, particularly in regions<br />
with high water demands and a need to<br />
cope with the increased variability accompanying<br />
climate change (see chapter 11).<br />
Modifications made for water-related<br />
development (dams, irrigation schemes,<br />
urban extension, aquaculture and the<br />
like) have major consequences for the key<br />
ecological components or processes of rivers,<br />
lakes, floodplains and groundwater-fed<br />
wetlands. Dams play a major role in altering<br />
water regimes. By substantially reducing<br />
discharges into oceans, they modify<br />
aquatic habitats and transform flowing<br />
systems (rivers) into still or semi‐still<br />
Figure 8.1<br />
1.5<br />
1.0<br />
0.5<br />
0.0<br />
1970<br />
Biodiversity in freshwater species has declined<br />
by half since 1970<br />
Freshwater, temperate and tropical Living Planet Indexes, 1970-2005<br />
1975<br />
1980<br />
1985<br />
1990<br />
1995<br />
2000<br />
Temperate<br />
Freshwater<br />
Tropical<br />
Note: The Living Planet Index tracks trends in populations of 1,313 vertebrate species<br />
around the world.<br />
Source: WWF 2008.<br />
2005<br />
Map 8.2 Restoration of the Mesopotamian Marshlands in Iraq, March 2003-December 2005<br />
IRAQ<br />
Meyme h<br />
IRAQ<br />
Meyme h<br />
Doveyrich<br />
River or canal Oil flares<br />
Marsh extension 1973<br />
Water<br />
Dry soil<br />
Wet soil or very shallow water<br />
Dark soil<br />
Light soil<br />
Terrestrial vegetation<br />
Other sparse vegetation<br />
Other medium vegetation<br />
Other dense vegetation<br />
Dense hydrophytes (marsh vegetation)<br />
Medium hydrophytes (marsh vegetation)<br />
Sparse hydrophytes (marsh vegetation)<br />
Non-permanent marsh vegetation<br />
Dry vegetation<br />
Xerophytes<br />
S hatt al-Gharaf<br />
E uphrates<br />
Al-Nasiriyah<br />
Tigris<br />
Main Outfall Drain (MOD)<br />
Al-Amarah<br />
1<br />
Al-Qurnah<br />
S hatt<br />
al-Bas rah<br />
Karkheh<br />
1<br />
Al-Nasiriyah<br />
2<br />
Al-Basrah<br />
3<br />
Abadan<br />
S hatt al-Arab<br />
S hatt al-Gharaf<br />
E uphrates<br />
Al-Amarah<br />
2<br />
1<br />
3<br />
8<br />
4<br />
Al-Qurnah<br />
IRAN<br />
IRAN<br />
Khawr<br />
al-Zubair<br />
K arun<br />
Main Outfall Drain (MOD)<br />
Al-Basrah<br />
7<br />
Umm Qasr<br />
Umm Qasr<br />
Abadan<br />
KUWAIT<br />
KUWAIT<br />
8 March 2003 19 December 2005<br />
Tigris<br />
Doveyrich<br />
Shatt al-Basrah<br />
Ka rkheh<br />
Shatt al-Arab<br />
6 5<br />
Khawr<br />
al-Zubair<br />
Karun<br />
Source: Based on UNEP 2006.<br />
Water in a changing world 129
PART<br />
2<br />
Chapter 8<br />
Figure 8.2<br />
Effects by region<br />
Percent<br />
Australasia<br />
South America<br />
Africa<br />
Asia<br />
North and Central America<br />
Europe<br />
Effects by biome type<br />
Percent<br />
systems (wetlands). Some ecosystems<br />
disappear when rivers are regulated or impounded<br />
because of the altered flow and<br />
new barriers to the movement of migratory<br />
species. Humans can also suffer from<br />
forced migration and population displacement,<br />
two well documented social impacts<br />
of dams. 7<br />
0 25 50 75 100<br />
Tundra<br />
Mangroves<br />
Boreal forests/taiga<br />
Temperate coniferous forests<br />
Deserts and xeric shrublands<br />
Effects of river fragmentation and flow<br />
regulation vary by region and biome type, 2005<br />
Tropical and subtropical moist broadleaf forests<br />
Tropical and subtropical coniferous forests<br />
Tropical and subtropical dry broadleaf forests<br />
Tropical and subtropical grasslands, savannahs and shrublands<br />
Montane grasslands and shrublands<br />
Flooded grasslands and savannahs<br />
Temperate grasslands, savannahs and shrublands<br />
Temperate broadleaf and mixed forests<br />
Mediterranean forests, woodlands and scrub<br />
Strongly affected<br />
Strongly affected<br />
Moderately affected<br />
Moderately affected<br />
0 25 50 75 100<br />
Note: The fragmentation and flow indicator was developed by Umea University in Sweden,<br />
in collaboration with the World Resources Institute, for assessing the state of large river<br />
systems. Unaffected river systems have no dams in their catchments but can have dams<br />
in tributaries if flow regulation is less than 2%. A river system is considered ‘affected’ if<br />
there are dams in the main channel but is never classified as ‘strongly affected’ if there are<br />
no dams in the main channel. All river systems with no more than a quarter of their main<br />
channel length left without dams are considered strongly affected.<br />
Source: Based on WWF 2006.<br />
Of the world’s 292 largest river systems in<br />
2005 8 (accounting for 60% of the world’s<br />
runoff), more than a third (105) were considered<br />
to be strongly affected by fragmentation,<br />
and 68 moderately affected. 9 Wetland<br />
ecosystems feel the greatest impact,<br />
but terrestrial ecosystems such as forests<br />
and grasslands are also affected (figure 8.2).<br />
Ecosystem change has accelerated in many<br />
areas, and there is concern that large-scale<br />
changes will make some ecosystems more<br />
vulnerable to water-related agricultural<br />
activities. The non-linear dynamics of ecosystems<br />
may lead to abrupt changes that<br />
can affect their resilience and capacity to<br />
absorb disturbances. 10<br />
Variability and flexibility are needed to<br />
maintain ecosystem resilience. Attempts<br />
to keep systems in some perceived optimal<br />
state, whether for conservation or production,<br />
have often reduced long-term resilience,<br />
making the system more vulnerable<br />
to change. 11 Modifications of landscapes<br />
and reductions of other ecosystem services<br />
have diminished the capacity of ecosystems<br />
to cope with larger-scale and more<br />
complex dynamics through reduced ecosystem<br />
resilience locally and across scales. 12<br />
Water resources development and withdrawals<br />
have led to increased turbidity and<br />
salinity of water and soil, making land and<br />
water management more difficult. Siltation<br />
and heavier sediment loads in rivers, due<br />
partially to river regulation and the resulting<br />
erosion of river banks and the sides<br />
of reservoirs, have turned reservoirs into<br />
sediment traps and reduced the quantity<br />
of sediment being carried into delta areas.<br />
The Aswan Dam on the Nile River is such<br />
a trap; it stops sediment from reaching<br />
the delta front in the Mediterranean to<br />
compensate for sand lost to coastal erosion<br />
created by waves and currents. It has thus<br />
led to faster erosion of the delta and the<br />
coast from Egypt to Lebanon. 13<br />
Water can accumulate in the soil profile<br />
through runoff and groundwater recharge<br />
and from irrigation if the rate of input<br />
exceeds the rate of crop consumption. This<br />
accumulation can lead to water-logging<br />
(when soil pores are filled with water and<br />
oxygen is lacking) and salinization (when<br />
the rising water in the soil profile brings<br />
diluted salts to the surface). Worldwide,<br />
about 10% of irrigated land suffers from<br />
water-logging, resulting in a 20% drop in<br />
water-logged areas. 14<br />
Although a problem worldwide, salinization<br />
is particularly acute in semi-arid areas<br />
130 World Water Development Report 3
impacts of water use on water systems and the environment<br />
PART<br />
2<br />
that are heavily irrigated and are poorly<br />
drained and where salt is never completely<br />
flushed from the land. Such conditions<br />
are found in parts of the Middle East, in<br />
China’s North Plain, in Central Asia and<br />
in the Colorado River basin in the United<br />
States, among others.<br />
Seeking sustainable<br />
management of groundwater<br />
Throughout history groundwater has been<br />
integral to human life and livelihoods and<br />
to stable agricultural production in the<br />
face of hydrologic variability. But groundwater<br />
is not evenly distributed around the<br />
world. Of total annual precipitation of<br />
577,000 cubic kilometres (km 3 ) per year<br />
(based on long-term averages), 79% falls<br />
on the oceans, 2% on lakes and 19% on<br />
land. 15 Most of this evaporates or runs off<br />
into streams and rivers. Only 2,200 km 3 ,<br />
or 2%, is infiltrated into groundwater.<br />
In many public debates declining groundwater<br />
levels or quality are cited as the main<br />
reason for the need for management action,<br />
but resource depletion and degradation are<br />
only part of the problem. Precise data on<br />
the status of groundwater resources are still<br />
not available in sufficient detail to make a<br />
global assessment (see chapters 10 and 13),<br />
and long-term continuous depletion has to<br />
be distinguished from medium-term system<br />
disequilibrium. 16 A more sobering conclusion<br />
drawn from detailed local aquifer<br />
studies is that where groundwater services<br />
are in heavy demand, much of the good<br />
quality groundwater has already been used.<br />
Contemporary recharge to shallow aquifers<br />
has become seriously (perhaps irrevocably)<br />
polluted, and relaxing water abstraction<br />
and pollution pressure on aquifers will take<br />
considerable time. 17<br />
The development of the power-driven<br />
pump in the mid-20th century led to the<br />
emergence of many groundwater-dependent<br />
economies (figure 8.3) 18 and recently<br />
to warnings of the potential adverse<br />
impacts of excessive abstraction and of<br />
aquifer pollution. 19<br />
Groundwater development and the response<br />
of groundwater systems have not<br />
been uniformly documented. Even in<br />
industrial countries political realization of<br />
the economic and social impact of access<br />
to groundwater has tended to come late<br />
(generally after some damage to groundwater<br />
systems has been done), requiring<br />
water resources management agencies<br />
to play ‘catch-up’. Public investment in<br />
groundwater development and protection<br />
has been smaller and more dispersed<br />
than for surface water resources. Needed<br />
most are changes in human behaviour,<br />
which requires a much less technocratic<br />
approach. 20<br />
The Intergovernmental Panel on Climate<br />
Change has highlighted the implications<br />
of accelerated climate change for groundwater,<br />
21 and changes in excess rainfall<br />
(recharge and runoff patterns) are expected<br />
to add to the resource management<br />
burden for both groundwater depletion<br />
and rising water tables, depending on the<br />
region. But these impacts are likely to be<br />
small (and possibly negligible) compared<br />
with the stresses placed on groundwater<br />
systems by current socioeconomic drivers.<br />
Groundwater-use levels, demand<br />
patterns and economic benefits<br />
It is not possible to objectively estimate<br />
the current state of groundwater use<br />
by country, economic sector or aquifer,<br />
though it is evident that some countries<br />
have made strong efforts to manage their<br />
aquifers sustainably and have achieved<br />
good results. The constraints of doing so<br />
have been highlighted for the growing<br />
importance of groundwater in agriculture<br />
through AQUASTAT 22 and for domestic<br />
water by the World Bank Groundwater<br />
Management Advisory Team (GW-MATE)<br />
programme. 23 There has been little<br />
Figure 8.3<br />
Cubic kilometres a year, most recent year available<br />
250<br />
200<br />
150<br />
100<br />
50<br />
0<br />
1950<br />
India<br />
United States<br />
China<br />
Bangladesh<br />
Pakistan<br />
Iran, Islamic Rep.<br />
Mexico<br />
Saudi Arabia<br />
Russian Federation<br />
Japan<br />
France<br />
1960<br />
1970<br />
1980<br />
1990<br />
where<br />
groundwater<br />
services are in<br />
heavy demand,<br />
much of the<br />
good quality<br />
groundwater has<br />
already been used<br />
and recharge to<br />
shallow aquifers<br />
has become<br />
seriously polluted<br />
Groundwater use has grown rapidly in some<br />
countries<br />
2000<br />
Note: Countries with multiple lines have different datasets that do not reconcile.<br />
Source: Based on Margat 2008.<br />
2010<br />
Water in a changing world 131
PART<br />
2<br />
Chapter 8<br />
systematic updating and collection of data<br />
on national groundwater use and resource<br />
status inventories on a global scale. 24 The<br />
situation is improving in Europe, driven<br />
by the monitoring requirements of the<br />
EU Water Framework Directive and a joint<br />
information system for sharing data, the<br />
European Environment Information and<br />
Observation Network (EIONET). Map 8.3<br />
presents the state of knowledge on renewable<br />
and fossil aquifer withdrawals.<br />
Irrigated agriculture is the principal user<br />
of the major sedimentary aquifers of the<br />
Middle East, North Africa, North America<br />
and the Asian alluvial plains of the Punjab<br />
and Terai (map 8.4). Less evident is<br />
the conjunctive use associated with the<br />
concentration of irrigated agriculture and<br />
urban development in many alluvial fan<br />
and delta environments (such as those of<br />
the Chao Praya, Ganges-Brahmaputra, Godavari,<br />
Indus, Krishna, Mekong, Narmada,<br />
Nile, Mississippi, Po, Yangtze and Yellow<br />
Rivers). Reducing stress on these groundwater<br />
systems involves more than groundwater<br />
resources management. It requires<br />
reducing land-based pollution, rehabilitating<br />
degraded habitats and conserving<br />
water resources.<br />
Map 8.3<br />
Annual withdrawals of renewable groundwater sources and non-renewable fossil<br />
aquifers, most recent year available, 1995-2004<br />
Renewable groundwater sources on a national basis<br />
Annual withdrawals<br />
(cubic kilometres)<br />
0-5<br />
5-20<br />
20-100<br />
More than 100<br />
No data<br />
Non-renewable fossil aquifers in North Africa and the Middle East<br />
Aquifer mining (annual<br />
withdrawals, cubic kilometres)<br />
7<br />
Note: National averages can mask the true situation, which can vary dramatically on a local scale.<br />
Source: Based on Margat 2008.<br />
132 World Water Development Report 3
impacts of water use on water systems and the environment<br />
PART<br />
2<br />
Map 8.4 Groundwater use for irrigation on a country basis, most recent year available, 1995-2005<br />
Annual withdrawals<br />
(cubic kilometres)<br />
0-5<br />
5-25<br />
25-50<br />
50-200<br />
No data<br />
Source: Based on Margat 2008.<br />
Socioeconomic drivers of groundwater<br />
development show substantial geographic<br />
differences unrelated to resource availability.<br />
Agricultural demand for groundwater<br />
has often been spurred by both explicit<br />
and hidden subsidies for rural electrification,<br />
irrigation equipment and occasionally<br />
water well construction. In South Asia,<br />
for instance, subsidized rural electrification<br />
to meet irrigation demands has been a key<br />
driver of groundwater use, especially in dryland<br />
areas with no surface water services.<br />
The concentration of drilling, pumping<br />
and water well maintenance services has<br />
progressively reduced the cost of groundwater<br />
exploitation. The flat-rate electrical<br />
energy policy in parts of South Asia (and<br />
subsidized rural electricity elsewhere) is<br />
not the major cause of groundwater resource<br />
overexploitation, but it has allowed<br />
grossly inefficient use of energy in pumping<br />
groundwater from shallow, low-storage<br />
aquifers in hard-rock terrains, effectively<br />
bankrupting state electricity providers. 25<br />
While the rate of agricultural growth<br />
has generally slowed over the past 25<br />
years, the progressive adoption of precision<br />
agriculture (requiring on-demand,<br />
just-in-time irrigation) has considerably<br />
intensified groundwater use and boosted<br />
its productivity. For the most part, pumping<br />
by farmers has been determined less<br />
by groundwater management and more by<br />
the prices of basic commodities and cash<br />
crops compared with the costs of production,<br />
including energy for pumping.<br />
Groundwater is a major source of urban<br />
water supply around the world (map 8.5),<br />
not just in megacities but also in thousands<br />
of medium-size towns. Some cities<br />
(for example, Beijing, Dhaka, Lima, Lusaka<br />
and Mexico City) are located on or near<br />
major aquifers, and urban water utilities<br />
have drawn heavily on groundwater for<br />
their supply. In other cities (for example,<br />
Bangkok, Buenos Aires and Jakarta), the<br />
share of water derived from groundwater<br />
has fallen considerably as a result of aquifer<br />
depletion, saline intrusion or groundwater<br />
pollution.<br />
These trends have tended to obscure<br />
mushrooming growth over the past 10-15<br />
years in private self-supply from groundwater<br />
by residential, commercial and<br />
industrial users in Latin America and<br />
South and South-East Asia. The scale of<br />
exploitation is generally determined by<br />
the cost of access (existence of shallow<br />
aquifers rather than their yield). The<br />
initial impetus for private urban groundwater<br />
use is the inadequacy of the main<br />
utility service level, but once investments<br />
in private wells have been made, water<br />
use tends to continue because, for those<br />
who can afford them, wells usually offer<br />
a less expensive supply of water than<br />
most water utilities, with larger users<br />
paying more because of cross-subsidized<br />
tariffs. As a result, groundwater accounts<br />
for more than 30% of urban water supply<br />
(and a higher proportion by number<br />
of consumers), even in many cities and<br />
towns far from major known aquifers.<br />
Heavy private use of groundwater in<br />
urban areas complicates the finance and<br />
operation of water utility services – both<br />
water supply and sewerage. Increasingly,<br />
Water in a changing world 133
PART<br />
2<br />
Chapter 8<br />
Map 8.5 Groundwater use for drinking water on a country basis, most recent year available, 1995-2005<br />
Annual withdrawals<br />
(cubic kilometres)<br />
0-1<br />
1-5<br />
5-10<br />
10-30<br />
No data<br />
Source: Based on Margat 2008.<br />
African cities are using boreholes to improve<br />
water security, with the aim of easing<br />
pressure on water facilities in densely<br />
populated suburbs.<br />
Social, economic and environmental<br />
risks<br />
Three aquifer characteristics determine<br />
whether groundwater services will ultimately<br />
prove sustainable:<br />
• Vulnerability to pollution under<br />
contaminant pressure from the land<br />
surface.<br />
• Susceptibility to irreversible degradation<br />
from excessive exploitation.<br />
• Renewability of storage reserves under<br />
current and future climate regimes.<br />
These characteristics vary widely by<br />
aquifer type and hydro geologic setting.<br />
Vulnerability to pollution is generally<br />
linked to an aquifer’s accessibility. Aquifers<br />
that are shallow and ‘open’ to regular<br />
and dependable recharge are more likely<br />
to suffer pollution from agrochemicals and<br />
urbanization (in particular, from low-cost<br />
wastewater disposal and careless disposal<br />
of industrial chemicals). Aquifer development<br />
and effluent disposal for urban water<br />
supply have far-reaching implications for<br />
public health, municipal planning and<br />
resource sustainability. The presence of<br />
groundwater initially relieves financial<br />
pressure on urban water service utilities,<br />
but often at the cost of degrading shallow<br />
aquifers and complicating public health<br />
emergencies. In Europe land use zoning is<br />
now used to protect vulnerable key aquifers<br />
that provide municipal water supply,<br />
or deeper confined groundwater sources<br />
are developed that are naturally protected<br />
from urban pollution.<br />
A recent study of the water economics of<br />
the Middle East and North Africa region<br />
estimates that groundwater resource depletion<br />
has substantially reduced GDP in<br />
some countries – Jordan by 2.1%, Yemen<br />
1.5%, Egypt 1.3% and Tunisia 1.2%. 26 Reductions<br />
in groundwater stocks (whether<br />
renewable or non-renewable) appear to<br />
have been translated into reduced economic<br />
productivity of water. More difficult<br />
to assess are the positive economic impacts<br />
of groundwater abstraction and where<br />
access to and use of groundwater results<br />
in economic liberation. Oman, Saudi<br />
Arabia and the United Arab Emirates,<br />
for example, rely almost exclusively on<br />
non-renewable groundwater and desalination<br />
for water supply. In all such calculations,<br />
however, it should be kept in mind<br />
that values for groundwater ‘reserves’ or<br />
‘stocks’ and ‘sustainable yield’ are not<br />
precise, while the partition between ‘renewable’<br />
and ‘non-renewable’ is a further<br />
complication. 27<br />
Sharp points of competition over groundwater<br />
resources between urban and rural<br />
users are now becoming more apparent.<br />
Expanding municipalities and expanding<br />
light industrial and commercial activities<br />
in peri-urban and linked rural areas<br />
are competing with agriculture over<br />
134 World Water Development Report 3
impacts of water use on water systems and the environment<br />
PART<br />
2<br />
groundwater quantity and quality. Even<br />
if agriculture is, within certain limits,<br />
indifferent to groundwater quality, precision<br />
agriculture is likely to be located near<br />
urban areas, and it uses high quantities of<br />
chemical fertilizers, pesticides and fungicides,<br />
which contaminate shallow groundwater.<br />
While relatively benign organic<br />
alternatives to persistent chemical compounds<br />
exist, the impacts of large-scale<br />
commercial farming near cities on what<br />
may be key strategic groundwater reserves<br />
should not be underestimated. Municipalities,<br />
water and environmental regulators<br />
and agricultural agencies are all implicated,<br />
with the evidence pointing to an<br />
enormous disconnect between water and<br />
land use regulations. Effective measures<br />
for groundwater quality protection require<br />
that the two be considered together.<br />
Complex management<br />
Groundwater recharge processes are extremely<br />
complex, and there is still considerable<br />
uncertainty about their relationship<br />
with natural vegetation, land management<br />
and groundwater use. While many specific<br />
local-scale recharge studies are available,<br />
knowledge of the range of recharge modes<br />
across large river basins and their linked<br />
aquifers rarely comes together to form a<br />
systemic overview. For example, in the<br />
complex Ganges-Brahmaputra and Indus<br />
aquifers, snow and glacier melt determine<br />
indirect recharge, but shallow and deep<br />
groundwater circulation emerges in the<br />
piedmont fans and deep alluvial basins,<br />
with re-emergent flows, water-logging and<br />
salinization as a result of surface water and<br />
groundwater interactions perturbed by irrigation.<br />
These systems are at risk but have<br />
not had the same detailed hydrogeological<br />
evaluation as has the similarly complex<br />
Chalk Aquifer of Northwest Europe 28 or<br />
the large regional groundflow systems of<br />
the United States. 29<br />
For many heavily exploited aquifers<br />
groundwater abstraction and use are still<br />
poorly quantified, and dedicated groundwater<br />
monitoring networks have not<br />
been established (see chapter 13). Instead,<br />
periodic head observations are made of<br />
pumped wells, which give only an approximate<br />
measure and are completely inadequate<br />
for detecting response to recharge<br />
events. Many cities are working ‘blind’<br />
when they distribute water supplied from<br />
groundwater sources. There are reported<br />
cases of drops in drinking water production,<br />
subsidence due to excess pumping<br />
(see box 12.4 in chapter 12), leakages<br />
from drinking water supply systems into<br />
shallow aquifers and even contamination<br />
(leaks from sanitation networks or leachates<br />
from wastes).<br />
Much is expected of water harvesting and<br />
managed aquifer recharge – and many<br />
assumptions are made about the potential<br />
for recharge. In some hydrogeologic<br />
settings it is difficult to improve on the<br />
efficiency of natural recharge processes,<br />
while in others the economically feasible<br />
proportion of recharge enhancement<br />
over natural recharge is very limited,<br />
although the techniques can help solve<br />
local problems and improve groundwater<br />
quality. The highest management priority,<br />
though, will always be to protect the main<br />
recharge zones.<br />
Resource prospects and future<br />
management needs<br />
Population and income growth projections<br />
and associated increases in water demand<br />
will place unprecedented demands on aquifer<br />
systems. Further depletion and degradation<br />
of aquifers should be anticipated<br />
unless there is much more investment in<br />
effective governance and management<br />
practices. In addition, climate change will<br />
place some key aquifers under additional<br />
pressure.<br />
In heavily populated areas with large<br />
numbers of irrigation systems using<br />
groundwater, communities will need to<br />
self-regulate resource use. Approaches<br />
pioneered in Tunisia are now being put<br />
forward in South Asia. Resource management<br />
institutions need to better understand<br />
the socioeconomic drivers to which<br />
irrigated agricultural users respond. Social<br />
marketing of basic groundwater information<br />
to farmers can have a positive<br />
impact, as in the case of Andhra Pradesh<br />
farmer-managed groundwater systems<br />
in India. 30 It is important to identify the<br />
kind of information that will catalyse selfregulation.<br />
Demand-side approaches that<br />
focus on obtaining consensus on aquifer<br />
use may have more success in the long run<br />
than technical supply-side or hardware-led<br />
approaches.<br />
In and around large urban areas economic<br />
competition for water is forcing agriculture<br />
to adapt – by boosting its productivity<br />
and minimizing its environmental<br />
impact – or to disappear. Demand for<br />
precision agriculture will be unrelenting,<br />
and further concentration of agricultural<br />
activity can be expected as market chains<br />
are reinforced (cold storage, niche global<br />
markets and the like), along with further<br />
adoption of agronomy advances such<br />
as deficit irrigation and subsurface drip.<br />
Municipalities,<br />
water and<br />
environmental<br />
regulators and<br />
agricultural<br />
agencies are all<br />
implicated in the<br />
failure to manage<br />
groundwater<br />
resources, with the<br />
evidence pointing<br />
to an enormous<br />
disconnect<br />
between water<br />
and land use<br />
regulations<br />
Water in a changing world 135
PART<br />
2<br />
Chapter 8<br />
Information<br />
about pollution<br />
loads and water<br />
quality changes<br />
is lacking in many<br />
countries because<br />
of inadequate<br />
monitoring systems<br />
Box 8.1<br />
While the trend towards more precision<br />
agriculture will boost overall groundwater<br />
productivity, it will not necessarily relieve<br />
abstraction pressure on aquifers because it<br />
will potentially improve the feasibility of<br />
abstraction by larger pumping lifts.<br />
The tension between private and public<br />
services derived from aquifers remains.<br />
More convergent and sustainable resource<br />
use will be achieved only through substantial<br />
investment in management operations<br />
on the ground, working primarily through<br />
community consultation and crosssectoral<br />
policy dialogue. Such dialogue is<br />
supported by shared knowledge and common<br />
understanding of the current situation<br />
and future options, as illustrated in<br />
the country policy support programmes of<br />
the International Commission on Irrigation<br />
and Drainage that have been tested in<br />
river basins in China (Jiaodong Peninsula<br />
and Qiantang River) and India (Brahmani<br />
and Sabarmati). Dialogue on these basins<br />
was supported by a user-friendly model for<br />
investigating risks and adaptation strategies<br />
using a scenario approach for looking<br />
at supply and demand and quantity and<br />
quality for different sectors of use.<br />
Growing risks: pollution and<br />
degradation of water quality<br />
Despite improvements in some regions,<br />
water pollution is on the rise globally.<br />
And unless substantial progress is made in<br />
regulation and enforcement, pollution is<br />
expected to increase as a result of economic<br />
development driven by urbanization,<br />
industries and intensive agriculture<br />
Asian ‘Tigers’ and the hidden tip of the<br />
pollution iceberg<br />
Industrial and economic development<br />
in Asia, especially among rapidly<br />
growing ‘Asian Tiger’ economies, has<br />
in many cases come at the expense of<br />
water resources. Rapid urbanization<br />
across Asia and the Pacific will continue<br />
to shape the parameters of water use<br />
trends, which affect prospects for water<br />
scarcity. Although rural populations in<br />
Asia are projected to remain stable over<br />
the next 20 years, urban populations<br />
are likely to increase by 60% before<br />
2025. While attention focuses on the<br />
multiple challenges of mega cities,<br />
smaller urban areas, with few financial<br />
and technical resources due to their<br />
weak political clout, are set to continue<br />
current trends of poor wastewater management,<br />
posing graver threats to water<br />
resources than physical scarcity does.<br />
Current strategies for economic<br />
development have propelled river<br />
degradation to the top of the water<br />
use agenda. Malaysia, for example,<br />
recently witnessed an increase in the<br />
number of rivers deemed slightly polluted<br />
and a decline in the number of<br />
rivers considered clean. As recognition<br />
of the problem grows, more efforts<br />
are being directed towards river<br />
rehabilitation.<br />
Source: Le-Huu Ti, Chief, Water Security<br />
Section, United Nations Economic and<br />
Social Commission for Asia and the Pacific,<br />
based on information from the Asian River<br />
Restoration Network and the fresh and<br />
coastal waters session at the 3rd Southeast<br />
Asia Water Forum Regional Workshop, 23<br />
October 2007, Kuala Lumpur.<br />
systems. Many industries – some of them<br />
known to be heavily polluting (such as<br />
leather and chemicals) – are moving from<br />
high-income countries to emerging market<br />
economies (box 8.1), where they benefit<br />
from various incentives, a lower-cost workforce<br />
and, in some cases, less stringent<br />
environmental regulations.<br />
Information about pollution loads and<br />
water quality changes is lacking in many<br />
countries because of inadequate monitoring<br />
systems. As a result, the often-serious<br />
impacts of polluting activities on human<br />
and ecosystem health remain unreported<br />
or underreported.<br />
An overview of water quality issues:<br />
the increasing threat from pollution<br />
Pollution’s increasing threat to water quality.<br />
Human-generated water pollution is a<br />
serious threat to human and ecosystem<br />
health, but its impact is hard to quantify.<br />
Despite monitoring inadequacies, there are<br />
local signs that the declining quality of<br />
domestic water supply sources is becoming<br />
a major concern in many countries.<br />
Pollution typically refers to chemicals or<br />
other substances in concentrations greater<br />
than would occur under natural conditions.<br />
Major water pollutants include<br />
microbes, nutrients, heavy metals, organic<br />
chemicals, oil and sediments; heat, which<br />
raises the temperature of the receiving<br />
water, can also be a pollutant. Pollutants<br />
are typically the cause of major water quality<br />
degradation around the world. Virtually<br />
all goods-producing activities generate<br />
pollutants as unwanted by-products (see<br />
chapter 10).<br />
Water pollutants are categorized as point or<br />
non-point according to their primary sources<br />
(table 8.1). Point sources are pollutants<br />
from pipelines and other readily identifiable<br />
sources. Non-point sources are pollutants<br />
mobilized by precipitation as it flows over<br />
the land and infiltrates the soil. Non-point<br />
source pollutant loads in a drainage basin<br />
are a function of precipitation patterns and<br />
the range of human activities in the basin<br />
(especially agriculture). The ecological footprint<br />
of consumption 31 shows where human<br />
activities to meet a population’s needs are<br />
well above the respective region’s biocapacity<br />
(map 8.6), implying that such regions are<br />
running an ecological deficit and depend<br />
increasingly on the natural wealth and<br />
resources of other countries.<br />
The most important water contaminants<br />
created by human activities are microbial<br />
pathogens, nutrients, oxygen-consuming<br />
136 World Water Development Report 3
impacts of water use on water systems and the environment<br />
PART<br />
2<br />
Table 8.1<br />
Comparison of point and non-point sources of water pollution<br />
Point sources<br />
Fairly steady volume and quality<br />
Variability of values typically less than one order of magnitude<br />
Most severe water quality impacts typically occur during low-flow<br />
summer periods<br />
Enters receiving waters at identifiable points, usually through<br />
pipelines or channel sources<br />
Can be quantified with traditional hydraulic techniques<br />
Primary water quality parameters are organic water pollutants<br />
(biological oxygen demand), dissolved oxygen, nutrients, suspended<br />
solids and sometimes heavy metals and synthetic organic chemicals<br />
Control programmes typically applied by government agencies<br />
Non-point sources<br />
Highly dynamic; occurs at random intervals closely related to<br />
hydrologic cycle<br />
Variability of values can range across several orders of magnitude<br />
Most severe water quality impacts occur during or after storm<br />
events<br />
Entry point to receiving waters usually cannot be identified;<br />
typically arises from extensive land areas<br />
Difficult to quantify with traditional techniques<br />
Primary water quality parameters are sediments, nutrients, heavy<br />
metals, synthetic organics, acidity and dissolved oxygen<br />
Control programmes involve individuals not normally considered<br />
in pollution control programmes (such as farmers and urban<br />
homeowners)<br />
Source: Thornton et al. 1999.<br />
Map 8.6 Ecological footprints and biocapacity, 2000<br />
Ecological footprints on a country basis<br />
Hectares per capita<br />
0-1.5<br />
1.5-3.0<br />
3.0-4.5<br />
4.5-6.0<br />
More than 6.0<br />
No data<br />
Biocapacity on a country basis<br />
Hectares per capita<br />
0-1.5<br />
1.5-3.0<br />
3.0-4.5<br />
4.5-6.0<br />
6.0-9.0<br />
More than 9.0<br />
No data<br />
Note: Ecological footprint is a measure of the area needed to support a population’s lifestyle. This includes the consumption of food, fuel, wood and fibres.<br />
Pollution, such as carbon dioxide emissions, is also counted as part of the footprint. Biocapacity measures how biologically productive land is. It is measured<br />
in ‘global hectares’ – a hectare with the world average biocapacity. Biologically productive land includes cropland, pasture, forests and fisheries.<br />
Source: Ewing et al. 2008.<br />
Water in a changing world 137
PART<br />
2<br />
Chapter 8<br />
Globally, the most<br />
prevalent water<br />
quality problem<br />
is eutrophication<br />
Box 8.2<br />
In 1998 approximately 90% of the<br />
coastal and marine biotopes in the<br />
Baltic Sea were threatened by loss<br />
of area or reduction in quality from<br />
eutrophication, contamination,<br />
fisheries and settlements. Agriculture,<br />
urbanization and atmospheric deposition<br />
were considered the root causes<br />
of eutrophication. For agriculture the<br />
primary causes were mainly inadequate<br />
adoption of modern agricultural<br />
technology and inadequate<br />
integration of environmental and agricultural<br />
practices. The causes of pollution<br />
from urban sources were lack<br />
of investment in wastewater facilities<br />
and high growth rates. Atmospheric<br />
pollution was caused by energy production<br />
and transport in response to<br />
Figure 8.4<br />
Algal blooms per year<br />
100<br />
80<br />
60<br />
40<br />
20<br />
0<br />
1993<br />
Source: UNEP/GIWA 2006.<br />
materials, heavy metals and persistent<br />
organic matter, as well as suspended sediments,<br />
nutrients, pesticides and oxygenconsuming<br />
substances, much of it from<br />
non-point sources. The most important<br />
pollutant affecting human health is microbial<br />
contamination. Inadequate sanitation<br />
facilities, improper wastewater disposal<br />
and animal wastes are the major sources<br />
of microbial pollution. In at least 8 of the<br />
United Nations Environment Programme’s<br />
13 Regional Seas Programme regions, over<br />
50% of the wastewater discharged into<br />
freshwater and coastal areas is untreated,<br />
rising to over 80% in 5 regions. 32<br />
Pollution-causing activities<br />
Globally, the most prevalent water quality<br />
problem is eutrophication, a result of<br />
Addressing eutrophication and its effects in<br />
the Baltic Sea<br />
population growth and urbanization,<br />
increased sea and road traffic, ineffective<br />
laws and regulations to control<br />
emissions and inadequate transport<br />
policy.<br />
Environmental protection legislation<br />
and several new measures in<br />
the region have resulted in some<br />
improvement, as reported in the Helsinki<br />
Commission 2003 assessment.<br />
Phosphorus inputs have decreased<br />
considerably following measures taken<br />
by the Baltic Sea riparian countries,<br />
but eutrophication still remains an<br />
urgent problem in most coastal areas.<br />
Source: Helsinki Commission 2007; Lääne,<br />
Kraav, and Titova 2005.<br />
Increasing frequency of harmful algal blooms<br />
in East China Sea associated with increasing<br />
fertilizer use<br />
Area covered (thousands of square kilometres)<br />
2000<br />
2001<br />
2002<br />
2003<br />
25<br />
20<br />
15<br />
10<br />
5<br />
0<br />
high-nutrient loads (mainly phosphorus<br />
and nitrogen), which substantially impairs<br />
beneficial uses of water (see the example of<br />
the Baltic Sea in box 8.2). Major nutrient<br />
sources include agricultural runoff, domestic<br />
sewage (also a source of microbial<br />
pollution), industrial effluents and atmospheric<br />
inputs from fossil fuel burning and<br />
bush fires. Lakes and reservoirs are particularly<br />
susceptible to the negative impacts<br />
of eutrophication because of their complex<br />
dynamics, relatively longer water residence<br />
times and their role as an integrating sink<br />
for pollutants from their drainage basins. 33<br />
Nitrogen concentrations exceeding 5 milligrams<br />
per litre of water often indicate<br />
pollution from human and animal waste<br />
or fertilizer runoff from agricultural areas.<br />
Excessive nutrient inputs can also cause<br />
harmful algal blooms. Cyanobacteria, also<br />
known as blue-green algae, have increased<br />
in freshwater and coastal systems such<br />
as the East China Sea in recent decades<br />
(figure 8.4). The toxins produced by the<br />
excessive algal blooms are concentrated<br />
by filter-feeding bivalves, fish and other<br />
marine organisms and can cause fish and<br />
shellfish poisoning. In people they can<br />
cause acute poisoning, skin irritation and<br />
gastrointestinal illnesses. There are global<br />
warming implications associated with this<br />
phenomenon, as cyanobacteria have a<br />
competitive advantage over other types of<br />
algae at higher temperatures.<br />
Organic materials, particularly from domestic<br />
wastewater treatment plants, foodprocessing<br />
discharges and algal blooms,<br />
are decomposed by oxygen-consuming<br />
microbes in water bodies, as measured<br />
by biochemical oxygen demand (BOD).<br />
Thermal stratification in nutrient-enriched<br />
lakes with high BOD levels can produce<br />
chemical conditions allowing nutrients<br />
and heavy metals in lake bottom sediments<br />
to re-enter the water column. Lake<br />
Erie’s oxygen-depleted bottom zone, for<br />
example, has expanded since 1998, with<br />
harmful environmental impacts on the<br />
lake’s fisheries. The eastern and southern<br />
coasts of North America, the southern<br />
coasts of China and Japan and large areas<br />
around Europe have also undergone<br />
oxygen depletion. 34 One of the world’s<br />
largest ‘dead zones’ has appeared off the<br />
mouth of the Mississippi River in the Gulf<br />
of Mexico, attributed to excessive nitrogen<br />
loads from the river, with harmful impacts<br />
on biodiversity and fisheries. 35 Projected<br />
food production needs and increasing<br />
wastewater effluents associated with an<br />
increasing population over the next three<br />
decades suggest a 10%-15% increase in the<br />
138 World Water Development Report 3
impacts of water use on water systems and the environment<br />
PART<br />
2<br />
river input of nitrogen loads into coastal<br />
ecosystems, continuing the trend observed<br />
during 1970-95. 36<br />
Heavy metals can accumulate in the tissues<br />
of humans and other organisms. An<br />
example is the serious human health impacts<br />
of the high natural concentrations of<br />
arsenic in groundwater in parts of Bangladesh<br />
and adjacent parts of India (box 8.3).<br />
Mercury and lead from industrial activities,<br />
commercial and artisanal mining and<br />
landfill leachates also threaten human<br />
and ecosystem health in some areas, with<br />
emissions from coal-fired power plants<br />
being a major source of the mercury accumulating<br />
in the tissues of fish at the top<br />
of fish trophic levels.<br />
An emerging water quality concern is<br />
the impact of personal care products and<br />
pharmaceuticals, such as birth control<br />
pills, painkillers and antibiotics, on<br />
aquatic ecosystems. Little is known about<br />
their long-term human or ecosystem<br />
impacts, although some are believed to<br />
mimic natural hormones in humans and<br />
other species.<br />
The level of pollution is a function of the<br />
structure of a country’s economy and its<br />
institutional and legal capacity to address<br />
it. Groundwater systems are very vulnerable<br />
freshwater resources, since once<br />
contaminated, they are difficult and costly<br />
to clean – when cleaning is technically<br />
feasible at all. Pollutants from non-point<br />
sources, such as leaching of excess nitrates<br />
or pesticides used on agricultural lands or<br />
heavy metals in mines, can take decades to<br />
reach the aquifers and once they do it may<br />
be too late or too expensive to act. With<br />
an increasing load of chemical substances<br />
being discharged into water systems and<br />
onto agricultural lands, uncertainties persist<br />
about the long-term effects on human<br />
and ecosystem health. A recent study on<br />
drinking water in France estimated that<br />
more than 3 million people (5.8% of the<br />
population) were exposed to water quality<br />
that does not conform to World Health Organization<br />
(WHO) standards (for nitrates,<br />
non-conformity was found in 97% of<br />
groundwater samples). 37<br />
Storm-generated runoff from agricultural<br />
and urban areas is the most important<br />
non-point pollutant source (such as<br />
leached nitrates in runoff and its accumulation<br />
in rivers) in most countries.<br />
Further, as point sources (such as urban<br />
sewage discharge) are becoming more<br />
controlled, non-point pollutant loads are<br />
becoming an increasing concern. The US<br />
Box 8.3<br />
The arsenic crisis: as yet no solution<br />
Some 10 years have passed since<br />
the extent of the arsenic poisoning<br />
disaster in Bangladesh became widely<br />
known. High levels of arsenic were<br />
found in tubewells constructed for<br />
drinking water. Today, up to 70 million<br />
people in Bangladesh are exposed<br />
to water that contains more than the<br />
World Health Organization threshold<br />
value of 10 micrograms of arsenic<br />
per litre. Up to half the estimated 10<br />
million tubewells in Bangladesh might<br />
be contaminated with arsenic. Large<br />
Environmental Protection Agency, for<br />
example, notes that agricultural activities<br />
contribute the largest quantity of pollutants<br />
to water bodies in the United States,<br />
and the situation is probably similar in<br />
many other countries. 38<br />
Localized pollution occurs frequently with<br />
mining activities. If no mitigation measures<br />
are in place, the pollution can lead to<br />
serious environmental degradation and<br />
water contamination. Negative impacts<br />
include lowering of the water table – with<br />
negative consequences for vegetation,<br />
ecosystems and farming – and groundwater<br />
contamination with heavy metals in<br />
water drained from mines and waste (mine<br />
tailings) affecting downstream ecosystems<br />
and drinking water.<br />
Problems with heavy metals go beyond the<br />
drinking water supply, also affecting food<br />
quality (as with the preferential accumulation<br />
of cadmium in rice grain when effluent<br />
from zinc mines is used for irrigation).<br />
The United Nations Economic Commission<br />
for Europe finds that mining activities<br />
have had severe impacts on water and the<br />
environment in Eastern Europe, South-<br />
East Europe, the Caucasus and Central<br />
Asia. 39 In some river basins (for example,<br />
in Belarus, Kyrgyzstan and Tajikistan) the<br />
mining industry is a major past or current<br />
pollution source, with numerous storage<br />
facilities (such as tailing dams for mining<br />
wastes) presenting substantial risks<br />
(box 8.4).<br />
Progress in mitigating pollution<br />
There are signs of progress in addressing<br />
pollution and pollution risks in different<br />
sectors. There is well documented evidence<br />
that the costs of inaction are high<br />
and that some impacts may be irreversible<br />
or nearly so (contamination of groundwater<br />
drinking water, ecosystem losses). 40<br />
Polluted water has a high human health<br />
amounts of arsenic-contaminated<br />
groundwater have also been used for<br />
irrigation, leading to the appearance<br />
of arsenic in the food chain. Natural<br />
arsenic pollution of drinking water,<br />
although originally linked to Bangladesh<br />
and the state of West Bengal<br />
in India, is now considered a global<br />
threat with as many as 140 million<br />
people affected in 70 countries on all<br />
continents.<br />
Source: Bagchi 2007; Fry et al. 2007.<br />
Water in a changing world 139
PART<br />
2<br />
Chapter 8<br />
Most countries<br />
have legislation to<br />
protect their water<br />
resources, but<br />
implementation<br />
often lags because<br />
responsibilities are<br />
dispersed and the<br />
costs are high<br />
cost. One-tenth of the global burden of<br />
disease (measured in disability-adjusted<br />
life years) can be attributed to water, sanitation<br />
and hygiene, and water and environmental<br />
factors. 41 Other pollution costs<br />
include clean-up, additional treatment<br />
and damage to fisheries, ecosystems and<br />
recreation. Most countries have introduced<br />
legislation to protect their water resources,<br />
but implementation often lags because responsibilities<br />
are dispersed across multiple<br />
institutions and the costs of control and<br />
monitoring are high.<br />
There are examples, mostly in develped<br />
countries, where the ‘polluter pays’ principle<br />
has stimulated changes in attitudes<br />
towards pollution and led to recycling<br />
and reuse, clean processes for industry,<br />
organic farming and so on or collect<br />
and treat effluents with an ‘end of the<br />
pipe’ approach that collects, controls,<br />
treats and monitors performance. However,<br />
investments for such approaches<br />
are lacking at all levels (from household<br />
sanitation and industrial processes to<br />
city waste treatment plants). Experience<br />
from high-income countries shows that<br />
a combination of incentives, including<br />
more stringent regulation, enforcement<br />
and targeted subsidies (where justified),<br />
can boost investments in water pollution<br />
prevention and treatment. Sanitation<br />
systems and sewage treatment (preferably<br />
with industrial discharges separated<br />
from domestic sewage) can reduce the risk<br />
of discharge into natural systems. Such<br />
practices increase production costs for<br />
water services, and effective cost-recovery<br />
systems are needed to ensure that pollution<br />
control remains sustainable.<br />
Urban settlements are the main source<br />
of point-source pollution. In contrast,<br />
Box 8.4<br />
Long-term impacts of mining on ecosystems in transition economies<br />
While pollution-abatement technologies<br />
exist for hazardous substances, their use<br />
in economies in transition is limited to<br />
a small number of economically viable<br />
industrial plants.<br />
In January 2000 a dam holding tailings<br />
from gold extraction overflowed in Baia<br />
Mare in Romania, releasing about 100,000<br />
cubic metres (m 3 ) of waste, including<br />
about 70 tonnes of cyanide and other<br />
heavy metals. The spill affected local rivers,<br />
interrupting the drinking water supply for<br />
about 24 communities and killing several<br />
thousand tonnes of fish. Following this<br />
accident, several EU directives and national<br />
laws were enacted to improve the safety of<br />
mining facilities, and most mining companies<br />
are now using improved technology.<br />
On 29 August 2003 the Sasa lead and<br />
zinc mine in northeastern FYR Macedonia<br />
released some 486,000 tonnes of mine<br />
tailings into the Kamenicka River. Deposits<br />
of large quantities of toxic heavy metal<br />
(including arsenic, cadmium, copper,<br />
lead, manganese, nickel and zinc) and the<br />
release of acidic drainage to surface and<br />
groundwater led to acidification, degradation<br />
of water resources, accumulation of<br />
metals in sediments and bioaccumulation,<br />
with severe ecological impacts. This industrial<br />
pollution accident contaminated the<br />
water source that supplies irrigation water<br />
for 25,000 hectares of farmland, reducing<br />
economic, environmental and agricultural<br />
viability.<br />
Hazardous industrial sites, water pollution and mining hotspots in the<br />
Balkans, 2007<br />
ITALY<br />
2<br />
1<br />
Krsko<br />
(Slovenia)<br />
ZAGREB<br />
CROATIA<br />
Republic of Srpska<br />
Doboj<br />
Brcko<br />
Ugljevik<br />
Vojvodina<br />
ALBANIA<br />
Pancevo<br />
BELGRADE<br />
Kicevo<br />
MACEDONIA<br />
ROMANIA<br />
Lukavac Zajaca Pb-Zn mine<br />
Maglaj Tuzla<br />
& mill<br />
Smederevo<br />
Birac Zvornick<br />
Jajce<br />
Krupanj<br />
Kostolac Majdanpek<br />
Vares<br />
Lazarevac<br />
Veliki<br />
Prahovo<br />
BOSNIA AND<br />
Kolubara<br />
Cerovo<br />
Zenica<br />
Pb-Zn mine Madjan<br />
Kakanj & mill<br />
Lignite mine<br />
Veliki Krivelj<br />
HERZEGOV<strong>IN</strong>A<br />
Srebrenica<br />
& ash deposits<br />
SARAJEVO<br />
Bor<br />
Kozloduy<br />
Pb-Zn mine & mill<br />
Kragujevac<br />
Federation of<br />
Cacak<br />
Cu mining, concentration,<br />
6<br />
Lucani<br />
Bosnia and<br />
smelting, refinery, alloying, etc...<br />
Konjic<br />
Herzegovina<br />
SERBIA<br />
Pb-Zn mine &<br />
Suplja<br />
BULGARIA<br />
Pljevlja<br />
Nis<br />
Gacko<br />
Leposavic<br />
Mojkovac and<br />
Electrolytic Zn Brskovo<br />
Zvecan<br />
smelter & refinery<br />
Tuneli i Pare<br />
Leskovac<br />
Kosovska Mitrovica<br />
MONTENEGRO Rozaje<br />
Trepca<br />
SOFIA<br />
Berane Rudnik Pristina<br />
Niksic<br />
Pernik<br />
Kotor<br />
Badovac Kriva Feja<br />
Djakovic<br />
Kosovo<br />
Cr & Sb mine &<br />
Tivat<br />
PODGORICA<br />
Gnjilan<br />
beneficiation mill<br />
Cetinje<br />
Cu mine &<br />
beneficiation complex Jegunovce<br />
Kriva<br />
Pb-Zn<br />
Shkoder<br />
Lojane Palanka<br />
tailings dam<br />
Sasa<br />
Kumanovo<br />
Fushe-Arrez<br />
Probistip<br />
Tetovo<br />
Zletovo<br />
SKOPJE<br />
Kocani<br />
Rubik Gostivar<br />
Veles<br />
Cu mine & mill<br />
A D R I A T I<br />
Hazardous<br />
industrial site<br />
Mining site<br />
Nuclear power<br />
generation site<br />
Waste disposal site<br />
Republic boundary<br />
Autonomous boundary<br />
Inter-entity boundary line<br />
C S E A<br />
Mining industry<br />
hot spots<br />
Serious water pollution<br />
National capital<br />
1 to 5 million inhabitants<br />
100,000 to 1 million<br />
Durres<br />
Source: Based on UNEP/GRID Arendal 2007.<br />
Smelter complex -<br />
Ferrochromium, Fe<br />
(steel) & Ni smelters<br />
Vlore<br />
Fier<br />
Patos<br />
Subotica<br />
Novi Sad<br />
Sabac<br />
Furshe-Kruje<br />
Sharra<br />
TIRANA<br />
Elbasan<br />
Ballsh<br />
Ohrid<br />
Bitola<br />
Kavadarci<br />
Suvodol<br />
Cu mine & mill<br />
Pb-Zn mine<br />
GREECE<br />
Bucim Radovis<br />
Negotino<br />
Fe-Ni & Sb mine(s)<br />
& ferronickel smelter<br />
The map shows the multiple pollution hot<br />
spots around mining sites in the Balkans<br />
– the result of a long history of mining<br />
and industries with limited pollution<br />
prevention.<br />
Source: UNEP/OCHA 2000; UNEP/GRID Arendal<br />
2007; Koo 2003.<br />
140 World Water Development Report 3
impacts of water use on water systems and the environment<br />
PART<br />
2<br />
economic recession can reduce pollution<br />
(box 8.5).<br />
Box 8.5<br />
Impact of economic recession on pollution in<br />
Eastern Europe<br />
Urban sewage treatment still limited<br />
mainly to high-income countries<br />
To achieve pollution mitigation objectives<br />
for the environment and human health,<br />
improved sanitation must be accompanied<br />
by sewage treatment. Sewage treatment<br />
is the removal of physical, chemical and<br />
biological contaminants from wastewater,<br />
both surface drainage and domestic, using<br />
physical, chemical and biological processes.<br />
The objective is to produce a treated<br />
waste stream (or treated effluent) and solid<br />
waste or sludge suitable for discharge or<br />
reuse back into the environment. 42 Data<br />
on the rates and levels of collection and<br />
treatment of sewage are limited and often<br />
difficult to compare.<br />
Sewage: a problem to manage? More than<br />
80% of sewage in developing countries<br />
is discharged untreated, polluting rivers,<br />
lakes and coastal areas. 43 Even in some<br />
developed countries treatment of urban<br />
wastewater is far from satisfactory. The<br />
OECD online environmental compendium<br />
finds a broad range of applications of tertiary<br />
waste treatment, from 3.6% in Turkey<br />
to 90% in Germany. 44<br />
In most low- and middle-income countries<br />
wastewater is discharged directly<br />
into the sea or rivers without treatment.<br />
Urban wastewater constitutes a significant<br />
pollution load and is particularly hazardous<br />
when mixed with untreated industrial<br />
waste – a common practice. Many large<br />
cities still have no treatment plants or<br />
plants quickly become undersized as urban<br />
population growth outpaces investments.<br />
A nationwide survey in Pakistan found<br />
that only 2% of cities with a population of<br />
more than 10,000 had wastewater treatment<br />
facilities and that less than 30% of<br />
wastewater receives treatment in these<br />
cities. 45 Some 36% of wastewater is used in<br />
agriculture (2.4 million m 3 a day directly<br />
for irrigation and 400,000 m 3 a day is<br />
disposed of in irrigation canals), and 64%<br />
is disposed of in rivers or the Arabian Sea.<br />
In many developing countries waterborne<br />
sanitation systems and pollution mitigation<br />
facilities may not be the most sustainable<br />
option; other improved facilities<br />
may be more suitable (for example, using<br />
lagoons for collective units and ecosanitation<br />
units for rural households; see<br />
box 8.6).<br />
In developed countries wastewater is progressively<br />
coming under control. Over the<br />
last 20 years Europe’s Urban Wastewater<br />
With the economic recession of<br />
the 1990s and a decline in highly<br />
polluting industries, the amount of<br />
wastewater and pollutants discharged<br />
in Eastern European countries fell<br />
considerably. Although many of these<br />
economies have since recovered and<br />
their industrial activity has increased,<br />
the structure of their industrial sectors<br />
has shifted towards less-polluting<br />
industries, especially in the new EU<br />
member states. In compliance with<br />
strict EU legislation, these countries<br />
have also constructed new wastewater<br />
treatment plants, further reducing<br />
pollution.<br />
There has also been a marked reduction<br />
in pesticide and fertilizer use in<br />
Box 8.6<br />
A wastewater river<br />
The Musi River runs through Hyderabad,<br />
one of India’s fastest growing<br />
cities, with a population of 6.8 million<br />
in 2005 and expected to exceed 10<br />
million in 2015. The mostly untreated<br />
domestic and industrial wastewater<br />
from the city fills the dry riverbed,<br />
converting it into a perennial wastewater<br />
river. The wastewater provides<br />
livelihoods to low-income groups of<br />
urban dwellers and migrants from<br />
rural areas in a hidden economy, neither<br />
recognized nor supported by the<br />
local government. Downstream of the<br />
city, Musi water is retained in large and<br />
small reservoirs with the help of weirs<br />
Treatment Directive has resulted in significant<br />
improvements in treatment capacity,<br />
with more advanced wastewater treatment<br />
becoming increasingly common (box 8.7<br />
and figure 8.5). Continuous progress is<br />
being made. Belgium, for example, put in<br />
operation a mega-treatment plant, which<br />
has improved its situation since 2006,<br />
which figure 8.5 reflects.<br />
agriculture, and river quality has consequently<br />
improved in many places.<br />
Water abstractions also declined, falling<br />
70% in industry and agriculture in<br />
the new EU member states and 74%<br />
in agriculture and 50% in industry in<br />
Eastern Europe, Caucasus and Central<br />
Asia compared with 1990.<br />
However, the economic recession also<br />
resulted in a breakdown of essential<br />
systems of water supply and wastewater<br />
treatment in the region. Thus,<br />
many rivers and drinking water supplies,<br />
especially downstream from cities<br />
and industrial and mining regions,<br />
are heavily polluted.<br />
Source: EEA 2003.<br />
and then diverted into irrigation canals<br />
and village tanks to be used by farmers<br />
for crop production, mainly rice.<br />
A clear improvement in river water appearance<br />
and smell can be observed<br />
with increased distance from the city,<br />
and surveys have confirmed quality<br />
improvements. Infection rates of<br />
farmers with intestinal nematodes are<br />
significantly higher close to Hyderabad<br />
than further downstream.<br />
Source: Ensink, Mahmood, and Dalsgaard<br />
2007; Buechler and Devi 2003; van Rooijen,<br />
Turral, and Bigg 2005.<br />
Water from the Musi River sampled at 0, 5, 10, 14, 18, 20, 30 and<br />
40 km downstream of Hyderabad<br />
Photo credit: Jeroen Ensink<br />
Water in a changing world 141
PART<br />
2<br />
Chapter 8<br />
Box 8.7<br />
Setting target for pollution mitigation and<br />
limits for reuse – the example of Europe<br />
The Urban Wastewater Treatment<br />
Directive of the European Union<br />
prescribes the level of treatment<br />
required before discharge. Collecting<br />
systems must be provided for agglomerations<br />
of more than 2,000 people,<br />
and secondary treatment (biological<br />
treatment) must be provided for<br />
agglomerations of more than 2,000<br />
people discharging into freshwater and<br />
estuaries and agglomerations of more<br />
than 10,000 people discharging into<br />
coastal waters. Special requirements<br />
are placed on five determinants of<br />
treatment performance.<br />
Figure 8.5<br />
Percent of population<br />
100<br />
80<br />
60<br />
40<br />
20<br />
0<br />
Netherlands<br />
United Kingdom<br />
Switzerland<br />
Source: Based on OECD 2008a.<br />
Figure 8.6<br />
Water reuse practice<br />
Mature<br />
In expansion<br />
Limited<br />
No reuse<br />
Luxembourg<br />
Germany<br />
Spain<br />
Austria<br />
Denmark<br />
Sweden<br />
Korea, Rep.<br />
Finland<br />
France<br />
New Zealand<br />
Norway<br />
For smaller agglomerations and those<br />
equipped with a collecting system,<br />
treatment must be appropriate,<br />
meaning that the discharge allows the<br />
receiving waters to meet relevant quality<br />
objectives. The European AQUAREC<br />
project proposes seven categories of<br />
water quality for different types of reuse<br />
and compiles microbial and chemical<br />
limits for each category. The limits are<br />
based on recently published guidelines<br />
and risk estimates, including the most<br />
important microbial parameters.<br />
Source: www.eea.europa.eu; Salgot et al. 2006.<br />
Levels and types of wastewater treatment in OECD<br />
countries and selected European countries, 2006<br />
Italy<br />
France<br />
Portugal Turkey<br />
Primary<br />
Secondary<br />
Tertiary<br />
Czech Rep.<br />
Canada<br />
United States<br />
Ireland<br />
Japan<br />
Italy<br />
Poland<br />
Hungary<br />
Iceland<br />
Greece<br />
Belgium<br />
Portugal<br />
Turkey<br />
High level of wastewater reuse in<br />
water-stressed countries, various years<br />
Netherlands<br />
UK Greece<br />
Slovenia<br />
Sweden<br />
Poland<br />
Lithuania Denmark<br />
Estonia Czech Rep.<br />
Hungary<br />
Austria<br />
Romania<br />
Slovak Rep.<br />
Ireland, Finland & Latvia<br />
Low 10% Moderate 20 High 40 Severe<br />
Water stress index<br />
Source: Based on Wintgens and Hochstrat 2006.<br />
Spain<br />
Germany<br />
Belgium<br />
Israel<br />
Canary Islands (Spain)<br />
Balearic Islands (Spain)<br />
Malta<br />
Cyprus<br />
Bulgaria<br />
As more wastewater is treated, cities must<br />
also deal with increasing volumes of<br />
sludge. Dumping and incineration can<br />
transfer pollution from water to soil or<br />
air. Some 60% of the sludge produced by<br />
treatment plants in France is used as fertilizer<br />
in agricultural areas after undergoing<br />
additional treatment, though convincing<br />
people to use the sludge remains a<br />
struggle. 46<br />
Sewage: a resource to use? Increasingly, sewage<br />
is being seen as a resource. A European<br />
Commission–funded project, AQUAREC<br />
(Integrated Concepts for Reuse of Upgraded<br />
Wastewater), identifies several uses<br />
for treated sewage: agricultural irrigation,<br />
urban landscaping and recreational uses,<br />
industrial cooling and processing and indirect<br />
potable water production (through<br />
groundwater recharge, for example). 47<br />
Wastewater is already being reused in<br />
water-stressed countries (figure 8.6). Farmers<br />
in peri-urban areas use streams for<br />
agriculture and aquaculture as in the past,<br />
but now increasingly also use wastewater<br />
and the nutrients in it. Wastewater flows<br />
are typically more reliable than freshwater<br />
sources and are rich in nutrients for the<br />
cultivation of high-value crops. Authorities<br />
are concerned about the practice because<br />
of the potential human health risks and<br />
because it presents obstacles to installing<br />
wastewater treatment plants. Enforcement<br />
of water quality standards is often complicated<br />
by ambiguous lines of authority; for<br />
example, should standards be enforced by<br />
health, agricultural or water supply and<br />
sanitation agencies?<br />
There are no reliable figures on the extent<br />
of wastewater use in agriculture at the<br />
global level, but it is estimated that some<br />
20 million hectares of agricultural land is<br />
irrigated by untreated, partially treated or<br />
wastewater-polluted river water. 48<br />
Restricting the crops that can be grown<br />
with wastewater is difficult because farmers<br />
grow crops that have high demand<br />
in the local market and that are thus the<br />
most profitable to cultivate. Municipal officers<br />
in Pakistan, where untreated wastewater<br />
is used in 80% of cities, indicated<br />
that enforcement was futile as farmers<br />
would reopen wastewater inlets within<br />
hours of their closure. 49 Courts in Pakistan<br />
have found in favour of farmers, ruling<br />
that access to irrigation water is a fundamental<br />
right and that the loss of livelihood<br />
overrides potential health risks.<br />
WHO recently revised its Guidelines for the<br />
Safe Use of Wastewater, Excreta and Greywater<br />
in Agriculture and Aquaculture. 50 The<br />
third edition of the WHO guidelines allows<br />
for risk assessment and management<br />
142 World Water Development Report 3
impacts of water use on water systems and the environment<br />
PART<br />
2<br />
along the entire chain, from wastewater<br />
generation to food consumption; wastewater<br />
treatment is considered one possible<br />
component in a cumulative and<br />
integrated risk management approach.<br />
The guidelines are based on actual risk<br />
(using the cost-effective quantitative<br />
microbial risk assessment approach) and<br />
therefore avoid needlessly strict and expensive<br />
treatment technologies to achieve<br />
standards. The high investment costs for<br />
wastewater treatment are hard to justify in<br />
many developing countries where the national<br />
burden of disease from wastewater<br />
irrigation is just a fraction of that resulting<br />
from continuing poor access to safe<br />
drinking water and adequate sanitation,<br />
and poor hygiene standards. Also, the<br />
cumulative risk management approach<br />
ensures maximum conservation of nutrients<br />
in the waste water, reducing the need<br />
for poor peri-urban farmers to purchase<br />
commercial fertilizer.<br />
The long-term goal of integrated wastewater<br />
management will always be to move<br />
from the unregulated use of untreated<br />
wastewater to the regulated use of wastewater<br />
that has been treated to some extent.<br />
Depending on local possibilities, the level<br />
of treatment can vary if a complementary<br />
health risk reduction strategy is in place,<br />
as explained in the WHO guidelines. This<br />
flexibility will be necessary in low-income<br />
countries so long as the provision of sanitation<br />
infrastructure lags behind urbanization<br />
rates. Options to develop Wastewater<br />
Safety Plans, following the principles of<br />
Water Safety Plans, are currently being<br />
studied.<br />
But even where no wastewater treatment is<br />
available, health risks can still be significantly<br />
reduced. Studies in Ghana show<br />
how cessation of irrigation before harvest<br />
and inexpensive and easily adoptable<br />
wastewater irrigation methods can reduce<br />
fæcal contamination of crops. 51 And studies<br />
in Africa and Asia suggest that a major<br />
source of cross-contamination of food is<br />
unhygienic handling of produce at the<br />
market and in the kitchen. Thus, improving<br />
hygiene is a cost-effective way to<br />
protect public health even before investing<br />
in wastewater treatment. 52<br />
In Asia, in particular, wastewater is used<br />
in aquaculture. Producing fish and aquatic<br />
plants in wastewater-fed ponds provides<br />
income, employment and food for poor<br />
households living in peri-urban areas and<br />
also provides an important supply of affordable<br />
and nutritious food for the urban<br />
population. 53<br />
The risk of parasitic diseases associated<br />
with such wastewater-fed aquaculture has<br />
been well described. 54 Less information is<br />
available on the health effects of chemical<br />
pollutants. The chemistry of toxic<br />
chemicals such as heavy metals in aquatic<br />
environments is complex. However,<br />
concentrations of heavy metals reported<br />
in fish raised in aquaculture do not usually<br />
exceed levels recommended by the<br />
Codex Alimentarius Commission, even in<br />
fish harvested from highly polluted water<br />
with high metal concentrations. 55 A study<br />
on toxic element accumulation in fish<br />
from wastewater-fed fish ponds in Hanoi,<br />
Viet Nam, found generally low levels of<br />
arsenic, cadmium and lead concentrations<br />
– for many samples, below the detection<br />
limit. 56<br />
In Hanoi, Ho Chi Minh City and Phnom<br />
Phenh the most important health problem<br />
farmers associated with wastewater<br />
exposure was skin disease. 57 Epidemiological<br />
studies confirmed that contact with<br />
wastewater was an important risk factor<br />
for dermatitis among farmers engaged in<br />
peri-urban wastewater-fed aquatic food<br />
production. 58 Water spinach cultivated<br />
in wetlands that receive wastewater from<br />
Phnom Penh was highly contaminated<br />
with fæcal bacteria. However, natural<br />
biological and physical processes in the<br />
lake reduced bacterial numbers almost to<br />
WHO guideline levels for irrigation water,<br />
as shown by differences in bacterial counts<br />
at wastewater entry and exit points. 59<br />
Industrial pollution control is<br />
improving<br />
Industries based on organic raw materials<br />
are the largest contributors of organic<br />
pollution, while oil, steel and mining<br />
industries represent the major risk for<br />
heavy metal release. 60 Measures of BOD<br />
per year in industrial wastewater have stabilized<br />
over the past 20 years in industrial<br />
countries, or even decreased slightly, as in<br />
Eastern Europe (see box 8.6).<br />
Industrial pollution is expected to increase<br />
in emerging market economies with economic<br />
and industrial development. More<br />
than half of China’s 21,000 chemical companies<br />
have factories along the country’s<br />
two major river basins – the Yangtze and<br />
the Yellow – which supply drinking water<br />
for tens of million of people. 61 This means<br />
that industrial accidents could have disastrous<br />
consequences in these regions.<br />
In the early years following the widespread<br />
introduction of environmental<br />
regulations, firms tended to invest in end-<br />
Improving hygiene<br />
is a cost-effective<br />
way to protect<br />
public health even<br />
before investing<br />
in wastewater<br />
treatment<br />
Water in a changing world 143
PART<br />
2<br />
Chapter 8<br />
Non-point<br />
pollution from<br />
agriculture and<br />
urban areas<br />
often constitutes<br />
a greater total<br />
pollutant load than<br />
industrial pointsource<br />
pollution<br />
Figure 8.7<br />
Japan<br />
China<br />
Spain<br />
Italy<br />
United Kingdom<br />
Korea, Rep.<br />
United States<br />
Germany<br />
Sweden<br />
France<br />
Brazil<br />
Czech Rep.<br />
Switzerland<br />
India<br />
Australia<br />
Canada<br />
Turkey<br />
Thailand<br />
Hungary<br />
Netherlands<br />
Denmark<br />
Finland<br />
Argentina<br />
Poland<br />
Singapore<br />
Malaysia<br />
Mexico<br />
of‐pipe technologies, such as membrane<br />
technologies, which reduce wastewater<br />
effluent following production to restore<br />
water quality to appropriate standards. But<br />
much industrial wastewater is discharged<br />
without treatment to open watercourses,<br />
reducing the quality of larger volumes of<br />
water and sometimes infiltrating aquifers<br />
and contaminating groundwater resources.<br />
The OECD reports evidence of changing<br />
production processes through investments<br />
in clean production technologies<br />
for industries. 62 There has been a steady<br />
growth in companies seeking certification<br />
through ISO 14001, the international<br />
standard for environmental management<br />
administered by the International Organization<br />
for Standardization. By the end<br />
of 2002 nearly 50,000 companies in 118<br />
countries had received ISO 14001 certification;<br />
Japan and China have the largest<br />
number of certified companies (figure<br />
8.7). 63 Many multinational enterprises<br />
apply high environmental standards to<br />
their activities worldwide, introducing<br />
The number of companies with a certified<br />
system of environmental management varied<br />
considerably by country in 2006<br />
0 5,000 10,000 15,000 20,000 25,000<br />
Number of enterprises and organizations<br />
Note: Data are based on the ISO 14001 certification of the International Organization for<br />
Standardization and registration under the Eco-Management and Audit Scheme (EMAS) of<br />
the European Commission.<br />
Source: ISO 2007.<br />
environmental management systems to<br />
increase environmental performance, thus<br />
contributing to the globalization of better<br />
corporate practices. 64 But recent accidents<br />
involving large multinationals from OECD<br />
countries and the weak environmental<br />
performance of enterprises from emerging<br />
market economies underline the need for<br />
continued vigilance.<br />
Mitigation of non-point source<br />
pollution needs to focus on the source<br />
Rivers that drain major catchment areas<br />
in intensive agriculture areas (such as the<br />
Danube, Ebro, Mississippi, Nile, Po and<br />
Yellow) are major vectors for transmitting<br />
nutrients to the sea, where they often<br />
cause severe eutrophication. It is estimated<br />
that the nitrate load in the 80 main rivers<br />
flowing into the Mediterranean Sea doubled<br />
between 1975 and 1995. 65 Non-point<br />
pollution from agriculture and urban<br />
areas often constitutes a greater total pollutant<br />
load than industrial point-source<br />
pollution and is more difficult to control<br />
when leached into aquifers. Certain types<br />
of agricultural monoculture and in-situ<br />
sanitation may be incompatible with<br />
maintaining groundwater quality. More<br />
balanced agricultural land use and alternative<br />
sanitation measures will be required<br />
in these priority areas.<br />
Pesticides tend to migrate throughout the<br />
environment, ending up in fatty tissues<br />
(fish) and sediments, creating adverse environmental<br />
effects. Pesticide contamination<br />
has increased rapidly since the 1970s,<br />
particularly in freshwater in developing<br />
countries, despite increased regulation<br />
of the use of these bioaccumulating and<br />
highly persistent substances.<br />
Commercial fertilizer consumption in<br />
some high-income countries has stabilized,<br />
or even declined, since the 1990s,<br />
after a period of high growth during<br />
1960-90. 66 In other countries fertilizer use<br />
is still growing rapidly (4% a year in Syria<br />
and 2% in Turkey) and could increase as<br />
much as 50%-70% by 2025 in Turkey. 67<br />
There is less information on pesticide<br />
consumption, although data for France<br />
(the world’s second biggest user) indicate<br />
that consumption has stabilized. Data on<br />
consumption provide only indirect information<br />
on the discharge of pollutants into<br />
the environment.<br />
To improve environmental performance,<br />
intervention is needed for non-point<br />
source activities such as agriculture to<br />
limit the use of nutrients and change production<br />
processes. Interest in sustainable<br />
144 World Water Development Report 3
impacts of water use on water systems and the environment<br />
PART<br />
2<br />
farming is growing, including conservation<br />
agriculture, integrated plant protection<br />
and plant nutrition management.<br />
The contribution of phosphorus to algae<br />
growth stabilized after its use in washing<br />
detergents was restricted in many<br />
locations.<br />
Financing pollution mitigation and<br />
risk management<br />
While the concept of charging polluters<br />
for the damage they impose on the environment<br />
is now widely accepted, this ‘polluter<br />
pays’ principle has had only a slight<br />
impact on behaviour, because the charges<br />
are rarely set high enough and because the<br />
authorities have difficulty setting the level<br />
of charges. To ensure effective pollution<br />
control, pollution charges – a source of<br />
revenue that can be earmarked for environmental<br />
funds and programmes – need<br />
to be combined with regulatory measures.<br />
An alternative form of pollution control<br />
is a trading system for water pollution<br />
quotas. Authorities can begin by setting<br />
overall limits on the emissions of pollutants<br />
into specific water bodies, progressively<br />
reducing the limits over time to<br />
improve water quality. Emissions quotas<br />
would be allocated to polluters based on<br />
current or recent practices or auctioned to<br />
polluters, thereby raising revenue for public<br />
authorities. Polluters who are able to<br />
reduce emissions would sell their quotas to<br />
those less able to do so. All polluters would<br />
have an incentive to reduce emissions, and<br />
most abatement would be carried out by<br />
those who could do it most efficiently and<br />
affordably. Trading schemes must be set up<br />
to respect land zoning and must be monitored<br />
and controlled to protect ‘invisible’<br />
water sources, in particular.<br />
promising developments, however, and<br />
they are discussed briefly below.<br />
Instruments implemented at a national level.<br />
The importance of the services provided<br />
by nature is now widely acknowledged,<br />
although the economic valuation of such<br />
environmental services and estimates of<br />
environmental flows 69 and benefits remain<br />
problematic (box 8.8). Implementation<br />
relies on multistakeholder dialogue and<br />
negotiations based on recognition of<br />
the value of environmental services (see<br />
chapter 14).<br />
But evidence of effective implementation<br />
of environmental flows is still limited.<br />
Lessons from places where environmental<br />
flows have gained ground indicate that<br />
political support may be the most crucial<br />
element. Strong community interest, pressures<br />
from a river basin critically degraded<br />
because of overallocation, and donordriven<br />
or -instigated overdevelopment all<br />
motivated implementation of the concept.<br />
Adoption and implementation of environmental<br />
flows have been particularly strong<br />
where national legislation and policies<br />
assign it a priority within an integrated<br />
water resources management framework<br />
and integrate it into natural resource management<br />
plans at the basin scale.<br />
Examples abound, however, of cases where<br />
interest in environmental flows fails to be<br />
converted into legislative action. The chief<br />
reason for failure is lack of understanding<br />
of the socioeconomic benefits of environmental<br />
flows, of political will to support<br />
implementation and of appropriate legal,<br />
Box 8.8<br />
The importance<br />
of the services<br />
provided by nature<br />
is now widely<br />
acknowledged<br />
Environmental flow assessment in Asia – from<br />
concept to reality<br />
In practice, trading schemes for water pollution<br />
quotas are rare and difficult to apply<br />
successfully. They are especially difficult<br />
to apply to farmers – agriculture being<br />
an important source of non-point water<br />
contamination. 68<br />
Progress in achieving<br />
environmental sustainability<br />
Our capacity to achieve environmental<br />
sustainability has improved but remains<br />
constrained by an incomplete understanding<br />
of the impact of pollution and the<br />
resilience of ecosystems, inadequate monitoring<br />
of the negative impacts of water<br />
use on the environment and institutional<br />
weaknesses that prevent effective implementation<br />
of legal instruments in many<br />
developing countries. There are some<br />
Environmental flows refers to a water<br />
regime within a river, wetland or<br />
coastal zone necessary for maintaining<br />
ecosystems and their services where<br />
there are competing water uses.<br />
The concept emphasizes how water<br />
management strategies may influence<br />
water and is intended as a tool for<br />
ending the disconnect of ecosystems<br />
from livelihoods.<br />
Research in Asia and the Pacific shows<br />
that 23 of 48 countries are undertaking<br />
some activity on environmental<br />
flows (funded by Australia, Japan and<br />
New Zealand). These countries are<br />
moving towards implementing and<br />
integrating an environmental flows<br />
approach into local, regional and<br />
state planning processes and national<br />
legislation and policies. Cambodia,<br />
China, India, the Republic of Korea,<br />
Lao PDR, Malaysia, Nepal, Pakistan,<br />
Thailand and Viet Nam have all adopted<br />
the approach, and some of them<br />
have even incorporated it in national<br />
legislation. Explicit consideration of environmental<br />
flows in the national water<br />
accounts is a further step towards<br />
recognition of environmental water<br />
demands. Interest in adopting an<br />
environmental flows approach is also<br />
spreading in Bangladesh, Indonesia,<br />
Iran, the Philippines and Sri Lanka, as<br />
well as in a number of Central Asian<br />
countries.<br />
Source: Adapted by UNESCAP from China<br />
Ministry of Water Resources 2005; IWMI<br />
2005; Illaszewicz et al. 2005.<br />
Water in a changing world 145
PART<br />
2<br />
Chapter 8<br />
institutional and monitoring arrangements.<br />
In Asia and the Pacific large<br />
transboundary river basins are a special<br />
challenge. With 21 of 38 major watersheds<br />
shared between two or more countries,<br />
cross-border collaboration is needed to address<br />
environmental flows in river restoration<br />
and other projects.<br />
International instruments for ecosystem<br />
protection and pollution mitigation. At the<br />
international level multiple frameworks<br />
(often adopted after a major crisis) support<br />
the protection of water systems and the<br />
mitigation of impacts (see appendix 2).<br />
The OECD monitors the level of commitment<br />
to these instruments by its member<br />
countries 70 as does the European Commission<br />
for its directives. 71<br />
There are also specific regulations on pollution<br />
control and water rights and allocation<br />
at regional and national levels. Such<br />
instruments for the regulation of use and<br />
systems are discussed in chapter 14. In the<br />
European Union member states have to<br />
comply with European Commission directives<br />
focused on water issues, including the<br />
EU Water Framework Directive (2000) and<br />
the EU Urban Waste Treatment Directive<br />
(1991), and deadlines for implementation.<br />
Few countries are yet in full conformity<br />
with those directives, and less than 50% of<br />
the urban waste load is treated. 72<br />
Notes<br />
1.<br />
2.<br />
US Department of Energy 2006.<br />
MEA 2005.<br />
3. Comprehensive Assessment of Water<br />
Management in Agriculture 2007.<br />
4. Comprehensive Assessment of Water<br />
Management in Agriculture 2007.<br />
5. www.grid.unep.ch/activities/<br />
sustainable/tigris/index.php.<br />
6. WWAP 2006.<br />
7. WWAP 2006.<br />
8. A large river system is one with a river<br />
channel section with a virgin mean<br />
annual discharge (discharge before any<br />
significant direct human manipulations)<br />
of at least 350 cubic metres per second<br />
anywhere in the catchment (Dynesius<br />
and Nilsson 1994, as cited in WWAP<br />
2006, p. 176).<br />
9. WWAP 2006.<br />
10. Comprehensive Assessment of Water<br />
Management in Agriculture 2007.<br />
11. Holling and Meffe 1996.<br />
12. Gunderson and Holling 2002.<br />
13. WWAP 2006.<br />
14. Muir 2007.<br />
15. Shiklomanov 2002.<br />
16. Custodio and Llamas 2003.<br />
17. Margat 2008.<br />
18. Burke and Moench 2000; Comprehensive<br />
Assessment of Water Management<br />
in Agriculture 2007.<br />
19. Foster and Chilton 2003. And contemporary<br />
groundwater issues and<br />
management options are discussed on<br />
the Websites and publications of the<br />
World Bank-Groundwater Management<br />
Advisory Team GW-MATE (www.<br />
worldbank.org/gwmate) and UNESCO’s<br />
Groundwater Resources Assessment<br />
under the Pressures of Humanity and<br />
Climate Change (GRAPHIC) programme<br />
(www.unesco.org/water/ihp/graphic).<br />
A partnership led by UNESCO and the<br />
International Association of Hydrogeologists<br />
implements the Internationally<br />
Shared Aquifer Resources Management<br />
initiative, a multiagency effort to<br />
improve understanding of scientific,<br />
socioeconomic, legal, institutional and<br />
environmental issues related to the<br />
management of transboundary aquifers<br />
(www.isarm.net/).<br />
20. Darnault 2008.<br />
21. IPCC 2007.<br />
22. Burke 2003.<br />
23. www.worldbank.org/gwmate.<br />
24. Some work has been done by Robert<br />
Dijon for the United Nations (1976-<br />
90) and by Jean Margat for UNESCO<br />
(2008).<br />
25. Shah, Singh, and Mukherji 2006.<br />
26. World Bank 2007.<br />
27. Foster and Loucks 2006.<br />
28. Downing, Price, and Jones 1993.<br />
29. Alley 1993.<br />
30. www.apfamgs.org.<br />
31. WWF 2006.<br />
32. UNEP/GPA 2006.<br />
33. ILEC 2005; Lääne, Kraav, and Titova<br />
2005.<br />
34. WWAP 2006.<br />
35. MEA 2005.<br />
36. MEA 2005.<br />
37. France, Ministry of Health 2007.<br />
38. US EPA 2007.<br />
39. UNECE 2007.<br />
40. OECD 2008b.<br />
41. Fewtrell et al. 2007.<br />
42. There are three main types of wastewater<br />
treatment systems. Primary treatment<br />
(mechanical treatment technology)<br />
removes part of the suspended<br />
solids, but no ammonium. Secondary<br />
treatment (biological treatment) uses<br />
aerobic or anaerobic micro-organisms<br />
to decompose most of the organic<br />
matter and retain some of the nutrients<br />
(around 20%-30%) and removes<br />
around 75% of the ammonium. Tertiary<br />
treatment (or advanced treatment<br />
technology) removes the organic matter<br />
even more efficiently than secondary<br />
treatment. It generally includes<br />
phosphorus retention and in some cases<br />
nitrogen removal.<br />
43. Scott, Faruqui, and Raschid-Sally 2004.<br />
44. OECD 2008a.<br />
45. IWMI 2003.<br />
46. IFEN 2006.<br />
47. Wintgens and Hochstrat 2006.<br />
48. Scott, Faruqui, and Raschild-Sally 2004;<br />
Keraita et al. 2007a.<br />
49. Ensink et al. 2004.<br />
50. WHO 2006.<br />
51. Keraita et al. 2007b.<br />
52. Ensink, Mahmood, and Dalsgaurd<br />
2007.<br />
53. Leschen, Little, and Bunting 2005.<br />
54. WHO 2006.<br />
55. WHO 2006.<br />
56. Marcussen et al. 2008.<br />
57. Anh, van der Hoek, Cam et al. 2007.<br />
58. Anh, van der Hoek, Ersbøll et al. 2007.<br />
59. Anh, Tram et al. 2007.<br />
60. WWAP 2003.<br />
61. www.minesandcommunities.org/<br />
Action/press973.htm.<br />
62. OECD 2008c.<br />
63. IFEN 2006.<br />
64. WBCSD 2005.<br />
65. Benoit and Comeau 2005.<br />
66. FAO-AQUASTAT database (www.fao.<br />
org/nr/water/aquastat/main/index.stm).<br />
146 World Water Development Report 3
impacts of water use on water systems and the environment<br />
2 PART<br />
67. Benoit and Comeau 2005.<br />
68. Kraemer et al. 2003.<br />
69. See, for example, Dyson, Bergkamp,<br />
and Scanlon 2003 and the International<br />
Water Management Institute’s Global<br />
Environmental Flow Calculator (GEFC)<br />
available at www.iwmi.cgiar.org/Tools_<br />
And_Resources/ Models_and_Software/<br />
GEFC/index.aspx.<br />
70. OECD 2008a.<br />
71. http://ec.europa.eu/environment/<br />
water/water-framework/.<br />
72. Wintgens and Hochstrat 2006.<br />
References<br />
Alley, W. M., ed. 1993. Regional Groundwater<br />
Quality. New York: Van Nostrand<br />
Reinhold.<br />
Anh, V. T., N. T. Tram, L. T. Klank, P. D.<br />
Cam, and A. Dalsgaard. 2007. Faecal<br />
and Protozoan Parasite Contamination<br />
of Water Spinach (Ipomoea Aquatica)<br />
Cultivated in Urban Wastewater in<br />
Phnom Penh, Cambodia. Tropical Medicine<br />
and International Health 12 (S2):<br />
73-81.<br />
Anh, V. T., W. van der Hoek, P. D. Cam,<br />
and A. Dalsgaard. 2007. Perceived<br />
Health Problems among Users of Wastewater<br />
for Aquaculture in Southeast Asian<br />
Cities. Urban Water Journal 4: 269-74.<br />
Anh, V. T., W. van der Hoek, A. K. Ersbøll,<br />
N. V. Thuong, N. D. Tuan, P. D. Cam,<br />
and A. Dalsgaard. 2007. Dermatitis<br />
among Farmers Engaged in Peri-Urban<br />
Aquatic Food Production in Hanoi, Vietnam.<br />
Tropical Medicine and International<br />
Health 12 (S2): 59-65.<br />
Bagchi, S. 2007. Arsenic Threat Reaching<br />
Global Dimensions. Canadian Medical Association<br />
Journal 177 (11): 1344-45.<br />
Benoit, G., and A. Comeau, eds. 2005. A<br />
Sustainable Future for the Mediterranean:<br />
The Blue Plan’s Environment and Development<br />
Outlook. London: Earthscan.<br />
Bixio, D., C. Thoeye, T. Wintgens, R. Hochstrat,<br />
T. Melin, H. Chikurel, A. Aharoni,<br />
and B. Durham. 2006. Wastewater<br />
Reclamation and Reuse in the European<br />
Union and Israel: Status Quo and Future<br />
Prospects. International Review for Environmental<br />
Strategies 6 (2).<br />
Buechler, S., and G. Devi. 2003. Household<br />
Food Security and Wastewater<br />
Dependent Livelihood Activities along<br />
the Musi River in Andhra Pradesh,<br />
India. International Water Management<br />
Institute, Colombo. www.who.int/<br />
water_sanitation_health/wastewater/<br />
gwwufoodsecurity.pdf.<br />
Burke, J. J. 2003. Groundwater for Irrigation:<br />
Productivity Gains and the Need to<br />
Manage Hydro-Environmental Risk. In<br />
Intensive Use of Groundwater: Challenges<br />
and Opportunities, ed., E. Custodio and<br />
M. R. Llamas. Lisse, The Netherlands: A.<br />
A. Balkema Publishers.<br />
Burke, J. J., and M. Moench. 2000. Groundwater<br />
and Society – Resources, Tensions<br />
and Opportunities. New York: United<br />
Nations, Department of Economic and<br />
Social Affairs.<br />
China, Ministry of Water Resources. 2005.<br />
Strategic Planning and Management of<br />
Water Resources in the Haihe and Huaihe<br />
River Basins of China. Beijing: Government<br />
of China.<br />
Comprehensive Assessment of Water<br />
Management in Agriculture. 2007.<br />
Water for Food, Water for Life: A Comprehensive<br />
Assessment of Water Management<br />
in Agriculture. London: Earthscan, and<br />
Colombo: International Water Management<br />
Institute.<br />
Custodio, E., and M. R. Llamas. 2003. Intensive<br />
Use of Groundwater: Introductory<br />
Considerations. In Intensive Use of Groundwater:<br />
Challenges and Opportunities, ed.,<br />
E. Custodio and M. R. Llamas. Lisse, The<br />
Netherlands: A. A. Balkema Publishers.<br />
Darnault, Christophe, ed. 2008. Overexploitation<br />
and Contamination of Shared<br />
Groundwater Resources Management,<br />
(Bio)Technological, and Political Approaches<br />
to Avoid Conflicts. NATO Science for<br />
Peace and Security Series C: Environmental<br />
Security. Dordrecht, Netherlands:<br />
Springer.<br />
Downing, R. A., M. Price, and G. P. Jones.<br />
1993. The Hydrogeology of the Chalk of<br />
North-West Europe. Oxford: Clarendon<br />
Press.<br />
Dyson, M., G. Bergkamp, and J. Scanlon,<br />
ed. 2003. Flow: The Essentials of<br />
Environmental Flows. Gland, Switzerland:<br />
International Union for Conservation of<br />
Nature and Natural Resources.<br />
EEA (European Environment Agency).<br />
2003. Europe’s Environment – The Third<br />
Assessment. State of the Environment<br />
Report 1/2003. Luxembourg: Office for<br />
Official Publications of the European<br />
Communities.<br />
Ensink, J. H. J., T. Mahmood, and A.<br />
Dalsgaard. 2007. Wastewater-Irrigated<br />
Vegetables: Market Handling versus Irrigation<br />
Water Quality. Tropical Medicine<br />
& International Health 12 (2): 2-7.<br />
Ensink, J. H. J., T. Mahmood, W. van der<br />
Hoek, and L. Raschid-Salty. 2004. A<br />
Nationwide Assessment of Wastewater<br />
Use in Pakistan: An Obscure Activity or<br />
a Vitally Important One? Water Policy 6<br />
(2004): 197-206.<br />
Ewing B., S. Goldfinger, M. Wackernagel,<br />
M. Stechbart, S. Rizk, A. Reed, and J.<br />
Kitzes. 2008. The Ecological Footprint<br />
Atlas 2008. Oakland, CA: Global Footprint<br />
Network.<br />
Fewtrell, L., A. Prüss-Üstün, R. Bos, F.<br />
Gore, and J. Bartram. 2007. Water,<br />
Sanitation and Hygiene: Quantifying the<br />
Health Impact at National and Local Levels<br />
in Countries with Incomplete Water Supply<br />
and Sanitation Coverage. Geneva: World<br />
Health Organization.<br />
Foster, S. S. D., and P. J. Chilton. 2003.<br />
Groundwater – the Process and Global<br />
Significance of Aquifer Degradation.<br />
Philosophical Transactions of the Royal<br />
Society London B 358 (1440): 1957-72.<br />
Foster, S. S. D., and D. P. Loucks. 2006.<br />
Non-Renewable Groundwater Resources.<br />
A Guidebook on Socially-Sustainable Management<br />
for Water Policy Makers. Paris:<br />
United Nations Educational, Scientific,<br />
and Cultural Organization.<br />
France, Ministry of Health. 2007. L’eau<br />
potable en France, 2002-2004. Eau et<br />
sante, Guide technique. Paris: Ministere de<br />
la Santé et des Solidarités.<br />
Fry, R. C., P. Navasumrit, C. Valiathan,<br />
J. P. Svensson, B. J. Hogan, M. Luo,<br />
S. Bhattacharya, K. Kandjanapa, S.<br />
Soontararuks, S. Nookabkaew, C.<br />
Mahidol, M. Ruchirawat, and L. D.<br />
Samson. 2007. Activation of Inflammation/NF-κB<br />
Signaling in Infants Born to<br />
Arsenic-Exposed Mothers. PLoS Genetics<br />
3 (11): e207.<br />
Gunderson, L. H., and C. S. Holling, ed.<br />
2002. Panarchy: Understanding Transformations<br />
in Human and Natural Systems.<br />
Washington, DC: Island Press.<br />
Helsinki Commission. 2007. HEL-<br />
COM Releases Annual Report on<br />
2007 Activities. Press release, 24<br />
June, Helsiniki Commission. www.<br />
helcom.fi/press_office/news_helcom/<br />
en_GB/2007AnnualReport/.<br />
Holling, C. S., and G. K. Meffe. 1996.<br />
Command and Control and the Pathology<br />
of Natural Resource Management.<br />
Conservation Biology 10 (2): 328-37.<br />
IFEN (Institut Français de l’Environnement).<br />
2006. L’environnement en<br />
France. Les Syntheses. October 2006<br />
ed. Orléans, France: Institut Français de<br />
l’Environnement.<br />
ILEC (International Lake Environment<br />
Committee Foundation). 2005. Managing<br />
Lakes and Their Basins for Sustainable<br />
Use: A Report for Lake Basin Managers and<br />
Stakeholders. Kusatsu, Japan: International<br />
Lake Environment Committee<br />
Foundation.<br />
Illaszewicz, J., R. Tharme, V. Smakhtin,<br />
and J. Dore, eds. 2005. Environmental<br />
Flows: Rapid Environmental Flow Assessment<br />
for the Huong River Basin, Central<br />
Vietnam. Gland Switzerland: International<br />
Union for Conservation of Nature.<br />
IPCC (Intergovernmental Panel on Climate<br />
Change). 2007. Climate Change<br />
2007: Impacts, Adaptation and Vulnerability.<br />
Contribution of Working Group II to the<br />
Fourth Assessment Report of the Intergovernmental<br />
Panel on Climate Change, ed.,<br />
Water in a changing world 147
PART<br />
2<br />
Chapter 8<br />
M. L. Parry, O. F. Canziani, J. P. Palutikof,<br />
P. J. van der Linden, and C. E. Hanson.<br />
Cambridge, UK: Cambridge University<br />
Press.<br />
ISO (International Organization for<br />
Standardization). 2007. The ISO Survey<br />
of Certifications 2006. Geneva: International<br />
Organization for Standardization.<br />
IWMI (International Water Management<br />
Institute). 2003. Confronting<br />
the Realities of Wastewater Use in<br />
Agriculture. Water Policy Briefing Issue<br />
9. International Water Management<br />
Institute, Colombo. www.iwmi.cgiar.org/<br />
Publications/Water_Policy_Briefs/PDF/<br />
wpb09.pdf.<br />
———. 2005. Environmental Flows: Environment<br />
Perspectives on River Basin Management<br />
in Asia 2 (1). www.eflownet.org/<br />
download_documents/EnvFlowsNL_<br />
Vol_2_Issue_1.pdf.<br />
Keraita, B., F. Konradsen, P. Drechsel, and<br />
R. C. Abaidoo. 2007a. Effect of Low-<br />
Cost Irrigation Methods on Microbial<br />
Contamination of Lettuce Irrigated with<br />
Untreated Wastewater. Tropical Medicine<br />
and International Health 12 (S2): 15-22.<br />
———. 2007b. Reducing Microbial Contamination<br />
on Wastewater-Irrigated Lettuce<br />
by Cessation of Irrigation before Harvesting.<br />
Tropical Medicine and International<br />
Health 12 (S2): 8-14.<br />
Koo, Sasha. 2003. Preliminary Remedial Investigation<br />
of the Potential Impact of an<br />
Environmental Accident on Agriculture<br />
and Irrigation in the Affected Region.<br />
Macedonia Mission Report, 27-31 October,<br />
Food and Agriculture Organization<br />
of the United Nations, Rome.<br />
Kraemer, R. A., Z. G. Castro, R. Seroa da<br />
Motta, and C. Russell. 2003. Economic<br />
Instruments for Water Management: Experiences<br />
from Europe and Implications for<br />
Latin America and the Caribbean. Regional<br />
Policy Dialogue Study Series. Washington,<br />
DC: Inter-American Development<br />
Bank.<br />
Lääne, A., Kraav, E. and G. Titova. 2005.<br />
Global International Waters Assessment.<br />
Baltic Sea, GIWA Regional Assessment<br />
17. Sweden: University of Kalmar, Global<br />
International Water Assessments.<br />
Leschen, W., D. Little, and S. Bunting.<br />
2005. Urban Aquatic Production. Urban<br />
Agriculture Magazine 14: 1-7.<br />
Marcussen, H., K. Joergensen, P. E. Holm,<br />
D. Brocca, R. W. Simmons, and A.<br />
Dalsgaard. 2008. Element Contents and<br />
Food Safety of Water Spinach (Ipomoea<br />
aquatica Forssk) Cultivated with Wastewater<br />
in Hanoi, Vietnam. Environmental Monitoring<br />
and Assessment 139 (1-3): 77-91.<br />
Margat, Jean. 2008. Les eaux souterraines<br />
dans le monde. Orléans, France: Editions<br />
BRGM.<br />
MEA (Millennium Ecosystem Assessment).<br />
2005. Ecosystems and Human Well-being:<br />
Wetlands and Water Synthesis. Washington,<br />
DC: World Resources Institute.<br />
Molle, F., and J. Berkoff. 2006. Cities versus<br />
Agriculture: Revisiting Intersectoral Water<br />
Transfers, Potential Gains and Conflicts.<br />
Comprehensive Assessment of Water<br />
Management in Agriculture Research<br />
Report 10. Colombo: Comprehensive<br />
Assessment Secretariat.<br />
Muir, P. S. 2007. Human Impacts on Ecosystems.<br />
Online Study Book for Students,<br />
Oregon State University, Corvallis,<br />
Oregon.<br />
OECD (Organisation for Economic Cooperation<br />
and Development). 2008a.<br />
OECD Environmental Data Compendium.<br />
Paris: Organisation for Economic Cooperation<br />
and Development. www.oecd.<br />
org/document/49/0,3343,en_2649_<br />
34283_39011377_1_1_1_1,00.html.<br />
———. 2008b. Service Delivery in Fragile<br />
Situations: Key Concepts, Findings and Lessons.<br />
OECD/DAC Discussion Paper. Offprint<br />
of the Journal on Development 9 (3).<br />
Organisation for Economic Co-operation<br />
and Development, Paris.<br />
———. 2008c. OECD Environment Outlook to<br />
2030. Paris: Organisation for Economic<br />
Co-operation and Development.<br />
Salgot, M., E. Huertas, S. Weber, W. Dott,<br />
and J. Hollender. 2006. Waste Water<br />
Reuse and Risks Definition of Key Objectives.<br />
Desalination 187 (1-3): 29-40.<br />
Scott, C. A., N. I. Faruqui, and L. Raschid-<br />
Sally, ed. 2004. Wastewater Use in Irrigated<br />
Agriculture: Confronting the Livelihood<br />
and Environmental Realities. Wallingford,<br />
UK: Cabi Publishing.<br />
Shah, T., O. P. Singh, and A. Mukherji.<br />
2006. Some Aspects of South Asia’s<br />
Groundwater Irrigation Economy:<br />
Analyses from a Survey in India, Pakistan,<br />
Nepal and Bangladesh. Hydrogeology<br />
Journal 14 (3): 286-309.<br />
Shiklomanov, I. A., ed. 2002. Comprehensive<br />
Assessment of Freshwater Resources<br />
of the World: An Assessment of Water<br />
Resources and Water Availability in the<br />
World. Stockholm: Stockholm Environment<br />
Institute.<br />
Thornton, J. A., W. Rast, M. M. Holland,<br />
G. Jolankai, and S.-O. Ryding, ed.<br />
1999. Assessment and Control of Nonpoint<br />
Source Pollution of Aquatic Ecosystems.<br />
Man and the Biosphere Series, Volume<br />
23. Paris: United Nations Educational,<br />
Scientific, and Cultural Organization.<br />
UNECE (United Nations Economic<br />
Commission for Europe). 2007. Our<br />
Waters: Joining Hands across Orders. First<br />
Assessment of Transboundary Rivers, Lakes<br />
and Groundwaters. Geneva and New<br />
York: United Nations. www.unece.org/<br />
env/water/publications/assessment/<br />
assessmentweb_full.pdf.<br />
UNEP (United Nations Environment<br />
Programme). 2006. Iraq Marshlands<br />
Observation System. United Nations Environment<br />
Programme, Division of Early<br />
Warning and Assessment/GRID-Europe,<br />
Geneva. www.grid.unep.ch/activities/<br />
sustainable/tigris/mmos.php.<br />
UNEP (United Nations Environment Programme)/GIWA<br />
(Global International<br />
Waters Assessment). 2006. Challenges<br />
to International Waters: Regional Assessments<br />
in a Global Perspective. Global<br />
International Waters Assessment Final<br />
Report. Nairobi: United Nations Environment<br />
Programme. www.giwa.net/<br />
publications/finalreport/.<br />
UNEP (United Nations Environment Programme)/GPA<br />
(Global Programme<br />
of Action for the Protection of the<br />
Marine Environment from Land-<br />
Based Activities). 2006. The State of<br />
the Marine Environment: Trends and<br />
Processes. The Hague: United Nations<br />
Environment Programme/Global<br />
Programme of Action for the Protection<br />
of the Marine Environment from Land-<br />
Based Activities.<br />
UNEP (United Nations Environment<br />
Programme)/Global Resource Information<br />
Database Arendal. 2007. Balkan<br />
Vital Graphics: Environment without<br />
Borders. United Nations Environment<br />
Programme/Global Resource Information<br />
Database Arendal, Arendal, Norway.<br />
UNEP (United Nations Environment<br />
Programme)/OCHA (Office for the Coordination<br />
of Humanitarian Affairs).<br />
2000. Cyanide Spill at Baia Mare. Spill of<br />
Liquid and Suspended Waste at the Aurul<br />
S.A. Retreatment Plant in Baia Mare.<br />
Assessment Mission Romania, Hungary,<br />
Federal Republic of Yugoslavia, United<br />
Nations Environment Programme,<br />
Geneva.<br />
United Nations. 1976. Groundwater in the<br />
Western Hemisphere. Natural Resources/<br />
Water Series No. 4. New York: United<br />
Nations Department of Technical Cooperation<br />
for Development.<br />
———. 1982. Groundwater in the Eastern<br />
Mediterranean and Western Asia. Natural<br />
Resources/Water Series No. 9. New York:<br />
United Nations Department of Technical<br />
Cooperation for Development.<br />
———. 1983. Groundwater in the Pacific<br />
Region. Natural Resources/Water Series<br />
No.12. New York: United Nations Department<br />
of Technical Cooperation for<br />
Development.<br />
———. 1986. Groundwater in Continental<br />
Asia. Natural Resources/Water Series<br />
No.15. New York: United Nations Department<br />
of Technical Cooperation for<br />
Development.<br />
———. 1988a. Groundwater in North and<br />
West Africa. Natural Resources/Water<br />
Series No.18. New York: United Nations.<br />
———. 1988b. Groundwater in Eastern,<br />
Central, and Southern Africa. Natural<br />
148 World Water Development Report 3
impacts of water use on water systems and the environment<br />
2 PART<br />
Resources/Water Series No.19. New York:<br />
United Nations Department of Technical<br />
Cooperation for Development.<br />
———. 1990. Groundwater in Eastern and<br />
Northern Europe. Natural Resources/<br />
Water Series No.24. New York: United<br />
Nations Department of Technical Cooperation<br />
for Development.<br />
US Department of Energy. 2006. Energy<br />
Demands on Water Resources: Report<br />
to Congress on the Interdependency of<br />
Energy and Water. US Department of<br />
Energy, Washington, DC.<br />
US EPA (Environmental Protection Agency).<br />
2007. National Water Quality Inventory<br />
Report to Congress: 2002 Reporting<br />
Cycle. Office of Water. Washington, DC:<br />
US Environmental Protection Agency.<br />
www.epa.gov/305b/2002report/<br />
report2002305b.pdf.<br />
van Rooijen, D. J., H. Turral, and T. W.<br />
Bigg. 2005. Sponge City: Water Balance<br />
of Mega-City Water Use and Wastewater<br />
Use in Hyderabad, India. Irrigation and<br />
Drainage 54 (S1): S81-S91.<br />
WBCSD (World Business Council for Sustainable<br />
Development). 2005. Water<br />
Facts and Trends. World Business Council<br />
on Sustainable Development, Washington,<br />
DC.<br />
WHO (World Health Organization). 2006.<br />
WHO Guidelines for the Safe Use of Wastewater,<br />
Excreta and Greywater. Geneva:<br />
World Health Organization.<br />
Wintgens T., and R. Hochstrat, eds. 2006.<br />
AQUAREC Integrated Concepts for Reuse<br />
of Upgraded Wastewater: Report on<br />
Integrated Water Reuse Concepts. EVK1-<br />
CT-2002-00130, Deliverable D19, RWTH<br />
Aachen University, Aachen, Germany.<br />
World Bank. 2007. Making the Most of<br />
Scarcity: Accountability for Better Water<br />
Management Results in the Middle East<br />
and North Africa. MENA Development<br />
Report. Washington, DC: World Bank.<br />
WWAP (World Water Assessment Programme).<br />
2003. Water for People, Water<br />
for Life. The World Water Development Report<br />
1. Paris: United Nations Educational,<br />
Scientific, and Cultural Organization, and<br />
New York: Berghahn Books.<br />
———. 2006. The United Nations World Water<br />
Development Report 2. Water: A Shared<br />
Responsibility. Paris: United Nations Educational,<br />
Scientific, and Cultural Organization,<br />
and New York: Berghahn Books.<br />
WWF. 2006. Living Planet Report 2006.<br />
Gland, Switzerland: WWF.<br />
———. 2008. Living Planet Report 2008.<br />
Gland, Switzerland.<br />
Water in a changing world 149
PART<br />
2<br />
Chapter 9<br />
Managing<br />
competition for water<br />
and the pressure<br />
on ecosystems<br />
Author: François Molle and Domitille Vallée<br />
Contributors: Cécile Brugère, Thierry Facon, Jean Margat,<br />
Léna Salamé, Ti Le-Huu and Jon Martin Trondalen<br />
Coordinator: Jean-Marc Faurès (FAO)<br />
Facilitator: Domitille Vallée<br />
Key messages<br />
Competition for water and shortcomings in managing it to meet<br />
the needs of society and the environment call for enhanced societal<br />
responses through improved management, better legislation<br />
and more effective and transparent allocation mechanisms.<br />
Challenges include wise planning for water resources, evaluation<br />
of availability and needs in watersheds, possible reallocation or<br />
storage expansion in existing reservoirs, more emphasis on water<br />
demand management, better balance between equity and efficiency<br />
in water use, inadequate legislative and institutional frameworks<br />
and the rising financial burden of ageing infrastructure.<br />
Water management choices should emerge from informed consultation<br />
and negotiation on the costs and benefits of all options<br />
after considering basin interconnectedness, relationships<br />
between land and water resources, and the consistency and coherence<br />
of decisions with other government policies.<br />
Competition for water exists at all levels<br />
and is forecast to increase with demands<br />
for water in almost all countries. In 2030,<br />
47% of world population will be living in<br />
areas of high water stress. 1 Water management<br />
around the world is deficient in<br />
performance, efficiency and equity. Water<br />
use efficiency, pollution mitigation and<br />
implementation of environmental measures<br />
fall short in most sectors. Access to<br />
basic water services – for drinking, sanitation<br />
and food production – remains insufficient<br />
across developing regions, and more<br />
than 5 billion people – 67% of the world<br />
population – may still be without access to<br />
adequate sanitation in 2030. 2<br />
Increased competition for water and shortcomings<br />
in its management to meet the<br />
needs of society and the environment call<br />
for enhanced societal responses through<br />
improved water management. Challenges<br />
include wise planning for water resources;<br />
evaluation of availability and needs in<br />
watersheds; possible needs for reallocation<br />
or additional storage; the need to balance<br />
equity, efficiency and ecosystem services<br />
in water use; the inadequacy of legislative<br />
and institutional frameworks and the increasing<br />
financial burden of ageing infrastructure.<br />
Substantial efforts are needed in<br />
regulation, mitigation and management,<br />
primarily through community consultation<br />
and cross-sectoral policy involving<br />
the private sector.<br />
Type, extent and effect of<br />
competition for water<br />
Competition among uses and users is<br />
increasing in almost all countries, as are<br />
the links connecting them, calling for<br />
more effective negotiation and allocation<br />
mechanisms.<br />
150 World Water Development Report 3
Managing competition for water and the pressure on ecosystems<br />
PART<br />
2<br />
Basin closure and interconnectedness<br />
Abstraction of water has approached and<br />
in some cases exceeded the threshold of<br />
renewability of water resources in many<br />
river basins, leading to widespread damage<br />
to ecosystems. Demand for water is<br />
often highest when availability is lowest,<br />
and water shortages and conflicts have<br />
increased accordingly. This trend has been<br />
paralleled by degradation in the quality of<br />
surface water and groundwater from the<br />
combined effluents of cities, industries and<br />
agricultural activities. This has exacerbated<br />
economic water scarcity by rendering<br />
water unfit for certain uses and has<br />
harmed human and ecosystem health.<br />
Hydrology, ecology and society are all connected.<br />
Water resources are increasingly<br />
diverted, controlled and used as countries<br />
develop. Water flowing out of sub-basins<br />
is often committed to other downstream<br />
uses, including several often overlooked<br />
functions: flushing-out sediments, diluting<br />
polluted water, controlling salinity intrusion<br />
and sustaining estuarine and coastal<br />
ecosystems. As water in a basin is increasingly<br />
allocated and river discharges fall<br />
short of meeting such commitments some<br />
or all of the time, basins (or sub- basins)<br />
are said to be closing or closed. 3 Water no<br />
longer flows out from the basin – as is happening<br />
in the Jordan River (box 9.1).<br />
Perturbations of the hydrologic cycle in<br />
one location may affect another. This is<br />
most clearly illustrated by the common<br />
upstream-downstream effect, but can take<br />
diverse, often less visible, forms. Figure 9.1<br />
provides examples of the water quantity,<br />
quality, timing and sediment load of<br />
upstream-downstream impacts.<br />
Water also connects aquatic ecosystems.<br />
Relationships among land, water and biota<br />
are complex, and cross-impacts may not<br />
be evident immediately. Groundwater<br />
abstraction generally reduces flows from<br />
underground aquifers back to the surface,<br />
drying up springs and wetlands. In Azraq,<br />
Jordan, for example, groundwater use for<br />
cities and agriculture has resulted in the<br />
desiccation of a Ramsar-designated wetland<br />
associated with high biodiversity and<br />
migratory birds. Dams, through their impacts<br />
on flood-pulse regimes, have altered<br />
complex ecosystems that were providing<br />
valuable services and supporting livelihoods<br />
(such as fisheries, receding agriculture,<br />
pastures, reeds and medicinal plants).<br />
Examples include the Senegal Valley and<br />
the Hadejia-Jama’are plains in northern<br />
Nigeria. 4<br />
Competition and conflict for water<br />
Conflicts about water can occur at all<br />
scales. Local-level conflicts are commonplace<br />
in irrigation systems, where farmers<br />
vie for limited resources. In Northern<br />
Thailand, for example, low flows in the<br />
dry season are diverted by upland farmers<br />
to irrigate their orchards, where use of<br />
pesticides sometimes leads to the pollution<br />
of streams. Conflicts also occur at the scale<br />
of large national river basins (multistate<br />
Indian rivers such as the Cauvery and the<br />
Krishna) or transnational river basins (the<br />
Jordan and the Nile). While conflict resolution<br />
mechanisms and adequate modes<br />
of governance will differ with scale, the<br />
Conflicts around<br />
water can occur<br />
at all scales<br />
Box 9.1<br />
The closure of the lower Jordan River basin<br />
The lower Jordan River, downstream of<br />
Lake Tiberias, flows through the Jordan<br />
rift valley before emptying into the Dead<br />
Sea. Because of Israel’s redirection of the<br />
upper course, the river now receives water<br />
mostly from the Yarmouk River, a tributary<br />
originating in Syria, and from a few lateral<br />
wadis that incise the two mountain ranges<br />
that run parallel to the valley on each side.<br />
Most of the population and cities, together<br />
with the bulk of the country’s rain-fed<br />
agriculture and increasing groundwaterbased<br />
irrigation, are concentrated in these<br />
highlands. In the east bank of the valley<br />
some 23,000 hectares of irrigated land<br />
have been developed as a result of diversion<br />
of the Yarmouk and side wadis.<br />
The lower Jordan River basin has undergone<br />
a drastic squeeze, with 83% of its<br />
flow consumed before it reaches the Dead<br />
Sea because of diversions in Israel and Syria,<br />
45,000 hectares of irrigated land, mushrooming<br />
cities swollen by waves of refugees<br />
from Palestine and Iraq and immigrants<br />
from the Gulf countries, and the new Wehdah<br />
Dam reservoir on the Yarmouk River.<br />
The consequences of this squeeze are<br />
broad, and some are dire:<br />
• Limited (though still desirable) scope<br />
for efficiency improvement.<br />
• Increased recycling and use of treated<br />
wastewater for irrigation.<br />
• Reallocation of water from the valley<br />
(irrigation) to the highlands (cities).<br />
• Environmental degradation (overdraft<br />
of aquifers in the Azraq oasis and a<br />
declining Dead Sea that now receives<br />
less than 250 million cubic metres of<br />
water).<br />
• A surge in costly supply augmentation<br />
projects aimed at tapping distant<br />
aquifers, transferring water from the<br />
Red Sea to the Dead Sea or desalinating<br />
saline water.<br />
• Increased irregularity and uncertainty<br />
in water supply for irrigation in the valley,<br />
the residual user.<br />
• A more politicized and contested water<br />
policy, with costs and benefits apportioned<br />
across social and ethnic groups<br />
and subregions, yielding different<br />
levels of power.<br />
Source: Courcier, Venot, and Molle 2005.<br />
Water in a changing world 151
PART<br />
2<br />
Chapter 9<br />
Figure 9.1<br />
Examples of hydrologic interactions in river basins – upstream-downstream impacts<br />
Upstream<br />
downstream<br />
Variable<br />
Quantity<br />
Upstream<br />
diversion scheme<br />
on downstream<br />
irrigation area<br />
Water harvesting<br />
(or small tanks) on a<br />
downstream dam<br />
Cities on irrigation<br />
wells (out-pumping)<br />
Wells on qanats a ;<br />
deep wells on<br />
shallow wells<br />
Quality<br />
Cities or industries on<br />
irrigated agriculture<br />
Diffuse pollution<br />
of agriculture on<br />
city supplies<br />
Cities on<br />
groundwater used in<br />
pumping irrigation<br />
(contaminating)<br />
Diffuse agricultural<br />
pollution on village<br />
groundwaterbased<br />
water supply<br />
Timing<br />
Hydropower<br />
generation on large<br />
irrigation schemes<br />
or fisheries<br />
Small tanks on onset<br />
of wet season flows<br />
(delays) and on<br />
biological cues<br />
Hydropower<br />
generation on<br />
wetland ecosystems<br />
Water harvesting<br />
on runoff/flood and<br />
downstream groundwater<br />
recharge (reduced)<br />
Sediment load<br />
Large-scale<br />
deforestation<br />
on reservoirs<br />
Overgrazing, or<br />
erosion in smallholder<br />
agriculture on<br />
reservoir (siltation)<br />
Dam retaining silt<br />
on fertilization<br />
of downstream<br />
floodplains<br />
Diffuse<br />
deforestation<br />
on silt load and<br />
delta fanning<br />
a. Qanat is an ancient system of tunnels and wells built to capture water Point, large-scale user Diffuse, scattered users<br />
in a mountain and channel it to a lower level. or intervention or interventions.<br />
Source: Based on Molle 2008.<br />
nested nature of these scales also means<br />
that the modes of governance will have to<br />
be consistent and interrelated.<br />
Sectoral conflicts. Sectoral conflicts oppose<br />
users from different sectors (domestic, hydropower,<br />
irrigation, industries, recreation<br />
and so on), including ecosystems, whose<br />
sustainability depends on environmental<br />
flows. These conflicts are both economic<br />
(the return per cubic metre differs greatly<br />
across these uses) and political (the social<br />
importance and the political clout of each<br />
sector also varies). Box 9.2 illustrates the<br />
case of conflict between agriculture and<br />
industry in Orissa, India.<br />
Perhaps the most common conflict is<br />
between agriculture and cities. Half the<br />
world lives in cities – and this share is<br />
increasing – while agriculture is generally<br />
the largest user of water. Moving<br />
water from agriculture to uses with higher<br />
economic value is frequently proposed, for<br />
several reasons. Agriculture gets by far the<br />
largest share of diverted water resources<br />
and also consumes the most water through<br />
plant evapotranspiration. Cities are also<br />
thirsty. The value-added of water in nonagricultural<br />
sectors is usually far higher<br />
than in agriculture. This apparent misallocation<br />
is often attributed to government<br />
failure to allocate water rationally. 5<br />
Box 9.2<br />
Conflict between agriculture and industry over water in Orissa, India<br />
The Hirakud Dam in Orissa, India, was the<br />
first multipurpose dam to become operational<br />
after India’s independence in 1947.<br />
Built across the Mahanadi River, it is the<br />
longest and largest earthen dam in the<br />
world, and its reservoir is the largest artificial<br />
lake in Asia. The dam helps control floods<br />
in the Mahanadi, provides irrigation to<br />
155,600 hectares of land and generates up<br />
to 307.5 megawatts of electricity through<br />
its two power plants. Thanks to irrigation<br />
provided by the dam, Sambalpur District is<br />
referred to as the rice bowl of Orissa.<br />
With new state development policies<br />
based on industrialization, the reservoir<br />
started supplying water to industrial plants<br />
pumping from the reservoir. In 2006 the<br />
state government signed memorandums<br />
of understanding with 17 companies to<br />
provide them water from the reservoir.<br />
Meanwhile, 50 years after the dam’s construction,<br />
many downstream areas had yet<br />
to receive irrigation water, and tension was<br />
building between reservoir authorities on<br />
one side and local governments and farmers<br />
associations on the other on water releases<br />
from the dam. In June 2006, 25,000 farmers,<br />
fearing that diversion of water could<br />
deprive more than 20,000 hectares of irrigation<br />
water, formed an 18 kilometre-long<br />
human chain near Sambalpur to protest the<br />
provision of water to industries. Five months<br />
later, in November 2007, 30,000 farmers<br />
gathered at the reservoir to protest. This<br />
large turnout surprised even the protest<br />
organizers and demonstrated the desperation<br />
of farmers over their water supply. Both<br />
events were covered by the media. Under<br />
pressure by the opposition party, Orissa’s<br />
chief minister assured farmers’ representatives<br />
that not a single drop of the farmers’<br />
share would be diverted to industries and<br />
announced a 20 billion rupees package for<br />
canal repair work in the Hirakud area.<br />
Source: Thierry Facon, Food and Agriculture<br />
Organization of the United Nations, Bangkok<br />
regional office, adapted from Kalinga Times 2007<br />
and South Asia Network on Dams, Rivers and<br />
People 2006.<br />
152 World Water Development Report 3
Managing competition for water and the pressure on ecosystems<br />
PART<br />
2<br />
Another common intersectoral conflict is<br />
between hydropower and other sectors,<br />
especially agriculture and fisheries. Because<br />
the energy production of hydropower<br />
plants follows consumer demand, the dams<br />
may release water when downstream irrigators<br />
do not need it. Real-time management<br />
of stored water can result in better outcomes<br />
because it enables water to be released when<br />
needed for multiple users. Dams may also<br />
harm fisheries by impeding fish migration<br />
and reducing productivity by altering the<br />
water regime. Famous conflicts have occurred<br />
on the Columbia River, in the northwestern<br />
United States, where intensive river<br />
damming has affected salmon and other<br />
species. Some dams have been decommissioned<br />
to restore ecosystem connectivity.<br />
Conflict is looming between dams planned<br />
or under construction in the Mekong River<br />
basin and the river-abundant fisheries. It is<br />
feared that the cumulative effects of these<br />
dams, notably those planned on the mainstream<br />
river, will have a deleterious impact<br />
on Tonle Sap, Cambodia’s great lake, and on<br />
the fisheries that provide 60% of the basin<br />
population’s protein intake.<br />
Dams, irrigation schemes and cities consume<br />
water or change flow pathways. The<br />
poor and the environment, the residual user,<br />
bear a disproportionate share of the negative<br />
consequences. Massive upstream diversions<br />
have typically affected downstream lakes<br />
or deltas, such as in the Colorado and the<br />
Indus basins (box 9.3; see also figure 10.2<br />
in chapter 10 and box 11.1 in chapter 11).<br />
Diversion of the lower Ganges River by the<br />
Farraka Dam damaged the ecology of the<br />
Sunderbands wetlands, and the project for<br />
interlinking northern and southern rivers<br />
in India could dramatically compound<br />
these impacts on the Ganges-Brahmaputra<br />
delta. Excess use of groundwater in many<br />
large coastal cities (such as Chennai, Jakarta,<br />
Lima and Tel Aviv) has led to the depletion<br />
of local aquifers and allowed seawater to<br />
intrude and salinize the aquifers.<br />
Meeting water needs during dry seasons<br />
and ensuring security of supply require<br />
water storage. Climate change will intensify<br />
climate irregularity, so that more storage<br />
will be needed to ensure the same level of<br />
security. More water will have to be kept in<br />
reservoirs as reserves for dry spells, leaving<br />
less water for use on average. And this<br />
increased need for storage is occurring at<br />
a time when pressure from users is forcing<br />
water managers to take risks and reduce carryover<br />
stocks. In many regions of the world<br />
the need for more storage is not taken into<br />
account, resulting in a growing frequency<br />
of local crises during extreme drought.<br />
Integrated management of reservoirs in a<br />
river basin is a realistic solution. Part 4 illustrates<br />
possible responses and approaches.<br />
Transboundary competition. When a river<br />
or aquifer crosses a political boundary and<br />
there is competition between sectors or<br />
countries, problems become more complex<br />
Box 9.3<br />
Degradation of the Indus delta environment,<br />
in the downstream reaches<br />
of the Indus River basin, has a long and<br />
complex history. Gradual increases<br />
in irrigation demands and cultivated<br />
areas throughout the basin, punctuated<br />
by years of drought and the construction<br />
of reservoirs, have resulted<br />
in progressive reductions in freshwater<br />
flows to the delta over the last 40 years<br />
and contention over water diversions.<br />
This environmental degradation is<br />
widely acknowledged as stemming<br />
from both local threats, such as<br />
unsustainable fisheries exploitation<br />
and industrial and urban pollution<br />
from nearby Karachi, and external<br />
threats related to competition for<br />
upstream irrigation diversions and<br />
storage water management (ineffective<br />
drainage, low irrigation efficiency<br />
Box 9.4<br />
Competition for water and downstream<br />
impacts in the Indus River basin<br />
After years of being undisturbed by<br />
humans, the Mekong River basin has<br />
undergone rapid change in recent<br />
years. Populations have been displaced<br />
by dams in Thailand, and there<br />
has been protracted conflict over the<br />
impact of the Pak Mun Dam on fisheries.<br />
In Cambodia the loss of lives due<br />
to the release of water from dams on<br />
the upper Se San in Viet Nam have<br />
stirred public awareness of the social<br />
and environmental costs of conventional<br />
infrastructure development.<br />
A major challenge for the basin is<br />
to design hydropower facilities with<br />
minimum impact on fisheries. Mekong<br />
fisheries account for 17% of the world<br />
freshwater fish catch, and numerous<br />
studies have shown the importance<br />
of fish to the diets and incomes of<br />
populations in the basin.<br />
Recent announcements of bilateral<br />
agreements between Lao PDR and<br />
Thailand and between Lao PDR and<br />
Viet Nam for dams on the main stem<br />
and inadequate farming practices, and<br />
reduced freshwater flows).<br />
The poor are bearing the brunt of the<br />
consequences, including water-logging<br />
and increased salinization of land,<br />
aquifers and surface water as reduced<br />
freshwater flows are unable to prevent<br />
seawater intrusion and land erosion,<br />
and reductions in their livelihood<br />
assets and opportunities as a result of<br />
declining fisheries, deteriorating grazing<br />
grounds and reduced agricultural<br />
outputs and related revenues. Drinking<br />
water shortages have led to an increase<br />
in water-related diseases, forcing<br />
households to purchase water from<br />
tankers at great expense and women<br />
and children to spend more time fetching<br />
water from sources farther away.<br />
Source: Brugère and Facon 2007.<br />
Fisheries and hydropower competing in the<br />
Mekong River basin<br />
of the river together with numerous<br />
private contracts agreed by<br />
Cambodia, Lao PDR and Viet Nam<br />
(mostly with companies in China and<br />
South-East Asia) have raised concerns<br />
about whether these new projects<br />
will benefit from the lessons learned<br />
from past mistakes. The marginalization<br />
of regional international players<br />
(such as the Asian Development Bank,<br />
the Mekong River Commission and<br />
the World Bank), the lack of transparency<br />
of the planning processes and<br />
the abruptness of official declarations<br />
about the signed agreements have<br />
left little room for discussion of the<br />
economic soundness and impacts<br />
of the projects. The central concern<br />
remains the fate of fisheries as new<br />
dams are planned on the main stream,<br />
an issue on which specialists at the<br />
Mekong River Commission, the World<br />
Fish Centre and elsewhere have issued<br />
severe warnings.<br />
Source: Molle, Foran, and Käkönen forthcoming;<br />
Mekong River Commission 2008.<br />
Water in a changing world 153
local state<br />
PART<br />
2<br />
Chapter 9<br />
Figure 9.2<br />
Three types of response to water scarcity and<br />
competition<br />
15). A recent shift in emphasis from water<br />
sharing to benefit sharing promises greater<br />
transboundary cooperation.<br />
Canal lining, improved dam management, water management practices,<br />
Conserving<br />
Adopt microirrigation, improve management<br />
change cropping techniques and calendars,<br />
awareness campaigns, volumetric water pricing, institutions<br />
state local<br />
on-farm storage, reduce return flow<br />
Responses<br />
to basin<br />
closure<br />
Tap groundwater,<br />
gate small drains,<br />
introduce conjunctive use<br />
Reservoir building, groundwater abstraction, drains gated, transbasin<br />
diversion, wastewater treatment, desalination, cloud seeding, virtual water<br />
Developing<br />
Change of crops or varieties; arrangements for greater<br />
equity; conflicts, litigation; water grabbing,<br />
bribery; give up (release water)<br />
Sectoral reallocation, quotas, water rights<br />
and markets, basin-level institutions<br />
local state<br />
Allocating<br />
Source: Based on Comprehensive Assessment of Water Management in Agriculture 2007.<br />
and can lead to conflict. The Mekong River<br />
basin has been an exception, with concerns<br />
around water arising only recently. Partly<br />
because of conflicts unrelated to water the<br />
river has long-remained undisturbed, but<br />
dam development to meet the growing<br />
need for energy in most of the riparian<br />
countries is putting other downstream uses<br />
at risk – particularly fisheries (box 9.4).<br />
Despite competing demands and conflict,<br />
however, there is little historic evidence<br />
that water itself has led to international<br />
warfare or that a war over water would<br />
make strategic, hydrographic or economic<br />
sense. 6 At the international level water appears<br />
to provide reasons for trans boundary<br />
cooperation rather than war, often preventing<br />
instead of causing escalation. 7<br />
Many multilateral treaties on freshwater resources<br />
have stressed multiple objectives –<br />
economic development, joint management<br />
and water quality – rather than just water<br />
quantity and hydropower (see appendix<br />
2). 8 The way Mexico and the United States<br />
resolved their dispute over the allocation<br />
of water from the Rio Grande River, which<br />
included a cost-sharing arrangement for<br />
water conservation measures, offers interesting<br />
lessons for the peaceful resolution<br />
of water disputes (see box 15.22 in chapter<br />
Managing competition<br />
through supply and demand<br />
management and reallocation<br />
There are many shortcomings in how water<br />
is managed today in a context of increased<br />
scarcity: low efficiency, environmental degradation,<br />
and inequity. Despite some improvements<br />
competition is increasing and<br />
water use efficiency remains low in most<br />
sectors. But the answer is not just more<br />
efficient allocation mechanisms and more<br />
emphasis on greater yields and productivity,<br />
because these alone may lead to further<br />
losses in equity and environmental sustainability.<br />
Rather, a combination of supply and<br />
demand management measures is needed.<br />
Three common responses to<br />
competition<br />
The responses to increased competition for<br />
water are supply augmentation, conservation<br />
and reallocation (figure 9.2). The most<br />
conventional response is to develop new<br />
resources. For the state this typically means<br />
building new reservoirs or desalination<br />
plants or interbasin transfer. For users this<br />
means more wells or farm ponds or gating<br />
drains to store water. Conserving water<br />
includes increasing the efficiency of use<br />
by reducing losses. Changes in allocation,<br />
to ease competition or to maximize water<br />
use, are based on economic, social, environmental<br />
or other criteria. Augmentation<br />
is a supply management strategy, while<br />
conservation and reallocation are demand<br />
management strategies, roughly defined as<br />
‘doing better with what we have’. 9<br />
Supply augmentation is typically constrained<br />
by the availability of storage sites,<br />
the social and environmental costs and the<br />
rising financial cost of water. With needs<br />
outstripping available stocks in many basins,<br />
transfers between basins have become<br />
more frequent. Amman, Athens, Bangkok,<br />
Kathmandu, Los Angeles and Mexico City<br />
are procuring water further afield. The<br />
massive transfer of water now under way<br />
in China (from the Yangtze River to the<br />
Yellow River) is being emulated in Brazil,<br />
India, Jordan and Thailand. While this<br />
trend is likely to continue, its potential will<br />
gradually be exhausted and its costs will<br />
spiral upwards. Other small-scale options,<br />
such as farm ponds in Asia or wells, have<br />
also been widely developed. Desalination<br />
is an option in specific locations (islands<br />
and coastal cities), but its cost is likely to<br />
remain high (though it is declining) and its<br />
154 World Water Development Report 3
Managing competition for water and the pressure on ecosystems<br />
PART<br />
2<br />
Box 9.5<br />
The untapped potential of marginal-quality water<br />
Non-conventional water resources, especially<br />
marginal-quality water (urban wastewater, agricultural<br />
drainage water and saline surface water<br />
or groundwater), are an important source of<br />
water that is still undervalued.<br />
Urban wastewater use in agriculture remains<br />
limited, except in a few countries with very<br />
meagre water resources (40% of uses in the<br />
Gaza Strip, 15% in Israel and 16% in Egypt with<br />
the reuse of drainage water). Elsewhere, even<br />
where water is scarce, wastewater use accounts<br />
for less than 4% of all uses (2.3% in Cyprus,<br />
2.2% in Syria, 1.1% in Spain and 1.0% in<br />
Tunisia). The use of urban wastewater – treated<br />
or not – is growing, particularly for farming<br />
around cities, often because higher quality<br />
water resources are not available.<br />
Desalination based on brackish water sources<br />
(48%) and seawater (52%) is increasingly affordable<br />
as a result of new membrane technology<br />
($0.60-$0.80 per cubic metre). It is used<br />
mostly for drinking water (24%) and industrial<br />
supplies (9%) in countries that have reached<br />
the limits of their renewable water resources<br />
(such as Cyprus, Israel, Malta and Saudi Arabia;<br />
figure 1). Little is used for agriculture (1%), but<br />
its use for high-value crops in greenhouses is<br />
gradually increasing. Desalination accounted<br />
for only 0.4% of water use in 2004 (nearly 14<br />
cubic kilometres a year; figure 2), but production<br />
should double by 2025.<br />
Source: Blue Plan, MAP, and UNEP 2007.<br />
Figure 1 Desalination capacity in selected countries, 2002<br />
Installed capacity (cubic kilometres a year)<br />
2.5<br />
2.0<br />
1.5<br />
1.0<br />
0.5<br />
0.0<br />
Saudi Arabia<br />
United States<br />
United Arab Emirates<br />
Spain<br />
Source: Based on Maurel 2006.<br />
Kuwait<br />
Japan<br />
Libyan Arab Jamahiriya<br />
Korea, Dem. Rep.<br />
Israel<br />
Qatar<br />
Italy<br />
Iran<br />
China<br />
Algeria<br />
Bahrain<br />
Figure 2 Rapid growth of global installed capacity for desalination,<br />
1966-2004<br />
Installed capacity (cubic kilometres a year)<br />
15<br />
12<br />
9<br />
6<br />
3<br />
0<br />
1966 1970 1980 1984 1986 1988 1990 1992 1994 1996 1998 2000 2002 2004<br />
Source: Based on Maurel 2006.<br />
use limited to urban supply. Other nonconventional<br />
sources of supply include<br />
wastewater, secondary sources (such as<br />
treated irrigation drainage) and the mining<br />
of fossil (non-renewable) aquifers (box 9.5).<br />
Figure 9.3 shows the relative importance of<br />
these sources in selected Middle East and<br />
Mediterranean region countries.<br />
Because of reuse of water in basins and<br />
users’ adjustments to scarcity, fully developed<br />
basins or aquifers tend to have much<br />
less ‘slack’ than is often thought, and the<br />
potential for net water savings at the basin<br />
level is often overstated. When limits<br />
are reached and improved efficiency and<br />
demand management possibilities are exhausted,<br />
there are often no win-win solutions<br />
to meet additional demands. Rather,<br />
resources must be reallocated from one<br />
source to another. These demand management<br />
options are discussed in more detail<br />
in the following section.<br />
Countries rarely resort to all three options<br />
at once unless pressure over the resource<br />
is severe, as in Tunisia (see chapter 15).<br />
Figure 9.3<br />
Percent<br />
100<br />
80<br />
60<br />
40<br />
20<br />
0<br />
Saudi<br />
Arabia<br />
Cyprus<br />
Importance of non-conventional sources<br />
of water for selected Middle East and<br />
Mediterranean region countries, 2000-06<br />
Desalination<br />
Wastewater treatment and reuse<br />
Withdrawals on secondary resources (drainage from irrigation)<br />
Withdrawals on non-renewable resources (mining fossil aquifers)<br />
Withdrawals on primary resources (renewable resources)<br />
Egypt United<br />
Arab<br />
Emirates<br />
Israel<br />
Source: FAO-AQUASTAT; Benoit and Comeau 2005.<br />
Jordan Libyan Malta<br />
Arab<br />
Jamahiriya<br />
Oman<br />
Tunisia<br />
Water in a changing world 155
PART<br />
2<br />
Chapter 9<br />
Large<br />
improvements<br />
are expected<br />
from demand<br />
management,<br />
with savings in<br />
water, energy and<br />
money through<br />
increased efficiency<br />
Mechanisms are needed to make optimal<br />
choices along the spectrum of options.<br />
Optimal choices should emerge from<br />
informed processes of consultation and negotiation<br />
that assess the costs and benefits<br />
of all options, while considering basin<br />
interconnectedness, relationships between<br />
land and water resources and environmental<br />
sustainability. Decisions should be<br />
coherent with other government policies.<br />
Scope for improving demand<br />
management<br />
Large improvements are expected from demand<br />
management, with savings in water,<br />
energy and money through increased<br />
efficiency. Among the strategies that have<br />
contributed to improved water demand<br />
management are:<br />
• Technological improvements. These include<br />
reducing leakage in urban networks,<br />
changing equipment and shifting to<br />
micro-irrigation, biotechnology and<br />
other water-conserving agricultural techniques.<br />
Attention must be directed to impacts<br />
on flow pathways to properly assess<br />
overall water savings (see chapter 3).<br />
• Management approaches. Examples<br />
include cropping-pattern change, water<br />
reuse through sequential uses in irrigation<br />
schemes or urban processes, reuse<br />
in closed-loop systems (industry and<br />
energy sectors) and reallocation across<br />
sectors.<br />
• Economic incentives. Using water pricing,<br />
taxes and fees for demand management<br />
and allocation of water has proved<br />
effective in domestic and industrial sectors,<br />
but these measures are not a workable<br />
option for most irrigation schemes<br />
in developing countries. 10 Payment for<br />
environmental services has been found<br />
to be a useful economic restraint in<br />
some cases (see chapters 4 and 14).<br />
• Legal and regulatory approaches. ‘Polluter<br />
pays’ and ‘user pays’ principles have<br />
reduced both water use and pollution<br />
in industry, and participatory management<br />
has increased user participation<br />
by controlling individual water demands<br />
(see chapter 4).<br />
Urban distribution networks and irrigation<br />
schemes lose large amounts of water<br />
through leakage and percolation. Among<br />
the 23 countries of the Mediterranean Action<br />
Plan, in a region where water stakes<br />
are high, an estimated 25% of water is lost<br />
in urban networks and 20% in irrigation<br />
canals (map 9.1). Realistically, only part of<br />
the water lost can effectively be recovered<br />
technically and at a reasonable cost. Cities<br />
such as Rabat and Tunis have cut their<br />
losses to 10%. 11 Even when the water is<br />
returned to the water system, these losses<br />
and leakages constitute a failure of the supply<br />
infrastructure as they result in significant<br />
financial costs (for producing drinking<br />
water and pumping and transporting<br />
water) and additional environmental and<br />
health risks. Technology (canal lining,<br />
micro- irrigation) can often solve part of<br />
the problem, but a large part of the losses<br />
are due to management or regulatory flaws.<br />
While irrigation losses and inefficiency<br />
appear high, with only a third of the<br />
water supplied reaching plant roots, most<br />
of the losses become return flows, which<br />
are tapped by other users elsewhere in the<br />
basin or serve important environmental<br />
functions. There may be little water to be<br />
saved in fully developed basins, and conservation<br />
interventions can often end up<br />
as reallocation. 12<br />
Localized irrigation (micro-irrigation), for<br />
example, has a limited impact on water<br />
depleted by evapotranspiration in the fields<br />
and chiefly reduces return flows. Thus water<br />
‘saved’ by upstream irrigators can come at<br />
the expense of downstream users, allowing<br />
upstream irrigators to expand their<br />
cultivation. This may be desirable from the<br />
perspective of the upstream farmer, but the<br />
result is increased water depletion.<br />
Price-based regulation was emphasized in<br />
the 1990s for limiting water use, but its<br />
benefits have failed to materialize, most<br />
notably in the irrigation sector. 13 Water<br />
can also be saved by changing behaviours<br />
– through awareness campaigns, quotas or<br />
water pricing (box 9.6).<br />
In the industrial sector a combination of<br />
subsidies, higher water prices and environmental<br />
regulations have encouraged<br />
industries to improve processes and reduce<br />
withdrawals (see chapter 7). It is hard to get<br />
a consolidated picture of how industries<br />
manage water worldwide, but there are global<br />
indications that the business community<br />
is devoting growing attention to water management,<br />
14 as a result of increased efforts to<br />
improve water management. Industries can<br />
realize major savings in natural and financial<br />
resources by raising awareness through<br />
environmental audits and by investing modest<br />
amounts. In agricultural and emerging<br />
market economies the scope for progress<br />
through clean processes is even greater,<br />
since production processes are generally<br />
well below world standards. Multi‐national<br />
156 World Water Development Report 3
Managing competition for water and the pressure on ecosystems<br />
PART<br />
2<br />
Map 9.1<br />
Difference between water withdrawn and water effectively used in Mediterranean<br />
region countries, all uses, 2000-05<br />
3.7<br />
15.6<br />
0.1<br />
0.15<br />
0.3<br />
0.025<br />
Hundreds of cubic<br />
kilometres a year<br />
0.025-7<br />
8-14<br />
15-21<br />
22-28<br />
29-35<br />
36-42<br />
1.1 1.3<br />
16.3<br />
3.2<br />
16.5<br />
1.2<br />
0.09<br />
0.08 0.7<br />
12.2<br />
4.5<br />
0.1<br />
0.4<br />
1.8<br />
1.5<br />
42.0<br />
Source: Jean Margat, adapted from Benoit and Comeau 2005; Blue Plan, MAP, and UNEP 2007.<br />
companies can play a key role. In some<br />
countries public intervention through<br />
subsidies or more stringent enforcement are<br />
necessary. The international competitiveness<br />
of companies in the global market is<br />
enhanced by a commitment to best environmental<br />
practices, which reduce pollution<br />
and improve the efficiency of water use.<br />
At the national level a growing number of<br />
companies are introducing clean production<br />
processes – often for pollution<br />
reduction – that result in substantial water<br />
savings. These efforts are supported by<br />
various UN programmes (United Nations<br />
Environment Programme, United Nations<br />
Industrial Development Organization)<br />
through a network of cleaner production<br />
centres in 27 countries.<br />
Chapters 14 and 15 present several examples<br />
of approaches to demand management.<br />
Reallocation, efficiency and equity<br />
issues<br />
Water, like any resource, when it is scarce<br />
or requires scarce resources to supply<br />
Box 9.6<br />
Signs of progress in urban areas: examples in<br />
Asia and Australia<br />
Water withdrawals increased in Asia<br />
and Australia in all sectors until the<br />
1980s, when withdrawals for agriculture<br />
declined and growth in overall<br />
water withdrawals slowed. There is still<br />
considerable potential for improvement.<br />
Some recent efforts have been<br />
stimulated by the United Nations Economic<br />
and Social Commission for Asia<br />
and the Pacific, which has promoted<br />
the concept of eco-efficiency of water<br />
use and water infrastructure development,<br />
and by complementary research.<br />
Implementation of demand management<br />
measures has been uneven<br />
across the region, but interest in<br />
improving water use efficiency is<br />
growing in many countries. Singapore<br />
has reduced urban domestic water<br />
demand from 176 litres per person a<br />
day in 1994 to 157 litres in 2007 as a<br />
result of additional and targeted public<br />
expenditure for improved demand<br />
management.<br />
In Bangkok and Manila leak detection<br />
programmes have lowered estimated<br />
unaccounted-for water and allowed<br />
postponing the development of new<br />
infrastructure. Effluent charges have<br />
been an important instrument for stimulating<br />
efficient water uses in households<br />
and commercial establishments.<br />
In 2008 Sydney Water in Australia<br />
began providing homes in the Hoxton<br />
Park area with two water supplies –<br />
recycled water and drinking water<br />
(dual reticulation). Recycled water<br />
is to be used for gardens and other<br />
outdoor needs, toilet flushing and potentially<br />
as cold water in washing machines<br />
and for certain non- residential<br />
purposes. The recycled water taps,<br />
pipes and plumbing are coloured purple<br />
to distinguish recycled water from<br />
drinking water.<br />
Source: www.sydneywater.com.au;<br />
UNESCAP 1997, 2004; Kiang 2008.<br />
Water in a changing world 157
PART<br />
2<br />
Chapter 9<br />
Once basic human<br />
and environmental<br />
water needs<br />
have been met,<br />
the remainder<br />
should ideally go<br />
to where water<br />
has the highest<br />
value to society<br />
it, rises in economic value. Once basic<br />
human and environmental water needs<br />
have been met, the remainder should<br />
ideally go to where water has the highest<br />
value to society. Since much water is used<br />
for productive or ‘lifestyle’ purposes, it is<br />
appropriate to apply economic criteria to<br />
its allocation. But water pricing alone will<br />
not produce the necessary reallocation,<br />
since prices in many sectors do not reflect<br />
underlying economic values, and there are<br />
many cases of market or service failure. In<br />
several Eastern European countries price<br />
increases resulted in reductions in urban<br />
water consumption to half the level of two<br />
decades ago. 15 Flow reductions can lead<br />
to secondary water quality problems in<br />
supply networks (increase of water residence<br />
time), odour problems in sewerage<br />
systems and added burdens at wastewater<br />
treatment plants, which become hydraulically<br />
underloaded and have to treat much<br />
denser raw wastewater than before.<br />
Reallocation from lower- to higher-value<br />
uses can be achieved by enabling the<br />
traditional markets as well as by applying<br />
administrative measures, creating water<br />
markets or trading water rights. In each<br />
case society should set appropriate limits<br />
on transfers to protect third parties, the<br />
environment and wider social interest.<br />
Subject to these conditions, competition<br />
for water can be healthy.<br />
In countries that recognize water trading<br />
rights, many cities have met their growing<br />
water needs by purchasing farms or<br />
properties with water rights and taking<br />
over the rights. Some non-governmental<br />
organizations ‘compete’ on behalf of the<br />
environment by purchasing the rights<br />
to a certain volume of water in a river<br />
or lake, which they then leave in the<br />
water body. These are examples of oneoff<br />
transactions. But in certain regions<br />
(Chile, parts of Australia, some western<br />
states of the United States) the conditions<br />
have been created for regular water trading<br />
(see box 4.2 in chapter 4). There,<br />
water markets are commonly used by<br />
farmers wanting supplementary water for<br />
valuable crops during drought conditions<br />
or by cities to create reserves in anticipation<br />
of impending droughts. Prices set in<br />
these markets signal the marginal values<br />
of water in these different uses, which<br />
are usually much higher than average<br />
values. 16<br />
These ‘efficiency’ criteria need to be<br />
reconciled with society’s desire for equity<br />
(the satisfaction of basic needs) and environmental<br />
sustainability. Such balancing<br />
of water needs can be achieved by a<br />
combination of administrative allocation,<br />
tariff structures with adequate provisions<br />
to protect the poor and other relevant<br />
measures. There is a role for subsidies in<br />
water services, but they should be carefully<br />
targeted to specific functions. Poor<br />
people and other disadvantaged groups<br />
without sustainable access to safe water<br />
and adequate sanitation are usually<br />
willing to pay within their means for<br />
reliable access to service because improving<br />
access (through standpipes or household<br />
connections) yields large financial<br />
dividends.<br />
The Comprehensive Assessment of Water<br />
Management in Agriculture argues for<br />
reforms to enable more efficient use of<br />
water. 17 Policy-makers need to recognize<br />
the incentives and resource constraints<br />
confronting small farmers, but it would<br />
be a mistake to assume that farmers do<br />
not respond to market incentives (food<br />
prices have an impact on cropping patterns).<br />
Farmers will invest in inputs and<br />
irrigation technology (meaning higher<br />
water costs) if they believe that they will<br />
achieve higher returns. There is no reason<br />
for efficiency, equity and environmental<br />
sustainability to be out of alignment in<br />
that case.<br />
Notes<br />
1.<br />
2.<br />
3.<br />
OECD 2008.<br />
OECD 2008.<br />
Molle, Wester, and Hirsch 2007.<br />
4. Barreteau, Bousquet, and Attonaty<br />
2001; Barbier and Thompson 1998;<br />
Neiland et al. 2000.<br />
5. Molle and Berkoff 2005.<br />
6. Wolf, Yoffe, and Giordano 2003; Gleick<br />
2008.<br />
7. van der Molen and Hildering 2005.<br />
8. Wolf, Yoffe, and Giordano 2003.<br />
9. Winpenny 1994.<br />
10. Molle and Berkoff 2008.<br />
11. Blue Plan, MAP, and UNEP 2007.<br />
12. Molle, Berkoff, and Barker 2005; Molle,<br />
Wester, and Hirsch 2007; Molle et al.<br />
2008.<br />
13. Molle and Berkoff 2008.<br />
14. WBCSD n.d.; World Economic Forum<br />
2008.<br />
15. Somlyódy and Varis 2006.<br />
16. Winpenny 1994; Molle and Berkoff 2005.<br />
17. Comprehensive Assessment of Water<br />
Management in Agriculture 2007.<br />
References<br />
Barbier, E. B., and J. R. Thompson. 1998.<br />
The Value of Water: Floodplain versus<br />
Large-Scale Irrigation Benefits in Northern<br />
Nigeria. Ambio 27 (6): 434-40.<br />
Barreteau O., F. Bousquet, and J.-M. Attonaty.<br />
2001. Role-Playing Games for<br />
158 World Water Development Report 3
Managing competition for water and the pressure on ecosystems<br />
2 PART<br />
Opening the Black Box of Multi-Agent<br />
Systems: Method and Lessons of Its Application<br />
to Senegal River Valley Irrigated<br />
Systems. Journal of Artificial Societies and<br />
Social Simulation 4 (2).<br />
Benoit, G., and A. Comeau, eds. 2005. A<br />
Sustainable Future for the Mediterranean:<br />
The Blue Plan’s Environment and Development<br />
Outlook. London: Earthscan.<br />
Blue Plan, MAP (Mediterranean Action<br />
Plan), and UNEP (United Nations<br />
Environment Programme). 2007. Water<br />
Demand Management, Progress and<br />
Policies: Proceedings of the3rd Regional<br />
Workshop on Water and Sustainable<br />
Development in the Mediterranean Zaragoza,<br />
Spain, 19-21 March. MAP Technical<br />
Reports Series 168. Athens: United<br />
Nations Environment Programme.<br />
Brugère, C., and T. Facon. 2007. Doomed<br />
Delta? Challenges to Improved Governance,<br />
Planning and Mitigation Measures<br />
in the Indus Delta. Paper presented at<br />
the International Delta 2007 Conference<br />
on Managing the Coastal Land-Water<br />
Interface in Tropical Delta Systems, 7-9<br />
November, Bang Sean, Thailand.<br />
Comprehensive Assessment of Water<br />
Management in Agriculture. 2007.<br />
Water for Food, Water for Life: A Comprehensive<br />
Assessment of Water Management<br />
in Agriculture. London: Earthscan, and<br />
Colombo: International Water Management<br />
Institute.<br />
Courcier, R., J. P. Venot, and F. Molle.<br />
2005. Historical Transformations of the<br />
Lower Jordan River Basin: Changes in<br />
Water Use and Projections (1950 – 2025).<br />
Comprehensive Assessment of Water Management<br />
in Agriculture Research Report 9.<br />
Colombo: Comprehensive Assessment<br />
Secretariat, International Water Management<br />
Institute.<br />
Gleick, P. H. 2008. Water Conflict Chronology.<br />
Pacific Institute, Oakland, CA. www.<br />
worldwater.org/conflictchronology.pdf.<br />
Kalinga Times. 2007. Stop Corporate<br />
Control over Water: Farmers Warn Govt.<br />
www.kalingatimes.com/orissa_news/<br />
news/20070111_farmers_warn_govt.htm.<br />
Kiang, Tay Teck. 2008. Singapore’s Experience<br />
in Water Demand Management.<br />
Paper presented at the 13th International<br />
Water Resources Association World Water<br />
Congress, 1-4 September, Montpellier,<br />
France.<br />
Maurel, A. 2006. Dessalement de L’eau de<br />
Mer et des Eaux Saumâtres: et Autres<br />
Procédés Non Conventionneles d’approvisionnement<br />
en Eau Douce. 2eme édition.<br />
Cachan, France: Tec & Doc Lavoisier.<br />
Mekong River Commission. 2008.<br />
Hydrological, Environmental and Socio-<br />
Economic Modelling Tools for the Lower<br />
Mekong Basin Impact Assessment. Water<br />
Utilisation Programme Final Report Part<br />
2: Research Findings and Recommendations.<br />
Helsinki and Espoo, Finland:<br />
Finnish Environment Institute, Environmental<br />
Impact Assessment Centre of<br />
Finland Ltd., and Helsinki University of<br />
Technology.<br />
Molle, F. 2008. Why Enough Is Never<br />
Enough: The Societal Determinants of<br />
River Basin Closure. International Journal<br />
of Water Resources Development 24 (2):<br />
217-26.<br />
Molle, F., and J. Berkoff. 2005. Cities versus<br />
Agriculture: Revisiting Intersectoral Water<br />
Transfers, Potential Gains and Conflicts.<br />
Comprehensive Assessment of Water Management<br />
in Agriculture Research Report 10.<br />
Colombo: Comprehensive Assessment<br />
Secretariat.<br />
———, eds. 2008. Irrigation Water Pricing:<br />
The Gap between Theory and Practice.<br />
Comprehensive Assessment of Water<br />
Management in Agriculture Series 4.<br />
Wallingford, UK: Centre for Agricultural<br />
Bioscience International.<br />
Molle, F., J. Berkoff, and R. Barker. 2005.<br />
Irrigation Water Pricing in Context:<br />
Exploring the Gap between Theory<br />
and Practice. Paper presented at the<br />
workshop Comprehensive Assessment of<br />
Water Management in Agriculture, International<br />
Water Management Institute,<br />
Montpelier, France, 6-10 June 2005.<br />
Molle, F., T. Foran, and M. Käkönen, eds.<br />
Forthcoming. Contested Waterscapes<br />
in the Mekong Region: Hydropower,<br />
Livelihoods and Governance. London:<br />
Earthscan.<br />
Molle, F., P. Jayakody, R. Ariyaratne, and<br />
H. S. Somatilake. 2008. Irrigation vs. Hydropower:<br />
Sectoral Conflicts in Southern<br />
Sri Lanka. Water Policy 10 (S1): 37-50.<br />
Molle, F., P. Wester, and P. Hirsch. 2007.<br />
River Basin Development and Management.<br />
In Water for Food, Water for Life:<br />
A Comprehensive Assessment of Water<br />
Management in Agriculture. London:<br />
Earthscan, and Colombo: International<br />
Water Management Institute.<br />
Neiland A. E., J. Weeks, S. P. Madakan,<br />
and B. M. B. Ladu. 2000. Inland Fisheries<br />
of North East Nigeria Including the<br />
Upper River Benue, Lake Chad and the<br />
Nguru–Gashua Wetlands II: Fisheries<br />
Management at Village Level. Fisheries<br />
Research 48 (3): 245-61.<br />
OECD (Organisation for Economic Cooperation<br />
and Development). 2008.<br />
OECD Environment Outlook to 2030. Paris:<br />
Organisation for Economic Co-operation<br />
and Development.<br />
Somlyódy, László, and Olli Varis. 2006.<br />
Freshwater Under Pressure in Groundwater<br />
Mangement and Policy: Its Future<br />
Alternatives. International Review for<br />
Environmental Strategies 6 (2): 181-204.<br />
South Asia Network on Dams, Rivers and<br />
People. 2006. Protest against Diversion<br />
of Hirakud Water. Dams, Rivers and People<br />
4 (9-10): 8.<br />
UNESCAP (United Nations Economic and<br />
Social Commission for Asia and the<br />
Pacific). 1997. Guidelines for the Establishment<br />
of Pricing Policies and Structure<br />
for Urban and Rural Water Supply.<br />
ST/ESCAP/1738. Manila: United Nations<br />
Economic and Social Commission for<br />
Asia and the Pacific.<br />
———. 2004. Guidelines on Strategic<br />
Planning and Management of Water<br />
Resources. ST/ESCAP/2346. New York:<br />
United Nations.<br />
van der Molen, I., and A. Hildering. 2005.<br />
Water: Cause for Conflict or Co-operation?<br />
ISYP Journal on Science and World<br />
Affairs 1 (2): 133-43.<br />
WBCSD (World Business Council for<br />
Sustainable Development). n.d. Global<br />
Water Tool. Geneva. www.wbcsd.org/<br />
templates/TemplateWBCSD5/layout.asp?<br />
type=p&MenuId=MTUxNQ&doOpen=1<br />
&ClickMenu=LeftMenu.<br />
Winpenny, James. 1994. Managing Water as<br />
an Economic Resource. London and New<br />
York: Routledge.<br />
Wolf A. T., S. B. Yoffe, and M. Giordano.<br />
2003. International Waters: Identifying<br />
Basins at Risk. Water Policy 5 (1): 29-60.<br />
World Economic Forum. 2008. Water as<br />
Critical as Climate Change. Press Release,<br />
23 January. Davos, Switzerland. www.<br />
weforum.org/en/media/Latest%20<br />
Press%20Releases/WaterCritical.<br />
Water in a changing world 159
State of the resource<br />
PART<br />
3<br />
Chapter<br />
10 The Earth’s natural water cycles<br />
11 Changes in the global water cycle<br />
12 Evolving hazards – and emerging opportunities<br />
13 Bridging the observational gap<br />
Chapters 10-12<br />
Coordinator<br />
Andras Szöllösi-<br />
Nagy (UNESCO),<br />
with the support<br />
of Anil Mishra<br />
(UNESCO) and<br />
Siegfried Demuth<br />
(UNESCO)<br />
Facilitator<br />
Denis Hughes<br />
Chapter 13<br />
Coordinator<br />
Andras Szöllösi-<br />
Nagy (UNESCO)<br />
Associate<br />
coordinator<br />
Wolfgang Grabs<br />
(WMO)<br />
Facilitator<br />
Denis Hughes
Author: Denis Hughes<br />
3 PART<br />
Part 3 of the Report highlights the key<br />
issues associated with the Earth’s natural<br />
water cycles (chapter 10) and identifies<br />
the changes occurring in the water<br />
cycle (chapter 11) and how they affect<br />
hazards and opportunities for using<br />
water resources (chapter 12). It concludes<br />
with a discussion of the available<br />
information – and the information that<br />
is lacking – to quantify the resource<br />
and patterns of change (chapter 13).<br />
Water resources are made up of many<br />
components associated with water in<br />
its three physical states (liquid, solid<br />
and gas). Under natural conditions<br />
water results from complex interactions<br />
between atmospheric, land surface and<br />
subsurface processes that affect its distribution<br />
and quality. The components<br />
of the water cycle (rainfall, evaporation,<br />
runoff, groundwater, storage and others)<br />
therefore all differ in their chemical<br />
and biochemical qualities, spatial and<br />
temporal variability, resilience, vulnerability<br />
to pressures (including land use<br />
and climate change), susceptibility to<br />
pollution and capacity to provide useful<br />
services and to be used sustainably. A<br />
consequence of this variability is that<br />
while human pressures have resulted in<br />
large modifications to the global cycle,<br />
the directions and degrees of change<br />
are complex and difficult to ascertain.<br />
The uneven distribution over time and<br />
space of water resources and their<br />
modification through human use and<br />
abuse are sources of water crises in<br />
many parts of the world. Broad overviews<br />
at the global scale are difficult because<br />
of the spatial and temporal complexity<br />
arising from the conjunction of<br />
land, water and atmospheric elements<br />
– made worse by incomplete monitoring<br />
and fragmented availability of data to<br />
quantify the resource and its changes.<br />
The main components of water have<br />
come to be designated as blue, green<br />
and white water:<br />
• Blue water is liquid water moving<br />
above and below the ground and<br />
includes surface water and groundwater.<br />
As blue water moves through<br />
the landscape, it can be reused until<br />
it reaches the sea.<br />
• Green water is soil moisture<br />
generated from rainfall that infiltrates<br />
the soil and is available<br />
for uptake by plants and evapotranspiration.<br />
Green water is nonproductive<br />
if evaporated from soil<br />
and open water.<br />
• White water (sometimes considered<br />
the non-productive part of green<br />
water) is water that evaporates directly<br />
into the atmosphere without<br />
having been used productively and<br />
includes losses from open water and<br />
soil surfaces.
PART<br />
3<br />
In addition, grey and black water refer<br />
to the quality of the resource.<br />
• Grey water, usually wastewater,<br />
may be poor in quality, but usable<br />
for some purposes.<br />
• Black water is so heavily polluted<br />
(usually with microbes) as to<br />
be harmful (to humans and ecosystems)<br />
or at least economically<br />
unusable.<br />
About 60% of total global water fluxes<br />
(flows, movements and transfers between<br />
physical states) are attributable<br />
to green water flow, the component<br />
of the water cycle most susceptible to<br />
land use and land cover changes, and<br />
to changes in atmospheric conditions<br />
that control evaporative demand, such<br />
as temperature, solar radiation and<br />
atmospheric vapour pressure deficit.<br />
In addition, there is the Earth’s ‘solid’<br />
water, the contribution that snow and<br />
ice make to the global resource and<br />
how these components may be affected<br />
by changes in climate conditions.<br />
Detecting and quantifying changes<br />
involve separating natural variability in<br />
climate and hydrologic processes from<br />
the variability and trends caused by<br />
other factors that influence the hydrologic<br />
landscape and then measuring<br />
and quantifying this variability. This<br />
hydrologic landscape has already been<br />
highly modified by land use changes,<br />
which can both accelerate (for example,<br />
through urbanization and vegetation<br />
degradation) and dampen (for example,<br />
through afforestation) hydrologic<br />
responses. It is also modified by engineered<br />
systems, including in-stream effects<br />
(such as dams, direct abstractions,<br />
return flows and interbasin transfers)<br />
and off-stream effects (such as irrigation).<br />
Climate change is being superimposed<br />
on an already complex hydrologic<br />
landscape, making its signal difficult<br />
to isolate, and yet making its influence<br />
felt throughout the water supply, demand<br />
and buffering system. There are<br />
already detectable changes in some<br />
parts of the world in the first- order<br />
climate parameters of temperature and<br />
rainfall. But this signal is not yet discernable<br />
in many parts of the world in<br />
second-order parameters of importance<br />
to water resources managers, such as<br />
changes in runoff and groundwater.<br />
Chapter 11 reviews the scientific evidence<br />
of change in the components<br />
of the water cycle, focusing on impacts<br />
related to climate change. While<br />
trends in precipitation have been noted<br />
in some parts of the world, in other<br />
areas precipitation patterns have remained<br />
about the same within the<br />
period of observed data. There is evidence<br />
of changes in seasonality and<br />
frequency of heavy precipitation events<br />
in some areas. Despite the evidence of
PART<br />
3<br />
temperature changes, there is little evidence<br />
of detectable changes in evaporation<br />
and evapotranspiration. Part of the<br />
reason may stem from decreased solar<br />
radiation due to increased aerosol use<br />
or cloud cover, but difficulties in obtaining<br />
representative measurements could<br />
be obscuring any trends. Similarly,<br />
detecting trends in soil moisture is constrained<br />
by limited observations, while<br />
model studies are subject to uncertainties<br />
about the model and data input<br />
assumptions.<br />
Despite the limitations of global datasets,<br />
many studies have shown changes<br />
in runoff and streamflow. Many have<br />
focused on low (drought) or high (flood)<br />
extremes (chapter 12). Except in regions<br />
with flows affected by glacier meltwater,<br />
the general conclusion is that global<br />
trends are not present or cannot be<br />
detected at this stage, although climate<br />
change–related trends are evident in<br />
some regions. Many rivers have been<br />
altered by engineered systems, including<br />
dams, diversions, return flows<br />
and interbasin transfers and by land<br />
use modifications. The same is true of<br />
groundwater resources, which have<br />
been heavily used for human supply<br />
and agriculture for many years. While<br />
many groundwater abstraction schemes<br />
access fossil water (water unrelated to<br />
current conditions), renewable groundwater<br />
resources depend on highly<br />
variable recharge volumes. It is thus<br />
realistic to expect future recharge<br />
regimes to reflect changes in the driving<br />
hydrologic processes (such as precipitation<br />
and evapotranspiration) that<br />
might result from anticipated climate<br />
changes. That these are not yet detectable<br />
could be related to the buffering<br />
capacity of groundwater (slower processes),<br />
as well as to the lack of a suitably<br />
integrated global database. While<br />
changes have been observed in natural<br />
lakes and wetlands in recent decades in<br />
many parts of the world, the primary<br />
factors driving these changes are region<br />
specific.<br />
The strongest evidence for the effects<br />
of climate change on water resources<br />
comes from areas where the rate at<br />
which the solid phase of water (snow<br />
and ice) is converted into liquid is important.<br />
In permafrost regions changes<br />
have been detected in the depth of<br />
frozen ground and in the duration,<br />
thickness and areal extent of the seasonal<br />
freeze and thaw within seasonally<br />
frozen regions. Potential impacts<br />
include surface settlement, swamping,<br />
landslides and greater sediment loads.<br />
More than 15% of the world’s population<br />
live where water resources availability<br />
depends heavily on snowmelt<br />
from ephemeral snowpacks or perennial<br />
glaciers. Changes have been observed<br />
in snow cover extent and snow<br />
water equivalent and in the frequency<br />
with which precipitation falls as snow.
PART<br />
3<br />
Despite observations that the snow<br />
cover season has shortened and that<br />
this change appears to have accelerated<br />
in recent decades, some inconsistencies<br />
remain in the data sources. There is<br />
considerable evidence to suggest that<br />
glaciers have retreated globally since<br />
the mid-19th century and that this<br />
retreat has accelerated since the mid-<br />
1970s in response to rising air temperature<br />
and changes in the amount and<br />
kind of precipitation.<br />
Among the consequences of a changing<br />
hydrologic cycle is its interaction<br />
with the terrestrial carbon cycle, because<br />
of positive feedbacks to climate<br />
change. The terrestrial biosphere is<br />
thought to have taken up roughly 25%<br />
of anthropogenic carbon emissions<br />
during the last century, and how long<br />
this can continue is unclear. Observations<br />
suggest that the rate of carbon<br />
uptake depends on hydrologic and<br />
climate conditions, as well as land use.<br />
But long-term observations are sparse,<br />
making trend detection difficult.<br />
Most climate scientists agree that global<br />
warming will result in an intensification,<br />
acceleration or enhancement of<br />
the global hydrologic cycle, and there<br />
is some observational evidence that this<br />
is happening already. Data limitations<br />
in length of record, continuity and spatial<br />
coverage contribute to the uncertainty,<br />
while natural climate variability<br />
and multiyear variability associated<br />
with large-scale atmospheric circulation<br />
patterns influence the interpretation<br />
of many trends in ways that are<br />
not yet fully understood. Improving<br />
data collection and reducing the uncertainties<br />
associated with modelling<br />
studies are important for future impact<br />
assessments.<br />
Hazards (chapter 12) can result from<br />
too much water (floods, erosion, landslides<br />
and so on) or too little (droughts<br />
and loss of wetlands or habitat) and<br />
from the effects of chemical and biological<br />
pollution on water quality and<br />
in-stream ecosystems. Water-related<br />
hazards can be naturally occurring<br />
or anthropogenic. The chapter states<br />
that the natural variability of water<br />
resources and changes, whatever the<br />
cause, can also provide positive opportunities<br />
– with careful management. In<br />
many areas hydrologic extremes have<br />
increased. Deaths and material damage<br />
from extreme floods can be high,<br />
and more intense droughts, affecting<br />
increasing numbers of people, have<br />
been observed in the 21st century. Such<br />
droughts have been linked to higher<br />
temperatures and decreased precipitation,<br />
but are also frequently a consequence<br />
of resource mismanagement.<br />
Changes in cultivation and interruptions<br />
in sediment delivery through<br />
the construction of dams can lead to
PART<br />
3<br />
changes in erosion and sediment transport.<br />
In some developing countries rapidly<br />
expanding population has driven<br />
land clearing and rapid expansion of<br />
cultivated land. The water quality and<br />
ecology of many of the world’s rivers<br />
have been altered partly by changes<br />
in flow and partly by inputs of chemical<br />
and biological waste from human<br />
activities. Global warming is expected<br />
to lead to changes in water temperature,<br />
with substantial effects on energy<br />
flows and matter recycling, resulting in<br />
algal blooms, increases in toxic cyanobacteria<br />
bloom and reductions in biodiversity,<br />
among other impacts.<br />
The increased exposure to potential<br />
climate change hazards has led to more<br />
awareness of water resources management.<br />
The response of management<br />
strategies to potential climate change<br />
threats is an opportunity to implement<br />
more resource-sustainable policies<br />
and practices. For example, in areas of<br />
increasing water stress, groundwater<br />
is often an important buffer resource,<br />
capable of responding to increased<br />
water demands or compensating for<br />
the declining availability of surface<br />
water. There are significant opportunities<br />
for both mitigation and adaptation<br />
strategies, such as stronger observation<br />
networks (chapter 13), increased integration<br />
of groundwater and surface water<br />
supplies (including artificial recharge),<br />
improved early warning and forecasting<br />
systems for hazardous events, improved<br />
risk-based approaches to management<br />
and greater community awareness of<br />
sustainable water resources use.<br />
Management of global water resources<br />
requires reliable information about<br />
the state of the resource and how it is<br />
changing in response to all the drivers<br />
that affect it. Worldwide, water observation<br />
networks are inadequate for current<br />
and future management needs and<br />
risk further decline (chapter 13). There<br />
are insufficient data to understand and<br />
predict the current and future quantity<br />
and quality of the resource. Political<br />
protocols and imperatives for sharing<br />
data are also inadequate. While new<br />
technologies in satellite remote sensing<br />
and modelling present opportunities,<br />
their value is limited by our inability<br />
to ground truth and validate much of<br />
the simulated information. To improve<br />
monitoring and to use data more effectively<br />
and efficiently, countries need to<br />
place observations and continual assessments<br />
of water resources higher on<br />
the political and development agendas.<br />
The financial and human resources<br />
that countries can commit to achieving<br />
these improvements will differ greatly.<br />
But unless a worldwide effort is made<br />
to improve our knowledge and understanding<br />
of changes in the global water<br />
resource, future management will<br />
be undertaken in an environment of<br />
greater uncertainty and high risk.
PART<br />
3<br />
Chapter 10<br />
The Earth’s natural<br />
water cycles<br />
Author: Charles J. Vörösmarty<br />
Contributors: Daniel Conley, Petra Döll, John Harrison, Peter Letitre,<br />
Emilio Mayorga, John Milliman, Sybil Seitzinger, Jac van der Gun and Wil Wollheim<br />
Coordinator: Andras Szöllösi-Nagy (UNESCO)<br />
Facilitator: Denis Hughes<br />
Key messages<br />
The uneven distribution of water resources over time and space<br />
and the way human activity is affecting that distribution today<br />
are fundamental sources of water crises in many parts of the<br />
world.<br />
Climate change is superimposed on the complex hydrologic<br />
landscape, making its signal difficult to isolate and its influence<br />
felt throughout the water supply, demand and buffering<br />
system.<br />
The contemporary water cycle – and so<br />
freshwater resources – is defined by the<br />
interaction of natural and human factors.<br />
This chapter highlights key components<br />
of the global water cycle most<br />
directly relevant to the state of the water<br />
resources base. Such components include<br />
the land-based water system and the<br />
world’s oceans, circulation of water in the<br />
atmosphere, surface and subsurface water<br />
associated with the continental land mass,<br />
accessible and virtual water and people’s<br />
role in stabilizing and redirecting this<br />
resource – and limiting it through mismanagement,<br />
including overabstraction<br />
and pollution.<br />
Overview of the global<br />
hydrologic cycle<br />
Water unifies the climate, biosphere and<br />
chemo-lithosphere of the planet. The<br />
physical state of water and its transformations<br />
are linked to energy exchanges<br />
called atmospheric teleconnections (such as<br />
El Niño) and to feedbacks in the climate<br />
system. Water movement is the largest<br />
flow of any kind through the biosphere<br />
and is the primary vehicle for erosion<br />
and dissolution of continents. Freshwater<br />
strongly determines the productivity of<br />
biomass and supports critical habitats and<br />
biodiversity. Humans struggle to stabilize<br />
and make available adequate water, despite<br />
an unforgiving climate, failed governance<br />
and mismanagement, which lead to depletion<br />
and pollution.<br />
Components of the global water cycle<br />
– defining the water resources base<br />
The land-based hydrologic cycle is the<br />
fundamental building block of water resources.<br />
Freshwater is but a small fraction<br />
– about 2.5% – of the total water on Earth,<br />
the ‘blue planet’. All human enterprise<br />
requires water. It is required for food production,<br />
industry, drinking water, inland<br />
water transport systems, waste dilution<br />
and healthy ecosystems.<br />
Water links Earth’s atmosphere, land<br />
mass and oceans through the global water<br />
cycle – circulating through each of these<br />
domains, changing phase between solid,<br />
liquid and gas; supporting the biosphere<br />
and humans; wearing away the continents<br />
and nourishing coastal zones. Water also<br />
serves as a conveyance system for bioactive<br />
chemicals (including poisons) that eventually<br />
find their way from continental source<br />
areas into the world’s oceans.<br />
Precipitation is the ultimate source of<br />
freshwater. After losing water back to the<br />
166 World Water Development Report 3
The Earth’s natural water cycles<br />
PART<br />
3<br />
atmosphere through evaporation and<br />
evapotranspiration, precipitation recharges<br />
groundwater and provides surface and<br />
subsurface runoff. This runoff ultimately<br />
flows downstream through river corridors<br />
and into groundwater aquifers and<br />
constitutes an important regional source<br />
of water (table 10.1). Variation in precipitation<br />
and atmospheric demand for evapotranspiration<br />
thus geophysically limit<br />
water availability. Globally, about twothirds<br />
of precipitation is returned to the<br />
atmosphere.<br />
Latin America is the most water-rich<br />
region, with about a third of global<br />
runoff. Asia is next, with a quarter of<br />
global runoff, followed by the countries<br />
of the Organisation for Economic Cooperation<br />
and Development (mainly<br />
North America, Western Europe and Australasia)<br />
(20%), and sub-Saharan Africa<br />
and Eastern Europe, the Caucasus and<br />
Central Asia, each with about 10%. The<br />
Middle East and North Africa is the most<br />
water-limited region, with only 1% of<br />
global runoff. Over 85% of precipitation<br />
is evaporated or transpired. In regions<br />
where runoff is scarce or ill-timed, rainwater<br />
is an important component of the<br />
resource picture.<br />
Table 10.2 describes the land-based water<br />
cycle as it relates to water resources systems.<br />
A substantial portion of the water<br />
associated with the renewable land-based<br />
hydrologic cycle is inaccessible to humans<br />
due to remoteness or an inability to store<br />
seasonal flows. 1 Accessibility is also affected<br />
by political preferences and unequal<br />
distribution of wealth and technological<br />
resources, which can prevent the delivery<br />
of water even when its physical presence<br />
is confirmed (the concept of economic<br />
water scarcity). Further, some groundwater<br />
stocks are accessible but not renewable,<br />
such as ancient aquifers in regions that<br />
today lack a replenishment source. An appropriate<br />
conceptual framework is thus required<br />
that combines physical and human<br />
dimensions. Map 10.1 contrasts the two<br />
perspectives and shows the portion of<br />
the global water cycle that is accessible to<br />
humans. Some additional supplies can be<br />
made available through non-conventional<br />
means, such as desalination, often at<br />
substantial cost in infrastructure and<br />
operations.<br />
Spatial and temporal variability<br />
Map 10.1 clearly shows an uneven spatial<br />
distribution of water supply. Variations<br />
in seasonality and the episodic nature of<br />
rainfall, snowfall, snowmelt and evapotranspiration<br />
all contribute to temporal incongruities<br />
that show up as flooding, seasonal<br />
low flows and longer-term drought,<br />
challenging water managers to forecast<br />
conditions and specify water allocations<br />
under a cloud of uncertainty.<br />
Major interconnections are established<br />
through circulation patterns in the<br />
global atmosphere, which lead to the<br />
Globally, about<br />
two-thirds of<br />
precipitation is<br />
returned to the<br />
atmosphere<br />
Table 10.1<br />
Estimates of renewable water supplies, access to renewable supplies and population served<br />
by freshwater, 2000<br />
Indicator<br />
Asia<br />
Eastern<br />
Europe, the<br />
Caucasus and<br />
Central Asia<br />
Latin<br />
America<br />
Middle<br />
East and<br />
North<br />
Africa<br />
Sub-<br />
Saharan<br />
Africa<br />
OECD<br />
Global<br />
total<br />
Area (millions of square<br />
kilometres) 20.9 21.9 20.7 11.8 24.3 33.8 133.0<br />
Total precipitation (thousands of<br />
cubic kilometres a year) 21.6 9.2 30.6 1.8 19.9 22.4 106.0<br />
Evaporative returns to atmosphere<br />
(percent of precipitation) 55 27 27 86 78 64 63<br />
Total renewable water supply<br />
(blue water flows; thousands of<br />
cubic kilometres a year) [% of<br />
global runoff]<br />
Renewable water supply (blue<br />
water flows accessible to humans;<br />
thousands of cubic kilometres a<br />
year) [percent of total renewable<br />
water supply]<br />
9.8<br />
[25]<br />
9.3<br />
[95]<br />
4.0<br />
[10]<br />
1.8<br />
[45]<br />
Note: Means computed based on methods in Vörösmarty, Leveque, and Revenga (2005). Estimates are based on climate data for 1950-96, computed<br />
using estimates of population living downstream of renewable supplies in 2000.<br />
Source: Fekete, Vörösmarty, and Grabs 2002.<br />
13.2<br />
[33]<br />
8.7<br />
[66]<br />
0.25<br />
[1]<br />
0.24<br />
[96]<br />
4.4<br />
[11]<br />
4.1<br />
[93]<br />
8.1<br />
[20]<br />
5.6<br />
[69]<br />
39.6<br />
[100]<br />
29.7<br />
[75]<br />
Water in a changing world 167
PART<br />
3<br />
Chapter 10<br />
Table 10.2<br />
Definitions of key components of the land-based hydrologic cycle and examples of their<br />
reconfiguration by humans<br />
Water system<br />
element<br />
Space and time<br />
variability<br />
Typical roles in water<br />
resources systems<br />
Management challenges, vulnerabilities and<br />
opportunities<br />
Green water<br />
• Soil moisture (nonproductive<br />
green<br />
water is evaporated<br />
from soil and open<br />
water surfaces)<br />
• Very high<br />
over both<br />
dimensions<br />
• Direct support to rainfed<br />
cropping systems<br />
• Highly sensitive to climate variability (both<br />
drought and flood); limited capacity to control<br />
• Can be augmented by rainfall-harvesting<br />
techniques (many traditional and widely<br />
adopted)<br />
• Weather and climate forecasts help in scheduling<br />
planting, harvest, supplemental irrigation and<br />
other activities<br />
• Performance improved or compromised by land<br />
management<br />
• Selection of improved crop strains for climateproofing<br />
Blue water (natural<br />
and altered)<br />
• Net of local<br />
groundwater<br />
recharge and surface<br />
runoff, streamflow<br />
• High over both<br />
dimensions<br />
• Farm ponds and check dams<br />
augment green water in<br />
rainfed cropping systems<br />
• Source waters and entrained<br />
constituents delivered<br />
downstream within<br />
watersheds<br />
• Highly sensitive to climate variability (both<br />
drought and flood) and ultimately climate<br />
change<br />
• Some capacity to control<br />
• Habitat management highly localized<br />
• Many small engineering works can propagate<br />
strong cumulative downstream effects<br />
• Poor land management heightens possiblities of<br />
flash flooding followed by dry streambeds<br />
• Inland water<br />
systems (lakes,<br />
rivers, wetlands)<br />
• Decreased<br />
variability with<br />
increased size<br />
• Key resource over district,<br />
national, and multinational<br />
domains<br />
• Important role in transport,<br />
waste management, and<br />
domestic, industrial and<br />
agricultural sectors<br />
• Water losses through net evaporation occur<br />
naturally and through human use<br />
• Legacy of upstream management survives<br />
downstream (e.g., irrigation losses, pollution)<br />
• Multiple sector management objectives may be<br />
difficult to attain simultaneously<br />
• Potential upstream-downstream conflicts<br />
(human to human; human to nature), including<br />
international<br />
• Ground water<br />
(shallow)<br />
• Moderate<br />
over both<br />
dimensions;<br />
links to streams<br />
• Locally distributed shallow<br />
well systems serving<br />
drinking water and irrigation<br />
needs<br />
• Intimate connection to weather and climate<br />
means water yields subject to precipitation<br />
extremes<br />
• Easily polluted<br />
• Easily overused, resulting in temporary depletion;<br />
some loss of regional importance to oceans<br />
• Fossil groundwater<br />
(deep)<br />
• Extremely<br />
stable<br />
• Critical (and often sole)<br />
source of water in arid and<br />
semi-arid regions<br />
• Large repositories of water but with limited<br />
recharge potential<br />
• Use typically non-sustainable, leading to<br />
declining water levels and pressure, increasing<br />
extraction costs<br />
• Low replenishment rates mean pollution often<br />
effectively becomes permanent<br />
Blue water<br />
(engineered)<br />
• Diversions, including<br />
reservoirs and<br />
interbasin transfers<br />
• Reused waters<br />
• Stable to very<br />
stable<br />
• Critical (and often sole)<br />
source of water in arid and<br />
semi-arid regions<br />
• Altered blue water balance<br />
as flows stabilized or<br />
redirected from water-rich<br />
times and places to water<br />
poor times and places<br />
• Multiple uses: hydropower,<br />
irrigation, domestic,<br />
industrial, recreational, flood<br />
control<br />
• Secondary reuse as effluents<br />
in irrigation<br />
• Large quantities of water with high recharge<br />
potential<br />
• Modified flow regime, with positive and negative<br />
impacts on humans and ecosystems<br />
• Can destroy river fish habitat while creating lake<br />
fisheries by fragmenting habitat<br />
• Natural ecosystem ‘cues’ for breeding and<br />
migration removed<br />
• Water supplies stabilized for use when needed<br />
most by society<br />
• Sediment trapping, leading to downstream<br />
inland waterway, coastal zone problems<br />
• Potential for introduction of exotic species<br />
• Greenhouse gas emission from stagnant water<br />
• Health problems (e.g., schistosomiasis) from<br />
stagnant water<br />
• Social instability due to forced resettlement<br />
(continued)<br />
168 World Water Development Report 3
the Earth’s natural water cycles<br />
PART<br />
3<br />
Table 10.2<br />
Definitions of key components of the land-based hydrologic cycle and examples of their<br />
reconfiguration by humans (continued)<br />
Water system<br />
element<br />
Virtual water (not<br />
an additional water<br />
system element)<br />
Desalination<br />
Space and time<br />
variability<br />
• Stable, but<br />
linked to<br />
fluctuations<br />
in global<br />
economy<br />
Typical roles in water<br />
resources systems<br />
• Water embodied in<br />
production of goods and<br />
services, typically with crops<br />
traded on the international<br />
market<br />
• Not explicitly recognized<br />
as a water resources<br />
management tool until<br />
recently<br />
•<br />
scarce areas<br />
• Stable<br />
Augmentation in water-<br />
Management challenges, vulnerabilities and<br />
opportunities<br />
• Can implicitly off-load water use requirements<br />
from more water-poor to more water-rich<br />
locations<br />
• Particularly important where rainfed agriculture<br />
is restricted and irrigation relies on rapidly<br />
depleting fossil groundwater sources<br />
• Costly, special use water supply; technologies<br />
rapidly developing for cost-effectiveness<br />
Source: Author’s compilation.<br />
Map 10.1<br />
Contrasts between geophysical and human-dimension perspectives on water, most<br />
recent year available<br />
Runoff<br />
(millimetres a year)<br />
Less than 0<br />
0-10<br />
10-50<br />
50-100<br />
100-250<br />
250-500<br />
500-750<br />
750-1,000<br />
More than 1,000<br />
Population served by<br />
source area runoff<br />
(thousands per grid area)<br />
0-10<br />
10-50<br />
50-100<br />
100-500<br />
500-1,000<br />
More than 1,000<br />
No people or no runoff<br />
Note: The top map shows runoff-producing areas in absolute terms, with darker blue indicating areas that generate intense local-scale runoff. This is the traditional<br />
view of the global distribution of the renewable water resources base. The bottom map shows the importance of all of the world’s runoff-producing<br />
areas, as measured by the human population served. Thus, runoff produced across a relatively unpopulated region like Amazonia, while a globally significant<br />
source of water to the world’s oceans, is much less critical to the global water resources base than runoff produced across a region like South Asia.<br />
Source: Vörösmarty, Leveque, and Revenga (2005), updated from Fekete, Vörösmarty, and Grabs (2002).<br />
Water in a changing world 169
PART<br />
3<br />
Chapter 10<br />
The global<br />
distribution of<br />
freshwater must<br />
be considered<br />
together with<br />
its accessibility<br />
redistribution of water to oceans and<br />
land masses. The position of mountain<br />
ranges across the continents can be used<br />
to divide the Earth into two domains –<br />
exorheic zones, where water flows to the<br />
oceans, and internally draining endorheic<br />
zones, many in the ‘rain shadow’<br />
of the world’s main precipitation belts<br />
(figure 10.1). Much of the endorheic land<br />
is positioned mid-continent and distant<br />
from the ocean, resulting in a characteristically<br />
dry environment. Here, 10%-15%<br />
of the global land mass generates only 2%<br />
of global renewable freshwater resources.<br />
Mountain systems are important as the<br />
world’s ‘water towers’ and generate a substantial<br />
share of the global water resources<br />
base for the billions of people who live<br />
downstream. By contrast, the margins of<br />
the continents (exorheic plains), because<br />
of their intimate connection with oceanderived<br />
moisture, generate about half of<br />
all renewable freshwater resources, collectively<br />
greater than all mountain water<br />
towers. There are many concerns about<br />
the impact of climate change on this<br />
geography of precipitation and runoffproducing<br />
areas. 2<br />
The global distribution of freshwater must<br />
be considered together with its accessibility.<br />
With about 75% of total annual runoff<br />
accessible to humans (see table 10.1) and<br />
with slightly more than 80% of the world’s<br />
population (4.9 billion people) served by<br />
renewable and accessible water, 3 almost<br />
20% of people are unserved by naturally<br />
occurring renewable resources and must<br />
take their supply from ancient aquifers<br />
(aquifer mining), interbasin transfers<br />
and desalinized seawater. Except in the<br />
exorheic mountain regions, where water is<br />
relatively abundant, most of the population<br />
has only a small share of the global<br />
freshwater resource. Using high resolution<br />
global maps of population and water<br />
supply, a study showed that 85% of the<br />
world’s population resides in the drier half<br />
of the Earth. 4 More than 1 billion people<br />
living in arid and semi-arid parts of the<br />
world have access to little or no renewable<br />
water resources. However, there is still<br />
uncertainty surrounding estimates of the<br />
renewable supply, water use and derived<br />
statistics (table 10.3; see also chapter 7).<br />
There is great variation in flow reliability,<br />
with variability greatest in regions<br />
with the lowest levels of runoff (the drier<br />
regions; map 10.2). Patterns of reliable<br />
monthly river flows also confirm the<br />
sensitivity of arid and semi-arid regions,<br />
defined from a hydrologic (local runoff<br />
and river corridor supplies) rather than<br />
a climatic (rainfall variability alone) perspective.<br />
5 This variability reduces projections<br />
of average annual GDP growth rates<br />
by as much as 38%, and even a single<br />
drought event within a 12-year period<br />
can reduce growth rates over the period<br />
by 10%. Flooding can also have devastating<br />
effects, particularly in areas with high<br />
population density and without adequate<br />
early warning and emergency response<br />
systems (map 10.3). During 1992-2001<br />
floods accounted for 43% of recorded<br />
Figure 10.1<br />
Distribution of global runoff to the oceans (exorheic) or internal receiving waters<br />
(endorheic) and the corresponding distribution of contemporary population served<br />
Exorheic<br />
Endorheic<br />
37,200 cubic kilometres a year 940 cubic kilometres a year<br />
Mountains<br />
Oceans<br />
Plateaus<br />
Plateaus<br />
Hills<br />
Hills<br />
Plains<br />
Plains<br />
Area<br />
(millions of square<br />
kilometres) 63 11 14 28 6 2.5 0.4 9<br />
Depth change<br />
(millimetres a year) 293 445 153 424 86 38 102 35<br />
Total resources<br />
(thousands of cubic<br />
kilometres a year) 18.4 4.9 2.1 11.8 0.5 0.09 0.04 0.3<br />
Population served<br />
(bilions) 3.3 0.8 0.4 1.5 0.2 0.03 0.02 0.2<br />
Source: Updated from Vörösmarty and Meybeck (2004); land form categories from Meybeck, Green, and Vörösmarty (2001).<br />
170 World Water Development Report 3
the Earth’s natural water cycles<br />
PART<br />
3<br />
disasters and affected more than 1.2 billion<br />
people. 6<br />
People have responded to such variability<br />
in the water cycle with investments in<br />
engineered water stabilization, such as<br />
reservoirs, interbasin transfers and deep<br />
groundwater pumping. These stabilization<br />
arrangements bring new patterns of<br />
hydrograph variability (see box 11.1 in<br />
chapter 11). Figure 10.2 shows an example<br />
of a typical effect of a series of river flow<br />
regulations. While such changes may<br />
stabilize flows and thus optimize water<br />
availability for a variety of human uses,<br />
they also create substantial distortions in<br />
flows that stress downstream aquatic biota<br />
(see chapter 9). 7<br />
A more stable and reliable source of<br />
freshwater resides below ground. Groundwater<br />
reservoirs are recharged directly by<br />
surplus rainfall percolating through soil<br />
or indirectly by surface water losses to<br />
the subsurface and infiltration of excess<br />
irrigation water or water from other<br />
uses. Approximately 90% of the world’s<br />
groundwater discharge feeds into streams,<br />
accounting for almost 30% of global<br />
runoff. 8 Most groundwater systems have<br />
large storage volumes and high storage<br />
to throughput ratios (known as residence<br />
time, or average time that inflow volumes<br />
remain in storage). Because of these<br />
characteristics, groundwater resources are<br />
Table 10.3<br />
Region<br />
Indicative range of uncertainty in recent<br />
assessments of renewable water supply, most<br />
recent year available<br />
Renewable water<br />
supply (cubic<br />
kilometres a year)<br />
much less affected by short-term fluctuations<br />
in climate than are surface water<br />
resources (table 10.4). Groundwater reservoirs<br />
thus add persistency and stability<br />
to the terrestrial hydrologic system and<br />
enable humans, fauna and flora to survive<br />
extended dry periods. This underlines the<br />
potential of groundwater for coping with<br />
Mean water<br />
crowding (people<br />
per million cubic<br />
metres a year)<br />
Asia 7,850-9,700 320-384<br />
Former Soviet Union 3,900-5,900 48-74<br />
Latin America 11,160-18,900 25-42<br />
North Africa and Middle East 300-367 920-1,300<br />
Sub-Saharan Africa 3,500-4,815 115-160<br />
Organisation for Economic<br />
7,900-12,100 114-129<br />
Co-operation and Development<br />
Global total 38,600-42,600 133-150<br />
Note: Supply here refers to global total renewable runoff, both accessible and remote from<br />
human population and croplands.<br />
Source: The ranges reported here are from three global-scale water resources models,<br />
two of which were used in the Millennium Ecosystem Assessment: Vörösmarty, Federer, and<br />
Schloss (1998); Fekete, Vörösmarty, and Grabs (2002) and Federer, Vörösmarty, and Fekete<br />
(2003) for the Condition and Trends Working Group assessment and Alcamo et al. (2003)<br />
and Döll, Kaspar, and Lehner (2003) for the Scenarios Working Group. A third model from<br />
Dirmeyer, Gao, and Oki (2002) and Oki et al. (2003) was also compared.<br />
Map 10.2<br />
Global variations in the relationship between low flows and mean flows (percentage<br />
deviation of 1 in 10 year low flows relative to mean flows measured over 1961-90)<br />
Percent<br />
0-10<br />
10-20<br />
20-30<br />
30-50<br />
50-90<br />
More than 90<br />
No data<br />
Source: Based on Döll, Kaspar, and Lehner 2003.<br />
Water in a changing world 171
PART<br />
3<br />
Chapter 10<br />
Map 10.3<br />
Impact of flood losses (comparative losses based on national GDP)<br />
Risk deciles<br />
1st-4th (low)<br />
5th-7th (medium)<br />
8th-10th (high)<br />
Note: Deciles refer to the level of risk, normalized for comparing 10 categories.<br />
Source: Based on Dilley et al. 2005.<br />
120<br />
100<br />
80<br />
60<br />
40<br />
20<br />
0<br />
1 Jan 1906<br />
120<br />
100<br />
80<br />
60<br />
40<br />
20<br />
0<br />
1 Jan 1956<br />
120<br />
100<br />
80<br />
60<br />
Figure 10.2 Impact of the Davis Dam on the Colorado<br />
River hydrograph<br />
Cubic kilometres per second<br />
40<br />
20<br />
0<br />
1 Jan 2006<br />
2 Apr 1906<br />
2 Apr 1956<br />
2 Apr 2006<br />
2 Jul 1906<br />
2 Jul 1956<br />
2 Jul 2006<br />
1 Oct 1906<br />
1 Oct 1956<br />
1 Oct 2006<br />
31 Dec 1906<br />
31 Dec 1956<br />
31 Dec 2006<br />
Note: The dam was completed in 1950, has a maximum capacity of 2 cubic kilometres and<br />
residence time change (average time that inflows remain in storage) of about 0.5 year.<br />
Source: US Geological Survey station records.<br />
increasing water scarcity due to climate<br />
change. At the same time, because of the<br />
strong interdependence between groundwater<br />
and surface water, the overall resource<br />
is difficult to quantify, and there is<br />
a risk of double counting available water<br />
resources.<br />
Recent estimates put the mean renewable<br />
groundwater resource at 2,091 cubic<br />
metres per person a year, or about a<br />
third of total renewable resources per<br />
capita. 9 Although groundwater systems<br />
are often highly localized, groundwater<br />
clearly makes a substantial contribution<br />
to the water resources base, constituting<br />
20%-50% of municipal water supply. 10 As<br />
much as 60% of groundwater withdrawal<br />
is used to irrigate crops in arid and semiarid<br />
regions. Information on groundwater<br />
storage is scarce and not very accurate<br />
because of the enormous effort and cost<br />
required to explore and assess groundwater<br />
reservoirs. The geographic distribution<br />
of long-term average diffuse groundwater<br />
recharge and of the known larger<br />
groundwater reservoirs are in maps 10.4<br />
and 10.5.<br />
Relationship of water to global<br />
biogeochemical cycles<br />
A growing body of evidence indicates that<br />
human activities are affecting river water<br />
chemistry on a global scale. It is estimated<br />
that less than 20% of the world’s drainage<br />
basins exhibit nearly pristine water<br />
quality and that the riverine transport of<br />
172 World Water Development Report 3
the Earth’s natural water cycles<br />
PART<br />
3<br />
inorganic nitrogen and phosphorus has<br />
increased severalfold over the last 150-<br />
200 years. 11 Monitoring and analysis are<br />
needed to understand the effects of these<br />
changes on water resources, but observed<br />
information is lacking (see chapter 13),<br />
and much of our understanding is based<br />
on modelling and inferences.<br />
Water as the conveyor for<br />
particulates and dissolved materials,<br />
linking land, ocean and atmosphere<br />
Water mobilizes and transports materials<br />
essential for life in terrestrial and aquatic<br />
ecosystems. For example, nitrogen, phosphorus<br />
and silica are important nutrients<br />
that limit maximum plant and algal biomass,<br />
while organic carbon from land is an<br />
important energy source in downstream<br />
freshwater and marine systems. Water also<br />
transports natural materials that directly<br />
influence the health of organisms (for example,<br />
through conductivity and pH) and<br />
habitat structure (for example, through<br />
sediments). Under natural conditions these<br />
materials originate in atmospheric transport<br />
and deposition, biologic activity and<br />
erosion or weathering from bedrock and<br />
soils. Multiple human activities lead to<br />
additional sources of such elements (figure<br />
10.3) as well as to material not naturally<br />
present in water, such as pesticides and<br />
synthetic chemicals that can mimic or<br />
block hormones and their natural functions<br />
(‘endocrine disrupters’) (see section<br />
on water pollution as a constraint to<br />
supply).<br />
Table 10.4<br />
Component<br />
Estimated mean residence times (storage to<br />
throughput) and stored water volumes of the<br />
main components of the Earth’s hydrosphere<br />
Mean<br />
residence<br />
time<br />
Rivers have traditionally been considered<br />
simple transporters of materials, but it is<br />
increasingly acknowledged that chemical<br />
Total water<br />
stored<br />
(thousands<br />
of cubic<br />
kilometres)<br />
Freshwater<br />
stored<br />
(thousands<br />
of cubic<br />
kilometres)<br />
Permafrost zone,<br />
ground ice 10,000 years 300 300<br />
Polar ice 9,700 years 24,023 24,023<br />
Oceans 2,500 years 1,338,000 na<br />
Mountain glaciers 1,600 years 40.6 40.6<br />
Groundwater (excluding<br />
Antarctica) 1,400 years 23,400 10,530<br />
Lakes 17 years 176.4 91.0<br />
Swamps 5 years 11.5 11.5<br />
Soil moisture 1 year 16.5 16.5<br />
Streams 16 days 2.1 2.1<br />
Atmosphere 8 days 12.9 12.9<br />
Biosphere Several hours 11.2 11.2<br />
Total 1,385,985 35,029<br />
na is not applicable.<br />
Note: Components may not sum to total because of rounding. Reservoirs of water that respond<br />
slowly to change have long residence times. The atmosphere exhibits huge variability,<br />
its dynamics changing over very short space and time scales, whereas permafrost is sluggish<br />
and would be expected to respond slowly to forced changes such as those associated with<br />
global warming. Residence time also has an enormous impact on water quality. Streams and<br />
river waters, with their generally short residence times, are able to respond relatively quickly<br />
to pollution control measures, whereas groundwater can remain polluted – and taken out of<br />
the resource supply pool – for centuries unless costly remediation measures are applied.<br />
Source: Based on Shiklomanov and Rodda 2003.<br />
Map 10.4 Patterns of long-term average diffuse groundwater recharge, 1961-90<br />
Millimetres a year<br />
0-2<br />
2-20<br />
20-100<br />
100-300<br />
300-1,000<br />
Source: Based on Döll and Fiedler 2007.<br />
Water in a changing world 173
PART<br />
3<br />
Chapter 10<br />
Map 10.5<br />
Global groundwater recharge, most recent year available<br />
Millimetres a year<br />
In major groundwater basins<br />
More than 300<br />
100-300<br />
20-100<br />
2-20<br />
Less than 2<br />
In areas with complex<br />
hydrogeological structure<br />
More than 300<br />
100-300<br />
20-100<br />
Less than 20<br />
In areas with local and shallow aquifers<br />
More than 100<br />
Less than 100<br />
No data<br />
Source: Based on WHYMAP 2008.<br />
Figure 10.3<br />
Human activities are sources for dissolved inorganic nitrogen, organic nitrogen,<br />
inorganic phosphorus and organic phosphorus in coastal zones<br />
Inorganic nitrogen<br />
Natural<br />
nitrogen<br />
fixation<br />
36%<br />
Anthropogenic<br />
diffuse sources<br />
62%<br />
Anthropogenic<br />
point sources 2%<br />
Anthropogenic<br />
point sources 3%<br />
Anthropogenic<br />
diffuse sources<br />
11%<br />
Organic nitrogen<br />
Non-anthropogenic sources<br />
86%<br />
Anthropogenic<br />
diffuse sources<br />
4%<br />
Inorganic phosphorus<br />
Phosphorus<br />
weathering<br />
35%<br />
Anthropogenic<br />
point sources<br />
61%<br />
Anthropogenic<br />
point sources 2%<br />
Anthropogenic<br />
diffuse sources<br />
17%<br />
Organic phosphorus<br />
Non-anthropogenic sources<br />
81%<br />
Note: Human activity dominates among the inorganic source terms.<br />
Source: Seitzinger et al. 2005.<br />
and biochemical transformations occurring<br />
during water transit through basins<br />
can have important influences on materials<br />
transport and pollutant loads. 12 The<br />
quantity and timing of water flows influence<br />
the mobility of pollutant sources and<br />
their dilution potential.<br />
Spatial heterogeneity in global<br />
patterns of water quality<br />
Making broad statements about water<br />
quality is difficult because of spatial and<br />
temporal biogeochemical complexity as<br />
well as definitional problems and incomplete<br />
monitoring (see chapter 13). The<br />
174 World Water Development Report 3
multiple factors that influence material<br />
fluxes through aquatic systems (sources,<br />
hydrology, geomorphology and biology)<br />
suggest an inherent complexity in characterizing<br />
water quality at regional and<br />
global scales. Uncertainties are associated<br />
with each factor.<br />
The situation is exacerbated by the uneven<br />
distribution over space and time of field<br />
observations of material fluxes and water<br />
quality. The European Union and the<br />
United States have relatively high densities<br />
of water quality measurement stations,<br />
while the rest of the world has a much<br />
sparser set of stations, with low frequency<br />
of sampling and observations over shorter<br />
periods.<br />
Observations over short periods can fail<br />
to capture changes in human activities<br />
across the multiple time scales over<br />
which hydrologic variability occurs – from<br />
individual storms to seasonal, annual<br />
and multidecadal cycles. This variability<br />
is also expressed spatially, influencing<br />
the development of source and reactivity<br />
hot spots (such as erosion and wetland<br />
development). This interaction can make it<br />
difficult to attribute changes to anthropogenic<br />
or natural phenomena.<br />
Humans are accelerating – and<br />
decelerating – the constituent cycles<br />
Human pressures have greatly modified<br />
the behaviour of both hydrology and<br />
constituent transports, particularly over<br />
the last century. 13 This will likely remain<br />
true well into the future, but the direction<br />
of the evolution of these transports, and so<br />
the quality of inland water, is a complex<br />
function of four major changes that must<br />
be considered simultaneously:<br />
• Human activities have greatly accelerated<br />
the biogeochemical cycles<br />
and the global transfer of materials,<br />
including sediment from increased<br />
erosion associated with poor land<br />
management, construction and other<br />
activities.<br />
• Fluvial system filters have been greatly<br />
modified and in the case of artificial<br />
impoundments have increased in<br />
importance.<br />
• River water discharge to oceans is<br />
controlled and reduced by water engineering<br />
and irrigation, with irretrievable<br />
losses on the order of 200 cubic<br />
kilometres (km 3 ) a year for reservoir<br />
evaporation and 2,000 km 3 a year for<br />
agriculture. 14<br />
the Earth’s natural water cycles<br />
• New and esoteric engineered compounds,<br />
many long-lived, are appearing<br />
in waterways. We have simultaneously<br />
increased and decreased the<br />
levels of various constituents in our<br />
waterways, but the exact nature of the<br />
acceleration or deceleration is complex<br />
and ambiguous.<br />
Human population and economic growth<br />
lead to increased demand for land and<br />
commodities for food production, housing<br />
and fuel (see chapters 2 and 4). The natural<br />
capacity for land to support human<br />
populations is insufficient, so people<br />
enhance food production with fertilizer<br />
and intensive agriculture. 15 Agricultural<br />
activities are also accelerating the elemental<br />
cycles of nitrogen and phosphorus,<br />
since more must be added to the landscape<br />
in biologically usable forms. Globally,<br />
nitrogen inputs have more than doubled,<br />
with similar increases in transport to the<br />
ocean. 16 Similar results have been documented<br />
for phosphorus. 17<br />
Changes in hydrologic factors associated<br />
with human activity have unintentionally<br />
exacerbated other changes related to land<br />
use. Erosion associated with changes in<br />
land use is increasing sediment delivery to<br />
aquatic systems, but much of this material<br />
is captured by increased reservoir capacity,<br />
with only a small net change at the basin<br />
mouth. 18 A third of sediment destined for<br />
coastal zones no longer arrives because of<br />
sediment trapping and water diversion, 19<br />
resulting in a net increase in erosion of<br />
deltas and other sensitive coastal settings<br />
that require a steady supply of land-derived<br />
sediment. 20 Reservoir construction<br />
appears to have attenuated silica, nitrogen<br />
and phosphorus fluxes, though the role appears<br />
to be less than for sediments. 21<br />
Net increases in nutrient loads (particularly<br />
nitrogen and phosphorus) have<br />
resulted in the eutrophication (excessive<br />
plant growth and decay) of lakes, rivers<br />
and receiving coastal waters and subsequent<br />
degradation of ecosystems, fisheries<br />
and human health. Anoxic dead zones<br />
result from excess nutrient inputs from<br />
agriculture, as from the Mississippi River<br />
basin into the Gulf of Mexico 22 and from<br />
the Yangtze River plume. 23 Alterations<br />
to inputs and ‘fluvial filters’ of nutrients<br />
(nitrogen, phosphorus, silicon) are changing<br />
elemental ratios in freshwater and<br />
downstream coastal waters. In addition, as<br />
different nutrient forms (such as organic<br />
and inorganic nitrogen) are shown to have<br />
contrasting watershed sources and human<br />
pressures, ratios among nutrient forms<br />
PART<br />
3<br />
Human pressures<br />
have greatly<br />
modified the<br />
behaviour of<br />
both hydrology<br />
and constituent<br />
transports,<br />
particularly over<br />
the last century<br />
Water in a changing world 175
PART<br />
3<br />
Chapter 10<br />
New modelling<br />
approaches<br />
now include<br />
mechanisms that<br />
hold promise<br />
for predicting<br />
global patterns<br />
of water quality<br />
may also be changing. 24 Shifting nutrient<br />
ratios alter the composition of biological<br />
assemblages in freshwater and coastal<br />
systems, including the occurrence and<br />
recurrence of harmful algal blooms. 25<br />
Recent progress in describing<br />
patterns in global water quality<br />
Despite limitations in characterizing<br />
human processes that determine the<br />
chemical characteristics of freshwater<br />
resources, syntheses of river observations<br />
and process studies have substantially advanced<br />
our ability to quantify the transformation<br />
of watershed-derived inputs<br />
into river loads and exports to coastal<br />
zones. 26 Recent models predict mean annual<br />
nutrient status based on geospatial<br />
datasets defining watershed inputs (natural<br />
and human), hydrologic and physical<br />
properties and biological processing potentials<br />
within rivers. They rely on global<br />
calibration of basin-scale parameters with<br />
river mouth observations to provide a<br />
consistent, spatially explicit picture of<br />
worldwide nutrient exports to coastal<br />
zones. Submodels of Global-NEWS (Nutrient<br />
Export from Watersheds), organized<br />
under the United Nations Educational,<br />
Scientific and Cultural Organization’s<br />
Intergovernmental Oceanic Commission,<br />
apply a consistent framework and datasets<br />
to calculate river exports of carbon, nitrogen<br />
and phosphorus (dissolved and particulate,<br />
inorganic and organic), enabling<br />
an integrated assessment of impacts of a<br />
range of human pressures on receiving<br />
waters. 27 But such models are static and<br />
have limited process representation, so<br />
they are unable to account for variability<br />
over relatively short time scales (less than<br />
1 month), which is critical in characterizing<br />
water quality.<br />
Recently developed spatially distributed,<br />
mechanistic models of nutrient fluxes<br />
through river systems have been applied<br />
to numerous basins and are important for<br />
understanding the mechanisms controlling<br />
material fluxes. 28 Such efforts have<br />
also been applied globally to integrate spatially<br />
distributed controlling mechanisms.<br />
For example, global terrestrial nitrogen<br />
models now account for within-basin patterns<br />
of nitrogen loading, hydrologic conditions,<br />
land surface characteristics and<br />
ecosystem processes to predict nitrogen<br />
export fluxes. 29<br />
Figure 10.4<br />
Surface area (thousands of square kilometers)<br />
200<br />
150<br />
100<br />
50<br />
0<br />
-60<br />
-40<br />
-20<br />
Flux (millions of kilograms a year)<br />
3,200<br />
2,400<br />
1,600<br />
800<br />
0<br />
-60<br />
Reservoir<br />
The spatial distribution of surface area and<br />
nitrogen inputs and removal by types of<br />
water bodies differ by latitude, most recent<br />
year available<br />
Large river<br />
Small river<br />
-40<br />
-20<br />
0<br />
Large river<br />
Source: Based on Wollheim et al. 2008.<br />
0<br />
Latitude<br />
Latitude<br />
20<br />
Small river<br />
20<br />
40<br />
40<br />
Reservoir<br />
60<br />
Lake<br />
60<br />
Lake<br />
80<br />
Aquatic N load<br />
80<br />
Recently, a spatially distributed modelling<br />
approach was applied to global inland<br />
aquatic systems to estimate the relative<br />
importance of small rivers, large rivers,<br />
lakes and reservoirs in the global aquatic<br />
nitrogen cycle by integrating the spatial<br />
distribution of inputs from land, discharge<br />
conditions, network geomorphology,<br />
position of various water bodies and rates<br />
of biological activity (figure 10.4). The relative<br />
importance of different types of water<br />
bodies varies with latitude because of the<br />
distribution of channel bottom surface<br />
area relative to the position of nitrogen<br />
inputs, which are increasingly determined<br />
by human inputs of fertilizers, sewage and<br />
animal wastes and by atmospheric deposition.<br />
30 These approaches now include<br />
key mechanisms that hold promise for<br />
predicting global patterns of water quality<br />
and thus of water supply compromised by<br />
pollution, changes in runoff and streamflow,<br />
runoff variability, temperature and<br />
hydraulic modification.<br />
Water pollution as a constraint on<br />
water supply<br />
Good water quality is important to human<br />
health and the health of aquatic ecosystems.<br />
Increasing pressures from development<br />
lead to deteriorating surface water<br />
and groundwater quality (table 10.5),<br />
rising human health challenges, growing<br />
requirements for water treatment and<br />
176 World Water Development Report 3
the Earth’s natural water cycles<br />
PART<br />
3<br />
greater likelihood of deteriorating ecosystem<br />
function. 31 Pollutants (including<br />
excess nutrients) may be retained in soils,<br />
aquifers and aquatic sediments for extended<br />
periods. This persistence can lead to<br />
continued mobilization long after human<br />
inputs have been suppressed or when affected<br />
sediments are later disturbed. 32<br />
Humans have long relied on dilution and<br />
transport by aquatic systems to manage<br />
pollution – and the water quality of freshwater<br />
resources. In some cases aquatic<br />
systems permanently remove pollutants to<br />
the atmosphere, as in the denitrification<br />
of excess nitrogen. These are important<br />
ecosystem services that depend on characteristics<br />
of the water cycle. Changes in<br />
the water cycle will lead to changes in the<br />
capacity of natural ecosystems to provide<br />
these services. 33 Because aquatic systems<br />
are highly connected, local changes in<br />
aquatic ecosystem services often cause<br />
impacts far downstream (see chapter 8).<br />
Pollutants can be categorized as those that<br />
directly affect human health and those<br />
that affect ecosystems. Pollutants affecting<br />
human health include fæcal coliform<br />
contamination, residual pesticides and<br />
metals. Examples include contamination<br />
of groundwater by arsenic in Bangladesh 34<br />
(see box 8.3 in chapter 8) and by mercury<br />
in the northeastern United States 35 and<br />
nitrogen in drinking water supplies (see<br />
chapter 6). 36<br />
In developed countries many pollution issues<br />
have been addressed and ameliorated<br />
over the last 40 years, especially those pertaining<br />
to point sources. But in developing<br />
countries pollution remains among the<br />
most important water resources problems.<br />
These include lack of sewage treatment<br />
and point source controls and contamination<br />
with pathogens, combined with poor<br />
access to clean water. 37 In developed countries<br />
non-point-source pollution remains a<br />
critical issue, in part because management<br />
requires multijurisdictional approaches<br />
that make implementation difficult. But<br />
successful policies addressing acidification<br />
of surface water by atmospheric deposition<br />
in Europe and North America are leading<br />
to the recovery of many surface waters<br />
from acidification, providing a hopeful<br />
model for multijurisdictional landscape<br />
management. 38<br />
Good water quality<br />
is important to<br />
human health<br />
and the health of<br />
aquatic ecosystems<br />
Table 10.5<br />
Principal symptoms of human-river system interactions and human pressures on water use<br />
Symptoms<br />
Land use<br />
change<br />
Mining and<br />
smelting<br />
Industrial<br />
transformation Urbanization Reservoirs Irrigation<br />
Other water<br />
management<br />
Organic matter + + – + + + + + – – – +<br />
Salts + + + + + + + + + +<br />
Acids<br />
Direct inputs + + +<br />
Atmospheric changes + + + + +<br />
Metal<br />
Direct inputs + + + + + – – –<br />
Atmospheric<br />
inputs changes + + + + + +<br />
Historical + + + + + – – –<br />
Total suspended solids + + + + + + + – – – - -<br />
Nutrients + + + + + + – – + –<br />
Water-borne diseases + – + + + + + +<br />
Persistent organic pollutants<br />
Direct inputs + + + + + + – –<br />
Atmospheric inputs + + +<br />
Historical + + + + +<br />
Mean runoff + – – + – – – –<br />
Flow regime × × ××× × ×<br />
Aquatic habitat changes × ×× ×× ××× × ×××<br />
Note: Amplitude of change ranges from + to + + + (increase) and – to – – – (decrease). The × symbols refer to magnitude of change without an indication<br />
of direction.<br />
Source: From Meybeck 2003.<br />
Water in a changing world 177
PART<br />
3<br />
Chapter 10<br />
Notes<br />
1.<br />
2.<br />
Postel, Daily, and Ehrlich 1996.<br />
IPCC 2007.<br />
3. Vörösmarty, Leveque, and Revenga<br />
2005.<br />
4. Vörösmarty, Leveque, and Revenga<br />
2005.<br />
5. Vörösmarty et al. 2005.<br />
6. CRED 2002.<br />
7. Olden and Poff 2003.<br />
8. Margat 2008.<br />
9. Döll and Fiedler 2007; Vörösmarty,<br />
Leveque, and Revenga 2005.<br />
10. Morris et al. 2003; Zekster and Margat<br />
2003.<br />
11. Vörösmarty and Meybeck 2004.<br />
12. Seitzinger et al. 2006; Cole et al. 2007;<br />
Battin et al. 2008.<br />
13. Meybeck and Vörösmarty 2005.<br />
14. Shiklomanov and Rodda 2003.<br />
15. Imhoff et al. 2004; Haberl et al. 2007.<br />
16. Green et al. 2004; Bouwman et al. 2005.<br />
17. Harrison, Caraco, and Seitzinger 2005;<br />
Seitzinger et al., 2005.<br />
18. Syvitski et al. 2005.<br />
19. Vörösmarty et al. 2003.<br />
20. Ericson et al. 2006.<br />
21. Dumont et al. 2005; Harrison et al.<br />
2005.<br />
22. Rabalais et al. 2007.<br />
23. Wang 2006.<br />
24. Seitzinger et al. 2005.<br />
25. Wang 2006.<br />
26. Seitzinger et al. 2006; Seitzinger et al.<br />
2005; Cole et al. 2007; Green et al.<br />
2004; Boyer et al. 2006; Smith et al.<br />
2003; Wollheim et al. 2008.<br />
27. See Seitzinger et al. 2005 and recent<br />
special issue of Global Biogeochemical<br />
Cycles.<br />
28. Ball and Trudgill 1995; Lunn et al. 1996;<br />
Alexander et al. 2002.<br />
29. Bouwman et al. 2005.<br />
30. Wollheim et al. 2008.<br />
31. MEA 2005.<br />
32. Meybeck 2003; Meybeck and Vörösmarty<br />
2005.<br />
33. Hinga and Batchelor 2005.<br />
34. Mukherjee et al. 2006.<br />
35. Driscoll et al. 2007.<br />
36. Townsend et al. 2003.<br />
37. WHO/UNICEF 2004.<br />
38. Driscoll et al. 2003; Warby, Johnson,<br />
and Driscoll 2005.<br />
References<br />
Alcamo, J., P. Döll, T. Henrichs, F. Kaspar,<br />
B. Lehner, T. Rösche, and S. Siebert.<br />
2003. Global Estimates of Water Withdrawals<br />
and Availability under Current<br />
and Future ‘‘Business-As-Usual’’ Conditions.<br />
Hydrological Sciences Journal 48 (3):<br />
339-48.<br />
Alexander, R. B, P. J. Johnes, E. W. Boyer,<br />
and R. A. Smith. 2002. A Comparison of<br />
Models for Estimating the Riverine Export<br />
of Nitrogen from Large Watersheds.<br />
Biogeochemistry 57/58: 295-339.<br />
Ball, J., and S. T. Trudgill. 1995. Overview<br />
of Solute Modeling. In Solute Modelling<br />
in Catchment Systems, ed. S. T. Trudgill.<br />
Chichester, UK: John Wiley and Sons.<br />
Battin, T. J., L. A. Kaplan, S. Findlay, C. S.<br />
Hopkinson, E. Marti, A. I. Packman,<br />
J. D. Newbold, and F. Sabater. 2008.<br />
Biophysical Controls on Organic Carbon<br />
Fluxes in Fluvial Networks. Nature Geosciences<br />
1 (2): 95-100.<br />
Bouwman, A. F., G. Van Drecht, J. M.<br />
Knoop, A. H. W. Beusen, and C. R. Meinardi.<br />
2005. Exploring Changes in River<br />
Nitrogen Export to the World’s Oceans.<br />
Global Biogeochemical Cycles 19, GB1002,<br />
doi:10.1029/2004GB002314.<br />
Boyer, E. W., R. W. Howarth, J. N. Galloway,<br />
F. J. Dentener, P. A. Green, and C.<br />
J. Vörösmarty. 2006. Riverine Nitrogen<br />
Export from the Continents to the<br />
Coasts. Global Biogeochemical Cycles 20,<br />
GB1S91, doi:10.1029/2005GB002537.<br />
Cole, J. J., Y. T. Prairie, N. F. Caraco, W. H.<br />
McDowell, L. J. Tranvik, R. G. Striegl, C.<br />
M. Duarte, P. Kortelainen, J. A. Downing,<br />
J. J. Middelburg, and J. Melack.<br />
2007. Plumbing the Global Carbon<br />
Cycle: Integrating Inland Waters into the<br />
Terrestrial Carbon Budget. Ecosystems 10<br />
(1): 171-84.<br />
CRED (Centre for Research on the Epidemiology<br />
of Disasters). 2002. EM-DAT:<br />
Emergency Events Database. www.cred.<br />
be/emdat.<br />
Dilley, M., R. S. Chen, U. Deichmann, A. L.<br />
Lerner-Lam, M. Arnold, with J. Agwes,<br />
P. Buys, O. Kjekstad, B. Lyon, and G.<br />
Yetman. 2005. Natural Disaster Hotspots:<br />
A Global Risk Analysis: Synthesis Report.<br />
New York: Columbia University.<br />
Dirmeyer, P., X. Gao, and T. Oki. 2002.<br />
GSWP-2: The Second Global Soil Wetness<br />
Project Science and Implementation Plan.<br />
IGPO Publication Series No. 37, International<br />
GEWEX (Global Energy and Water<br />
Cycle Experiment) Project Office.<br />
Döll, P., and K. Fiedler. 2007. Global-Scale<br />
Modelling of Groundwater Recharge.<br />
Hydrology and Earth System Sciences 4<br />
(6): 4069–4124.<br />
Döll, P., F. Kaspar, and B. Lehner. 2003. A<br />
Global Hydrological Model for Deriving<br />
Water Availability Indicators: Model Tuning<br />
and Validation. Journal of Hydrology<br />
270 (1): 105–134.<br />
Driscoll, C. T., K. M. Driscoll, K. M. Roy,<br />
and M. J. Mitchell. 2003. Chemical<br />
Response of Lakes in the Adirondack<br />
Region of New York to Declines in Acidic<br />
Deposition. Environmental Science and<br />
Technology 37: 2036-42.<br />
Driscoll, C. T., Y. J. Han, C. Y. Chen, D. C.<br />
Evers, K. F. Lambert, T. M. Holsen, N.<br />
C. Kamman, and R. K. Munson. 2007.<br />
Mercury Contamination in Forest and<br />
Freshwater Ecosystems in the Northeastern<br />
United States. BioScience 57 (1):<br />
17-28.<br />
Dumont, E., J. A. Harrison, C. Kroeze, E.<br />
J. Bakker, and S. P. Seitzinger. 2005.<br />
Global Distribution and Sources of<br />
Dissolved Inorganic Nitrogen Export<br />
to the Coastal Zone: Results from a<br />
Spatially Explicit, Global Model. Global<br />
Biogeochemical Cycles 19, GB4S02,<br />
doi:10.1029/2005GB002488.<br />
Ericson, J. P., C. J. Vörösmarty, S. L. Dingman,<br />
L. G. Ward, and M. Meybeck.<br />
2006. Effective Sea-Level Rise in Deltas:<br />
Causes of Change and Human-Dimension<br />
Implications. Global & Planetary<br />
Change 50 (1): 63-82.<br />
Federer, C. A., C. J. Vörösmarty, and B.<br />
Fekete. 2003. Sensitivity of Annual<br />
Evaporation to Soil and Root Properties<br />
in Two Models of Contrasting Complexity.<br />
Journal of Hydrometeorology 4 (1):<br />
1276-90.<br />
Fekete, B. M., C. J. Vörösmarty, and W.<br />
Grabs. 2002. High Resolution Fields<br />
of Global Runoff Combining Observed<br />
River Discharge and Simulated Water Balances.<br />
Global Biogeochemical Cycles 6 (3),<br />
doi:10.1029/1999GB001254.<br />
Green, P. A., C. J. Vörösmarty, M. Meybeck,<br />
J. N. Galloway, B. J. Peterson,<br />
and E. W. Boyer. 2004. Pre-Industrial<br />
and Contemporary Fluxes of Nitrogen<br />
through Rivers: A Global Assessment<br />
Based on Typology. Biogeochemistry 68<br />
(1): 71-105.<br />
Haberl, H., K. H. Erb, F. Krausmann, V.<br />
Gaube, A. Bondeau, C. Plutzar, S.<br />
Gingrich, W. Lucht, and M. Fischer-<br />
Kowalski. 2007. Quantifying and Mapping<br />
the Human Appropriation of Net<br />
Primary Production in Earth’s Terrestrial<br />
Ecosystems. Proceedings of the National<br />
Academy of Sciences of the United States of<br />
America 104:12942-45.<br />
178 World Water Development Report 3
the Earth’s natural water cycles<br />
3 PART<br />
Harrison, J. A., N. Caraco, and S. P.<br />
Seitzinger. 2005. Global Patterns and<br />
Sources of Dissolved Organic Matter<br />
Export to the Coastal Zone: Results<br />
from a Spatially Explicit Global Model.<br />
Global Biogeochemical Cycles 19, doi<br />
10.1029/2005gb002480.<br />
Harrison, J. A., S. P. Seitzinger, A. F.<br />
Bouwman, N. F. Caraco, A. H. W.<br />
Beusen, and C. J. Vörösmarty. 2005.<br />
Dissolved Inorganic Phosphorus Export<br />
to the Coastal Zone: Results from a<br />
Spatially Explicit, Global Model. Global<br />
Biogeochemical Cycles 19, GB4S03,<br />
doi:10.1029/2004GB002357.<br />
Hinga, K. R., and A. Batchelor. 2005. Waste<br />
Detoxification. In Millennium Ecosystem<br />
Assessment, Volume 1: Conditions and<br />
Trends Working Group Report, ed., R. Hassan,<br />
R. Scholes, and N. Ash. Washington,<br />
DC: Island Press.<br />
Imhoff, M. L., L. Bounoua, T. Ricketts, C.<br />
Loucks, R. Harriss, and W. T. Lawrence.<br />
2004. Global Patterns in Human<br />
Consumption of Net Primary Production.<br />
Nature 429 (6994): 870-73.<br />
IPCC (Intergovernmental Panel on Climate<br />
Change). 2007. Climate Change<br />
2007: The Physical Science Basis. Summary<br />
for Policymakers. Contribution of Working<br />
Group I to the Fourth Assessment<br />
Report of the Intergovernmental Panel<br />
on Climate Change, ed., S. Solomon, D.<br />
Qin, M. Manning, Z. Chen, M. Marquis,<br />
K. B. Averyt, M. Tignor, and H. L. Miller.<br />
Cambridge, UK: Cambridge University<br />
Press.<br />
Lunn, R. J., R. Adams, R. Mackay, and S.<br />
M. Dunn. 1996. Development and Application<br />
of a Nitrogen Modeling System<br />
for Large Catchments. Journal of Hydrology<br />
174 (1): 285-304.<br />
Margat, J. 2008. Les Eaux Souterraines: Une<br />
Richesse Mondial. Paris: United Nations<br />
Educational, Scientific, and Cultural<br />
Organization<br />
MEA (Millennium Ecosystem Assessment).<br />
2005. Ecosystems and Human Well-being:<br />
Wetlands and Water Synthesis. Washington,<br />
DC: World Resources Institute.<br />
Meybeck, M. 2003. Global Analysis of River<br />
Systems: From Earth System Controls to<br />
Anthropocene Syndromes. Philosophical<br />
Transactions of the Royal Society of London<br />
B 358: 1,935-55.<br />
Meybeck, M., P. Green, and C. J. Vörösmarty.<br />
2001. A New Typology for<br />
Mountains and Other Relief Classes: An<br />
Application to Global Continental Water<br />
Resources and Population Distribution.<br />
Mountain Research and Development 21<br />
(1): 34-45.<br />
Meybeck, M., and C. J. Vörösmarty. 2005.<br />
Fluvial Filtering of Land-to-Ocean Fluxes:<br />
From Natural Holocene Variations to Anthropocene.<br />
Comptes Rendus Geoscience<br />
337: 107-23.<br />
Morris, B. L, A. R. Lawrence, P. J. Chilton,<br />
B. Adams, R. Calow, and B. A. Klinck.<br />
2003. Groundwater and Its Susceptibility<br />
to Degradation: A Global Assessment of<br />
the Problem and Options for Management.<br />
Early Warning and Assessment<br />
Reports Series, RS.03–3, United Nations<br />
Environment Programme, Nairobi,<br />
Kenya.<br />
Mukherjee, A., M. K. Sengupta, M. A.<br />
Hossain, S. Ahamed, B. Das, B. Nayak,<br />
D. Lodh, M. M. Rahman, and D.<br />
Chakraborti. 2006. Arsenic Contamination<br />
in Groundwater: A Global Perspective<br />
with Emphasis on the Asian Scenario.<br />
Journal of Health, Population and Nutrition<br />
24 (2): 142-63.<br />
Oki, T., Y. Agata, S. Kanae, T. Saruhashi,<br />
and T. Musiake. 2003. Global Water<br />
Resources Assessment under Climatic<br />
Change in 2050 Using TRIP. IAHS Publication<br />
280: 124–33.<br />
Olden, J. D., and N. L. Poff. 2003. Redundancy<br />
and the Choice of Hydrologic<br />
Indices for Characterizing Streamflow<br />
Regimes. River Research and Applications<br />
19: 101-21.<br />
Postel, S. L, G. C. Daily, and P. R. Ehrlich.<br />
1996. Human Appropriation of Renewable<br />
Fresh Water. Science 271: 785-88.<br />
Rabalais, N. N., R. E. Turner, B. K. Sen<br />
Gupta, E. Platon, and M. L. Parsons.<br />
2007. Sediments Tell the History of<br />
Eutro phication and Hypoxia in the<br />
Northern Gulf of Mexico. Ecological Applications<br />
17: S129-S143.<br />
Seitzinger, S., J. A. Harrison, J. K. Bohlke,<br />
A. F. Bouwman, R. Lowrance, B. J.<br />
Peterson, C. R. Tobias, and G. van<br />
Drecht. 2006. Denitrification across<br />
Landscapes and Waterscapes: A Synthesis.<br />
Ecological Applications 6: 1051-76.<br />
Seitzinger, S. P., J. A. Harrison, E. Dumont,<br />
A. H. W. Beusen, and A. F. Bouwman.<br />
2005. Sources and Delivery of Carbon,<br />
Nitrogen, and Phosphorus to the Coastal<br />
Zone: An Overview of Global Nutrient<br />
Export from Watersheds (NEWS)<br />
models and their application. Global<br />
Biogeochemical Cycles 19: GB4S01,<br />
doi:10.1029/2005GB002606.<br />
Shiklomanov, I. A., and J. Rodda, eds.<br />
2003. World Water Resources at the Beginning<br />
of the 21st Century. Cambridge, UK:<br />
Cambridge University Press.<br />
Smith, S.V., D. Swaney, L. Talaue-<br />
McManus, J. Bartley, P. Sandhei, C.<br />
McLacghlin, V. Dupra, C. Crossland,<br />
R. Buddemeier, B. Maxwell, and F.<br />
Wulff. 2003. Humans, Hydrology, and<br />
the Distribution of Inorganic Nutrient<br />
Loading to the Ocean. BioScience 53<br />
(3): 235-45.<br />
Syvitski, J. P. M., C. J. Vörösmarty, A. J.<br />
Kettner, and P. Green. 2005. Impact<br />
of Humans on the Flux of Terrestrial<br />
Sediment to the Global Coastal Ocean.<br />
Science 308 (5720): 376-80.<br />
Townsend, A. R., R. W. Howarth, F. A. Bazzaz,<br />
M. S. Booth, C. C. Cleveland, S. K.<br />
Collinge, A. P. Dobson, P. R. Epstein,<br />
D. R. Keeney, M. A. Mallin, C. A. Rogers,<br />
P. Wayne, and A. H. Wolfe. 2003.<br />
Human Health Effects of a Changing<br />
Global Nitrogen Cycle. Frontiers in Ecology<br />
and the Environment 1: 240-46.<br />
Vörösmarty, C. J., E. M. Douglas, P. A.<br />
Green, and C. Revenga. 2005. Geospatial<br />
Indicators of Emerging Water Stress:<br />
An Application to Africa. Ambio 34:<br />
230-36.<br />
Vörösmarty, C. J., C. A. Federer, and A.<br />
Schloss. 1998. Potential Evaporation<br />
Functions Compared on U.S. Watersheds:<br />
Implications for Global-Scale<br />
Water Balance and Terrestrial Ecosystem<br />
Modeling. Journal of Hydrology 207 (3-4):<br />
147-69.<br />
Vörösmarty, C. J., C. Leveque, and C. Revenga.<br />
2005. Fresh Water. In Millennium<br />
Ecosystem Assessment, Volume 1, Conditions<br />
and Trends Working Group Report.<br />
Washington, DC: Island Press.<br />
Vörösmarty, C. J., M. Meybeck, B. Fekete,<br />
K. Sharma, P. Green, and J. Syvitski.<br />
2003. Anthropogenic Sediment<br />
Retention: Major Global Impact from<br />
Registered Impoundments. Global and<br />
Planetary Change 39 (1-2): 169-190.<br />
Vörösmarty, C. J., and M. Meybeck.<br />
2004. Responses of Continental Aquatic<br />
Systems at the Global Scale: New<br />
Paradigms, New Methods. In Vegetation,<br />
Water, Humans and the Climate, ed., P.<br />
Kabat, M. Claussen, P. A. Dirmeyer, J. H.<br />
C. Gash, L. Bravo de Guenni, M. Meybeck,<br />
R. A. Pielke Sr., C. J. Vörösmarty, R.<br />
W. A. Hutjes, and S. Lutkemeier. Berlin:<br />
Springer.<br />
Wang, B. D. 2006. Cultural Eutrophication<br />
in the Changjiang (Yangtze<br />
River) Plume: History and Perspective.<br />
Estuarine Coastal and Shelf Science 69:<br />
471-77.<br />
Warby, R. A. F., C. E. Johnson, and C.<br />
T. Driscoll. 2005. Chemical Recovery<br />
of Surface Waters across the Northeastern<br />
United States from Reduced<br />
Inputs of Acidic Deposition: 1984-2001.<br />
Water in a changing world 179
PART<br />
3<br />
Chapter 10<br />
Environmental Science & Technology 39<br />
(17): 6,548-54.<br />
WHO (World Health Organization)/<br />
UNICEF (United Nations Children’s<br />
Fund). 2004. Meeting the MDG Drinking<br />
Water and Sanitation Target: A Mid-term<br />
Assessment of Progress. Geneva: World<br />
Health Organization and New York:<br />
United Nations Children’s Fund.<br />
WHYMAP. 2008. Groundwater Resources<br />
of the World. Hannover: BRG and Paris:<br />
United Nations Educational, Scientific,<br />
and Cultural Organization.<br />
Wollheim, W. M., C. J. Vörösmarty, A.<br />
F. Bouwman, P. A. Green, J. Harrison,<br />
E. Linder, B. J. Peterson, S.<br />
Seitzinger, and J. P. M. Syvitski.<br />
2008. Global N Removal by Freshwater<br />
Aquatic Systems: A Spatially<br />
Distributed, within-Basin Approach. Global<br />
Biogeochemical Cycles 22, GB2026,<br />
doi:10.1029/2007GB002963.<br />
Zektser, I., and J. Margat. 2003.<br />
Groundwater Resources of the World<br />
and Their Use. Paris: United Nations<br />
Educational, Scientific, and Cultural<br />
Organization– International Hydrological<br />
Programme.<br />
180 World Water Development Report 3
the Earth’s natural water cycles<br />
Chapter 11<br />
Changes in the<br />
global water cycle<br />
PART<br />
3<br />
Author: Dennis P. Lettenmaier<br />
Contributors: Vladimir Aizen, Abou Amani, Theodore Bohn, Filippo Giorgi, Stephan Harrison,<br />
Tom Huntington, Rick Lawford, Peter Letitre, Harry Lins, Jun Magomi, Gi-Kyun Park, Igor<br />
Severskiy, W. James Shuttleworth, Pratap Singh, Soroosh Sorooshian, Willi Struckmeier,<br />
Kuni Takeuchi, Lena Tallaksen, Charles Vörösmarty, Tandorig Yan and Tinjun Zhang<br />
Coordinator: Andras Szöllösi-Nagy (UNESCO)<br />
Facilitator: Denis Hughes<br />
Key messages<br />
Among the consequences of a changing hydrologic cycle is its<br />
interaction with the terrestrial carbon cycle. The terrestrial biosphere<br />
may have taken up roughly 25% of anthropogenic carbon<br />
emissions during the last century; it is unclear how long<br />
this can continue.<br />
Most climate scientists agree that global warming will result in<br />
an intensification, acceleration or enhancement of the global<br />
hydrologic cycle, and there is some observational evidence that<br />
this is already happening.<br />
It is increasingly clear that the assumption of statistical stationarity<br />
is no longer a defensible basis for water planning.<br />
Water is essential to life, sustainable<br />
economic growth and the functioning<br />
of ecosystems. These are all affected by<br />
variations in water storage and fluxes at<br />
the land surface – storage in soil moisture<br />
and groundwater, snow, and surface water<br />
in lakes, wetlands and reservoirs – and<br />
precipitation, runoff and evaporative<br />
fluxes to and from the land surface. Water<br />
planners have generally seen these key<br />
elements in the land surface water cycle as<br />
at least approximately statistically stationary,<br />
their challenge being to characterize<br />
and buffer against natural variability. Over<br />
the last several decades, however, studies<br />
of changes in streamflow, snowpack and<br />
evapotranspiration have made it increasingly<br />
clear that the assumption of statistical<br />
stationarity is no longer defensible.<br />
Arguing that ‘stationarity is dead’, at least<br />
for water planning, some researchers are<br />
making the case for a new initiative in<br />
water management to deal with nonstationarity<br />
problems. 1 Meeting this challenge<br />
requires understanding the nature of<br />
observed changes in the land surface water<br />
cycle – the objective of this chapter.<br />
Changes in the water cycle<br />
This section reviews current knowledge<br />
about changes in the land surface water<br />
cycle, both in surface fluxes (precipitation<br />
and evapotranspiration) and storage (soil<br />
moisture, groundwater, and lakes and reservoirs).<br />
It also discusses interactions between<br />
the water and carbon cycles as well as some<br />
aspects of current hydrologic observations.<br />
Observed trends in precipitation<br />
Contributors: Filippo Giorgi with Abou Amani<br />
Precipitation is a key component of the<br />
Earth’s hydrologic cycle and one of the most<br />
difficult to observe and model accurately. It<br />
is determined by large-scale processes (such<br />
as the location of major storm tracks) as well<br />
as local processes (such as topographical<br />
uplift) and therefore exhibits pronounced<br />
variability at a wide range of spatial and<br />
temporal scales. In addition, the mode of<br />
precipitation – its frequency, intensity and<br />
occurrence in liquid or solid form – is often<br />
more important than the total amount<br />
in affecting the hydrologic cycle and the<br />
Water in a changing world 181
PART<br />
3<br />
Chapter 11<br />
observations<br />
of precipitation<br />
do not show a<br />
continuous trend<br />
throughout the<br />
century but rather<br />
variable trends at<br />
multidecadal scales<br />
human and natural systems that depend on<br />
it (see chapter 7 for the implications of climate<br />
change and changes in the hydrologic<br />
cycle on uncertainty in agriculture).<br />
Another critical problem is that precipitation<br />
observations can be subject to<br />
considerable measurement error. Measurement<br />
station densities in many mountainous<br />
regions and remote areas are low and<br />
uneven, precluding proper estimates of<br />
regionally averaged values. While remotely<br />
sensed measurements offer a global and<br />
regularly spaced picture, they are based on<br />
uncertain conversions of radiometric data<br />
into precipitation rates. Furthermore, precipitation<br />
variability at multidecadal scales<br />
can mask long-term trends. Because this<br />
variability increases as the spatial scale<br />
decreases, identifying regional and local<br />
trends is especially difficult. 2<br />
The Intergovernmental Panel on Climate<br />
Change recently completed a thorough<br />
assessment of observed precipitation trends<br />
in the 20th century at global and regional<br />
scales based on six station and satellite observation<br />
datasets. 3 Over global land areas<br />
precipitation shows an increasing trend<br />
superimposed on large interdecadal oscillations<br />
from the beginning of the century<br />
to the 1950s. 4 This is followed by a decreasing<br />
trend until the end of the century,<br />
still superimposed on large interdecadal<br />
variability. In other words, observations<br />
of precipitation do not show a continuous<br />
trend throughout the century but rather<br />
variable trends at multidecadal scales.<br />
Map 11.1 shows the geographic distribution<br />
of annual precipitation for 1901-2005<br />
and 1979-2005. During the second period<br />
anthropogenic greenhouse gas emissions<br />
are estimated to be dominant in determining<br />
global warming. 5 The two precipitation<br />
patterns differ greatly due to the<br />
large multidecadal variability of regional<br />
precipitation.<br />
Map 11.1 Trend in annual precipitation rate, 1901-2005 and 1979-2005<br />
Trend in annual<br />
precipitation, 1901-2005<br />
(percent per century)<br />
-100 to -80<br />
-80 to -60<br />
-60 to -40<br />
-40 to -20<br />
-20 to -5<br />
-5 to 5<br />
5 to 20<br />
20 to 40<br />
40 to 60<br />
60 to 100<br />
No data<br />
Trend in annual<br />
precipitation, 1979-2005<br />
(percent per decade)<br />
-100 to -60<br />
-60 to -45<br />
-45 to -30<br />
-30 to -15<br />
-15 to -3<br />
-3 to 3<br />
3 to 15<br />
15 to 30<br />
30 to 45<br />
No data<br />
+ is a trend that is statistically significant at the 5% level.<br />
Source: IPCC 2007, chapter 3.<br />
182 World Water Development Report 3
changes in the global water cycle<br />
PART<br />
3<br />
The most striking example of this difference<br />
is the Sahel region in Africa, where<br />
the 1901-2005 trend is negative, but the<br />
1979-2005 trend is positive. One study<br />
finds large multidecadal fluctuations in<br />
annual rainfall anomalies for the Sahel for<br />
1895-2000, with largely positive anomalies<br />
for 1925-70 and pronounced drought conditions<br />
for 1970-2000. 6 In addition, while<br />
the precipitation trend between 1901<br />
and 2000 is negative, after about 1985 it<br />
becomes positive. This example illustrates<br />
the difficulty of identifying long-term<br />
changes in precipitation trends, especially<br />
at the regional scale.<br />
During 1901-2005 there were positive<br />
precipitation trends over eastern North<br />
America, southern South America, Northern<br />
Europe, Central Asia and Western<br />
Australia and negative trends over the<br />
Sahel, Southern Africa, the Mediterranean<br />
and Southern Asia (see map 11.1). During<br />
1979-2005 additional negative trends<br />
emerged, such as over portions of the western<br />
United States, northwestern India and<br />
Pakistan; however, the precipitation trends<br />
are generally noisy.<br />
Variables that integrate components of the<br />
hydrologic cycle may be more indicative<br />
for identifying precipitation trends. An<br />
example is the Palmer Drought Severity<br />
Index (PDSI), an index of drought that<br />
measures the cumulative deficit in soil<br />
moisture derived from precipitation and<br />
temperature budgets. Positive values imply<br />
more severe drought conditions. Map 11.2<br />
shows that the PDSI has increased globally<br />
during the 20th century but that geographic<br />
variability in the PDSI trend became<br />
more pronounced. Areas increasingly<br />
subject to more severe drought conditions<br />
include the Sahel and West Africa, Southern<br />
Africa, the Mediterranean, Central<br />
America, South and South-East Asia, Eastern<br />
Australia, North and Northeast China,<br />
Southeastern Brazil and the Northern<br />
Variables that<br />
integrate<br />
components of<br />
the hydrologic<br />
cycle may be<br />
more indicative<br />
for identifying<br />
precipitation<br />
trends<br />
Map 11.2<br />
Geographic distribution of the trend in the Palmer Drought Severity Index (PDSI) and<br />
annual variations in the globally averaged PDSI, 1900-2000<br />
PDSI<br />
Less than -4<br />
-4 to -3<br />
-3 to -2<br />
-2 to -1<br />
-1 to 1<br />
1 to 2<br />
2 to 3<br />
3 to 4<br />
More than 4<br />
No data<br />
PDSI<br />
3<br />
2<br />
1<br />
0<br />
-1<br />
-2<br />
Trend line for decadal variations<br />
-3<br />
1900<br />
1920<br />
1940<br />
1960<br />
1980<br />
2000<br />
Note: The PDSI is a measure of drought severity based on precipitation and temperature information. Positive values imply more severe drought conditions.<br />
Source: Based on IPCC 2007, chapter 3.<br />
Water in a changing world 183
PART<br />
3<br />
Chapter 11<br />
Current methods<br />
of measuring<br />
evaporation are<br />
either too recent or<br />
too inaccurate to<br />
be used in analyses<br />
of long-term<br />
gradual change<br />
in evaporation<br />
Territories of North America. Areas with<br />
reduced drought trends include southern<br />
South America, the eastern United States,<br />
Northeastern Europe and the Ethiopian<br />
highlands.<br />
Several similarities are evident when these<br />
20th century trends in the PDSI are compared<br />
with projections of annual precipitation<br />
change from 22 coupled atmosphereocean<br />
general circulation models at the<br />
end of the 21st century prepared for IPCC<br />
scenario A1B (in the middle of the IPCC<br />
scenario range). 7 The Mediterranean Basin,<br />
Central America, Southern Africa, Southeastern<br />
Brazil and Eastern Australia, where<br />
the PDSI trend shows increased drought<br />
conditions, are projected to receive substantially<br />
less precipitation. These areas<br />
thus appear most at risk of water stress,<br />
presumably due to anthropogenic climate<br />
change. West Africa and the Sahel, where<br />
the positive PSDI trend is at a maximum,<br />
are not projected to be affected by large<br />
precipitation changes. This might be an<br />
indication that the Sahel drought of the<br />
last part of the 20th century was a natural<br />
climate fluctuation not directly tied to<br />
global warming. Similarly, areas of Central<br />
and East Asia where the PDSI trend<br />
was positive in the 20th century show<br />
increased precipitation in the 21st century<br />
model projections.<br />
As mentioned, the mode of precipitation<br />
may be more important than average precipitation<br />
in determining hydrologic impacts.<br />
Widespread increases in heavy precipitation<br />
events have been observed in<br />
some places where total precipitation has<br />
decreased, and more precipitation now<br />
falls as rain rather than snow in northern<br />
regions. 8 At the same time, the length, frequency<br />
and intensity of heat waves have<br />
increased widely. Consistent with a warmer<br />
atmosphere with a greater water-holding<br />
capacity, these changes are also found in<br />
IPCC climate projections under different<br />
greenhouse gas emission scenarios. 9<br />
Changes in evaporation and<br />
evapotranspiration<br />
Contributor: W. James Shuttleworth<br />
Actual evaporation can be measured either<br />
by integrating the water transferred into<br />
the atmosphere using micrometeorological<br />
techniques or by measuring the liquid<br />
water loss from representative sample<br />
volumes of the soil-atmosphere interface. 10<br />
All available methods, however, are either<br />
too recent or too inaccurate to be used<br />
in analyses of long-term gradual change<br />
in evaporation. 11 Consequently, there are<br />
little or no direct plot scale data on actual<br />
evaporation that are long-term or accurate<br />
enough.<br />
In the absence of sufficient data, alternative<br />
methods have been used. Some studies<br />
have diagnosed changes as the residual<br />
in the area-average water balance, 12 but<br />
most studies have used the measured rate<br />
of evaporation from evaporation pans,<br />
rates calculated using estimation equations,<br />
or both. Because many of these studies<br />
used the language of early evaporation<br />
theory instead of that of the physics and<br />
physiology of evaporation, confusion has<br />
resulted, generating much controversy. 13<br />
Two main explanations have been advanced<br />
for observed reductions in pan<br />
evaporation. The first is that open water<br />
evaporation has decreased because the net<br />
radiation available to support evaporation<br />
at the ground has declined, whether because<br />
of higher concentrations of atmospheric<br />
aerosols, increasing cloud cover,<br />
climate change or a combination of these.<br />
If a decline in net radiation were the only<br />
reason for the reduction in pan evaporation,<br />
and if all other meteorological, soil<br />
moisture and plant physiology influences<br />
on actual evaporation had remained<br />
unchanged, that would indicate an associated<br />
reduction in area-average actual<br />
evapotranspiration. 14<br />
Enhancement of the hydrologic cycle is<br />
an important feature of climate change<br />
projections, not only because water vapour<br />
is the most important greenhouse gas but<br />
also because the additional water in the<br />
atmosphere may alter cloud cover and thus<br />
affect surface solar radiation. The extent<br />
to which cloud cover may increase is not<br />
yet clear. Some observational studies have<br />
calculated reductions in solar radiation of<br />
a few percent per decade based on calculated<br />
changes in open water and reference<br />
crop evaporation using historical data on<br />
hours of sunshine, implying cloud cover<br />
may be increasing in some regions. 15<br />
Meanwhile, studies reporting significant<br />
changes in observed solar radiation have<br />
confidently ascribed them to local or<br />
regional changes in atmospheric aerosol<br />
concentration. 16 Regionally varying, but<br />
nonetheless widespread, impacts of increasing<br />
atmospheric aerosols and associated<br />
reductions in surface solar radiation<br />
are now well documented 17 and modelled<br />
in general circulation models. 18 One study<br />
estimates reductions in solar radiation of<br />
about 2.75% a decade, 19 while the IPCC<br />
estimates the change in global radiative<br />
forcing due to sulphate aerosols since 1750<br />
184 World Water Development Report 3
changes in the global water cycle<br />
PART<br />
3<br />
at between -0.2 and -0.8 watts per square<br />
metre (m 2 ). 20<br />
Thus, the evidence is now strong of a real<br />
but regionally dependent reduction in<br />
surface solar radiation over the last few<br />
decades, a result of either increasing cloud<br />
cover or increased aerosol concentration.<br />
This is likely to be at least one contributory<br />
factor in the observed reduction in<br />
pan evaporation. Recently, however, a<br />
study has used a physically based model of<br />
pan evaporation in the semi-arid climates<br />
of Australia to demonstrate that decreased<br />
wind speed is the dominant cause of reduced<br />
pan evaporation there. 21<br />
A second widely reported explanation for<br />
reduced pan evaporation is that the average<br />
near-surface vapour pressure deficit<br />
has shrunk or that the average near-surface<br />
wind speed has slowed, or a combination<br />
of the two. Most discussion of this potential<br />
mechanism has assumed the validity<br />
of the hypothetical complementary<br />
relationship between actual and potential<br />
evaporation proposed by Bouchet. 22 Modelling<br />
studies, however, do not support the<br />
numerical accuracy of this complementary<br />
relationship. 23 Nonetheless, the basic<br />
mechanism for a shrinking of the vapour<br />
pressure deficit through atmospheric<br />
conditioning by enhanced regional actual<br />
evaporation is plausible, and it has been<br />
shown that, when surface-atmosphere coupling<br />
processes are considered, Bouchet’s<br />
complementary relationship is approximately<br />
correct. 24<br />
In fact, there is substantial evidence that<br />
open water evaporation and reference crop<br />
evapotranspiration rates are increasing<br />
and that there are regional changes in the<br />
vapour pressure deficit and wind speed. 25<br />
In addition, some studies have used<br />
historical climate data to investigate the<br />
relative importance of the meteorological<br />
controls on open water and reference<br />
crop evapotranspiration. 26 These studies<br />
offer no clear evidence that change in<br />
surface radiation or regional wind speed is<br />
consistently the dominant – let alone the<br />
sole – cause of observed changes in pan<br />
evaporation and some evidence of regional<br />
difference in the relative importance of<br />
various meteorological variables. In addition,<br />
several studies provide evidence<br />
that on average for large areas of Asia and<br />
North America actual evapotranspiration<br />
is increasing, even though pan evaporation<br />
is decreasing. 27<br />
Interpreting observed pan evaporation data<br />
in terms of actual regional evaporation is<br />
therefore complex. One study argues that<br />
two distinct influences are involved: type A<br />
processes related to large-scale changes in<br />
atmospheric concentrations and circulation,<br />
which modify surface evaporation<br />
rates in the same direction, and type B processes<br />
related to coupling between the surface<br />
and the atmospheric boundary layer<br />
at landscape scale, which usually modify<br />
area-average evaporation and pan evaporation<br />
in different directions. 28 Evidence suggests<br />
that both influences are present, with<br />
their relative strengths depending on the<br />
regional climate aridity. In semi-arid and<br />
arid regions the effect of decreased wind<br />
speed, higher aerosol concentrations and<br />
increasing cloud cover may be the dominant<br />
cause of the observed reduction in<br />
pan evaporation. However, because actual<br />
evaporation is so strongly determined by<br />
available precipitation in these regions,<br />
it does not necessarily follow that timeaverage<br />
actual evapotranspiration is decreasing.<br />
In humid regions evidence suggests<br />
that actual evaporation has increased<br />
despite an aerosol- or cloud-cover-induced<br />
decrease in solar radiation.<br />
Soil moisture<br />
Contributors: Soroosh Sorooshian<br />
with Jialun Li and Gi-Kyun Park<br />
Understanding and predicting variations<br />
in the water cycle require knowledge of<br />
soil moisture variations. These can be<br />
investigated using direct measurement,<br />
remote-sensing, meteorological-based<br />
methods and model simulations. Each<br />
method has shortcomings. In-situ soil<br />
moisture measurements are too sparse to<br />
draw conclusions about multidecadal soil<br />
moisture trends at a global scale. Satellite<br />
sensors are suboptimal in microwave frequency,<br />
and record lengths are too short<br />
to provide meaningful trend information.<br />
Physically based model reconstructions<br />
using precipitation and temperature to<br />
estimate soil wetness provide the best current<br />
insights into long-term soil moisture<br />
trends, but studies using these methods<br />
are not comprehensive enough to fully<br />
explain the uncertainties and to generate<br />
unambiguous results.<br />
In-situ measurements are crucial for<br />
climatological analysis, model evaluation<br />
and ground truthing remote sensing data.<br />
Ground observations are limited at both<br />
spatial and temporal scales and can represent<br />
only a small portion of the Earth’s<br />
land surface. Gravimetric soil moisture<br />
content has been measured in the Russian<br />
Federation and Ukraine for about 40<br />
years and in China for about 20 years.<br />
there is substantial<br />
evidence that open<br />
water evaporation<br />
and reference crop<br />
evapotranspiration<br />
rates are increasing<br />
and that there are<br />
regional changes<br />
in the vapour<br />
pressure deficit<br />
and wind speed<br />
Water in a changing world 185
PART<br />
3<br />
Chapter 11<br />
Inconsistencies in<br />
national hydrologic<br />
monitoring<br />
networks, data<br />
access and data<br />
quality prevent<br />
systematic and<br />
comprehensive<br />
global assessments<br />
of trends in runoff<br />
and streamflow<br />
Advanced soil moisture sensors such as<br />
neutron probes, time domain reflectrometry,<br />
frequency domain reflectometry and<br />
tensiometers provide more continuous<br />
measurements. The Soil Climate Analysis<br />
Network of the US Department of Agriculture<br />
National Resources Conservation<br />
Service reports real-time soil moisture<br />
observations using meteor burst communication,<br />
with some records going back to<br />
the early 1990s. 29<br />
Gravimetrically observed soil moisture<br />
data for the Russian Federation and<br />
Ukraine for about 40 years show that summer<br />
soil moisture increased significantly<br />
from 1958 to the mid-1990s. Researchers<br />
suggest that solar dimming, a decrease in<br />
evaporation and an increase in carbon dioxide<br />
could be responsible, although contrary<br />
to model predictions based on global<br />
warming related to greenhouse gases. 30<br />
A study found strong correlations between<br />
the PDSI for 1870-2002 based on global<br />
gridded precipitation and surface temperature<br />
records and observed soil moisture<br />
content to 1 metre in depth during warm<br />
season months in China, Mongolia, the<br />
former Soviet Union and the United States<br />
(Illinois). 31 The study found that global<br />
land areas in both very dry (PDSI less than<br />
-3.0) and very wet (PDSI more than +3.0)<br />
conditions have increased from approximately<br />
20% to 38% since 1972, suggesting<br />
surface warming as the primary cause after<br />
the mid-1980s.<br />
Land surface models are a more sophisticated<br />
method than the PDSI for<br />
reconstructing long-term soil moisture<br />
variations. While the ability of models to<br />
faithfully reproduce observations is always<br />
an issue, studies using observations over<br />
Illinois 32 and a transect over Eurasia 33<br />
found that the variable infiltration capacity<br />
model accurately reproduced observed<br />
interseasonal and interannual variability.<br />
Another study used the variable infiltration<br />
capacity model to reconstruct soil moisture<br />
globally for 1950-2000 and found a<br />
small wetting trend at a global scale in the<br />
reconstructed soil moisture. 34 The study<br />
attributes the wetting trend primarily to<br />
increasing precipitation. The reconstructed<br />
trend in soil wetness in the United States is<br />
consistent with other studies. 35<br />
An alternative to land service models<br />
(which use observed records of surface climate<br />
variables) is coupled land-atmosphere<br />
model reanalysis output and coupled<br />
model climate reconstructions. These are<br />
reconstructions of a past period using<br />
a fixed version of a numerical weather<br />
prediction model, with assimilation of<br />
atmospheric and other data as though<br />
the model were being run in real time.<br />
Analyses of the variability in soil moisture<br />
in output from several recent global reanalyses<br />
found no long-term linear trends at<br />
the global scale. 36 An analysis of output<br />
from climate simulations of 25 general<br />
circulation models found that the models<br />
were unable to reproduce observed trends<br />
in soil moisture over the Russian Federation<br />
and Ukraine in the second half of the<br />
20th century. 37<br />
Remote sensing estimates of soil moisture<br />
offer another alternative to in-situ observations.<br />
Surface soil moisture can be retrieved<br />
from low-frequency microwave satellite<br />
data. Current satellite-based estimates of<br />
soil moisture (using mostly shorter wavelength<br />
sensors) reflect the water content of<br />
only the upper 1-2 centimetres of the soil<br />
column, because vegetation can mask the<br />
signature of the soil below. Data from the<br />
Gravity Recovery and Climate Experiment<br />
(GRACE) satellite have been used to represent<br />
terrestrial water storage variability in<br />
several studies since its launch in 2002. 38<br />
Major drawbacks to GRACE data are the low<br />
spatial resolution (hundreds of kilometres)<br />
and a wide ‘visual’ field that encompasses<br />
the total signature of variations in moisture<br />
storage from the centre of the Earth to the<br />
top of the atmosphere, so that sources of<br />
variations other than soil moisture (such as<br />
atmospheric moisture, snow water storage,<br />
groundwater, lakes and reservoirs) must be<br />
removed to analyse soil moisture trends<br />
and variability.<br />
Runoff and streamflow trends<br />
Contributors: Harry Lins with Lena Tallaksen<br />
Inconsistencies in national hydrologic<br />
monitoring networks, data access and data<br />
quality prevent systematic and comprehensive<br />
global assessments of trends in<br />
runoff and streamflow (see chapter 13).<br />
Sparse stream gauge networks in developing<br />
countries, often coupled with national<br />
data policies that restrict dissemination<br />
to regional or international data centres,<br />
limit the comprehensiveness of worldwide<br />
trend assessments. 39 Several studies<br />
of trends in streamflow have nevertheless<br />
been published. Most used stream<br />
gauge records that are ‘climate sensitive’,<br />
meaning that the data are from stations<br />
thought to be minimally affected by such<br />
confounding anthropogenic influences as<br />
upstream regulation, diversions, groundwater<br />
extractions and land use change.<br />
As a result, the trends reported in these<br />
186 World Water Development Report 3
changes in the global water cycle<br />
PART<br />
3<br />
studies are most directly attributable to<br />
variability or change in climate.<br />
This synthesis of streamflow trends draws<br />
largely on national and continental<br />
analyses, especially for Europe and North<br />
America, where the most comprehensive<br />
work has been done. Few studies have<br />
been published for Australia or for countries<br />
in Asia (outside of Siberia), Africa<br />
or South America. However, results of a<br />
global synthesis that includes some trend<br />
information for these continents are included<br />
at the end of this section. 40<br />
A study for Canada found that annual<br />
mean streamflow generally decreased<br />
between 1947 and 1996, with significant<br />
decreases in the southern part of the<br />
country, particularly southern Alberta and<br />
British Columbia. 41 The study also found<br />
reduced monthly mean streamflow except<br />
in March and April, when significant increases<br />
were observed. In southern Canada<br />
significant decreases were also observed in<br />
all percentiles of daily flow, along with the<br />
annual mean. Over northern British Columbia<br />
and the Yukon Territory, however,<br />
significant increases were identified in the<br />
lower flow percentiles.<br />
In the United States the most extensive<br />
studies of trends analysed long-term<br />
streamflow records for 395 stations across<br />
the continental United States with continuous<br />
daily records for 1944-93 (updated<br />
to 435 stations for 1940-99). 42 The study<br />
found a preponderance of upward trends<br />
in all but the highest flows, which were<br />
less numerous and for which upward and<br />
downward trends were about equal. Another<br />
study, working with a similar dataset,<br />
found that the streamflow increases<br />
appeared as a step change around 1970<br />
rather than as a gradual trend. 43 A step<br />
change implies that the climate system has<br />
shifted to a new regime that may remain<br />
stable until a new shift occurs, whereas a<br />
gradual trend is likely to continue into the<br />
future.<br />
In Europe much of the published work on<br />
streamflow trends has focused on flooding.<br />
A study evaluating high-flow and<br />
flood records in a network of climatesensitive<br />
catchments in the United<br />
Kingdom applied trend tests to indicators<br />
of flood magnitude and frequency and<br />
of high-flow magnitude (10- and 30-day<br />
maximums) and duration (prevalence<br />
of high flows). 44 Over the 30- to 40-year<br />
period ending in 2003 positive trends were<br />
identified in all indicators. The trends<br />
were found primarily in upland maritimeinfluenced<br />
catchments in northern and<br />
western areas of the United Kingdom. The<br />
results suggest a trend towards more protracted<br />
high flows in northern and western<br />
areas, but trends in flood magnitude<br />
were less prevalent. Only a few trends were<br />
found in the English lowlands, and these<br />
were influenced by a sequence of notable<br />
flood events through the exceptionally wet<br />
winter of 2000/01. The study shows that<br />
the recent increases in northern and western<br />
catchments were probably caused by<br />
a shift towards a more prevalent positive<br />
phase in the North Atlantic Oscillation<br />
since the 1960s. Moreover, fluctuations in<br />
the records suggest that recent trends may<br />
be influenced by multidecadal variability.<br />
An analysis of systematic flood records<br />
for winter and summer in Central Europe<br />
since the middle of the 19th century and<br />
longer-term historical records of major<br />
floods since the 16th century found a decrease<br />
in winter flooding on the Elbe and<br />
Oder Rivers in Germany over an 80- to<br />
150-year period and no trend in summer<br />
flooding. 45 The study attributed the winter<br />
decrease in part to a decline in strong<br />
freezing events that reduce late winter ice<br />
jamming and consequent higher flood<br />
peaks. The study also detected long-term<br />
changes in flood frequency between the<br />
16th and 19th centuries but concluded<br />
that reductions in river length, construction<br />
of reservoirs and deforestation had<br />
minor influences. These results are consistent<br />
with findings for the Elbe and Vltava<br />
Rivers in the Czech Republic of reduced<br />
frequency and intensity of flooding during<br />
the 20th century. 46<br />
Analysis of annual runoff volumes and<br />
annual and seasonal flood peaks in Sweden<br />
found that average runoff increased<br />
5% over the 20th century and even more<br />
during the 19th century, when temperatures<br />
were lower. 47 In Switzerland a study<br />
of annual streamflow found a general<br />
increase over the same time period, due<br />
mostly to increases in winter, spring and<br />
autumn runoff. 48 Winter increases were<br />
observed across the entire flow distribution<br />
but were especially marked for<br />
maximum flows. Increases in spring and<br />
autumn runoff were concentrated primarily<br />
in moderate and low-flow percentiles.<br />
Farther southeast, in Turkey, analysis of<br />
monthly mean streamflow records for<br />
26 basins for 1964-94 found that streamflow<br />
had generally decreased in western<br />
and southern Turkey, while not changing<br />
significantly in eastern Turkey. 49 A study of<br />
a pan-European dataset of more than 600<br />
daily streamflow records covering 1962-90,<br />
Few studies<br />
of streamflow<br />
trends have<br />
been published<br />
for Australia or<br />
for countries in<br />
Asia (outside of<br />
Siberia), Africa or<br />
South America<br />
Water in a changing world 187
PART<br />
3<br />
Chapter 11<br />
Groundwater is an<br />
often neglected<br />
part of the global<br />
water cycle,<br />
partly because<br />
it is invisible<br />
and difficult to<br />
monitor and partly<br />
because the data<br />
for understanding<br />
groundwater<br />
flows are limited<br />
1962-95, 1930-95 and 1911-95 tested for<br />
trends in hydrologic drought and detected<br />
no significant changes for most stations. 50<br />
The study concluded that there was no evidence<br />
that drought conditions had become<br />
more severe or frequent.<br />
Several recent studies have investigated<br />
trends in Siberian river discharge. Annual<br />
discharge from the six largest Russian<br />
Arctic rivers (Kolyma, Lena, Ob, Pechora,<br />
Severnaya and Yenisei) increased 7% over<br />
1936-99, mostly in winter. 51 These observations<br />
indicate a general increase in<br />
freshwater flux to the Arctic Ocean. There<br />
is concern that this increase may influence<br />
the global climate system, through both<br />
ocean circulation and the carbon cycle<br />
(see next section). Another study found<br />
significant positive trends in minimum<br />
flows in many smaller rivers across European<br />
and Siberian Russian Federation,<br />
suggesting an increasing contribution of<br />
groundwater to the hydrologic cycle of<br />
northern Eurasia. 52<br />
Two recent studies assessed global high<br />
and low flow trends by analysing trends<br />
in annual maximum flow and in peaks<br />
over threshold and annual low flows. One<br />
study analysed records from 195 stations<br />
on six continents, most of them (92%)<br />
in North America, Europe and Australia<br />
(table 11.1). The records for 70% of the<br />
stations showed no trend in the annual<br />
maximum flow, 14% an increasing trend<br />
and 16% a decreasing trend (box 11.1).<br />
The trends for each continent were generally<br />
consistent with the aggregate totals.<br />
Using a much smaller sample of stations<br />
(21), another study found a mixed pattern<br />
of trends in peaks over threshold, with<br />
approximately 30% of stations exhibiting<br />
a trend and with more downward than upward<br />
trends. 53 A very different pattern was<br />
apparent in low flows, with about 52% of<br />
stations exhibiting statistically significant<br />
trends in seven‐day low flows, all of them<br />
increasing. This implies a reduction in the<br />
incidence of hydrologic drought, consistent<br />
with the results of a study of global<br />
trends in soil moisture and drought. 54<br />
These two broad-scale results are generally<br />
consistent with those from regionally specific<br />
investigations, and both studies conclude<br />
that the results do not support the<br />
hypothesis that global warming has as yet<br />
caused an increase in hydrologic extremes<br />
– more floods or hydrologic droughts.<br />
Groundwater trends<br />
Contributors: Willi Struckmeier<br />
with Peter Letitre<br />
Groundwater is an often neglected part<br />
of the global water cycle, partly because<br />
it is invisible and difficult to monitor and<br />
partly because the data for understanding<br />
groundwater flows are limited. Thus,<br />
despite its importance for river baseflow<br />
and wetlands, groundwater is frequently<br />
ignored in water balance calculations and<br />
in water resources planning and management.<br />
As long as groundwater levels are<br />
roughly stable – or the annual variations<br />
lie within certain intervals – the groundwater<br />
resource is regarded as constant.<br />
However, for longer-term evaluations of<br />
global change, trends in groundwater<br />
resources are crucial, since groundwater<br />
has a buffer function in short-term climate<br />
variations and is a key element of adaptation<br />
strategies.<br />
Groundwater flow processes are usually<br />
much slower than atmospheric or surface<br />
water processes, often by two or three<br />
orders of magnitude. In large aquifer<br />
systems containing most of their groundwater<br />
in stock, sometimes more than 90%<br />
Table 11.1<br />
Trends in annual maximum streamflow, by continent, for 195 stream gauging stations<br />
worldwide, various years<br />
Region<br />
Number of<br />
stations<br />
Stations with<br />
increasing trend<br />
Stations with<br />
no trend<br />
Stations with<br />
decreasing trend<br />
Number Percent Number Percent Number Percent<br />
Africa 4 1 25 1 25 2 50<br />
Asia 8 0 0 5 63 3 38<br />
South America 3 0 0 3 100 0 0<br />
North America 70 14 20 44 63 12 17<br />
Australia-Pacific 40 1 3 34 85 5 13<br />
Europe 70 11 16 50 71 9 13<br />
Total 195 27 14 137 70 31 16<br />
Note: The analysis was based on the Mann-Kendall test (two-sided, significance level 10%). Values may not sum to 100% because of rounding.<br />
Source: Kundzewicz et al. 2004.<br />
188 World Water Development Report 3
changes in the global water cycle<br />
PART<br />
3<br />
of groundwater resources are made up of<br />
‘dead storage’ formed in times when rainfall<br />
and recharge conditions were more<br />
favourable. While not part of the current<br />
water cycle, it is an extremely valuable<br />
asset, chiefly in arid and semi-arid regions<br />
such as the deserts of North Africa, the<br />
Arabian Peninsula, Central Asia and Australia.<br />
These fossil groundwater resources<br />
are increasingly used for agricultural,<br />
industrial and domestic water supplies,<br />
although they are almost never recharged<br />
and will be depleted one day. In many<br />
areas fossil groundwater is the only reliable<br />
water resource. 55<br />
Observed groundwater levels indicate that<br />
recharge volumes may vary considerably<br />
from year to year in response to climate<br />
variations. It is therefore realistic to expect<br />
changes in groundwater recharge as<br />
a consequence of climate change. However,<br />
a recent US Climate Change Science<br />
Program report notes that ‘the ability to<br />
predict the effects of climate and climate<br />
change on groundwater systems is<br />
nowhere near as advanced as for surface<br />
water systems.’ 56 An examination of the<br />
sensitivity of the Ellensburg, Washington,<br />
groundwater basin to climate and land<br />
cover change found that the sensitivities<br />
of groundwater recharge and crop<br />
water use to climate change were closely<br />
intertwined. 57 In particular, for the native<br />
grassland vegetation groundwater recharge<br />
was projected to increase, whereas<br />
for the mostly irrigated pasture vegetation,<br />
recharge was projected to decrease.<br />
Seasonal patterns of evapotranspiration<br />
are substantially different for natural vegetation<br />
and for irrigated crops.<br />
Another study evaluated the sensitivity<br />
of two unconfined aquifers in northwestern<br />
North America to climate change,<br />
one in a humid area west of the Cascade<br />
Mountains and the other in a much drier<br />
climate east of the Cascades. 58 For the<br />
Observed<br />
groundwater<br />
levels indicate<br />
that recharge<br />
volumes may<br />
vary considerably<br />
from year to year<br />
in response to<br />
climate variations<br />
Box 11.1<br />
Changes in discharge of major global rivers<br />
Although considerable attention has been<br />
given to trends in discharge of unregulated<br />
rivers, most studies find that there<br />
are considerably more rivers with no<br />
statistically significant trends that could be<br />
attributed to long-term climate variations<br />
and change than rivers with significant<br />
trends.<br />
For instance, at the 10% significance level,<br />
70% of the records analysed showed no<br />
statistically significant change. However,<br />
the discharge of many large rivers has<br />
indisputably been affected by water<br />
management, especially dam construction<br />
but also within-basin diversions for<br />
other beneficial uses such as irrigation and<br />
municipal and industrial water supply, as<br />
well as trans basin diversions.<br />
The figure shows the observed flow of<br />
the Columbia River after construction of<br />
large reservoirs in Canada and the United<br />
States (totalling about 30% of the mean<br />
annual discharge), as well as ‘naturalized’<br />
discharge (the discharge that would have<br />
occurred in the absence of the dams) and<br />
projected effects of climate change on<br />
the naturalized flows by 2050 (the orange<br />
band reflects the range of climate model<br />
projections). Although the projected effects<br />
of climate change are substantial,<br />
they are much less than the observed effects<br />
of water management (see chapter 9).<br />
The figure shows other observed effects of<br />
water management globally. Since construction<br />
of the High Aswan Dam almost all the<br />
Nile River’s discharge is now either diverted<br />
Changes in the flow of major global rivers associated with water management<br />
Columbia River at The Dalles, Oregon, United States<br />
River flow (thousands of cubic feet a second)<br />
600<br />
500<br />
400<br />
300<br />
200<br />
100<br />
Historical naturalized flow<br />
Estimated range<br />
of naturalized flow<br />
with 2040s warming<br />
Regulated flow<br />
0<br />
Oct Nov Dec Jan Feb Mar Apr May Jun Jul Aug Sep<br />
Source: Based on GWSP 2005.<br />
for irrigation or lost to reservoir evaporation.<br />
Flows of the Syr Darya River have declined<br />
greatly because of irrigation diversions<br />
upstream (the Syr Darya is one of the major<br />
tributaries of the Aral Sea, whose declining<br />
levels are closely related to reductions in the<br />
river’s flows). In contrast, the flow of the<br />
Nile River at the Aswan Dam, Egypt<br />
Discharge (cubic kilometres a second)<br />
12<br />
10<br />
8<br />
6<br />
4<br />
2<br />
0<br />
1950<br />
1960<br />
1970<br />
1980<br />
1990<br />
Syr Darya River at Tyumen Aryk,<br />
Kazakhstan<br />
Discharge (cubic kilometres a second)<br />
12<br />
10<br />
8<br />
6<br />
4<br />
2<br />
0<br />
1950 1960 1970 1980 1990<br />
Burntwood River near Thomson,<br />
Manitoba, Canada<br />
Discharge (cubic kilometres a second)<br />
12<br />
10<br />
8<br />
6<br />
4<br />
2<br />
0<br />
1950 1960 1970 1980 1990<br />
Burntwood River increased by a factor of<br />
almost four following an upstream diversion<br />
into the river basin in the 1970s for hydropower<br />
production.<br />
Source: Lins and Slack 2005; Kundzewicz et al.<br />
2005; GWSP 2005.<br />
Water in a changing world 189
PART<br />
3<br />
Chapter 11<br />
By current<br />
estimates there<br />
are more than<br />
50,000 large<br />
dams, 100,000<br />
smaller dams and<br />
1 million small<br />
dams worldwide<br />
aquifer in the humid region recharge was<br />
closely related to projected changes in<br />
precipitation and its seasonal pattern, and<br />
for the particular climate scenario examined<br />
groundwater levels were predicted to<br />
decline slightly. For the aquifer in the drier<br />
climate river discharge dominated aquifer<br />
variations. Projected changes in groundwater<br />
level therefore closely followed projected<br />
changes in river discharge, which<br />
were higher in winter and early spring and<br />
lower in summer and fall.<br />
A modelling study of two sites in Australia,<br />
one with a Mediterranean climate and<br />
one with a subtropical climate, found that<br />
in the Mediterranean climate changes<br />
in evaporative demand related to rising<br />
temperatures dominated the hydrologic response,<br />
whereas in the subtropical climate<br />
changes in rainfall characteristics dominated.<br />
59 A spatially distributed hydrologic<br />
simulation model – used to evaluate the<br />
combined effects of projected increases in<br />
precipitation, temperature and potential<br />
evapotranspiration in a future climate –<br />
predicted that groundwater recharge and<br />
subsurface storage and discharge would<br />
increase in sandy soils but remain relatively<br />
unchanged in clay soils. 60 These and<br />
other studies suggest that the sensitivity<br />
of groundwater recharge – and hence the<br />
availability of groundwater resources – to<br />
climate change will depend on a balance<br />
between changes in precipitation and<br />
evaporative demand, and site-specific<br />
vadose zone and aquifer characteristics. 61<br />
Much more work is needed to understand<br />
groundwater resources sensitivities to climate<br />
change globally.<br />
Trends in reservoir, lake and wetland<br />
storage<br />
Contributors: Kuni Takeuchi with Jun Magomi<br />
By current estimates there are more than<br />
50,000 large dams (more than 15 metres<br />
high or 3 million m 3 storage capacity),<br />
100,000 smaller dams (more than 0.1<br />
million m 3 storage) and 1 million small<br />
dams (less than 0.1 million m 3 storage)<br />
worldwide. Total reservoir storage capacity<br />
of these dams is estimated at about<br />
7,000 km 3 , and the total water surface of<br />
reservoirs is about 500,000 square kilometres<br />
(km 2 ). Although there are a huge<br />
number of reservoirs, 95% of total reservoir<br />
capacity is accounted for by about 5,000<br />
large reservoirs (dams more than 60 metres<br />
high), and more than 80% are used for<br />
hydropower generation (see chapter 7). 62<br />
Reservoirs. In the past 100 years, but<br />
mainly during 1950-90, many reservoirs<br />
were constructed in North America, the<br />
southeast coast of South America, Australia,<br />
China and the Russian Federation.<br />
About 350 large reservoirs are currently<br />
under construction in China, India, Iran<br />
and Turkey and countries in the Middle<br />
East and South-East Asia. 63 Since the late<br />
20th century reservoirs have experienced<br />
various changes, such as dam removals<br />
in the United States; conflicts over reservoir<br />
water use between upstream and<br />
downstream countries along the Euphrates,<br />
Mekong and Syr Darya Rivers; and<br />
reservoir sedimentation. More than 25%<br />
of global suspended sediment discharge<br />
is thought to be trapped by reservoirs. 64<br />
Although storage of impounded water is<br />
known to have increased greatly over the<br />
main period of dam construction during<br />
the 20th century, trends in global reservoir<br />
storage over the last 20 years of reduced<br />
dam construction are less clear. One study<br />
suggests only a modest change in reservoir<br />
storage over the last decade, 65 and there<br />
have been suggestions that a prevalence<br />
of drought in key areas of the world may<br />
have reduced global reservoir storage over<br />
the last decade.<br />
Lakes. Several studies have provided<br />
extensive global data on natural lakes. 66<br />
Lakes store the largest volume of fresh surface<br />
water (about 90,000 km 3 ), more than<br />
40 times that in rivers and streams and<br />
about 7 times that in wetlands. Together<br />
with reservoirs, they cover an estimated<br />
2.7 million km 2 , or about 2% of surface<br />
area outside the polar regions. 67 Most<br />
lakes are small, but the 145 largest lakes<br />
are estimated to contain more than 95%<br />
of lake freshwater. Lake Baikal (Russian<br />
Federation), the world’s largest, deepest<br />
and oldest lake, alone contains 27% of all<br />
lake freshwater. Lake water serves commerce,<br />
fishing, recreation and transport,<br />
and supplies water for much of the world’s<br />
population.<br />
While changes in lake coverage over the<br />
past few decades have been observed in<br />
many parts of the world, the primary<br />
factors driving these changes are specific<br />
to each region. The surface area of Lake<br />
Chad shrank from 23,000 km 2 in 1963<br />
to less than 2,000 km 2 by the mid-1980s,<br />
due largely to drought. The Aral Sea has<br />
also shrunk dramatically, and the volume<br />
of water in the basin has plummeted 75%<br />
since 1960 – changes attributable primarily<br />
to diversions of inflows for irrigation.<br />
The level of the Caspian Sea fell 3 metres<br />
between 1929 and 1977 but then rose 3<br />
metres by 1995. 68 In Siberia changes in<br />
total lake area over the last three decades<br />
190 World Water Development Report 3
changes in the global water cycle<br />
PART<br />
3<br />
of the 20th century have been correlated<br />
with the state of the underlying permafrost.<br />
Total lake area has increased in the<br />
continuous permafrost zone (12% in western<br />
Siberia 69 and 14.7% in eastern Siberia),<br />
70 while decreasing in the discontinuous<br />
(-13%), sporadic (-12%) and isolated<br />
(-11%) permafrost areas of western Siberia<br />
(map 11.3). 71 The changes in Siberian lake<br />
extent are seen as symptomatic of permafrost<br />
degradation and have important consequences<br />
for global climate through their<br />
influence on the carbon cycle (see section<br />
titled ‘Links between the terrestrial carbon<br />
and water cycles’).<br />
Wetlands. Water-saturated environments,<br />
wetlands are commonly characterized as<br />
swamps, bogs, marshes, mires and lagoons.<br />
Although they contain only 10%<br />
of the water in lakes and other surface<br />
waters, wetlands cover an area about 3-4<br />
times greater than do the world’s lakes 72<br />
and play important roles in flood protection,<br />
groundwater recharge, food production,<br />
water quality, wildlife habitat and<br />
Map 11.3<br />
Example of decline in lake abundance and total lake area in the discontinuous<br />
permafrost zone of western Siberia, 1973-97<br />
Note: Changes such as those in this map are thought to be symptomatic of permafrost degradation. Net increases in lake abundance and area have occurred<br />
in continuous permafrost, suggesting an initial but ephemeral increase in surface ponding. Decadal scale variations in lake, wetland and reservoir storage are<br />
natural characteristics of the dynamics of these water bodies and cannot necessarily be ascribed to climate, land cover or other anthropogenic causes.<br />
Source: Based on Smith, Sheng, et al. 2005.<br />
Water in a changing world 191
PART<br />
3<br />
Chapter 11<br />
Both current<br />
measurements<br />
and climate model<br />
projections show<br />
that climate<br />
changes in coldland<br />
regions<br />
are among the<br />
largest changes<br />
over the entire<br />
globe and will<br />
continue to be so<br />
biogeochemical cycling. 73 During the last<br />
century numerous wetlands were destroyed.<br />
Currently, extensive work is being<br />
done through the ‘Wise Use’ campaigns<br />
sponsored by Ramsar, WWF and the<br />
United Nations Environment Programme<br />
to maintain critical services in water and<br />
related livelihood and food production<br />
areas of wetlands. Roughly half of the<br />
world’s wetlands occur in high latitudes,<br />
and many of these owe their existence<br />
at least in part to the drainage impedance<br />
of permafrost. There is concern that<br />
permafrost degradation may cause some<br />
of these wetlands to drain and be replaced<br />
by grasslands, with serious implications<br />
for the global carbon cycle and possible<br />
feedbacks to global climate change.<br />
Permafrost trends<br />
Contributors: Tinjun Zhang<br />
with Vladimir Aizen<br />
Frozen ground includes soils affected by<br />
short-term freeze-thaw cycles, seasonally<br />
frozen ground and permafrost. Permafrost<br />
regions occupy approximately 24%<br />
of the exposed land area of the Northern<br />
Hemisphere, while the long-term average<br />
maximum area extent covered by seasonally<br />
frozen ground (including the active<br />
layer over permafrost) is about 51% of the<br />
Map 11.4 Circumpolar permafrost extent, 2000<br />
Permafrost extent<br />
Continuous<br />
Discontinuous<br />
Sporadic<br />
Isolated<br />
Relict permafrost<br />
Subsea permafrost limit<br />
Glaciers<br />
Note: Permafrost occupies the entire area of the continuous permafrost zone (except beneath<br />
large rivers and deep lakes) and underlies 10%-90% of the surface in the discontinuous permafrost<br />
zone. In the isolated permafrost zone permafrost occupies less than 10% of the area.<br />
Source: Based on Brown et al. 1997.<br />
Northern Hemisphere land area. 74 Permafrost<br />
exists mainly in high latitudes and<br />
high elevation regions (map 11.4). Permafrost<br />
in Eurasia occurs over the entire<br />
Arctic and boreal forest areas and includes<br />
the mountainous regions of Central Asia<br />
(Tien Shan and Pamir), the Tibetan Plateau<br />
and high elevated areas of the Himalayas.<br />
Over North America permafrost is distributed<br />
mainly over Alaska and the Canadian<br />
Arctic, with the southern boundary of the<br />
latitudinal permafrost varying from 50 o N<br />
to 57 o N. 75 Due to the effect of the Rocky<br />
Mountains, mountain permafrost can<br />
extend as far south as 37 o N.<br />
Changes in the regime of ground ice in<br />
permafrost directly regulate the hydrologic<br />
cycle of cold regions over the short<br />
and long term. Using information from<br />
the Circum-Arctic Map of Permafrost and<br />
Ground Ice Conditions, 76 a study estimated<br />
that the volume of excess ground ice<br />
in the Northern Hemisphere ranges from<br />
10,800 km 3 to 35,460 km 3 , or about 2.7-8.8<br />
metres sea-level equivalent. 77 Assuming<br />
the average porosity of permafrost soil to<br />
be about 40%, the total volume of ground<br />
ice (both pore and excess ground ice)<br />
varies from 54,000 km 3 to 177,000 km 3 .<br />
Under global warming scenarios permafrost<br />
is expected to degrade rapidly in the<br />
21st century. 78 As a result melt-water of<br />
excess ground ice may participate directly<br />
in the hydrologic cycle, while melt-water<br />
of pore ground ice may become a significant<br />
groundwater resource in cold regions.<br />
Seasonal and interannual variations of soil<br />
water storage within the active layer and<br />
seasonally frozen layer in non-permafrost<br />
regions can be substantial and have a significant<br />
impact on the hydrologic cycle in<br />
cold seasons and cold regions.<br />
Both current measurements and climate<br />
model projections show that climate<br />
changes in cold-land regions are among<br />
the largest changes over the entire globe<br />
and will continue to be so. The most important<br />
changes that affect permafrost are<br />
increases in air temperatures and intensification<br />
of the hydrologic cycle. These<br />
climate changes inevitably change the<br />
energy and mass fluxes at the land surface<br />
and the near-surface and subsurface physical<br />
conditions in cold-land regions. These<br />
changes in the physical environment are<br />
forcing changes in permafrost conditions<br />
and permafrost degradation: increase in<br />
permafrost temperature, thickening of the<br />
active layer, thermokarst and talik development,<br />
decrease in permafrost area and<br />
eventually complete disappearance of permafrost<br />
at local, regional and global scales.<br />
192 World Water Development Report 3
changes in the global water cycle<br />
PART<br />
3<br />
Permafrost degradation is initiating<br />
many natural processes that will intensify<br />
changes in the cold-land regions and<br />
through these changes will affect the entire<br />
Earth system. Some of these processes<br />
could be fast developing and very destructive<br />
for the northern and high-altitude<br />
ecosystems and infrastructure. Examples<br />
include surface settlement, swamping,<br />
changes in the extent of thaw lakes, landslides<br />
and slope failures, thermal erosion<br />
of river banks and deep gully formation,<br />
dramatic increase in river sediment loads<br />
and desertification. The release of carbon<br />
stored in thawing permafrost soils may<br />
have significant consequences for global<br />
climate (see section titled ‘Links between<br />
the terrestrial carbon and water cycles’).<br />
Observations of changes in permafrost<br />
conditions include mainly increased<br />
permafrost temperatures, thickening of<br />
the active layer and thermokarst and talik<br />
development (including changes in the<br />
extent of thaw lakes) over the Northern<br />
Hemisphere permafrost regions. Groundbased<br />
measurements indicate that permafrost<br />
temperature increases are greatest<br />
in continuous permafrost regions and are<br />
lower (or there is no change) in discontinuous<br />
and sporadic permafrost regions.<br />
For example, permafrost temperature in<br />
northern Alaska increased about 4°-7°C<br />
during the 20th century, almost half of<br />
it during the last 20 years. 79 Increases in<br />
permafrost temperatures in the Alaskan<br />
interior have ranged from about 0.5°C to<br />
1.5°C since the 1980s. 80 Data from the<br />
northern Mackenzie Valley in the continuous<br />
permafrost zone of Canada show a<br />
1°C increase in permafrost temperatures<br />
at depths of 20-30 metres since the 1990s,<br />
with smaller changes in the central Mackenzie<br />
Valley and no trend in the southern<br />
Mackenzie Valley where permafrost is very<br />
thin. 81<br />
Field measurements in the northern<br />
European part of the Russian Federation<br />
show that temperature increase was greatest<br />
within the continuous permafrost<br />
zone for the last 20 years at 1.6°-2.8°C,<br />
at a depth of 6 metres, 82 while within<br />
the discontinuous permafrost zone the<br />
increase was 1.2°C during 1970-95. 83 In<br />
the continuous permafrost zone over the<br />
Lena River basin of Siberia permafrost<br />
temperature has increased more than<br />
3°C since the early 1960s, while in the<br />
discontinuous permafrost zone over the<br />
Yenesei River basin the rate of temperature<br />
increase has fallen substantially. In<br />
most other discontinuous permafrost<br />
zones over the past 30 years, such as in<br />
Central Mongolia, 84 the Qinghai-Tibetan<br />
Plateau 85 and the Swiss Alps, 86 the<br />
increase in permafrost temperature was<br />
less than 1°C. Changes in air temperature<br />
alone cannot account for the increase in<br />
permafrost temperature in continuous<br />
permafrost zones, but changes in the insulation<br />
provided by snow may be partly<br />
responsible. 87 The smaller change and the<br />
absence of a trend in discontinuous and<br />
sporadic permafrost zones are likely due<br />
to the absorption of latent heat required<br />
to melt ice.<br />
Changes in seasonally frozen ground have<br />
occurred mainly in the timing, duration,<br />
thickness and area of seasonal soil freeze<br />
and thaw. Based on soil temperature measurements<br />
in the active layer and upper<br />
permafrost up to 3.2 metres from 31 hydrometeorological<br />
stations in the Russian<br />
Federation, the active layer exhibited a<br />
statistically significant deepening of about<br />
0.25 metre from the early 1960s to 1998. 88<br />
The International Permafrost Association<br />
started a network of Circumpolar Active<br />
Layer Monitoring (CALM) stations in the<br />
1990s to monitor the response of the active<br />
layer and upper permafrost to climate<br />
change that currently incorporates more<br />
than 125 sites in the Arctic, the Antarctic<br />
and several mid-latitude mountain ranges.<br />
89 The results from northern high-latitude<br />
sites in North America demonstrate<br />
substantial interannual and interdecadal<br />
fluctuations, but with no significant trend<br />
in active layer thickness in response to air<br />
temperature variations. Evidence from the<br />
CALM European monitoring sites indicates<br />
that active layer thickness was greatest in<br />
the summers of 2002 and 2003. 90 Active<br />
layer thickness has increased by up to 1.0<br />
metre over the Qinghai-Tibetan Plateau<br />
since the early 1980s. 91<br />
The thickness of seasonally frozen ground<br />
in non-permafrost regions has decreased<br />
more than 0.34 metre across the Russian<br />
Federation since the middle of the 1950s 92<br />
and up to 0.2 metre over the northern<br />
Tibetan Plateau from 1967 through<br />
1997. 93 The main driving forces for the<br />
decrease are significant winter warming<br />
and changes in snow cover. The duration<br />
of seasonally frozen ground decreased by<br />
more than 20 days during 1967-97 over<br />
the Qinghai-Tibetan Plateau, due mainly<br />
to the earlier onset of the spring thaw. 94<br />
The estimated maximum area of seasonally<br />
frozen ground has decreased by about<br />
7% in the Northern Hemisphere during<br />
the 20th century. Evidence from satellite<br />
remote sensing data shows that the<br />
onset of the spring thaw and autumn<br />
The estimated<br />
maximum area<br />
of seasonally<br />
frozen ground has<br />
decreased by about<br />
7% in the Northern<br />
Hemisphere during<br />
the 20th century<br />
Water in a changing world 193
PART<br />
3<br />
Chapter 11<br />
Most studies<br />
suggest that over<br />
the Northern<br />
Hemisphere the<br />
snow cover season<br />
has shortened<br />
and spring melt<br />
has occurred<br />
earlier in the last<br />
Map 11.5<br />
50-100 years<br />
freeze advanced 5-7 days in Eurasia over<br />
1988-2002, leading to an earlier start to<br />
the growing season but no changes in its<br />
length. 95 Over North America the onset<br />
of the autumn freeze was delayed 5 days,<br />
which was partly responsible for lengthening<br />
the growing season 8 days over 1988-<br />
2001. 96<br />
Snow trends<br />
Contributors: Stephan Harrison<br />
with Dennis P. Lettenmaier<br />
More than one-sixth of the world’s population<br />
lives in areas where surface water is<br />
derived mainly from snowmelt, either<br />
seasonally ephemeral snowpacks or perennial<br />
glaciers. 97 These areas also account<br />
for more than a quarter of global gross<br />
domestic product. Changes in the seasonal<br />
patterns of runoff or permanent changes<br />
in runoff volume resulting from changes<br />
in snow cover (map 11.5) are therefore of<br />
great concern.<br />
Most studies suggest that over the<br />
Northern Hemisphere the snow cover<br />
season has shortened and spring melt<br />
has occurred earlier in the last 50-100<br />
years. Some studies suggest that these<br />
changes may have accelerated in the last<br />
several decades, but inconsistencies in<br />
data sources complicate the picture. The<br />
mountainous areas of North America have<br />
exhibited downward trends in snow water<br />
equivalent that seem related primarily to<br />
increased temperature. At some high-latitude<br />
locations, however, mid-winter snow<br />
water equivalent has increased, possibly<br />
in response to increased precipitation in<br />
Changes in the duration of spring snowcover,<br />
1978-2006<br />
Days per<br />
decade<br />
Source: US National Snow and Ice Data Center (NSIDC) from the US National Oceanic and<br />
Atmospheric Administration weekly snow cover maps.<br />
3<br />
-3<br />
some generally cold continental interior<br />
climates.<br />
Analyses of long-term changes in snow<br />
cover extent and snow water equivalent<br />
over parts of the Northern Hemisphere<br />
have used station data, available in some<br />
cases since early in the 20th century, and<br />
satellite estimates of snow cover extent,<br />
available for almost 40 years. Using reconstructed<br />
snow cover extent for much<br />
of the Northern Hemisphere, one study<br />
found that winter snow water equivalent<br />
increased about 4% per decade, as<br />
did winter snow depth over the Russia<br />
Federation. 98 In contrast, over Eurasia and<br />
North America spring snow cover extent<br />
and snow water equivalent decreased<br />
substantially beginning about 1980. A<br />
study using the more recent period of<br />
satellite data found substantial declines<br />
in snow cover extent over the Northern<br />
Hemisphere during 1972-2006, especially<br />
in spring. 99 Spring declines appeared to<br />
be amplified poleward and were larger<br />
for North America than Eurasia. Another<br />
study using the same satellite data<br />
inferred trends of about 3-5 days per<br />
decade earlier snow melt and about the<br />
same increase in length of the snow-free<br />
season over the Northern Hemisphere. 100<br />
A study using reconstructed snow cover<br />
records for North America reached similar<br />
conclusions. 101<br />
A number of regional studies have also<br />
been conducted. One analysed manual<br />
observations of snow depth and newly<br />
fallen snow over the Swiss Alps during<br />
1931-99 and found that both the number<br />
of days of continuous snow cover and the<br />
number of days with snowfall increased<br />
gradually until about 1980 and declined<br />
thereafter. 102 Trends were progressively<br />
more pronounced with decreasing elevation.<br />
Increased temperature was the main<br />
cause of reductions in the number of days<br />
with snow on the ground at low elevation<br />
in the Swiss Alps. 103 Analysis of Russian<br />
Federation snow depth data for 1936-83<br />
from 119 stations showed a statistically<br />
significant increasing trend in winter<br />
snow depth. 104 While annual snow cover<br />
duration over southern Canada generally<br />
has not changed, winter snow cover has<br />
increased and spring snow cover has decreased,<br />
although changes in snow cover<br />
were modest. 105 Snowfall over Canada<br />
north of 55°N increased about 20% during<br />
1950-90, associated primarily with<br />
increased winter precipitation. 106 Snowfall<br />
changes in southern Canada are highly<br />
correlated with winter temperature, with<br />
snowfall decreasing in the warmer areas<br />
194 World Water Development Report 3
changes in the global water cycle<br />
PART<br />
3<br />
and increasing in colder areas, and overall<br />
annual precipitation increasing.<br />
Several recent studies have analysed<br />
long-term changes in snow-related variables<br />
over the Western United States. One<br />
analysed 230 snow water equivalent time<br />
series in the Pacific Northwest for 1950-<br />
2000 and found a strong preponderance<br />
of downward trends, especially in the<br />
Cascade Mountains, where winter temperatures<br />
generally are higher than elsewhere<br />
in the region. 107 The declines in snow<br />
water equivalent were generally larger in<br />
absolute values at lower elevations. An<br />
expansion of the analysis to the Western<br />
United States and to 1915-2003 found<br />
generally similar results. 108 Analysis of<br />
changes in the timing of spring snowmelt<br />
runoff across the Western United States<br />
for 1948-2002 found that for snowmeltdominated<br />
(mostly mountainous) river basins<br />
the centroid of the annual hydrograph<br />
was consistently shifting to an earlier<br />
date but that for coastal basins without a<br />
substantial snowmelt component, the date<br />
changed little or runoff was later. 109<br />
Other studies have analysed changes in<br />
snow-related variables elsewhere in the<br />
United States, mostly in the northeast.<br />
One report, based on data for 1952-2005<br />
in the Catskill region of New York State,<br />
found that peak snowmelt generally<br />
shifted 1-2 weeks earlier, apparently due to<br />
an increasing trend in maximum March<br />
air temperature. 110 Similar studies for New<br />
England found 1-2 week advances of the<br />
centre of the volume of runoff. 111 Analysis<br />
of the ratio of snow to precipitation<br />
for Historical Climatology Network sites<br />
in New England found a general decline<br />
in the ratio and decreasing snowfall<br />
amounts. 112 And 18 of 23 snow course sites<br />
in and near Maine with records spanning<br />
at least 50 years had decreases in snowpack<br />
depth or increases in snowpack density. 113<br />
Trends in glaciers<br />
Contributors: Vladimir Aizen with<br />
Stephan Harrison, Xin Li, Igor Severskiy,<br />
Pratap Singh and Tandong Yao<br />
Glaciers cover 11% of the Earth’s land surface<br />
and store about 75% of its freshwater.<br />
Alpine glaciers supply water and generate<br />
river flow vital to the millions of people<br />
living downstream and to forestry, agriculture,<br />
industry and urban areas in adjacent<br />
lowlands. Glacier meltwater is particularly<br />
important when the lower water courses<br />
flow through semi-arid and arid regions<br />
with high evaporation and high demands<br />
for irrigation water during the vegetation<br />
period. Glaciers integrate climate variations<br />
over a wide range of time scales,<br />
preserving past climatic signatures and<br />
making them natural sensors of climate<br />
variability. Climate change is having a<br />
significant impact on the snow and ice glacier<br />
water resources and river water supply<br />
in mountain regions.<br />
There is considerable evidence that glaciers<br />
have retreated globally since the middle<br />
of the 19th century, after the ‘little ice<br />
age’, 114 with the rate of retreat accelerating<br />
from the mid-1970s in response to rapid<br />
increases in air temperature and changes<br />
in the amount of precipitation and its<br />
composition (rain or snow). 115 Tropical<br />
glaciers are more sensitive than glaciers at<br />
higher latitudes to changes in climate. In<br />
the tropical Andes the trend in air temperatures<br />
has been about a 0.1°C gain per<br />
decade since 1939, and the rate has tripled<br />
over the last 25 years. The Andes contain<br />
99% of the world’s tropical glaciers, most<br />
of which are undergoing considerable<br />
recession, with many reduced in volume<br />
by 30% since 1980. 116 The development<br />
of glaciers is also limited by the low levels<br />
of precipitation and continuous rise in air<br />
temperatures. In the tropical Andes runoff<br />
during the dry season (May-September) is<br />
often fed solely by glaciers, so that glacier<br />
retreat has major implications for seasonal<br />
water supplies. 117<br />
Changes in air temperature and precipitation<br />
may have different impacts in different<br />
mountain regions at macro- and mesoscales<br />
and even in small catchments. In<br />
arid regions of western Argentina, central<br />
and northern Chile and much of western<br />
Peru climate change has resulted in warming<br />
and decreasing precipitation during<br />
the 20th century, and the glaciers have<br />
retreated much faster in South America<br />
than in Central Asia.<br />
The coexistence of elevated cold and arid<br />
areas creates unique climate and hydrologic<br />
regimes not only in the tropical Andes<br />
but also at mid-latitudes of Central Asia<br />
and the Tibetan Plateau. The large Aral-<br />
Caspian and Tarim closed-drainage basins<br />
and the great Asian rivers, such as the<br />
Ob, Yenisei, Huang He, Yangtze, Mekong<br />
and Brahmaputra, are fed by glaciers in<br />
the Altai, Pamir, Tibetan and Tien Shan<br />
Plateaus. Central Asia glaciers cover 81,500<br />
km 2 and contain approximately 8,000 km 3<br />
of freshwater. 118<br />
Changes in global and regional air temperature<br />
and the frequency of major atmospheric<br />
circulation processes regulating<br />
Climate change<br />
is having a<br />
significant impact<br />
on the snow and<br />
ice glacier water<br />
resources and river<br />
water supply in<br />
mountain regions<br />
Water in a changing world 195
PART<br />
3<br />
Chapter 11<br />
Interactions<br />
between a<br />
changing<br />
hydrologic cycle<br />
and a changing<br />
terrestrial carbon<br />
cycle can be<br />
correlated with<br />
climate change<br />
moisture flow over Central Asia are major<br />
driving forces of glacier mass balance and<br />
variability in river discharge. Glaciologic<br />
observations conducted on the Tibetan<br />
Plateau revealed that between the 1950s<br />
and 1960s 50% of glaciers retreated, 30%<br />
advanced and 20% were stable. During<br />
the 1970s glaciers were relatively stable,<br />
but since then recessions have accelerated,<br />
and in the 1990s up to 95% of 620 glaciers<br />
studied were retreating. The recession rate<br />
was 4 metres a year at the north Tibetan<br />
Plateau, intensifying up to 65 metres a<br />
year to the southeast. 119 The total glacier<br />
area of the Tibetan Plateau has shrunk<br />
5.5% in the last 45 years. 120<br />
Altai Mountain ridges define the northern<br />
periphery of the Central Asian mountains<br />
and the southern periphery of the Asian<br />
Arctic Basin. Altai glaciers cover 2,040 km 2<br />
in southern Siberia, Mongolia and northwestern<br />
China. The Pamir glacier, which<br />
extends to the most western periphery of<br />
the Central Asian mountains (Tajikistan<br />
and northwestern China), covered 12,100<br />
km 2 in the late 1970s. In the last half<br />
century annual precipitation increased<br />
by 3.2 millimetres (mm) a year in Altai,<br />
notably in spring and summer months,<br />
while no significant change in precipitation<br />
occurred in the adjacent lowlands.<br />
In the northwestern and central Pamir<br />
at elevations above 3,000 metres annual<br />
precipitation increased 8.1 mm a year over<br />
the last 17 years. 121 Despite the increase in<br />
precipitation, glacier recession occurred in<br />
Altai and Pamir due to increases (0.03°C a<br />
year) in spring and summer air temperatures,<br />
122 which have intensified snow and<br />
glacier melt and increased discharge to the<br />
Ob and Yenisei Rivers by 7% and to the<br />
Pamir River by 13.5%. The Altai glacier<br />
area shrank 7.2% on average between 1952<br />
and 2006. 123<br />
The glacier area of the Tien Shan, a mountain<br />
range in Central Asia, has decreased<br />
by 1,620 km 2 (10.1%) during the last 30<br />
years. The rate of glacier recession varied<br />
between 3.5% in central Tien Shan, with<br />
large high-elevated glacier massifs, and<br />
14.1% in the low western Tien Shan, with<br />
small sparse glaciers. The rate of recession<br />
was three times faster during 1977-<br />
2003 than during 1943-77. The surface of<br />
some glaciers dropped 100 metres during<br />
1977-2000 (map 11.6). 124 Annual runoff<br />
of the major Tien Shan rivers averages<br />
67 km 3 a year, including glacial melt of<br />
about 14 km 3 a year, or 20%. During<br />
droughts the proportion of glacial runoff<br />
increases to 30%. The duration of snow<br />
melt (from maximum snow cover to its<br />
disappearance) declined from 168 days<br />
to 138 days in 2007. The area of seasonal<br />
snow cover decreased 15% (by 120,000<br />
km 2 ), and the date of maximum snow<br />
cover has come later. Further decline may<br />
be accelerated by increased rainfall instead<br />
of snowfall in the early spring at high<br />
elevations and, consequently, a lesser heat<br />
expenditure for the snowmelt.<br />
Mathematical simulations of the current<br />
state of the Tien Shan glacier area and forecasts<br />
of the potential impact of global and<br />
regional climate change on the glaciers and<br />
glacier river runoff in the Tien Shan estimate<br />
that an increase in air temperature of<br />
1°C at equilibrium line elevation must be<br />
compensated for by a 100 mm increase in<br />
precipitation to maintain glaciers in their<br />
current state. Glaciers are predicted to decline<br />
to 94% of their current number, 69%<br />
of current covered area and 75% of current<br />
volume. Glacier runoff is predicted to be<br />
75% of its current value. 125<br />
While the Tien Shan glacier area has been<br />
continuously declining, the annual river<br />
discharge has been growing over the last<br />
decade due mainly to increased precipitation.<br />
One of the main predictors of the<br />
current year’s river discharge in Tien Shan<br />
is the volume of river runoff the previous<br />
year, which could be replenished by<br />
groundwater. The possible sharp change in<br />
river runoff indicates the non-linear system<br />
response caused mainly by the nonlinear<br />
response of evapotranspiration to<br />
changes in temperature and precipitation.<br />
Thus, a precipitation surplus accelerates<br />
evapotranspiration when air temperature<br />
rises, while a precipitation deficit slows<br />
this process even with rising air temperature,<br />
which increases the albedo of glacier<br />
surface in summer and reduces potential<br />
snow and ice melt. Current glacier recession,<br />
while initially boosting river flows,<br />
eventually causes runoff to decrease.<br />
Glaciers in the Himalayas and European<br />
Alps are receding and disappearing faster<br />
than glaciers in Central Asia. 126 Recent<br />
studies revealed that large Himalayan glaciers<br />
are retreating at a rate of more than<br />
30 metres a year, resulting in a 21% reduction<br />
in glacier area since the 1980s. 127<br />
Links between the terrestrial<br />
carbon and water cycles<br />
Contributors: Theodore Bohn with Dennis<br />
P. Lettenmaier and Charles Vörösmarty<br />
Interactions between a changing hydrologic<br />
cycle and a changing terrestrial<br />
196 World Water Development Report 3
changes in the global water cycle<br />
PART<br />
3<br />
Map 11.6<br />
Tien Shan, Akshiirak glacier massif<br />
Glacier area recessions, 1943-2003<br />
Glacier surface degradation, 1977-2000<br />
Note: Top maps are aerial photogrammetry and Advanced Spaceborne Thermal Emission and Reflection Radiometer (ASTER) images. Bottom map is<br />
aerial photogrammetry and Shuttle Radar Topography Mission (SRTM) data.<br />
Source: Based on Aizen et al. 2006.<br />
Water in a changing world 197
PART<br />
3<br />
Chapter 11<br />
estimated net<br />
primary biomass<br />
productivity<br />
increased<br />
significantly over<br />
25% of the global<br />
vegetated area<br />
and decreased<br />
significantly over<br />
7% of the area<br />
carbon cycle can be correlated with climate<br />
change. The terrestrial biosphere<br />
plays an important role in the global<br />
climate system, having taken up roughly<br />
25% of anthropogenic carbon emissions<br />
during the last century. 128 It is not clear<br />
how long the biosphere can continue to<br />
absorb atmospheric carbon at this rate.<br />
Observations suggest that the rate of<br />
carbon uptake depends on hydrologic and<br />
climate conditions as well as land use.<br />
However, long-term observations are much<br />
sparser for terrestrial carbon storage and<br />
flux, especially over large scales, than for<br />
the hydrologic cycle, making it difficult<br />
to discern the relationships of trends in<br />
global or regional carbon budgets with<br />
climate and hydrologic factors. Nonetheless,<br />
some of these relationships have<br />
become apparent, while in other cases the<br />
strong relationships between shorter-term<br />
hydrologic variability and carbon fluxes<br />
have important implications for observed<br />
hydrologic trends.<br />
Because water plays different roles in each<br />
stage of the terrestrial carbon cycle, it is<br />
useful to consider each stage separately.<br />
The vast majority of terrestrial carbon<br />
is stored in soil, litter and above-ground<br />
vegetative biomass. Carbon enters these<br />
environmental compartments primarily<br />
through plant photosynthesis (productivity).<br />
Carbon may leave these compartments<br />
through respiration (by plants or through<br />
decomposition in the soil), export of<br />
carbon into lakes and stream networks<br />
and disturbances such as fire (or changes<br />
in land use). Some of these stages lend<br />
themselves to large-scale monitoring more<br />
easily than others.<br />
Productivity exhibits the tightest coupling<br />
between the hydrologic and terrestrial<br />
carbon cycles, in the link between photosynthesis<br />
and transpiration. Accordingly,<br />
productivity is subject to many of the<br />
same climate limitations as evaporation,<br />
including soil moisture, temperature, incident<br />
solar radiation and humidity. Attribution<br />
of changes in productivity to trends<br />
in climate factors is not entirely straightforward,<br />
in part because more than one of<br />
these factors can be colimiting. Nonetheless,<br />
because of its manifestation in the<br />
form of biomass, productivity (equivalent<br />
to photosynthesis minus plant respiration,<br />
or ‘net productivity’) lends itself more easily<br />
to large-scale measurement than other<br />
carbon fluxes and is often estimated on<br />
global scales using satellite-based data. 129<br />
An analysis of global trends in net primary<br />
biomass productivity (map 11.7) by the<br />
geographic distribution of climate factors<br />
limiting productivity and trends in those<br />
factors during 1982-99 found that estimated<br />
net primary productivity increased<br />
Map 11.7<br />
Interplay of climate factors and net primary productivity<br />
Trends in estimated net primary productivity, 1982-99<br />
Annual<br />
percentage change<br />
1.5<br />
0<br />
-1.5<br />
Source: Based on Nemani et al. 2003.<br />
198 World Water Development Report 3
changes in the global water cycle<br />
PART<br />
3<br />
significantly over 25% of the global vegetated<br />
area and decreased significantly over<br />
7% of the area, for a net global increase of<br />
6.17% (3.42 petagrams of carbon). Trends<br />
in these climate factors were estimated to<br />
explain roughly 40% of the trends in net<br />
primary productivity, with the remainder<br />
attributed to changes in vegetation (for<br />
example, land use changes). Trends in net<br />
primary productivity over regions where<br />
productivity is limited or colimited by<br />
solar radiation, such as the Amazon Basin<br />
and the northern and southern fringes of<br />
tropical Africa and South-East Asia, correlated<br />
strongly with trends in cloudiness.<br />
Increases in growing season precipitation<br />
over water-limited areas such as the<br />
Sahel, Southern Africa and Northern and<br />
Western Australia led to increases in net<br />
primary productivity, while decreases in<br />
growing season precipitation in waterlimited<br />
areas such as Northern Mexico<br />
and Central Australia led to decreases in<br />
net primary productivity. Temperaturelimited<br />
areas such as northwest North<br />
America and Siberia experienced increased<br />
or decreased net primary productivity in<br />
accordance with trends in average temperature<br />
over the growing season.<br />
Smaller-scale analyses of China 130 and<br />
North America 131 agree for the most part<br />
with these general conclusions. Both studies<br />
cite lengthening of the growing season<br />
(essentially a function of temperature) as<br />
the primary driver behind increases in net<br />
primary productivity over most of their<br />
respective domains. However, the North<br />
America study found that increased summer<br />
precipitation was primarily responsible<br />
for the increases in net primary productivity<br />
in the central plains, while land<br />
use changes may have been responsible for<br />
increases over the southeast.<br />
Complicating matters is the seasonal<br />
interplay among climate factors. While<br />
increased air temperatures in late spring<br />
have led to the earlier onset of the growing<br />
season in some areas such as the western<br />
United States, the lack of a concomitant<br />
increase in summer precipitation can<br />
result in an earlier exhaustion of soil moisture<br />
and reduced productivity in autumn,<br />
at least partially negating the gains from<br />
increased annual temperature. 132 Thus,<br />
it is possible that as temperatures rise,<br />
productivity in these regions will become<br />
more water-limited and increasingly correlated<br />
with annual precipitation.<br />
Hydrology also exerts a strong influence<br />
on carbon fluxes out of terrestrial ecosystems.<br />
Soil respiration is the largest<br />
efflux, approximately equal annually<br />
to productivity on a global scale. Field<br />
studies have shown that soil respiration<br />
has a complex dependence on hydroclimate<br />
factors, such as soil temperature<br />
and moisture, as well as biogeochemical<br />
factors; in particular, soil moisture determines<br />
the proportions of carbon released<br />
to the atmosphere as carbon dioxide and<br />
methane. 133<br />
While strong global correlations between<br />
trends in soil respiration and trends<br />
in hydro climate factors have not been<br />
found, 134 some hydrologic trends are<br />
expected to have serious implications for<br />
soil respiration. One example is permafrost<br />
degradation, and the associated changes in<br />
lake extent in Siberia (see discussion earlier<br />
in this chapter). Much of the permafrost<br />
in Siberia contains tremendous reservoirs<br />
of carbon-rich soil, termed yedoma (500<br />
gigatons of carbon, or roughly the carbon<br />
content of the atmosphere), which<br />
has been protected from respiration by<br />
frozen conditions since the last ice age. 135<br />
In the continuous permafrost zone many<br />
lakes have expanded over the last few<br />
decades, 136 actively thawing the surrounding<br />
and underlying yedoma. Because the<br />
newly thawed soil around and under the<br />
lakes is saturated with water, respiration<br />
of the carbon produces methane, a much<br />
stronger greenhouse gas than carbon<br />
dioxide. Strong methane emissions were<br />
observed from the active margins of thaw<br />
lakes in eastern Siberia, and the recent<br />
expansion of these thaw lakes (estimated<br />
at 14.7% in area between 1974 and 2000)<br />
may have resulted in a 58% increase in<br />
methane emissions, or 1.4 million metric<br />
tonnes a year. Because the recent expansion<br />
of these thaw lakes is a result of permafrost<br />
degradation, there is concern that<br />
methane emissions from the lakes could<br />
exacerbate climate warming.<br />
Fires constitute another large carbon efflux,<br />
but their sporadic occurrences have<br />
made precise measurements of long-term<br />
carbon budgets for small areas difficult to<br />
attain. Long-term trends can be assessed<br />
for large regions, however, through satellite<br />
imagery, which captures trends in fire<br />
frequency. Similar to productivity, fire<br />
frequency exhibits a dependence on multiple<br />
climate factors, including temperature,<br />
precipitation and soil moisture. One study<br />
found that annual wildfire frequencies in<br />
the Western United States increased significantly<br />
during 1970-2003. 137 Fire frequency<br />
over this period exhibited high correlations<br />
with both the timing of spring snow<br />
melt and average summer temperatures (to<br />
Hydrology also<br />
exerts a strong<br />
influence on<br />
carbon fluxes<br />
out of terrestrial<br />
ecosystems<br />
Water in a changing world 199
PART<br />
3<br />
Chapter 11<br />
There is a<br />
consensus<br />
among climate<br />
scientists that<br />
climate warming<br />
will intensify,<br />
accelerate or<br />
enhance the global<br />
hydrologic cycle<br />
which snow melt timing is sensitive). Conversely,<br />
several studies have found strong<br />
negative correlations between trends in fire<br />
frequency and summer storm frequency. 138<br />
As mentioned, warmer summers and<br />
earlier snow melts tend to result in earlier<br />
exhaustion of soil moisture and onset of<br />
water limited conditions, while more frequent<br />
summer storms would be expected<br />
to delay the onset of water-limitation.<br />
Thus, two major carbon fluxes, productivity<br />
and fires, depend strongly on the annual<br />
duration of water limitation.<br />
The final major efflux of carbon from terrestrial<br />
ecosystems is the export of carbon<br />
from soils to aquatic systems as particulate<br />
organic carbon (POC) and dissolved<br />
organic carbon (DOC). Because much of<br />
this carbon can be subsequently respired<br />
and returned to the atmosphere, either<br />
in streams or the ocean, this flux is an<br />
important loss term in the terrestrial carbon<br />
budget. A substantial amount of POC<br />
consists of organic carbon sorbed onto<br />
soil sediment particles, entering streams<br />
through erosion and mass wasting (see section<br />
on erosion and sediment transport),<br />
so trends in sediment transport would be<br />
expected to have strongly correlated with<br />
trends in POC export (although other<br />
factors such as soil carbon content and<br />
in-stream chemistry would also exert an<br />
influence on POC export). One study estimated<br />
that, globally, 0.4-1.2 petragrams<br />
of carbon are transported to the oceans as<br />
POC each year. However, no global trends<br />
in POC export have yet been assessed. 139<br />
Several studies have observed marked<br />
increases in the annual fluxes of DOC<br />
in many temperate and boreal streams<br />
around the world. While it has been difficult<br />
to attribute all the observed trends<br />
to a single cause, 140 hydrology appears to<br />
play a role in some cases, through changes<br />
in groundwater drainage. For example,<br />
in the Arctic, several studies have found<br />
strong correlations between daily river<br />
discharge and DOC concentrations. 141 In<br />
this context, the increases in the annual<br />
discharge of the six major rivers of the<br />
Russian Federation Arctic 142 and especially<br />
the recently discovered increase in minimum<br />
flows across Northern Eurasian pan-<br />
Arctic 143 discussed in the section on runoff<br />
and streamflow trends may have important<br />
consequences for the carbon cycle.<br />
Because minimum flows generally reflect<br />
the influence of groundwater, the cause<br />
of these trends has been speculated to be<br />
a reduction in the intensity of seasonal<br />
soil freezing, allowing more connectivity<br />
in subsurface drainage networks. If this<br />
process is indeed occurring, it is conceivable<br />
that the increased flushing of the soils<br />
by groundwater, accompanied by longer<br />
growing seasons and greater microbial<br />
activity during seasons in which the soils<br />
historically have been frozen, could lead<br />
to greater mobility and loss of soil carbon.<br />
Establishing a link between these phenomena<br />
will require further research. In addition,<br />
the thawing of permafrost in Siberia<br />
may release large amounts of soil carbon<br />
into streams in the future, 144 but this is<br />
based on a space-for-time substitution<br />
rather than a direct observation of a trend.<br />
In summary, while hydrologic processes<br />
are important in all stages of the carbon<br />
cycle, trends in the carbon cycle are only<br />
sometimes strongly correlated with trends<br />
in the hydrologic cycle – namely, when<br />
water availability is the dominant limiting<br />
factor. For some ecosystems water<br />
availability may become a limiting factor<br />
as other climate factors change. Direct<br />
observations of carbon fluxes and storages<br />
have rarely been made over a long enough<br />
time period or a large enough region<br />
for significant trends to be detected, but<br />
strong evidence can still exist to indicate<br />
potential impacts of hydrologic trends on<br />
the carbon cycle.<br />
Is the hydrologic cycle<br />
accelerating?<br />
Contributor: Tom Huntington<br />
There is a consensus among climate scientists<br />
that climate warming will intensify,<br />
accelerate or enhance the global hydrologic<br />
cycle. 145 Intensification could be<br />
evidenced or caused by increasing rates of<br />
evaporation, evapotranspiration, precipitation<br />
and streamflow (in some areas).<br />
Associated changes in atmospheric water<br />
content, soil moisture, ocean salinity<br />
and glacier mass balance (seasonal) may<br />
also be implicated. The mechanism most<br />
often cited is that warmer air temperatures<br />
result in higher saturation vapour pressure<br />
(about 7% higher per degree Kelvin)<br />
and hence atmospheric water vapour<br />
content. 146 Some argue that recent satellite<br />
observations do not support subdued<br />
sensitivity, and report increases in water<br />
vapour content, precipitation and evaporation<br />
of about 6% per degree Kelvin. 147 The<br />
intensification response to future warming<br />
remains a critical question in assessing<br />
hydrologic response to climate warming.<br />
The IPCC has found global average increases<br />
in surface air temperatures over<br />
200 World Water Development Report 3
changes in the global water cycle<br />
PART<br />
3<br />
land of 0.74°C ± 0.18°C for 1906–2005. 148<br />
There are fewer long-term, continuous<br />
and quality-assured records for precipitation<br />
than for air temperature and spatial<br />
heterogeneity. Trends in precipitation<br />
have been more variable spatially and<br />
temporally than trends in temperature<br />
(see section on precipitation trends), but<br />
increases have been noted in most of<br />
North America, southern South America,<br />
northern Eurasia and western Australia<br />
and decreases in western Africa and the<br />
Sahel and Chile during 1901-2005. Current<br />
estimates of global average longterm<br />
trends in precipitation do not show<br />
significantly increasing precipitation over<br />
the period of observation as earlier assessments<br />
found, 149 possibly because of recent<br />
decreases and different methodologies and<br />
observations. There is also some evidence<br />
that snowfall has increased in northern<br />
high latitudes 150 and over mountain and<br />
subpolar glaciers. 151<br />
Recent studies or assessments have reviewed<br />
various components of the hydrologic<br />
system and have concluded that the<br />
evidence supports an ongoing intensification<br />
of the hydrologic cycle, 152 though<br />
with substantial variability across regions<br />
and time. One frequent concern is that<br />
data are usually incomplete both temporally<br />
and spatially.<br />
Evapotranspiration cannot be directly<br />
measured over large land areas, but indirect<br />
measurements from long-term river<br />
basin water balance studies provide reasonable<br />
estimates based on precipitation<br />
minus runoff (assuming no net change in<br />
storage). Increases in precipitation were<br />
substantially higher than increases in<br />
runoff, suggesting that during the 20th<br />
century evapotranspiration had increased<br />
in the Mississippi River basin, other large<br />
and smaller river basins in the continental<br />
United States and the La Plata River basin<br />
in South America. 153 In most of Canada<br />
streamflow has been stable or decreasing<br />
(see section on runoff and streamflow<br />
trends), but precipitation has been increasing.<br />
154 Together, these observations<br />
suggest that evapotranspiration has been<br />
increasing. 155<br />
As discussed in the section on ‘Changes<br />
in evaporation and evapotranspiration’,<br />
pan evaporation has decreased over much<br />
of the continental United States and the<br />
former Soviet Union, despite indications<br />
of increased actual evapotranspiration.<br />
Although the apparent difference in<br />
direction of trends in pan and actual<br />
evapotranspiration has been termed the<br />
‘evaporation paradox’, 156 the reasons<br />
are likely to be more straightforward.<br />
In arid regions increasing actual evapotranspiration<br />
may result from increasing<br />
precipitation because evaporative demand<br />
greatly exceeds supply. In humid areas<br />
increasing actual evapotranspiration may<br />
result from decreases in net radiation<br />
and surface humidity, and perhaps some<br />
change in surface wind.<br />
Atmospheric water vapour content (specific<br />
humidity) has increased in recent<br />
decades because warmer air can hold more<br />
moisture. 157 This aspect of an intensifying<br />
hydrologic cycle is profoundly important<br />
because water vapour is also a radiatively<br />
active gas. 158 Because accumulation of<br />
other radiatively active gases induces<br />
climate warming, this feedback mechanism<br />
increasing atmospheric water vapour<br />
content will amplify the warming.<br />
As summarized earlier, analysis of streamflow<br />
trends in northern temperate and<br />
high latitudes and in southern temperate<br />
latitudes shows more upward than downward<br />
trends, while parts of West Africa,<br />
Southern Europe and southernmost South<br />
America have seen decreased runoff. 159<br />
River basins in the continental United<br />
States show trends towards increasing<br />
mean and low flows but no clear evidence<br />
of trend direction in high flows. 160 Most<br />
rivers draining to the Arctic Ocean show<br />
increasing flow, although the cause of<br />
these trends, which are mostly in winter<br />
discharge, remain unclear. 161<br />
On balance, there is some observational<br />
evidence that surface air temperature<br />
warming has intensified the global hydrologic<br />
cycle. Data limitations in length<br />
of record, continuity and spatial coverage<br />
contribute uncertainty to this broad conclusion,<br />
and especially for changes in hydrologic<br />
extremes (such as floods). Natural<br />
climatic and multiyear variability associated<br />
with large-scale atmospheric circulation<br />
patterns such as the El Niño-Southern<br />
Oscillation, the Pacific Decadal Oscillation<br />
and the North Atlantic Oscillation influence<br />
many of the observed trends in ways<br />
not yet fully understood.<br />
Assessing future impacts of<br />
climate change<br />
Contributor: Rick Lawford<br />
An accelerated global water cycle associated<br />
with global warming could have<br />
important consequences for the world’s<br />
water resources. Focusing on projected<br />
An accelerated<br />
global water<br />
cycle associated<br />
with global<br />
warming could<br />
have important<br />
consequences<br />
for the world’s<br />
water resources<br />
Water in a changing world 201
PART<br />
3<br />
Chapter 11<br />
many of the more<br />
indirect impacts of<br />
climate change on<br />
surface water are<br />
not fully known<br />
future changes, this section considers the<br />
consequences for water management as<br />
well as adaptation strategies for coping.<br />
The latest IPCC report describes water<br />
cycle effects associated with projected<br />
global warming ranging from a warmer<br />
atmosphere that holds more water vapour<br />
to more severe regional water shortages<br />
in semi-arid and arid regions. 162 These<br />
projections result mostly from general<br />
circulation models of the coupled landatmosphere-ocean<br />
climate system. These<br />
models represent the climatic forcings and<br />
response of the Earth’s systems to these<br />
forcings and to anthropogenic changes in<br />
the composition of the atmosphere, typically<br />
at spatial resolutions of 2°-4° latitude<br />
by longitude. Although the reliability of<br />
these projections is improving, a number<br />
of inherent uncertainties remain because<br />
of poorly defined initial conditions, natural<br />
and human processes and feedbacks,<br />
inadequate process representation in climate<br />
models, scale mismatches, extremes<br />
of climate and long-term climate variability,<br />
among other reasons. Furthermore,<br />
accurate projections of future changes in<br />
land hydrologic processes based on general<br />
circulation model simulations are complicated<br />
by subgrid spatial heterogeneity and<br />
the highly non-linear nature of the processes.<br />
Projected changes based on these<br />
simulations are generally more accurate<br />
at large scales and less so at the regional<br />
scales where mitigation and adaptation<br />
must take place.<br />
Due to the localized response of water<br />
resources to large-scale forcings, global<br />
projections from climate models are of<br />
limited value for water resources applications<br />
unless accompanied by downscaling.<br />
Hydrologic models are a central component<br />
of the tools used to assess the possible<br />
implications of a change in climate<br />
for the hydrology of a location or a basin.<br />
Climate projections must be transformed<br />
into values at points or for small areas for<br />
use in impact assessments. Downscaling<br />
can be conducted by statistical methods<br />
or dynamic regional climate models. 163<br />
Regional models can use global model<br />
outputs as their boundary conditions to<br />
provide much higher resolution outputs<br />
that account more fully for topography<br />
and more accurately represent critical<br />
physical processes. Statistical downscaling<br />
methods are easier to apply and hence<br />
more widely used; they involve ‘training’<br />
a statistical model that relates large-scale<br />
climate model output to local conditions<br />
using historical observations (for<br />
example, of physical climate variables like<br />
precipitation and temperature) and historical<br />
general circulation models, and then<br />
applying the same relationships to general<br />
circulation model simulations of future<br />
large-scale conditions.<br />
Hydrologic impact studies assess the<br />
effects of climate change on individual<br />
processes to infer how the process may<br />
change with a shifting climate. They typically<br />
use deterministic hydrologic models<br />
to estimate changes in water availability<br />
and related impacts. Hydrologic sensitivity<br />
studies involve running models with and<br />
without a particular process to determine<br />
its contributions.<br />
Ensemble simulations provide another<br />
technique for assessing the uncertainty<br />
in impact of changes due to climate and<br />
other factors. On a global basis and for the<br />
Colorado River basin the nature of runoff<br />
changes is projected by a suite of general<br />
circulation models using this ensemble<br />
information to estimate uncertainty in<br />
projections of future hydrologic change. 164<br />
Approaches to incorporating climate<br />
change information in decision-making<br />
can be either direct or indirect. Direct<br />
approaches incorporate climate change<br />
information directly into decision-making<br />
– for example, climate scientists interacting<br />
with partnering utilities to find space<br />
and time scales appropriate for adaptations<br />
to reduce the risk of climate extremes.<br />
Indirect approaches involve potentially<br />
affected people in studies of the readiness<br />
of societies to adapt to climate change.<br />
Although the indirect approach has<br />
dominated to date, as water managers<br />
and decision-makers become more serious<br />
about adaptation to climate change,<br />
the direct approach will likely begin to<br />
predominate.<br />
Summary<br />
Table 11.2 summarizes the key findings of<br />
a literature review of ongoing changes in<br />
the land surface water cycle. The picture is<br />
incomplete – both because a brief summary<br />
such as this cannot be exhaustive and<br />
because the most comprehensive studies<br />
have been conducted where the highestquality<br />
and lengthiest datasets are available,<br />
resulting in non-uniform coverage<br />
globally. Furthermore, while confidence in<br />
projections of the thermal aspects of climate<br />
change is growing, many of the more<br />
indirect impacts of climate change on<br />
surface water are not fully known. Improving<br />
this knowledge by acquiring better<br />
and more comprehensive data is critical<br />
202 World Water Development Report 3
changes in the global water cycle<br />
PART<br />
3<br />
Table 11.2<br />
Summary of key findings relative to trends in land surface water cycle components<br />
Hydrologic variable<br />
Precipitation<br />
Evaporation and<br />
evapotranspiration<br />
Soil moisture<br />
Runoff and streamflow<br />
Groundwater<br />
Reservoir, lake and<br />
wetland storage<br />
Permafrost<br />
Snow<br />
Glaciers<br />
Key findings<br />
The mode of precipitation may be more important than the average precipitation in determining<br />
hydrologic impacts. Widespread increases in heavy precipitation events have been observed in some places<br />
where total precipitation has decreased. At the same time the length, frequency and intensity of heat<br />
waves have widely increased. In addition, more precipitation now falls as rain rather than snow in northern<br />
regions. All these changes are consistent with a warmer atmosphere with a greater water-holding capacity.<br />
Several studies provide evidence that on average for large areas of Asia and North America, actual<br />
evapotranspiration is increasing, even though pan evaporation is decreasing.<br />
In-situ soil moisture measurements are too sparse to draw conclusions about multidecadal soil moisture<br />
trends at the global scale, and current satellite sensors are suboptimal in terms of microwave frequency<br />
and have record lengths that are too short to provide meaningful information about trends. Studies using<br />
physically based model reconstructions with precipitation and temperature to estimate soil wetness are<br />
not comprehensive enough to fully understand the uncertainties and generate unambiguous results.<br />
Two recent studies that assess high and low flow trends on a worldwide basis concluded that their<br />
results do not support the hypothesis that global warming has, to date, caused an increase in hydrologic<br />
extremes, such as more floods and (hydrologic) droughts. Where long streamflow records support<br />
century-scale trend analysis, there is evidence of increases in low flows and mean annual flows, but not<br />
floods. These changes appear to be generally consistent with observed precipitation increases over the<br />
same period.<br />
A recent US Climate Change Science Program report states that ‘. . . the ability to predict the effects of<br />
climate and climate change on groundwater systems is nowhere near as advanced as for surface water<br />
systems.’ Much more work is needed to understand the sensitivity of this critical resource to climate<br />
change globally.<br />
Changes in lake extent have been observed in many parts of the world over the past few decades, but the<br />
primary factors behind these changes are regionally specific. Decadal scale variations in lake, wetland and<br />
reservoir storage are natural characteristics of the dynamics of these water bodies and cannot necessarily<br />
be ascribed to climate, land cover or other anthropogenic causes.<br />
Changes in the physical climate at high latitudes, primarily increasing air temperature, are forcing changes<br />
in permafrost conditions and permafrost degradation. These include increased permafrost temperatures,<br />
thickening of the active layer, and thermokarst and talik development (including changes in the extent<br />
of thaw lakes) over the Northern Hemisphere permafrost regions. Ground-based measurements indicate<br />
that the magnitude of permafrost temperature increase is greatest in continuous permafrost regions and<br />
transitions to no change in discontinuous and sporadic permafrost regions.<br />
Most studies suggest that over the Northern Hemisphere the length of the snow cover season has<br />
decreased and spring melt has occurred earlier, over the last 50-100 years. Some studies suggest that<br />
these changes may have accelerated in the last several decades; however inconsistencies in data sources<br />
complicate such a conclusion.<br />
There is strong evidence that glaciers have retreated globally since the middle of the 19th century, after<br />
the ‘little ice age’, and this retreat has accelerated from the mid-1970s as a response to rapid increases in<br />
air temperature, and changes in precipitation amount and rain and snow partitioning. Although there is<br />
evidence of glacier retreat globally, tropical glaciers are more sensitive than those at higher latitudes, and<br />
have shown the most rapid changes.<br />
to adapting water management to global<br />
change. In addition to these requirements,<br />
an end-to-end analysis (from data through<br />
models to decision-making) is needed to<br />
identify the most significant sources of<br />
uncertainty and misunderstanding.<br />
A deficiency of this review is that the published<br />
literature is heavily biased towards<br />
the ‘old world’ because these countries<br />
are much more likely to have long-term<br />
hydrologic observations that support rigorous<br />
statistical trend analyses. In almost<br />
all cases the hydrologic time series that<br />
are the basis for the studies summarized<br />
in this chapter are in-situ observations.<br />
Ongoing efforts, such as the International<br />
Hydrological Programme’s Flow Regimes<br />
from International Experimental Network<br />
and Data (FRIEND), are helping rebuild<br />
hydrologic networks in developing countries<br />
but have not existed long enough<br />
to provide stable multidecadal record<br />
lengths for trend analysis. This should<br />
also be alleviated as satellite records of<br />
key hydrologic variables become long<br />
enough to support trend analyses, and as<br />
methods of merging multisatellite data<br />
sources are improved. The Global Earth<br />
Observation System of Systems (GEOSS)<br />
effort, fostered by the Group on Earth<br />
Observations, has improvement of Earth,<br />
and specifically hydro logic observations,<br />
as a central goal.<br />
Water in a changing world 203
PART<br />
3<br />
Chapter 11<br />
Notes<br />
1.<br />
2.<br />
3.<br />
4.<br />
5.<br />
6.<br />
7.<br />
8.<br />
9.<br />
Milly et al. 2008.<br />
Giorgi 2002.<br />
IPCC 2007.<br />
IPCC 2007, figure 3.12.<br />
IPCC 2007.<br />
L’hote et al. 2002.<br />
IPCC 2007, chapter 10.<br />
IPCC 2007, chapter 3.<br />
IPCC 2007, chapter 9.<br />
10. Shuttleworth 2008.<br />
11. Farahani et al. 2007. An exception is<br />
accurate-weighing lysimeters, which are<br />
very expensive and are mainly used in<br />
short-term research studies to measure<br />
evapotranspiration.<br />
12. Gedney et al. 2006.<br />
13. See, for example, Brutsaert and Parlange<br />
1998; Ohmura and Wild 2002; and Roderick<br />
and Farquhar 2002, 2004, 2005.<br />
14. Shuttleworth et al. forthcoming.<br />
15. For example, Chattopadhyay and Hume<br />
1997; Thomas 2000; Shenbin, Yvnfeng,<br />
and Thomas 2006; Xu et al. 2006.<br />
16. For example, Askoy 1997; Omran 1998;<br />
Cohen, Ianetz, and Stanhill 2002.<br />
17. Stanhill and Cohen 2001.<br />
18. IPCC 2007.<br />
19. Stanhill and Cohen 2001.<br />
20. IPCC 2007.<br />
21. Roderick et al. 2007.<br />
22. Bouchet 1963.<br />
23. De Bruin 1983, 1989; McNaughton and<br />
Spriggs 1986, 1989.<br />
24. Shuttleworth et al. forthcoming.<br />
25. Chattopadhyay and Hume 1997;<br />
Thomas 2000; Xu et al. 2006; Shenbin,<br />
Yunfeng, and Thomas 2006.<br />
26. Chattopadhyay and Hume 1997; Thomas<br />
2000; Xu et al. 2006.<br />
27. Lawrimore and Peterson 2000; Golubev<br />
et al. 2001; Hobbins and Ramirez 2004.<br />
28. Shuttleworth et al. 2009.<br />
29. www.wcc.nrcs.usda.gov/scan/.<br />
30. Robock et al. 2005; Li, Robock, and Wild<br />
2007.<br />
31. Dai, Trenberthy, and Qian 2004.<br />
32. Maurer et al. 2002.<br />
33. Nijssen, Schnur, and Lettenmaier 2001.<br />
34. Sheffield and Wood 2008.<br />
35. Groisman et al. 2004; Andreadis and<br />
Lettenmaier 2006.<br />
36. Lu et al. 2005 and Li et al. 2005.<br />
37. Li, Robock, and Wild 2007.<br />
38. Tapley et al. 2004; Rodell et al. 2006;<br />
Yeh et al. 2006; Swenson and Wahr<br />
2006; Syed et al. 2005.<br />
39. Lins 2008.<br />
40. Kundzewicz et al. 2005; Svensson,<br />
Kundzewicz, and Maurer 2005.<br />
41. Zhang et al. 2001.<br />
42. Lins and Slack 1999, 2005.<br />
43. McCabe and Wolock 2002.<br />
44. Hannaford and Marsh 2007.<br />
45. Mudelsee et al. 2003.<br />
46. Yiou et al. 2006.<br />
47. Lindstrom and Bergstrom 2004.<br />
48. Birsan et al. 2005.<br />
49. Kahya and Kalayci 2004.<br />
50. Hisdal et al. 2001.<br />
51. Peterson et al. 2002.<br />
52. Smith et al. 2007.<br />
53. Svensson, Kvndzewicz, and Maurer<br />
2005.<br />
54. Sheffield and Wood 2008.<br />
55. Foster and Loucks 2006.<br />
56. Backlund, Janetos, and Schimel 2008,<br />
p. 145.<br />
57. Vaccaro 1992.<br />
58. Scibek and Allen 2006.<br />
59. Green et al. 2007.<br />
60. van Roosmalen, Christensen, and Sonnenborg<br />
2007.<br />
61. Backlund, Janetos, and Schimel 2008.<br />
62. ICOLD 2003; Lempérière 2006.<br />
63. Lempérière 2006.<br />
64. Vörösmarty et al. 1997.<br />
65. Chao, Wu, and Li 2008.<br />
66. Meybeck 1995; Shiklomanov and Rodda<br />
2003; Lehner and Döll 2004.<br />
67. Lehner and Döll 2004.<br />
68. www.caspage.citg.tudelft.nl.<br />
69. Smith, Sheng et al. 2005.<br />
70. Walter et al. 2006.<br />
71. Smith, Sheng et al. 2005.<br />
72. Lehner and Döll 2004.<br />
73. Mitsch and Gosselink 2000.<br />
74. Zhang et al. 1999, 2003.<br />
75. Brown and Goodison 1996, Zhang et<br />
al 1999.<br />
76. Brown and Goodison 1996.<br />
77. Zhang et al. 1999.<br />
78. Lawrence and Slater 2005.<br />
79. Lachenbruch and Marshall 1986; Osterkamp<br />
2005.<br />
80. Osterkamp 2005.<br />
81. Smith, Burgess et al. 2005.<br />
82. Pavlov 1996.<br />
83. Oberman and Mazhitova 2001.<br />
84. Sharkhuu 2003.<br />
85. Wu and Zhang 2008.<br />
86. Vonder Muhll et al. 2004.<br />
87. Zhang 2005.<br />
88. Zhang et al. 2005.<br />
89. Brown, Hinkel, and Nelson 2000.<br />
90. Harris et al. 2003.<br />
91. Zhao et al. 2004.<br />
92. Frauenfeld et al. 2004.<br />
93. Zhao et al. 2004.<br />
94. Zhao et al. 2004.<br />
95. Smith, Saatchi, and Randerson 2004.<br />
96. McDonald et al. 2004.<br />
97. Barnett, Adam, and Lettenmaier 2005.<br />
98. Brown 2000.<br />
99. Déry and Brown 2007.<br />
100. Dye 2002.<br />
101. Frei, Robinson, and Hughes 1999.<br />
102. Laternser and Schneebeli 2003.<br />
103. Scherrer and Appenzeller 2004.<br />
104. Ye 2000.<br />
105. Brown and Goodison 1996.<br />
106. Groisman and Easterling 1994.<br />
107. Mote 2003.<br />
108. Mote et al. 2005.<br />
109. Stewart, Cayan, and Dettinger<br />
2005.<br />
110. Burns, Klaus, and McHale 2007.<br />
111. Hodgkins, Dudley, and Huntington<br />
2003; Hodgkins and Dudley 2006a.<br />
112. Huntington et al. 2004.<br />
113. Hodgkins and Dudley 2006b.<br />
114. Mayewski and Jeschke 1979.<br />
115. Liu et al. 2006; Aizen et al. 2006.<br />
116. Francou et al. 2003.<br />
117. Juen, Kaser, and Georges 2007.<br />
118. Shi 2005.<br />
119. Yao et al. 2004; Yao et al. 2007.<br />
120. Kang et al. 2004.<br />
121. Finaev 2007.<br />
122. Aizen et al. 2005; Finaev 2007.<br />
123. Surazakov, Aizen, and Nikitin 2007.<br />
124. Aizen et al. 2006.<br />
125. Aizen, Aizen, and Kuzmichenot 2007.<br />
126. Ageta et al. 2001; Paul et al. 2004.<br />
127. Srivastava, Gupta, and Mukerji 2003;<br />
Kulkarni et al. 2007.<br />
128. IPCC 2007.<br />
129. Net primary productivity is generally<br />
estimated using satellite-derived<br />
a normalized difference vegetation<br />
index (NDVI).<br />
130. Fang et al. 2003.<br />
131. Hicke et al. 2002.<br />
132. Baldocchi et al. 2001; Nemani et al.<br />
2003.<br />
133. See, for example, Dise et al. 1993.<br />
134. Kirschbaum 2006.<br />
204 World Water Development Report 3
changes in the global water cycle<br />
3 PART<br />
135.<br />
Walter et al. 2006.<br />
136. Smith, Sheng et al. 2005; Walter et al.<br />
2006.<br />
137. Westerling et al. 2006.<br />
138. Holden et al. 2007; Knapp and Soule<br />
2007.<br />
139. Stallard 1998.<br />
140. Worrall and Burt 2007.<br />
141. Holmes et al. 2008; Raymond et al.<br />
2007.<br />
142. Peterson et al. 2002.<br />
143. Smith et al. 2007.<br />
144. Frey and Smith 2005.<br />
145. Del Genio, Lacis, and Ruedy 1991;<br />
Loaiciga et al. 1996; Trenberth 1999;<br />
Held and Soden 2000; Arnell and Liu<br />
2001.<br />
146. Allen and Ingram 2002.<br />
147. Wentz et al. 2007.<br />
148. Trenberth et al. 2007.<br />
149. Dai, Fung, and Del Genio 1997; New<br />
et al. 2001.<br />
150. Trenberth et al. 2007.<br />
151. Dyurgerov 2003; see also the section<br />
on trends for glaciers.<br />
152. Dai 2006; Held and Soden 2006;<br />
Huntington 2006; Dirmeyer and<br />
Brubaker 2006; Holland et al. 2007;<br />
Trenberth et al. 2007.<br />
153. Milly and Dunne 2001; Walter et al.<br />
2004; Szilagyi, Katul, and Parlange<br />
2002; Berbery and Barros 2002.<br />
154. Zhang et al. 2000.<br />
155. Fernandes, Korolevych, and Wang<br />
2007.<br />
156. Bouchet 1963.<br />
157. Dai 2006; Willett et al. 2007; Wentz et<br />
al. 2007; Allen and Ingram 2002; Held<br />
and Soden 2006.<br />
158. Held and Soden 2000.<br />
159. Milly et al. 2005.<br />
160. Lins and Slack 1999, 2005.<br />
161. Peterson et al. 2002; Adam and Lettenmaier<br />
2008.<br />
162. IPCC 2007.<br />
163. See, for example, Wood et al. 2004 for<br />
a comparison.<br />
164. Milly, Dunne, and Vecchia 2005.<br />
References<br />
Adam, J. C., and D. P. Lettenmaier. 2008.<br />
Application of New Precipitation and<br />
Reconstructed Streamflow Products to<br />
Streamflow Trend Attribution in Northern<br />
Eurasia. Journal of Climate 21 (8):<br />
1807-28.<br />
Ageta, Y., N. Naito, M. Nakawo, K. Fujita,<br />
K. Shankar, A. P. Pokhrel, and D.<br />
Wangda. 2001. Study Project on the<br />
Recent Rapid Shrinkage of Summer-<br />
Accumulation Type Glaciers in the Himalayas,<br />
1997-1999. Bulletin of Glaciological<br />
Research 18: 45-9.<br />
Aizen, V. B., E. M. Aizen, K. Fujita, S. Nikitin,<br />
K. Kreutz, and N. Takeuchi. 2005.<br />
Stable-Isotope Time Series and Precipitation<br />
Origin from Firn Cores and Snow<br />
Samples, Altai Glaciers, Siberia. Journal of<br />
Glaciology 51 (175): 637-54.<br />
Aizen, V. B., E. M. Aizen, and V. A.<br />
Kuzmichenok. 2007. Glaciers and<br />
Hydrological Changes in the Tien Shan:<br />
Simulation and Prediction. Environmental<br />
Research Letters 2 (October-December):<br />
1-10. http://dx.doi.org/10.1088/1748-<br />
9326/2/4/045019.<br />
Aizen, V. B., E. M. Aizen, A. B. Surazakov,<br />
and V. A. Kuzmichenok. 2006. Assessment<br />
of Glacial Area and Volume Change<br />
in Tien Shan (Central Asia) During the<br />
Last 150 Years Using Geodetic, Aerial<br />
Photo, ASTER and SRTM Data. Annals of<br />
Glaciology 43: 202-13.<br />
Allen, M. R., and W. J. Ingram. 2002. Constraints<br />
on Future Changes in Climate<br />
and the Hydrologic Cycle. Nature 418<br />
(6903): 224-32.<br />
Andreadis, K., and D. Lettenmaier. 2006.<br />
Trends on 20th Century Drought over<br />
the Continental United States. Geophysical<br />
Research Letters 33: L10403.<br />
doi:10.1029/2006GL025711.<br />
Arnell, N. W., and Liu C. 2001. Hydrology<br />
and Water Resources. In Climate Change<br />
2001: Impacts, Adaptation and Vulnerability,<br />
eds. J. J. McCarthy, O. F. Canziani, N.<br />
A. Leary, D. J. Dokken, and K. S. White.<br />
Cambridge, UK: Cambridge University<br />
Press.<br />
Askoy, B. 1997. Variations and Trends in<br />
Global Solar Radiation for Turkey. Theoretical<br />
and Applied Climatology 58 (3-4):<br />
71-7.<br />
Backlund, P., A. Janetos, and D. Schimel,<br />
eds. 2008. The Effects of Climate Change<br />
on Agriculture, Land Resources, Water<br />
Resources, and Biodiversity in the United<br />
States. Washington, DC: U.S. Climate<br />
Change Science Program.<br />
Baldocchi, D., E. Falge, Gu L., R. Olson,<br />
D. Hollinger, S. Running, P. Anthoni,<br />
C. Bernhofer, K. Davis, R. Evans, J.<br />
Fuentes, A. Goldstein, G. Katul, B. Law,<br />
Lee X., Y. Malhi, T. Meyers, W. Munger,<br />
W. Oechel, K.T. Paw U, K. Pilegaard,<br />
H.P. Schmid, R. Valentini, S. Verma,<br />
T. Vesala, K. Wilson, and S. Wofsy.<br />
2001. FLUXNET: A New Tool to Study<br />
the Temporal and Spatial Variability of<br />
Ecosystem-Scale Carbon Dioxide, Water<br />
Vapour, and Energy Flux Densities. Bulletin<br />
of the American Meteorological Society<br />
82 (11): 2415-34.<br />
Barnett T. P., J. C. Adam, and D. P. Lettenmaier.<br />
2005. Potential Impacts of a<br />
Warming Climate on Water Availability<br />
in Snow-Dominated Regions. Nature 438<br />
(7066): 303-9.<br />
Berbery, E. G., and V. R. Barros. 2002. The<br />
Hydrologic Cycle of the La Plata Basin in<br />
South America. Journal of Hydrometeorology<br />
3 (6): 630-45.<br />
Birsan, M.-V., P. Molnar, P. Burlando, and<br />
M. Pfaundler. 2005. Streamflow Trends<br />
in Switzerland. Journal of Hydrology 314:<br />
312-29.<br />
Bouchet, R. J. 1963. Evapotranspiration<br />
Reele, Evapotranspiration Potentielle, et<br />
Production Agricole. Annals of Agronomy<br />
14: 543-824.<br />
Brown, J., O. J. J. Ferrians, J. A. Heginbottom,<br />
and E. S. Melnikov. 1997.<br />
International Permafrost Association<br />
Circum-Arctic Map of Permafrost and<br />
Ground Ice Conditions. US Geological<br />
Survey Circum-Pacific Map Series Map<br />
CP-45. Boulder, CO: National Snow and<br />
Ice Data Center and World Data Center<br />
for Glaciology.<br />
Brown, R. D. 2000. Northern Hemisphere<br />
Snow Cover Variability and Change,<br />
1915–97. Journal of Climate 13: 2339-55.<br />
Brown, R. D., and B. E. Goodison. 1996.<br />
Interannual Variability in Reconstructed<br />
Canadian Snow Cover, 1915-1992. Journal<br />
of Climate 9 (6): 1299-1318.<br />
Brown, J. K., M. Hinkel, and F. E. Nelson.<br />
2000. The Circumpolar Active Layer<br />
Monitoring (CALM) Program: Research<br />
Design and Initial Results. Polar Geography<br />
24 (3): 166-258.<br />
Brutsaert, W., and M. P. Parlange. 1998.<br />
Hydrological Cycle Explains the Evaporation<br />
Paradox. Nature 396 (5): 284-5.<br />
Burns, D. A., J. Klaus, and M. R. McHale.<br />
2007. Recent Climate Trends and Implications<br />
for Water Resources in the Catskill<br />
Mountain Region, New York, USA. Journal<br />
of Hydrology 336 (1-2): 155-170.<br />
Chao B. F., Wu Y. H., and Li Y. S. 2008.<br />
Impact of Artificial Reservoir Water Impoundment<br />
on Global Sea Level. Science<br />
320 (5873): 212-14.<br />
Chattopadhyay, N., and M. Hume. 1997.<br />
Evaporation and Potential Evaporation<br />
in India under Conditions of Recent and<br />
Future Climate Change. Agricultural and<br />
Forest Meteorology 87: 55-73.<br />
Cohen, S., A. Ianetz, and G. Stanhill.<br />
2002. Evaporative Climate Changes at<br />
Bet Dagan, Israel, 1964-1998. Agricultural<br />
and Forest Meteorology 111: 83-91.<br />
Dai, A. 2006. Recent Climatology, Variability,<br />
and Trends in Global Surface Humidity.<br />
Journal of Climate 19 (15): 3589-606.<br />
Water in a changing world 205
PART<br />
3<br />
Chapter 11<br />
Dai, A., I. Y. Fung, and A. D. Del Genio.<br />
1997. Surface Observed Global Land<br />
Precipitation Variations during 1900-88.<br />
Journal of Climate 10: 2943-62.<br />
Dai, A., K. Trenberth, and T. Qian. 2004. A<br />
Global Dataset of Palmer Drought Severity<br />
Index for 1870-2002: Relationship<br />
with Soil Moisture and Effects of Surface<br />
Warming. Journal of Hydrometeorology 5<br />
(6): 1117-30.<br />
De Bruin, H. A. R. 1983. A Model of the<br />
Priestley-Taylor Parameter, α. Journal of<br />
Applied Meteorology 22: 572-8.<br />
———. 1989. Physical Aspects of the<br />
Planetary Boundary Layer. In Estimation<br />
of Areal Evaporation, eds. T. A. Black, D.<br />
L. Spittlehouse, M. D. Novak, and D. T.<br />
Price. Wallingford, UK: International Association<br />
of Hydrological Sciences .<br />
Del Genio, A. D., A. A. Lacis, and R. A.<br />
Ruedy. 1991. Simulations of the Effect<br />
of a Warmer Climate on Atmospheric<br />
Humidity. Nature 351: 382-5.<br />
Déry, S. J., and R. D. Brown. 2007. Recent<br />
Northern Hemisphere Snow Cover<br />
Extent Trends and Implications for<br />
the Snow-Albedo Feedback. Geophysical<br />
Research Letters 34: L22504.<br />
doi:10.1029/2007GL031474.<br />
Dirmeyer, P. A., and K. L. Brubaker.<br />
2006. Evidence for Trends in the<br />
Northern Hemisphere Water Cycle.<br />
Geophysical Research Letters 33: L14712.<br />
doi:14710.11029/12006GL026359.<br />
Dise, N. B., E. Gorham, and E. S. Verry.<br />
1993. Environmental Factors Controlling<br />
Methane Emissions from Peatands in<br />
Northern Minnesota. Journal of Geophysical<br />
Research-Atmospheres 98 (D6):<br />
10583-94.<br />
Dye, D. G. 2002. Variability and Trends in<br />
the Annual Snow-Cover Cycle in Northern<br />
Hemisphere Land Areas, 1972–2000.<br />
Hydrological Processes 16: 3065-77.<br />
Dyurgerov, M. 2003. Mountain and<br />
Subpolar Glaciers Show an Increase<br />
in Sensitivity to Climate Warming and<br />
Intensification of the Water Cycle. Journal<br />
of Hydrology 282: 164-76.<br />
Fang J. Y., Piao S., C. B Field, Pan Y., Guo<br />
Q., Zhou L., Peng C., and Tao S. 2003.<br />
Increasing Net Primary Production in<br />
China from 1982 to 1999. Frontiers in<br />
Ecology and the Environment 1 (6): 293-<br />
97.<br />
Farahani, H. J., T. A. Howell, W. J. Shuttleworth,<br />
and W. C. Bausch. 2007. Evapotranspiration:<br />
Progress in Measurement<br />
and Modeling in Agriculture. Transactions<br />
of the American Society of Agricultural and<br />
Biological Engineers 50(5): 1627-38.<br />
Fernandes, R., V. Korolevych, and<br />
S. Wang. 2007. Trends in Land<br />
Evapotranspiration over Canada for<br />
the Period 1960-2000 Based on in Situ<br />
Climate Observations and a Land Surface<br />
Model. Journal of Hydrometeorology 8:<br />
1016-30.<br />
Finaev, A. F. 2007. Impact of Climate and<br />
Water Resources Changes on Land Degradation<br />
in Tajikistan. Proceedings of the<br />
NASA LCLUC Workshop, 16-21 September<br />
2007, Urumqi, China.<br />
Foster, S., and D. P. Loucks, eds. 2006.<br />
Non-Renewable Groundwater Resources.<br />
A Guidebook on Socially-Sustainable<br />
Management for Water-Policy Makers. IHP-<br />
VI, Series on Groundwater No.10. Paris:<br />
United Nations Children’s Fund.<br />
Francou, B., M. Vuille, P. Wagnon, J.<br />
Mendoza, and J.-E. Sicart. 2003.<br />
Tropical Climate Change Recorded by a<br />
Glacier in the Central Andes during the<br />
Last Decades of the Twentieth Century:<br />
Chacaltaya, Bolivia, 16S. Journal of<br />
Geophysical Research 108 (D5): 4154.<br />
doi:10.1029/2002JD002959.<br />
Frauenfeld, O., Zhang T., Roger G. Barry,<br />
and David G. Gilichinsky. 2004. Interdecadal<br />
Changes in Seasonal Freeze<br />
and Thaw Depths in Russia. Journal of<br />
Geophysical Research 109: D05101.<br />
doi:10.1029/2003JD004245.<br />
Frei, A., D. A. Robinson, and M. G.<br />
Hughes. 1999. North American Snow<br />
Extent: 1900-1994, International Journal<br />
of Climatology 19: 1517-34.<br />
Frey, K. E., and L. C. Smith. 2005. Amplified<br />
Carbon Release from Vast West<br />
Siberian Peatlands by 2100. Geophysical<br />
Research Letters 32 (9).<br />
Garcia, N. O., and C. R. Mechoso. 2005.<br />
Variability in the Discharge of South<br />
American Rivers and in Climate. Hydrological<br />
Sciences Journal 50: 459-78.<br />
Gedney, N., P. M. Cox, R. A. Betts, O.<br />
Boucher, C. Huntingford, and P. A.<br />
Stott. 2006. Detection of a Direct Carbon<br />
Dioxide Effect in Continental River<br />
Runoff Records. Nature 439 (16): 835-7.<br />
doi:10.1038.<br />
Giorgi, F. 2002. Dependence of Surface<br />
Climate Interannual Variability on Spatial<br />
Scale. Geophysical Research Letters 29:<br />
2101.<br />
Golubev, V. S., J. H. Lawrimore, P. Y.<br />
Groisman, N. A. Speranskaya, S. A.<br />
Zhuravin, M. J. Menne, T. C. Peterson,<br />
and R. W. Malone. 2001. Evaporation<br />
Changes over the Contiguous United<br />
States and the Former USSR: a Reassessment.<br />
Geophysical Research Letters 28<br />
(13): 2665-68.<br />
Green, T. R., B. C. Bates, S. P. Charles, and<br />
P. M. Fleming. 2007. Physically Based<br />
Simulation of Potential Effects of Carbon<br />
Dioxide–Altered Climates on Groundwater<br />
Recharge. Vadose Zone Journal 6:<br />
597-609. doi:10.2136/vzj2006.0099.<br />
Groisman, P. Y., and D. R. Easterling.<br />
1994. Variability and Trends in Total Precipitation<br />
and Snowfall over the United<br />
States and Canada. Journal of Climate 7:<br />
184-205.<br />
Groisman, P., R. Knight, T. Karl, D. Easterling,<br />
B. Sun, and J. Lawrimore. 2004.<br />
Contemporary Changes of the Hydrological<br />
Cycle over the Contiguous United<br />
States: Trends Derived from In-Situ<br />
Observations. Journal of Hydrometeorology<br />
5: 64-85.<br />
GWSP (Global Water System Project).<br />
2005. The Global Water System Project<br />
Science Framework and Implementation<br />
Activities. Earth System Science<br />
Partnership Report No. 3. www.gwsp.<br />
org/fileadmin/downloads/GWSP_Report_<br />
No_1_Internetversion_01.pdf.<br />
Hannaford, J., and T. J. Marsh. 2007. High-<br />
Flow and Flood Trends in a Network of<br />
Undisturbed Catchments in the U.K.<br />
International Journal of Climatology 27.<br />
doi:10.10002.joc.1643.<br />
Harris, C., D. Vonder Muhll, K. Isaksen, W.<br />
Haeberli, J. L. Sollide, L. King, P. Holmlund,<br />
F. Dramis, M. Guglielmin, and<br />
D. Palacios. 2003. Warming Permafrost<br />
in European Mountains. Global Planet<br />
Change 39: 215-25.<br />
Held, I. M., and B. J. Soden. 2000. Water<br />
Vapour Feedback and Global Warming.<br />
Annual Review of Energy and the Environment<br />
25: 441-75.<br />
———. 2006. Robust Responses of the<br />
Hydrological Cycle to Global Warming.<br />
Journal of Climate 19: 5686-99.<br />
Hicke, J. A., G. P. Asner, J. T. Randerson,<br />
C. Tucker, S. Los R. Birdsey, J. C.<br />
Jenkins, and C. Field. 2002. Trends in<br />
North American Net Primary Productivity<br />
Derived from Satellite Observations,<br />
1982-1998. Global Biogeochemical Cycles<br />
16 (2).<br />
Hisdal, H., K. Stahl, L. M. Tallaksen, and<br />
S. Demuth. 2001. Have Streamflow<br />
Droughts in Europe Become More Severe<br />
or Frequent? International Journal of<br />
Climatology 21 (1): 317-33.<br />
Hobbins, M. T., and J. A. Ramirez.<br />
2004. Trends in Pan Evaporation<br />
and Actual Evapotranspiration across<br />
the Conterminous U.S.: Paradoxical<br />
or Complementary? Geophysical<br />
Research Letters 31: L3503. doi:10,<br />
1029/2004GL019846.<br />
Hodgkins, G. A., and R. W. Dudley. 2006a.<br />
Changes in Late-Winter Snowpack<br />
Depth, Water Equivalent, and Density in<br />
Maine, 1926-2004. Hydrological Processes<br />
20: 741-51.<br />
206 World Water Development Report 3
changes in the global water cycle<br />
3 PART<br />
———. 2006b. Changes in the Timing of<br />
Winter-Spring Streamflows in Eastern<br />
North America, 1913–2002. Geophysical<br />
Research Letters 33: L06402.<br />
doi:10.1029/2005GL025593.<br />
Hodgkins, G. A., R. W. Dudley, and T. G.<br />
Huntington. 2003. Changes in the Timing<br />
of High River Flows in New England<br />
over the 20th Century. Journal of Hydrology<br />
278: 244-52.<br />
Holden, Z. A., P. Morgan, M. A. Crimmins,<br />
R. K. Steinhorst, and A. M. S. Smith.<br />
2007. Fire Season Precipitation Variability<br />
Influences Fire Extent and Severity in a<br />
Large Southwestern Wilderness Area,<br />
United States. Geophysical Research Letters<br />
34 (16).<br />
Holland, M. M., J. Finnis, A. P. Barrett, and<br />
M. C. Serreze. 2007. Projected Changes<br />
in Arctic Ocean Freshwater Budgets. Journal<br />
of Geophysical Research 112: G04S55.<br />
doi:10.1029/2006JG000354.<br />
Holmes, R. M., J. W. McClelland, P. A.<br />
Raymond, B. B. Frazer, B. J. Peterson,<br />
and M. Stieglitz. 2008. Lability of DOC<br />
Transported by Alaskan Rivers to the<br />
Arctic Ocean. Geophysical Research Letters<br />
35 (3). doi: 10.1029/2007GL032837.<br />
Hu C., Liu C., Zhou Z., and R. Jayakumar.<br />
2008. Changes in Water and Sediment<br />
Loads of Rivers in China. International<br />
Research and Training Center on Erosion<br />
and Sedimentation, Beijing.<br />
Huntington, T. G. 2006. Evidence for<br />
Intensification of the Global Water Cycle:<br />
Review and Synthesis. Journal of Hydrology<br />
319: 83-95.<br />
Huntington, T. G., G. A. Hodgkins, B. D.<br />
Keim, and R. W. Dudley. 2004. Changes<br />
in the Proportion of Precipitation Occurring<br />
as Snow in New England (1949 to<br />
2000). Journal of Climate 17: 2626-36.<br />
ICOLD (International Commission of<br />
Large Dams). 2003. World Register of<br />
Dams 2003. Paris: International Commission<br />
of Large Dams.<br />
IPCC (Intergovernmental Panel on Climate<br />
Change). 2007. Climate Change<br />
2007: The Physical Science Basis. Summary<br />
for Policymakers. Contribution of Working<br />
Group 1 to the Fourth Assessment<br />
Report of the Intergovernmental Panel<br />
on Climate Change. Cambridge, UK:<br />
Cambridge University Press. http://ipccwg1.ucar.edu/wg1/wg1-report.html.<br />
Juen, I., G. Kaser, and C. Georges. 2007.<br />
Modelling Observed and Future Runoff<br />
from a Glacierized Tropical Catchment<br />
(Cordillera Blanca, Perú). Global and<br />
Planetary Change 59: 37-48.<br />
Kahya, E., and S. Kalayci. 2004. Trend<br />
Analysis of Streamflow in Turkey. Journal<br />
of Hydrology 289: 128-44.<br />
Kang E.-S., Shen Y.-P., Li X., Liu C.-H., Xie<br />
Z.-C., Li P.-J., Wang J., Che T., and Wu<br />
L.-Z. 2004. Assessment of the Glacier<br />
and Snow Water Resources in China, a<br />
Report to the Ministry of Water Resources<br />
of China. CAREERI/CAS, Lanzhou.<br />
Kirschbaum, M. U. F. 2006. The Temperature<br />
Dependence of Organic-Matter<br />
Decomposition – Still a Topic of Debate.<br />
Soil Biology and Biochemistry 38: 2510-18.<br />
Knapp, P. A., and P. T. Soule. 2007. Trends<br />
in Midlatitude Cyclone Frequency and<br />
Occurrence during Fire Season in the<br />
Northern Rockies: 1900-2004. Geophysical<br />
Research Letters 34: L20707.<br />
doi:10.1029/2007GL031216.<br />
Kundzewicz, Z. W., D. Graczyk, T. Maurer,<br />
I. Pinskwar, M. Radziejewski, C. Svensson,<br />
and M. Szwed. 2004. Detection of<br />
Change in World-Wide Hydrological Time<br />
Series of Maximum Annual Flow. GRDC Report<br />
Series Report 32. Koblenz, Germany:<br />
Global Runoff Data Centre.<br />
———. 2005. Trend Detection in River Flow<br />
Series: 1. Annual maximum flow. Hydrological<br />
Science Journal 50 (5): 797-810.<br />
Kulkarni, A. V., I. M Bahuguna, B. P.<br />
Rathore, S. K. Singh, S. S. Randhawa,<br />
R. K. Sood, and S. Dhar. 2007. Glacial<br />
Retreat in Himalaya Using Indian Remote<br />
Sensing Satellite Data. Current Science 92<br />
(1): 1-10.<br />
Lachenbruch, A. H., and B. V. Marshall.<br />
1986. Changing Climate: Geothermal<br />
Evidence from Permafrost in the Alaskan<br />
Arctic. Science 234: 689-96.<br />
Lal, R., M. Griffin, J. Apt, L. Lave, and N.<br />
Granger Morgan. 2004. Managing Soil<br />
Carbon. Science 304 (5669): 393.<br />
Laternser, M., and M. Schneebeli. 2003.<br />
Long-Term Snow Climate Trends of the<br />
Swiss Alps (1931–99). International Journal<br />
of Climatology 23: 733-50.<br />
Lawrence, D. M., and A. G. Slater. 2005.<br />
A Projection of Severe Near-Surface<br />
Permafrost Degradation during the 21st<br />
Century. Geophysical Research Letters 32:<br />
L24401. doi:10.1029/2005GL025080.<br />
Lawrimore, J. H., and T. C. Peterson.<br />
2000. Pan Evaporation Trends in Dry and<br />
Humid Regions of the United States. Journal<br />
of Hydrometeorology 1 (6): 543-46.<br />
Lehner, B., and P. Döll. 2004. Development<br />
and Validation of a Global Database of<br />
Lakes, Reservoirs and Wetlands. Journal of<br />
Hydrology 296: 1-22.<br />
Lempérière, F. 2006. The Role of Dams in<br />
the XXI Century: Achieving a Sustainable<br />
Development Target. International Journal<br />
on Hydropower & Dams 13 (3): 99-108.<br />
L’hote, Y., G. Mahe, B. Some, and J. P. Triboulet.<br />
2002. Analysis of a Sahelian Annual<br />
Rainfall Index Updated from 1896<br />
to 2000. The Drought Still Goes on.<br />
Hydrological Sciences Journal 47: 121-36.<br />
Li H., A. Robock, Liu S., Mo X., and P. Viterbo.<br />
2005. Evaluation of Reanalysis Soil<br />
Moisture Simulations Using Updated Chinese<br />
Soil Moisture Observations. Journal<br />
of Hydrometeorology 6: 180-93.<br />
Li H., A. Robock, and M. Wild. 2007.<br />
Evaluation of IPPC Fourth Assessment<br />
Soil Moisture Simulations for the Second<br />
Half of the Twentieth Century. Journal<br />
of Geophysical Research 112: D06106.<br />
doi:10.1029/2006JD007455.<br />
Lindstrom, G., and S. Bergstrom. 2004.<br />
Runoff Trends in Sweden 1807-2002.<br />
Hydrological Sciences Journal 49: 69-83.<br />
Lins, H. F. 2008. Challenges to Hydrological<br />
Observations. WMO Bulletin 57 (1): 55-8.<br />
Lins, H. F., and J. R. Slack. 1999. Streamflow<br />
Trends in the United States. Geophysical<br />
Research Letters 26: 227-30.<br />
———. 2005. Seasonal and Regional Characteristics<br />
of U.S. Streamflow Trends in<br />
the United States from 1940 to 1999.<br />
Physical Geography 26: 489-501.<br />
Liu Shiyin, Ding Yongjian, Shangguan<br />
Donghui, Zhang Yong, Li Jing, Han<br />
Haidong, Wang Jian, and Xie Changwei.<br />
2006. Glacier Retreat as a Result of<br />
Climate Change Due to Warming and<br />
Increased Precipitation in the Tarim River<br />
Basin, Northwest China. Annals of Glaciology<br />
43 (1): 91-6.<br />
Loaiciga, H. A., J. B. Valdes, R. Vogel, J.<br />
Garvey, and H. Schwarz. 1996. Global<br />
Warming and the Hydrologic Cycle.<br />
Journal of Hydrology 174: 83-127.<br />
Lu C., M. Kanamitsum, J. Roads, W. Ebisuzaki,<br />
K. Mitchell, and D. Lohmann.<br />
2005. Evaluation of Soil Moisture in the<br />
NCEP-NCAR and NCEP-DOE Global<br />
Reanalyses. Journal of Hydrometeorology<br />
6: 391-408.<br />
Maurer, E. P., A. W. Wood, J. C. Adam, D.<br />
P. Lettenmaier, and B. Nijssen. 2002.<br />
A Long-Term Hydrologically-Based Data<br />
Set of Land Surface Fluxes and States for<br />
the Conterminous United States. Journal<br />
of Climate 15 (22): 3237-51.<br />
Mayewski, P. A., and P. A. Jeschke. 1979.<br />
Himalayan and Trans-Himalayan Glacier<br />
Fluctuations since AD 1812. Arctic and<br />
Alpine Research 119 (3): 267-87.<br />
McCabe, G. J., and D. M. Wolock.<br />
2002. A Step Increase in Streamflow<br />
in the Conterminous United<br />
States. Geophysical Research Letters 29.<br />
doi:10.1029/2002GL015999.<br />
McDonald, K. C., J. S. Kimball, E. Njoku, R.<br />
Zimmermann, and M. Zhao. 2004. Variability<br />
in Springtime Thaw in the Terrestrial<br />
High Latitudes: Monitoring a Major<br />
Control on the Biospheric Assimilation<br />
Water in a changing world 207
PART<br />
3<br />
Chapter 11<br />
of Atmospheric CO2 with Spaceborne<br />
Microwave Remote Sensing. Earth Interactions<br />
8 (Paper No. 20): 1-23.<br />
McNaughton, K. G., and T. W. Spriggs.<br />
1986. A Mixed-Layer Model of Regional<br />
Evaporation. Boundary Layer Meteorology<br />
34:243-62.<br />
———. 1989. An Evaluation of the Priestley-<br />
Taylor Equation. In Estimation of Areal<br />
Evaporation, eds. T. A. Black, D. L. Spittlehouse,<br />
M. D. Novak, and D. T. Price.<br />
Wallingford, UK: International Association<br />
of Hydrological Sciences.<br />
Meybeck, M. 1995. Global Distribution of<br />
Lakes. In Physics and Chemistry of Lakes,<br />
eds. A. Lerman, D. M. Imboden, and J. R.<br />
Gat. Berlin: Springer.<br />
Milly, P. C. D., J. Betancourt, M. Falkenmark,<br />
R. M. Hirsch, Z. W. Kundzewicz,<br />
D. P. Lettenmaier, and R. J. Stouffer.<br />
2008. Stationarity Is Dead: Whither<br />
Water Management? Science 319: 573-<br />
74.<br />
Milly, P. C. D., and K. A. Dunne. 2001.<br />
Trends in Evaporation and Surface<br />
Cooling in the Mississippi River Basin.<br />
Geophysical Research Letters 28: 1219-22.<br />
Milly, P. C. D., K. A. Dunne, and A. V. Vecchia.<br />
2005. Global Pattern of Trends in<br />
Streamflow and Water Availability in a<br />
Changing Climate. Nature 438: 347-50.<br />
Mitsch, W. J., and J. G. Gosselink. 2000.<br />
Wetlands. New York: John Wiley and<br />
Sons.<br />
Montgomery, D. R. 2007. Soil Erosion<br />
and Agricultural Sustainability. Proceedings<br />
of the National Academy of Sciences<br />
104 (33): 13268-72.<br />
Mote, P. W. 2003. Trends in Snow<br />
Water Equivalent in the Pacific Northwest<br />
and Their Climatic Causes.<br />
Geophysical Research Letters 30.<br />
doi:10.1029/2003GL017258.<br />
Mote, P. W., A. F. Hamlet, M. P. Clark,<br />
and D. P. Lettenmaier. 2005. Declining<br />
Mountain Snowpack in Western North<br />
America. Bulletin of American Meteorological<br />
Society 86: 39-49.<br />
Mudelsee, M., M. Börngen, G. Tetzlaff,<br />
and U. Grünewald. 2003. No Upward<br />
Trends in the Occurrence of Extreme<br />
Floods in Central Europe. Nature 425:<br />
166-9.<br />
Nemani, R. R., C. D. Keeling, Hashimoto<br />
H., W. M. Jolly, S. C. Piper, C. J. Tucker,<br />
R. B. Myneni, and S.W. Running. 2003.<br />
Climate-Driven Increases in Global Terrestrial<br />
Net Primary Production from<br />
1982 to 1999. Science 300 (5625):<br />
1560-3.<br />
New, M., M. Todd, M. Hulme, and P. D.<br />
Jones. 2001. Precipitation Measurements<br />
and Trends in the Twentieth Century.<br />
International Journal of Climatology 21:<br />
1899-1922.<br />
Nijssen, B. N., R. Schnur, and D. P. Lettenmaier.<br />
2001. Global Retrospective<br />
Estimation of Soil Moisture Using the VIC<br />
Land Surface Model, 1980-1993. Journal<br />
of Climate 14 (8): 1790-1808.<br />
Oberman, N. G., and G. G. Mazhitova.<br />
2001. Permafrost Dynamics in the<br />
Northeast of European Russia at the End<br />
of the 20th Century. Norwegian Journal of<br />
Geography 55: 241-4.<br />
Ohmura, A., and M. Wild. 2002. Is the<br />
Hydrological Cycle Accelerating? Science<br />
298 (5597): 1345-6.<br />
Omran, M. A. 1998. Analysis of Solar Radiation<br />
over Egypt. Theoretical and Applied<br />
Climatology 67: 225-40.<br />
Osterkamp, T. E. 2005. The Recent Warming<br />
of Permafrost in Alaska. Global Planet<br />
Change 49: 187-202. doi: 10.1016/j.<br />
gloplacha.2005.09.001.<br />
Paul, F., A. Kaab, M. Maisch, T. Kellenberger,<br />
and W. Haeberli. 2004.<br />
Rapid Disintegration of Alpine Glaciers<br />
Observed with Satellite Data. Geophysical<br />
Research Letters 31: L21402.<br />
doi:10.1029/2004GL020816.<br />
Pavlov, A. V. 1996. Permafrost-Climate<br />
Monitoring of Russia: Analysis of Field<br />
Data and Forecast. Polar Geography 20<br />
(1): 44-64.<br />
Peterson, B. J., R. M. Holmes, J. W. McClelland,<br />
C. J. Vörösmarty, R. B. Lammers,<br />
A. I. Shiklomanov, and S. Rahmstorf.<br />
2002. Increasing River Discharge to the<br />
Arctic Ocean. Science 298: 2171-3.<br />
Raymond, P. A., J. W. McClelland, R. M.<br />
Holmes, A. V. Zhulidov, K. Mull, B. J.<br />
Peterson, R. G. Striegl, G. R. Aiken,<br />
and T. Y. Gurtovaya. 2007. Flux and Age<br />
of Dissolved Organic Carbon Exported<br />
to the Arctic Ocean: A Carbon Isotopic<br />
Study of the Five Largest Arctic Rivers.<br />
Global Biogeochemical Cycles 21 (4). doi:<br />
10.1029/2007GB002934.<br />
Robock, A., M. Mu, K. Vinnikov, I. Trofimova,<br />
and T. Adamenko. 2005. Forty-<br />
Five Years of Observed Soil Moisture in<br />
the Ukraine: No Summer Desiccation<br />
(Yet). Geophysical Research Letters 32:<br />
L03401. doi:10.1029/2004GL021914.<br />
Rodell, M., Chen J., H. Kato, J. Famiglietti,<br />
J. Nigro, and C. Wilson. 2006. Estimating<br />
Groundwater Storage Changes<br />
in the Mississippi River Basin (USA)<br />
Using GRACE. Hydrogeology Journal.<br />
doi:10.1007/s10040-006-0103-7. ftp://<br />
ftp.csr.utexas.edu/pub/ggfc/papers/<br />
Rodell2006_HJ.pdf.<br />
Roderick, M. L., and G. D. Farquhar. 2002.<br />
The Cause of Decreased Pan Evaporation<br />
over the Past 50 Years. Science 298:<br />
1410-11.<br />
———. 2004. Changes in Australian Pan<br />
Evaporation from 1970 to 2002. International<br />
Journal of Climatology 24: 1077-90.<br />
———. 2005. Changes in New Zealand Pan<br />
Evaporation from the 1970s. International<br />
Journal of Climatology 25: 2013-39.<br />
Roderick, M. L., L. D. Rotstayn, G. D.<br />
Farquhar, and M. T. Hobbins. 2007. On<br />
the Attribution of Changing Pan Evaporation.<br />
Geophysical Research Letters 34:<br />
L17403. doi:10.1029/2007GL031166.<br />
Scherrer, S. C., and C. Appenzeller. 2004.<br />
Trends in Swiss Alpine Snow Days: The<br />
Role of Local- and Large-Scale Climate<br />
Variability. Geophysical Research Letters<br />
31. doi:10.1029/2004GL020255.<br />
Scibek, J., and D. M. Allen. 2006. Comparing<br />
Modeled Responses to Two High-<br />
Permeability, Unconfined Aquifers to<br />
Predicted Climate Change. Global and<br />
Planetary Change 50: 50-62.<br />
Sharkhuu, N. 2003. Recent Changes in<br />
the Permafrost of Mongolia. In Proceedings<br />
of the 8th International Conference<br />
on Permafrost, 21-25 July 2003, Zurich,<br />
Switzerland, eds. M. Phillips, S. M.<br />
Springman, and L. U. Arenson. Lesse,<br />
The Netherlands: A.A. Balkema.<br />
Sheffield, J., and E. Wood. 2008. Global<br />
Trends and Variability in Soil Moisture<br />
and Drought Characteristics, 1950-2000,<br />
from Observation Driven Simulations of<br />
the Terrestrial Hydrologic Cycle. Journal<br />
of Climate 21: 432-58.<br />
Shenbin, C., L. Yunfeng, and A. Thomas.<br />
2006. Climatic Change on the Tibetan<br />
Plateau: Potential Evapotranspiration<br />
Trends from 1961-2000. Climate Change<br />
76: 291-319.<br />
Shi Y. F. 2005. Glacial Inventory of China<br />
(Synthesis volume). Shanghai: Science<br />
Popularization Press.<br />
Shiklomanov, I. A., and J. Rodda. 2003.<br />
World Water Resources at the Beginning of<br />
the 21st Century. Cambridge, UK: Cambridge<br />
University Press.<br />
Shuttleworth, W. J. 2008. Evapotranspiration<br />
Measurement Methods<br />
2008. Southwest Hydrology 7 (1): 22-3.<br />
www.swhydro.arizona.edu/archive/<br />
V7_N1/.<br />
Shuttleworth, W. J, A. S. Capdevila, M.<br />
L. Roderick, and R. Scott. Forthcoming.<br />
On the Theory Relating Changes<br />
in Area-Average and Pan Evaporation.<br />
Quarterly Journal of the Royal Meteorological<br />
Society.<br />
Smith, S. L., M. M. Burgess, D. Riseborough,<br />
and F. M. Nixon. 2005. Recent<br />
Trends from Canadian Permafrost Moni-<br />
208 World Water Development Report 3
changes in the global water cycle<br />
3 PART<br />
toring Network Sites. Permafrost and<br />
Periglacial Processes 16: 19-30.<br />
Smith, L. C., T. M. Pavelsky, G. M. Mac-<br />
Donald, A. I. Shiklomanov, and R. B.<br />
Lammers. 2007. Rising Minimum Flows<br />
in Northern Eurasian Rivers: A Growing<br />
Influence of Groundwater in the<br />
High-Latitude Hydrologic Cycle. Journal<br />
Geophysical Research 112: G04S47.<br />
doi:10.1029/2006JG000327.<br />
Smith, N. V., S. S. Saatchi, and T.<br />
Randerson. 2004. Trends in High<br />
Latitude Soil Freeze and Thaw Cycles<br />
from 1988 to 2002. Journal of<br />
Geophysical Research 109: D12101.<br />
doi:10.1029/2003JD004472.<br />
Smith, L. C., Sheng Y., G. M. MacDonald,<br />
and L. D. Hinzman. 2005. Disappearing<br />
Arctic Lakes. Science 308: 1429.<br />
Srivastava, D., K. R. Gupta, and S. Mukerji,<br />
eds. 2003. Proceedings: Workshop on<br />
Gangotri Glacier: Lucknow 26-28 March<br />
2003: Special Publication No. 80. Geological<br />
Survey of India. New Delhi: Vedams<br />
eBooks.<br />
Stallard, R. F. 1998. Terrestrial Sedimentation<br />
and the Carbon Cycle: Coupling<br />
Weathering and Erosion to Carbon Burial.<br />
Global Biogeochemical Cycles 12: 231-57.<br />
Stanhill, G., and S. Cohen. 2001. Global<br />
Dimming: A Review of the Evidence for<br />
A Widespread and Significant Reduction<br />
in Global Radiation with Discussion of its<br />
Probable Causes and Possible Agricultural<br />
Consequences. Agriculture and Forest<br />
Meteorology 107: 255-78.<br />
Stewart, I. T., D.R. Cayan, and M. D. Dettinger.<br />
2005. Changes toward Earlier<br />
Streamflow Timing across Western North<br />
America. Journal of Climatology 18:<br />
1136-55.<br />
Surazakov, A. B., V. B. Aizen, and S. A.<br />
Nikitin. 2007. Glacier Changes in the<br />
Siberian Altai Mountains, Ob River<br />
Basin (1952-2006) Estimated with<br />
High-Resolution Imagery. Environmental<br />
Research Letters 2 04 5017. doi:10.1088<br />
/1748-9326/214/045017. http://dx.doi.<br />
org/10.1088/1748-9326/2/4/045017.<br />
Svensson, C., Z. W. Kundzewicz, and T.<br />
Maurer. 2005. Trend Detection in River<br />
Flow Series: 2. Flood and low-flow index<br />
series. Hydrological Science Journal 50:<br />
811-24.<br />
Swenson, S., and J. Wahr. 2006. Post-<br />
Processing Removal of Correlated Errors<br />
in GRACE data. Geophysical Research<br />
Letters 33: L08402. doi:10.1029/<br />
2005GL025285.<br />
Syed, T. H., J. S. Famiglietti, Chen J., M.<br />
Rodell, S. I. Seneviratne, P. Viterbo,<br />
and C. R. Wilson. 2005. Total<br />
Basin Discharge for the Amazon and<br />
Mississippi River Basins from GRACE<br />
and a Land-Atmosphere Water Balance.<br />
Geophysical Research Letters 32: L24404.<br />
doi:10.1029/2005GL024851.<br />
Szilagyi, J., G. G. Katul, and M. B.<br />
Parlange. 2002. Evapotranspiration<br />
Intensifies over the Conterminous United<br />
States. Journal of Water Resources Planning<br />
and Management 127: 354-62.<br />
Tapley B. D., S. V. Bettadpur, M. Watkins,<br />
and C. Reigber. 2004. The Gravity Recovery<br />
and Climate Experiment: Mission<br />
Overview and Early Results. Geophysical<br />
Research Letters 31: L09607. doi:<br />
10.1029/2004GL019920.<br />
Thomas, A. 2000. Spatial and Temporal<br />
Characteristics of Potential Evapotranspiration<br />
Trends over China. International<br />
Journal of Climatololgy 20: 381-96.<br />
Trenberth, K. E. 1999. Conceptual Framework<br />
for Changes of Extremes of the<br />
Hydrological Cycle with Climate Change.<br />
Climatic Change 42: 327-39.<br />
Trenberth, K. E., L. Smith, T. Qian, A. Dai,<br />
and J. Fasullo. 2007. Estimates of the<br />
Global Water Budget and Its Annual<br />
Cycle Using Observational and Model<br />
Data. Journal of Hydrometeorology 8 (4):<br />
758.<br />
Vaccaro, J. 1992. Sensitivity of Groundwater<br />
Recharge Estimates to Climate Variability<br />
and Change, Columbia Plateau, Washington.<br />
Journal of Geophysical Research<br />
97: 2821-33.<br />
van Roosmalen, L., B. S. B. Christensen,<br />
and T. O. Sonnenborg. 2007. Regional<br />
Differences in Climate Change Impacts<br />
on Groundwater and Stream Discharge<br />
in Denmark. Vadose Zone Journal 6: 554-<br />
71. doi:10.2136/vzj2006.0093.<br />
Vonder Muhll, D., J. Notzli, K. Makowski,<br />
and R. Delaloye. 2004. Permafrost<br />
in Switzerland in 2000/2001 and<br />
2001/2002. Glaciological Report (Permafrost)<br />
No. 2/3, Glaciological Commission<br />
of the Swiss Academy of Sciences,<br />
Zurich.<br />
Vörösmarty, C. J., M. Meybeck, B. Fekete,<br />
and K. Sharma. 1997. The Potential<br />
Impact of Neo-Cartorization on Sediment<br />
Transport by the Global Network<br />
of Rivers. In Proceedings of the Fifth IAHS<br />
Scientific Assembly at Rabat, Morocco,<br />
April-May 1997, eds. D. E. Walling and<br />
J.-L. Probst. Wallingford, UK: International<br />
Association of Hydrological Sciences.<br />
Walter, M. T., D. S. Wilks, J.-Y. Parlange,<br />
and R. L. Schneider. 2004. Increasing<br />
Evapotranspiration from the Conterminous<br />
United States. Journal of Hydrometeorology<br />
5: 405-08.<br />
Walter, K. M., S. A. Zimov, J. P. Chanton,<br />
D. Verbyla, and F. S. Chapin. 2006.<br />
Methane Bubbling from Siberian Thaw<br />
Lakes as a Positive Feedback to Climate<br />
Warming. Nature 443. doi:10.1038/<br />
nature05040.<br />
Wentz, F. J., L. Ricciardulli, K. Hilburn, and<br />
C. Mears. 2007. How Much More Rain<br />
Will Global Warming Bring? Science 317:<br />
233-5.<br />
Westerling, A. L., H. G. Hidalgo, D. R.<br />
Cayan, and T.W. Swetnam. 2006.<br />
Warming and Earlier Spring Increase<br />
Western U.S. Forest Wildfire Activity. Science<br />
313. doi:10.1126/science.1128834.<br />
Willett, K. M., N. P. Gillett, P. D. Jones,<br />
and P. W. Thorne. 2007. Attribution of<br />
Observed Surface Humidity Changes to<br />
Human Influence. Nature 449: 710-13.<br />
Wood, A. W., L. R. Leung, V. Sridhar, and<br />
D. P. Lettenmaier. 2004. Hydrologic<br />
Implications of Dynamical and Statistical<br />
Approaches to Downscaling Climate<br />
Model Outputs. Climatic Change 62:<br />
189-216.<br />
Worrall, F., and T. P. Burt. 2007. Trends<br />
in DOC Concentration in Great Britain.<br />
Journal of Hydrology 346: 81-92.<br />
Wu Q. B., and Zhang T. 2008. Recent Permafrost<br />
on the Qinghai-Tibetan Plateau.<br />
Journal of Geophysical Research 113:<br />
D13108. doi:10.1029/2007JD009539.<br />
Xu C. -Y., G. Lebing, Jiang T., Chen D., and<br />
V. P. Singh. 2006. Analysis of the Spatial<br />
Distribution and Temporal Trend of Reference<br />
Evaporation and Pan Evaporation<br />
in Changjiang (Yangtze River) Catchment.<br />
Journal of Hydrology 327: 81-93.<br />
Yao T. D., Pu J. C., Tian L. D., Yang W.,<br />
Duan K. Q., Ye Q. H., and L. G. Thompson.<br />
2007. Recent Rapid Retreat of the<br />
Naimona’nyi Glacier in Southwestern<br />
Tibetan Plateau (in Chinese with English<br />
Abstract). Journal of Glaciology and Geocryology<br />
29 (4): 503-8.<br />
Yao T. D., Wang Y. Q., Liu S. Y., Pu J. C.,<br />
Shen Y. P., and Lu A. X. 2004. Glacial<br />
Retreat High Asia and Its Influence on<br />
Water Resource in Northwest China. Science<br />
in China 47 (12): 1065-75.<br />
Ye H. 2000. Decadal Variability of Russian<br />
Winter Snow Accumulation and Its<br />
Associations with Atlantic Sea Surface<br />
Temperature Anomalies. International<br />
Journal of Climatology 20: 1709-28.<br />
Yeh P. J. -F., S. C. Swenson, J. S. Famiglietti,<br />
and M. Rodell. 2006. Groundwater<br />
Storage Changes Inferred from the Gravity<br />
Recovery and Climate Experiment<br />
(GRACE). Water Resources Research 42:<br />
W12203. doi:10.1029/2006WR005374.<br />
Yiou P., P. Ribereau, P. Naveau, M. Nogaj,<br />
and R. Brazdil. 2006. Statistical Analysis<br />
of Floods in Bohemia (Czech Republic)<br />
since 1825. Hydrological Sciences Journal<br />
51: 930-45.<br />
Water in a changing world 209
PART<br />
3<br />
Chapter 11<br />
Zhang T. 2005. Influence of the Seasonal<br />
Snow Cover on the Ground<br />
Thermal Regime: An Overview.<br />
Reviews of Geophysics 43: RG4002.<br />
doi:10.1029/2004RG000157.<br />
Zhang T., R. G. Barry, K. Knowles, F.<br />
Ling, and R. L. Armstrong. 2003.<br />
Distribution of Seasonally and Perennially<br />
Frozen Ground in the Northern<br />
Hemisphere. In Proceedings of the 8th<br />
International Conference on Permafrost,<br />
Zurich, Switzerland, 21-25 July 2003,<br />
eds. M. Phillips, S. M. Springman, and<br />
L. U. Arenson. Lesse, The Netherlands:<br />
A. A. Balkema.<br />
Zhang T., O. W. Frauenfeld, M. C. Serreze,<br />
A. Etringer, C. Oelke, J. Mc-<br />
Creight, R. G. Barry, D. Gilichinsky,<br />
Yang D., Ye H., Ling F., and S. Chudinova.<br />
2005. Spatial and Temporal Variability<br />
of Active Layer Thickness over the<br />
Russian Arctic Drainage Basin. Journal<br />
of Geophysical Research 110: D16101.<br />
doi:10.1029/2004JD005642.<br />
Zhang X., K. D. Harvey, W. D. Hogg, and<br />
T. R. Yuzyk. 2001. Trends in Canadian<br />
Streamflow. Water Resources Research 37:<br />
987-98.<br />
Zhang T., Roger G. Barry, K. Knowles, J.<br />
A. Heginbottom, and J. Brown. 1999.<br />
Statistics and Characteristics of Permafrost<br />
and Ground Ice Distribution in the<br />
Northern Hemisphere. Polar Geography<br />
23 (2): 147-69.<br />
Zhang X., L. A. Vincent, W. D. Hogg, and<br />
A. Niitsoo. 2000. Temperature and<br />
Precipitation Trends in Canada during<br />
the 20th Century. Atmosphere-Ocean 38:<br />
395-429.<br />
Zhao L., Ping C. -L., Yang D., Cheng G.,<br />
Ding Y., and Liu S. 2004. Changes of<br />
Climate and Seasonally Frozen Ground<br />
over the Past 30 Years in Qinghai-Xizang<br />
(Tibetan) Plateau, China, Global Planet.<br />
Change 43: 19-31.<br />
210 World Water Development Report 3
changes in the global water cycle<br />
Chapter 12<br />
Evolving hazards –<br />
and emerging<br />
opportunities<br />
PART<br />
3<br />
Author: Bruce Stewart<br />
Contributors: Yoganath Adikari, Vladimir Aizen, Ali Chavoshia, Hu Chunhong, Pablo García,<br />
M. Gopalakrishnan, Hege Hisdal, A.W. Jayawardena, Zbigniew Kundzewicz, Peter Letitre,<br />
Robert Naiman, Julian Olden, Roberto Pizzaro, Erich Plate, Carmen Revenga, James Robertson,<br />
Léna Salamé, Kyoji Sassa, Pratap Singh, Vladimir Smakhtin, Lena M. Tallaksen,<br />
Jos G. Timmerman, Carel De Villeneuve, Des Walling and Maciej Zalewski<br />
Coordinator: Andras Szöllösi-Nagy (UNESCO)<br />
Facilitator: Denis Hughes<br />
Key messages<br />
In many places climate-related events have become more frequent<br />
and more extreme. In developing countries extreme floods can result<br />
in many deaths, while in developed countries they can result<br />
in billions of dollars in damages. More intense droughts in the past<br />
decade, affecting an increasing number of people, have been linked<br />
to higher temperatures and decreased precipitation but are also frequently<br />
a consequence of the mismanagement of resources and the<br />
neglect of risk management.<br />
Changes in flow and inputs of chemical and biological waste from<br />
human activity have altered the water quality and ecological functioning<br />
of many of the world’s rivers. Global warming is expected to<br />
have substantial effects on energy flows and matter recycling through<br />
its impact on water temperature, resulting in algal blooms, increases<br />
in toxic cyanobacteria bloom and reductions in biodiversity.<br />
In areas of increasing water stress groundwater is an important buffer<br />
resource, capable of responding to increased water demands or of compensating<br />
for the declining availability of surface water.<br />
A review of recent changes in the global<br />
water cycle that analysed more than 100<br />
studies (based on observations) found rising<br />
global and regional trends in runoff,<br />
floods and droughts, and other climaterelated<br />
events and variables in the second<br />
half of the 20th century that together<br />
support the perception of an intensification<br />
of the hydrologic cycle. 1 Meanwhile,<br />
substantial uncertainty remains about<br />
trends of hydroclimate variables due to<br />
differences in responses by variables and<br />
across regions, major spatial and temporal<br />
limitations in data (see chapter 13)<br />
and the effects of modifications in water<br />
resources development (withdrawals,<br />
reservoirs, land use changes and so on) on<br />
flow regimes.<br />
Hazards vary with climate regions<br />
Just as regions are experiencing different<br />
degrees of change related to climate variations<br />
and population and development<br />
pressures, so are they responding differently<br />
to changes in hydrologic extremes.<br />
This chapter identifies the areas that are<br />
most sensitive to changes in extremes and<br />
hazards and those that are likely to experience<br />
the most negative impacts on water<br />
resources.<br />
Deserts<br />
• face conflicting influences<br />
under climate change: potentially<br />
seeing more vegetation with higher<br />
carbon dioxide levels, but overall<br />
facing increases in drought and<br />
Water in a changing world 211
PART<br />
3<br />
Chapter 12<br />
Regions in the<br />
transition zone<br />
between major<br />
climate zones<br />
are susceptible<br />
to drought and<br />
thus to potential<br />
changes in climate<br />
temperatures. With an already fragile<br />
environment, desert ecosystems could<br />
experience severe impacts.<br />
• Grasslands are influenced by precipitation,<br />
both its total amount and its variability.<br />
Changing seasonal variability<br />
is important even when total precipitation<br />
is rising, and declining summer<br />
rainfall could damage grassland fauna.<br />
• Mediterranean ecosystems are diverse and<br />
vulnerable, susceptible to changes in<br />
water conditions. Even with a temperature<br />
rise of 2ºC, the Southern Mediterranean<br />
may lose 60%-80% of species.<br />
• Tundra and Arctic regions face the loss<br />
of permafrost and the potential for<br />
methane release with greater warming<br />
at the poles.<br />
• Mountains are seeing shortened and<br />
earlier snow and ice melt and related<br />
changes in flooding. At higher altitudes<br />
increased winter snow can lead<br />
to delayed snow melt.<br />
• Wetlands will be negatively affected<br />
where there is decreasing water volume,<br />
higher temperatures and higherintensity<br />
rainfall.<br />
Some studies have used climate models and<br />
greenhouse gas emission scenarios from<br />
the recent assessment by the Intergovernmental<br />
Panel on Climate Change (IPCC)<br />
to forecast differences between climate<br />
zones today and in 2100. 2 They have found<br />
that under both high- and low-emission<br />
scenarios many regions would experience<br />
biome-level changes, suggesting that rainforest,<br />
tundra or desert areas may no longer<br />
have the same type of vegetation by 2100<br />
because of climate shifts (box 12.1). 3 By the<br />
end of the 21st century large portions of<br />
the Earth’s surface may experience climates<br />
not found today, and some 20th century<br />
climate characteristics may disappear.<br />
Regions in the transition zone between<br />
major climate zones (particularly between<br />
temperate and dry climates) are susceptible<br />
to drought and thus to potential changes<br />
in climate. A shift in climate may create<br />
a new transition zone, with unknown<br />
feedback mechanisms. A northward shift<br />
is observed in Southern Europe, causing a<br />
decline in summer precipitation in Central<br />
and Eastern Europe. Climate models<br />
consistently predict an increase in summer<br />
temperature variability in these areas<br />
and attribute it mainly to strong landatmosphere<br />
interactions. This could cause<br />
more droughts and heat waves in this<br />
and other mid-latitude regions. Regional<br />
climate models suggest that towards the<br />
end of the 21st century about every second<br />
summer could be as warm as or warmer<br />
(and as dry as or dryer) than the summer<br />
of 2003 in Europe.<br />
Snow cover has decreased in most regions,<br />
especially in spring and summer.<br />
Snow cover in the Northern Hemisphere<br />
observed by satellite from 1966 to 2005<br />
decreased in every month except November<br />
and December, with a step-wise drop<br />
of 5% in annual mean in the late 1980s.<br />
In the Southern Hemisphere the few long<br />
records or proxies show mostly decreases<br />
or no changes in the past 40 years or<br />
more. 4<br />
The Himalayan region is highly vulnerable<br />
to climate change because its major river<br />
drainage systems depend on substantial<br />
contributions from snow and glacier melt.<br />
In India the river systems originating from<br />
the Himalayas (Ganges-Brahmaputra and<br />
Indus) contribute more than 60% to the<br />
total annual runoff for all the rivers of<br />
India. These river systems hold immense<br />
potential as a future water source and<br />
drain the major plains of the country.<br />
Some Himalayan rivers receive more than<br />
half their flow from snow and glacier melt<br />
runoff near the foothills of the Himalayas.<br />
Melting of glaciers and a reduction in solid<br />
precipitation in mountain regions would<br />
directly affect water resources for domestic<br />
supplies, irrigated agriculture, hydropower<br />
generation and other water-dependent<br />
activities.<br />
Changes in average streamflow<br />
While hazards are normally associated<br />
with hydrologic extremes, changes in<br />
average streamflow, especially in already<br />
water-stressed areas, could cause substantial<br />
risks to human activities. The IPCC report<br />
suggests that by 2050 annual average<br />
runoff will have increased by 10%-40% at<br />
high latitudes and decreased by 10%-30%<br />
over some dry regions at mid-latitudes and<br />
semi-arid low latitudes. 5 However, in many<br />
water-scarce regions land use change and<br />
increasing water resources development<br />
and use could mask the effects of climate<br />
change. At high latitudes, where an increase<br />
in annual flow is predicted, the impact<br />
on low flow and drought depends on<br />
the seasonal distribution of precipitation,<br />
the storage capacity of the catchment (ability<br />
to take advantage of higher winter precipitation),<br />
changes in evapotranspiration<br />
and the length of the growing season.<br />
212 World Water Development Report 3
evolving hazards – and emerging opportunities<br />
PART<br />
3<br />
Box 12.1<br />
A global perspective on regional vegetation and hydrologic sensitivities to climate change<br />
The Mapped Atmosphere-Plant-Soil<br />
System (MAPSS), a biogeographic model,<br />
predicts changes in vegetation leaf area<br />
index, site water balance, runoff and<br />
biome boundaries. Global equilibrium<br />
impacts on these ecosystem properties<br />
were simulated under five general<br />
circulation model (GCM) potential climate<br />
scenarios with doubled carbon dioxide<br />
concentration.<br />
Leaf area index is the ratio of the vegetation’s<br />
leaf surface area per unit of ground<br />
area. The greater the leaf surface area, the<br />
more rapidly the vegetation will extract<br />
soil water. Most ecosystems will grow as<br />
much leaf area as can be supported by the<br />
water available during an average growing<br />
season. Thus, under normal conditions<br />
many ecosystems are very near a drought<br />
threshold. Warming lengthens the growing<br />
season, and evaporative demand<br />
increases exponentially with rising temperature.<br />
Consequently, entire landscapes<br />
can extract all soil moisture before the<br />
end of the growing season and become<br />
susceptible to sudden decline under<br />
rapid warming, especially if coincident<br />
with a short-term drying trend. Regional<br />
increases in precipitation and benefits to<br />
plant water use efficiency from elevated<br />
carbon dioxide concentrations can offset<br />
the increased drought stress in some<br />
ecosystems. However, at global scales<br />
most ecosystem models show that the<br />
rapid increases in evaporative demand can<br />
overwhelm these benefits over large areas,<br />
possibly within the next few decades.<br />
Regional patterns of vegetation change<br />
and annual runoff are surprisingly consistent<br />
across the five GCM scenarios,<br />
considering the relative lack of consistency<br />
in predicted changes in regional precipitation<br />
patterns (see bottom map). Eastern<br />
North America and Eastern Europe to<br />
Average simulated change in vegetation leaf area index from five general<br />
circulation model scenarios<br />
With no change in water use efficiency<br />
All-side leaf<br />
area index<br />
Less than -10<br />
-7.5 to -10<br />
-5.0 to -7.5<br />
-2.5 to -5.0<br />
-1.0 to -2.5<br />
-1.0 to 0<br />
0<br />
0 to 1.0<br />
1.0 to 2.5<br />
2.5 to 5.0<br />
5.0 to 10.0<br />
More than 10.0<br />
With increase in water use efficiency<br />
All-side leaf<br />
area index<br />
Less than -10<br />
-7.5 to -10<br />
-5.0 to -7.5<br />
-2.5 to -5.0<br />
-1.0 to -2.5<br />
-1.0 to 0<br />
0<br />
0 to 1.0<br />
1.0 to 2.5<br />
2.5 to 5.0<br />
5.0 to 10.0<br />
More than 10.0<br />
Note: All-side leaf area index is the leaf area (all-sides) per unit<br />
ground area; it is a non-dimensional (unitless) measure.<br />
Source: Neilson and Marks 1994.<br />
western Russia show particular sensitivity<br />
to drought-induced forest decline. Uncertainties<br />
about potential evapotranspiration<br />
and vegetation water use efficiency can<br />
alter the sign of the simulated regional<br />
responses, but the relative responses of<br />
adjacent regions appear to be a function<br />
largely of the background climate rather<br />
than of the vagaries of the GCMs and are<br />
intrinsic to the landscape. Thus, spatial uncertainty<br />
maps can be drawn even under<br />
the current generation GCMs.<br />
Source: Ronald P. Neilson, Department of Forest<br />
Ecosystems and Society, Oregon State University;<br />
Neilson et al. 1998; Scholze et al. 2006.<br />
The IPCC report notes increased annual<br />
runoff and earlier spring peak discharge in<br />
many glacier- and snow-fed rivers, indicating<br />
a regime shift for some rivers. This<br />
trend is projected to continue in response<br />
to increasing temperatures, resulting in<br />
increased summer streamflow in downstream<br />
regions receiving melt water from<br />
major mountain ranges, followed eventually<br />
by reduced streamflow.<br />
Changes in extreme events<br />
Extreme water-related events can have positive<br />
as well as negative impacts. They recharge<br />
natural ecosystems, providing more<br />
abundant water for food production, health<br />
and sanitation (box 12.2). In the lower<br />
Mekong River delta, for example, Cambodians<br />
trap water and nutrients carried down<br />
by the sediment during flood periods and<br />
use them to replenish rice paddies. Floods<br />
can be important to the aquatic and riparian<br />
ecology, as demonstrated during the<br />
artificial flooding of the Colorado River at<br />
the Grand Canyon in the United States. But<br />
extreme water-related events also destroy<br />
lives and property. The most common extreme<br />
events are floods and droughts.<br />
Floods and flooding<br />
With global climate change and projected<br />
increases in global temperature,<br />
scientists generally agree that the hydrologic<br />
cycle will intensify and that<br />
extremes will become more common.<br />
Water in a changing world 213
PART<br />
3<br />
Chapter 12<br />
Box 12.2<br />
Managing urban stormwater in association with land use and land-cover planning can<br />
convert a nuisance into a resource<br />
Urban areas cause substantial changes in<br />
stormwater hydrology, increasing runoff<br />
volumes and peak discharges and altering<br />
water quality. In the traditional view urban<br />
runoff is a nuisance to be removed as quickly<br />
and effectively as possible. However, new<br />
studies and initiatives in several countries<br />
around the world have shown that stormwater<br />
can become a resource, not merely a<br />
nuisance. Optimal management of runoff<br />
is determined by local conditions and can<br />
include recharge of aquifers, retention and<br />
detention to improve water quality and<br />
reduce downstream flood impacts and the<br />
cost of drainage systems, and on-site use of<br />
the water (rainwater-harvesting) to irrigate<br />
and enhance the urban environment.<br />
Stormwater management can be exercised<br />
from the household level to the entire built<br />
area of a city.<br />
Traditionally planners decide on land<br />
uses and land cover and then give<br />
engineers the task of designing drainage<br />
systems to remove the runoff. In a framework<br />
known as water-sensitive planning,<br />
water considerations are incorporated<br />
in land use and land-cover planning<br />
from the outset, following best management<br />
practices on the distribution of<br />
pervious and impervious land cover and<br />
on constructed facilities for capturing,<br />
detaining, storing and infiltrating runoff.<br />
Efficient water use and conservation,<br />
recycling of grey water and possible use<br />
of treated wastewater should also be<br />
incorporated in planning.<br />
With some effort, water-sensitive designs<br />
can also be applied to existing<br />
urban areas. By connecting roof drains to<br />
pervious spaces, constructing low walls<br />
around properties to make them into<br />
mini-detention basins that store and infiltrate<br />
runoff and directing excess water to<br />
playgrounds, planners can make better use<br />
of stormwater runoff and reduce flooding<br />
damages in open public spaces and parks.<br />
In the Coastal Plain of Israel, for example,<br />
where annual rainfall is just 500 millimetres,<br />
it has been estimated that the aquifer<br />
recharge could be increased by about<br />
25,000-77,000 cubic metres per square<br />
kilometre of urban area by connecting<br />
roof drains to a 15% pervious area on the<br />
property and surrounding the property<br />
with a low (approximately 20 centimetres)<br />
wall.<br />
Source: Carmon and Shamir 1997.<br />
The moisture-holding capacity of the<br />
atmosphere has been increasing at a rate of<br />
about 7% per 1°C of warming, creating the<br />
potential for heavier precipitation. There<br />
have likely been increases in the number<br />
of heavy precipitation events in many<br />
land regions – consistent with a warming<br />
climate and the observed increase in atmospheric<br />
water vapour, even where total<br />
precipitation has declined.<br />
In developing countries extreme floods can<br />
result in many deaths, while in developed<br />
countries extreme floods cause material<br />
damage in the billions and tens of billions<br />
of dollars (see table 12.1 for examples). Destructive<br />
floods in the last decade across the<br />
globe have led to record high material damage.<br />
Other extreme high-impact water-related<br />
events not listed in table 12.1 are floods<br />
in Europe in 1997 and 2002 and floods in<br />
China in 1996 ($26 billion in material damage)<br />
and 1998 ($30 billion in material damage).<br />
Yearly economic losses from extreme<br />
events rose tenfold between the 1950s and<br />
1990s in inflation-adjusted dollars. 6<br />
The question is whether the frequency and<br />
magnitude of flooding are also increasing<br />
and, if so, whether that is in response to<br />
climate variability and change. Disaster<br />
losses, mostly weather and water related,<br />
have grown much more rapidly than<br />
population or economic growth, suggesting<br />
a climate change factor. Globally, the<br />
number of great inland flood catastrophes<br />
was twice as large per decade between<br />
1996 and 2005 as between 1950 and<br />
1980, and economic losses were five times<br />
as great. The dominant drivers of these<br />
upward trends are socioeconomic factors,<br />
such as population growth, land use<br />
change and greater use of vulnerable areas.<br />
Documented trends in floods show no<br />
evidence for a globally widespread change.<br />
One study identified an apparent increase<br />
in the frequency of ‘large’ floods (exceeding<br />
100-year return period levels) in 16 large<br />
basins across much of the globe during the<br />
20th century. 7 Analyses of long time series<br />
of monthly river flow data showed that<br />
seven of eight 100-year floods occurred in<br />
the more recent half of the records.<br />
However, subsequent studies have provided<br />
less widespread evidence. A global change<br />
detection study does not support the<br />
hypothesis of a global increase of annual<br />
maximum river flows. 8 The study found<br />
increases in 27 cases, decreases in 31 cases<br />
and no trend in the remaining 137 cases of<br />
the 195 catchments examined worldwide.<br />
Of the 70 time series for Europe only 20<br />
show statistically significant changes (11<br />
increases and 9 decreases). However, the<br />
overall maxima for the period (1961-2000)<br />
occurred more frequently (46 times) in the<br />
later subperiod, 1981-2000, than in the<br />
earlier subperiod (24 times), 1961-80. Evidence<br />
is stronger for changes in the timing<br />
of floods, with increasing late autumn and<br />
winter floods. Fewer ice-jam related floods<br />
have been observed in Europe.<br />
Low flows and droughts<br />
Climate change is expected to influence<br />
precipitation, temperature and potential<br />
evapotranspiration and, through<br />
their combined effects, to influence the<br />
214 World Water Development Report 3
evolving hazards – and emerging opportunities<br />
PART<br />
3<br />
Table 12.1 Examples of major floods and flooding worldwide, 1860-2008<br />
Date<br />
January 2008<br />
May 2006<br />
April-May<br />
2003<br />
February<br />
2000<br />
Location<br />
Zambezi River,<br />
Mozambique<br />
Lower Yukon,<br />
United States<br />
Santa Fe,<br />
Argentina<br />
Limpopo River,<br />
Mozambique<br />
Meteorological<br />
conditions<br />
Heavy torrential precipitation in<br />
Mozambique and neighbouring<br />
countries<br />
Peak<br />
discharge<br />
(cubic metres<br />
per second)<br />
Impact<br />
material<br />
damage<br />
(US$ millions)<br />
Human<br />
losses<br />
3,800 2 20 dead,<br />
113,000 displaced<br />
Snowmelt, ice-jam break-up na na na<br />
Saturated soil due to heavy<br />
precipitation in summer 2002 and<br />
April 2003<br />
Extreme precipitation in tropical<br />
depression, enforced with<br />
torrential rain of three cyclones<br />
July 1997 Czech Republic Saturated ground after extreme<br />
long-lasting precipitation and<br />
extreme precipitation<br />
June 1997<br />
March-April<br />
1997<br />
November<br />
1996<br />
February<br />
1996<br />
July 1995<br />
November<br />
1994<br />
February<br />
1994<br />
September<br />
1993<br />
November<br />
1988<br />
Brahmaputra River,<br />
Bangladesh<br />
Red River,<br />
United States<br />
Subglacial Lake<br />
Grímsvötn, Iceland<br />
West Oregon,<br />
United States<br />
Athens,<br />
Greece<br />
Po River,<br />
Italy<br />
Meuse River,<br />
Europe<br />
Mississippi River,<br />
United States<br />
Hat Yai City,<br />
Thailand<br />
Torrential monsoon rains during<br />
monsoon season<br />
4,100 na 22 dead,<br />
161,500 displaced<br />
10,000 na 700 dead,<br />
1,500,000 displaced<br />
3,000 1.8 114 dead,<br />
40,000 displaced<br />
10,200 400 40 dead,<br />
100,000 displaced<br />
Heavy rains and snowmelt 3,905 16,000 100,000 homes flooded,<br />
50,000 displaced<br />
Jökulhlaup flood 50,000 12 na<br />
Extreme spring snowmelt and<br />
heavy spring precipitation<br />
Storm of a short duration and<br />
extreme intensity<br />
Cold front associated with<br />
cyclonic circulation and heavy<br />
rainfall<br />
Heavy rain due to low pressure<br />
system<br />
Heavy precipitation in June<br />
and July; saturated soil due to<br />
extremely high precipitation<br />
na na 9 dead,<br />
25,000 displaced<br />
650 na 50,000 displaced<br />
11,300 na 60 dead,<br />
16,000 displaced<br />
3,100 na na<br />
na 15,000 50 dead,<br />
75,000 displaced<br />
Brief torrential monsoon rain na 172 664 dead,<br />
301,000 displaced<br />
January 1983 Northern Peru El Niño situation with heavy rains 3,500 na 380 dead,<br />
700,000 displaced<br />
August 1979<br />
June-<br />
September<br />
1954<br />
January 1953<br />
January 1910<br />
May 1889<br />
Machu River,<br />
India<br />
Yangtze River,<br />
China<br />
North Sea,<br />
Netherlands<br />
Seine River,<br />
France<br />
Johnstown,<br />
Pennsylvania,<br />
United States<br />
Exceptionally heavy rainfall,<br />
swollen river, resulting in collapse<br />
of the Matchu Dam<br />
Intensive rainfall over several<br />
months<br />
High spring tide and a severe<br />
European windstorm<br />
Very wet period for six months<br />
followed by heavy rains in January<br />
Extremely heavy rainfall due to<br />
storm followed by breach of dike<br />
July 1860 Eastern Norway Frost and heavy snowfall<br />
followed by snowmelt and heavy<br />
precipitation<br />
na is not available or not applicable.<br />
Source: Compiled by Siegfried Demuth, International Hydrological Programme, UNESCO.<br />
16,307 100 1,500 dead,<br />
400,000 displaced<br />
66,800 na 30,000 dead,<br />
18,000 displaced<br />
na 504 1,835 dead,<br />
100,000 displaced<br />
460 na 200,000 displaced<br />
na 17 2,200 dead<br />
3,200 na 12 dead<br />
Water in a changing world 215
PART<br />
3<br />
Chapter 12<br />
In the past three<br />
decades droughts<br />
have become<br />
more widespread,<br />
more intense and<br />
more persistent<br />
occurrence and severity of droughts. But<br />
it is difficult to disentangle the impacts of<br />
climate change from those of other human<br />
influences (engineered effects and land use<br />
changes) and multidecadal climate variability.<br />
More intense droughts, affecting more<br />
people and linked to higher temperatures<br />
and decreased precipitation, have been<br />
observed in the 21st century, in Europe and<br />
globally. 9 A similar pattern is found for heat<br />
waves. The high pressure system that developed<br />
over Western Europe in 2003 blocked<br />
moist air masses from the west and allowed<br />
warm, dry air masses from Northern Africa<br />
to move northwards. The result was large<br />
precipitation deficits and record-breaking<br />
temperatures across most of Central and<br />
Southern Europe, with drought conditions<br />
lasting from March to September.<br />
Several summaries of observed and<br />
predicted impacts of climate change on<br />
hydrologic droughts have been published. 10<br />
A study of spatial and temporal changes<br />
in streamflow droughts using a dataset of<br />
more than 600 daily European streamflow<br />
records from the European Water Archive<br />
of the UNESCO Flow Regime from International<br />
Experimental Data (FRIEND)<br />
detected no significant changes for most<br />
stations. 11 However, distinct regional differences<br />
were found. For 1962-90, examples<br />
of increasing drought were found in<br />
Spain, the eastern part of Eastern Europe<br />
and large parts of the United Kingdom,<br />
whereas examples of decreasing drought<br />
were found in large parts of Central Europe<br />
and the western part of Eastern Europe.<br />
These trends in streamflow drought could<br />
be explained largely by changes in precipitation<br />
or artificial hydrologic influences in<br />
the catchment. However, the period analysed<br />
and the selection of stations can also<br />
influence regional patterns. Recent trend<br />
studies of long time series in the Czech Republic<br />
show that, following a catastrophic<br />
flood in 2002, extreme hydrologic drought<br />
occurred in 2003 and 2004 as a result of an<br />
increasing trend in air temperature and a<br />
long-term decline in precipitation, especially<br />
during the summer months. 12 Extreme<br />
droughts occurred in Europe in 2003<br />
and 2006. All these recent droughts could<br />
well change the spatial pattern of droughts<br />
found for Europe in the earlier study.<br />
The heat wave and drought between June<br />
and mid-August 2003 in Europe were accompanied<br />
by annual precipitation deficits<br />
of up to 300 millimetres. Vegetation and ecosystems<br />
suffered heat and drought stress,<br />
and record wildfires were experienced<br />
(more than 5% of the forest area of Portugal<br />
burned). Gross primary production of terrestrial<br />
ecosystems across Europe fell to an<br />
estimated 30% of normal. Damages resulting<br />
from agricultural crop losses and higher<br />
production costs were estimated at more<br />
than €13 billion. Major rivers, including<br />
the Danube, Loire, Po and Rhine, were at<br />
record low levels, disrupting inland navigation,<br />
irrigation and power-plant cooling.<br />
Extreme glacier melt mitigated the effects<br />
of low rainfall and high evaporation on<br />
streamflows in rivers partly fed by glaciers,<br />
such as the Danube and the Rhine.<br />
Box 12.3 Drought in Australia, 1996-2007<br />
For large parts of southern and<br />
eastern Australia dry conditions have<br />
persisted since October 1996. For<br />
some areas the rainfall deficit over this<br />
period exceeded a full year’s normal<br />
rainfall. In the agriculturally important<br />
Murray-Darling River basin October<br />
2007 marked the sixth year of lower<br />
than average rainfall, with November<br />
2001-October 2007 being the driest<br />
such six-year period on record.<br />
The recent drought in Australia has<br />
contributed to changes in Australia’s<br />
management of water resources.<br />
Acknowledging that too much water<br />
has been taken from rivers and<br />
aquifers, particularly in the Murray-<br />
Darling basin, Australia has decided<br />
that it must make better use of its<br />
water resources. This means improved<br />
efficiency and productivity of water<br />
use and better use of water markets to<br />
optimize the economic benefits that<br />
water brings (see box 4.2 in chapter<br />
4). Australia understands that it must<br />
secure water supplies for current<br />
and future needs, including from a<br />
range of new sources that rely less on<br />
rainfall given the clear threat climate<br />
change poses to traditional water<br />
sources.<br />
Water restrictions have been put in<br />
place in all major cities in response<br />
to the severe drought. These include<br />
restrictions on watering lawns, using<br />
sprinkler systems, washing vehicles,<br />
hosing in paved areas, refilling swimming<br />
pools and others. Restrictions<br />
can be adjusted to current conditions.<br />
In some cities water inspectors monitor<br />
water use and can impose fines or<br />
shut off water supplies for water use<br />
infractions.<br />
Source: www.mdbc.gov.au/ and www.<br />
bom.gov.au/.<br />
In the past three decades droughts have become<br />
more widespread, more intense and<br />
more persistent due to decreased precipitation<br />
over land and rising temperatures,<br />
resulting in enhanced evapotranspiration<br />
and drying. The occurrence of droughts<br />
seems to be determined largely by changes<br />
in sea surface temperatures, especially in<br />
the tropics, through associated changes in<br />
atmospheric circulation and precipitation.<br />
In the western United States diminishing<br />
snow pack and resultant reductions in soil<br />
moisture also appear to be factors. In Australia<br />
(box 12.3) and Europe the extremely<br />
high temperatures and heat waves accompanying<br />
recent droughts have implied<br />
direct links to global warming. Sahelian<br />
droughts have led to severe losses of livestock,<br />
with losses as high as 62% observed<br />
in part of Ethiopia in 1998-99. 13 Globally,<br />
very dry areas (land areas with a Palmer<br />
Drought Severity Index of 3.0 or less) have<br />
more than doubled since the 1970s (from<br />
about 12% to 30%), with a large jump in<br />
the early 1980s due to an El Niño Southern<br />
216 World Water Development Report 3
evolving hazards – and emerging opportunities<br />
PART<br />
3<br />
Oscillation-related precipitation decrease<br />
over land and subsequent increases due<br />
primarily to surface warming. 14<br />
Climate change and other global trends<br />
such as increasing population and increasing<br />
deforestation demand better risk assessment<br />
in the management of vulnerable<br />
water resources, balancing social, environmental<br />
and economic requirements, to<br />
achieve a sustainable water supply system.<br />
Changes in groundwater<br />
The groundwater portion of the water cycle<br />
has been subjected to massive changes,<br />
particularly during the past hundred years<br />
as humans learned to dig or drill wells and<br />
abstract groundwater using pumps. Use of<br />
groundwater for irrigated agricultural has<br />
increased enormously in the past 50 years,<br />
and some 70% of global groundwater<br />
abstraction is now estimated to be used in<br />
irrigation. Particularly in areas associated<br />
with the green revolution, heavy groundwater<br />
pumping has led to unsustainable<br />
conditions, with falling water levels, degraded<br />
groundwater aquifers and increased<br />
salinization. Pollution of shallow aquifers<br />
became widespread four or five decades ago<br />
and has triggered water quality protection<br />
measures in many countries (see chapter 8).<br />
Groundwater abstractions have also<br />
contributed to the development of rural<br />
economies, 15 indicating that a balance<br />
has to be found in groundwater development.<br />
Groundwater serves a water shortage<br />
buffer function during short-term climate<br />
variations and is important to adaptation<br />
strategies. In many places groundwater<br />
mining from fossil aquifers is the only reliable<br />
means of obtaining water (see chapter<br />
11). These groundwater resources are<br />
increasingly being used for agricultural,<br />
industrial and domestic water supplies,<br />
although they are almost never recharged.<br />
Changing land use and water infrastructure<br />
have also greatly modified groundwater<br />
regimes, with groundwater pumping<br />
from deep aquifers now a worldwide<br />
phenomenon. In many places groundwater<br />
is pumped with no understanding of its<br />
source or its annual recharge and therefore<br />
of how much may be used sustainably.<br />
Results include falling water levels, desiccated<br />
wetlands, dewatered rock sequences<br />
and land subsidence (box 12.4). More data<br />
are urgently needed to quantify groundwater<br />
resources worldwide as a basis for<br />
improved groundwater management.<br />
Changes in erosion, landslides,<br />
river morphology and<br />
sedimentation patterns<br />
A more vigorous hydrologic cycle would<br />
imply greater water extremes, which could<br />
affect the relationships between hydrology<br />
heavy<br />
groundwater<br />
pumping has led<br />
to unsustainable<br />
conditions, with<br />
falling water<br />
levels, degraded<br />
groundwater<br />
aquifers and<br />
increased<br />
salinization<br />
Box 12.4<br />
Controlled exploitation and artificial recharge as effective measures against<br />
detrimental subsidence<br />
Industrial and agricultural development in<br />
the last century, accompanied by an exponential<br />
growth of cities, led to concentrated<br />
pumping of groundwater resources<br />
worldwide. During the 1960s and 1970s<br />
subsidence occurred in many parts of<br />
the world, with widespread damage to<br />
property and infrastructure. Large cities<br />
built on highly compressible sediments<br />
in coastal areas increasingly experienced<br />
flooding and salt intrusion. Controlled<br />
pumping schemes and artificial recharge<br />
measures have managed to slow and even<br />
reverse subsidence. But with sea levels projected<br />
to rise as a result of global climate<br />
change, maintaining these schemes and<br />
minimizing the contribution of subsidence<br />
has become even more urgent.<br />
Even as Venice experienced a relative sea<br />
level rise of 23 centimetres over the last<br />
century, the subsidence associated with<br />
aquifer depletion increased exponentially<br />
until 1961. With curtailing of overexploitation<br />
since 1970, subsidence has stabilized<br />
at the rate of natural subsidence, at less<br />
than 0.5 millimetre a year, and the artesian<br />
aquifers have begun to rebound.<br />
The effects of rapid urbanization and<br />
industrialization are especially apparent in<br />
China, where increasing subsidence has led<br />
to extensive environmental and economic<br />
damage in more than 45 cities, more than<br />
11 of which have experienced cumulative<br />
subsidence of more than 1 metre. Tianjin<br />
experienced related economic losses from<br />
1959 to 1993 estimated at $27 billion.<br />
Shanghai took drastic measures in 1965, as<br />
total subsidence since 1920 had reached as<br />
much as 2.63 metres. Pumping has been<br />
reduced by 60%, and users are requested<br />
to inject the same quantity of water into<br />
aquifers in winter as is used in summer.<br />
While pumping-related subsidence has<br />
been controlled, drainage for construction<br />
and compaction of foundation layers have<br />
been causing subsidence rates of up to 10<br />
millimetres a year since 1990.<br />
Many groundwater basins in the arid<br />
and semi-arid United States experienced<br />
subsidence in response to heavy pumping,<br />
effectively reducing aquifer storage.<br />
As a result of rapid growth of Las Vegas,<br />
Nevada, pumping rates have exceeded<br />
natural recharge since about 1960, despite<br />
imports of Colorado River water. In the<br />
late 1980s the Las Vegas Water Valley<br />
District initiated an artificial recharge programme,<br />
injecting Colorado River water<br />
into the principal aquifers. Net annual<br />
pumpage has now been reduced to the<br />
level of natural recharge. The water level<br />
drawdown has recovered from a maximum<br />
of 90 metres to as few as 30 metres.<br />
Subsidence has also decreased considerably,<br />
although the depressurized aquifer<br />
continues to compact, evidence that the<br />
detrimental effects of overpumping can<br />
continue long after control measures have<br />
been taken.<br />
Source: Ger de Lange, the Netherlands Organisation<br />
for Applied Scientific Research, Built Environment<br />
and Geosciences; Poland 1984; Carbognin,<br />
Teatini, and Tosi 2005; Hu et al. 2004; Chai et al.<br />
2004; Wang 2007; Bell et al. 2008.<br />
Water in a changing world 217
PART<br />
3<br />
Chapter 12<br />
Increased<br />
erosion rates<br />
have important<br />
implications for<br />
the sustainability<br />
of the global soil<br />
resource, food<br />
security and<br />
environment<br />
and geomorphology. More intense rainfall<br />
could lead to more water-induced erosion,<br />
while drier climates could result in<br />
wind-induced erosion. And changes in<br />
the seasonal distributions of rainfall can<br />
have significant implications for patterns<br />
of vegetation growth and thus for soil erosion.<br />
Climate and erosion are interdependent<br />
components of the Earth’s hydrologic<br />
cycle and of the environment. In addition<br />
to being affected by shifts in climate, soil<br />
erosion can affect climate. Desertification<br />
processes are intertwined with soil<br />
degradation and vegetation changes. These<br />
changes, possibly exacerbated by erosion,<br />
result in the loss of soil carbon and the<br />
release of carbon dioxide into the atmosphere,<br />
contributing to global warming.<br />
Changes in vegetative growth and land<br />
use that are driven by accelerated erosion<br />
can also influence the hydrologic cycle<br />
and thus the climate.<br />
Changes in the key hydrologic drivers,<br />
such as rainfall amount and intensity, surface<br />
runoff and river discharge, caused by<br />
climate change and changes in land cover<br />
and land use, can be expected to cause<br />
significant increases in global soil erosion<br />
and in the sediment loads transported by<br />
rivers. Changes in sediment load could reflect<br />
both changing rates of sediment mobilization<br />
and supply to the river system<br />
and changes in transport capacity caused<br />
by changes in discharge and the impact<br />
of reservoirs and other human-made sinks<br />
and stores in reducing downstream fluxes.<br />
In turn, changes in the sediment regimes<br />
of rivers affect the storage capacity of<br />
reservoirs and the yield of water resources<br />
systems. Although data are limited, it is<br />
possible to assess the general magnitude<br />
and direction of changes in erosion and<br />
sediment transport over the past decades.<br />
Erosion rates<br />
The conversion of native vegetation to<br />
agriculture has been shown to increase soil<br />
erosion rates 10- to 100-fold. 16 With agricultural<br />
land now occupying about 37%<br />
of the ice-free area of the continents, it is<br />
clear that agriculture has had an enormous<br />
impact on global erosion rates. Increased<br />
erosion rates have important implications<br />
for the sustainability of the global soil resource,<br />
food security and the environment.<br />
Much of the world’s farmland has been<br />
cultivated for centuries and in some regions<br />
for millennia. Major increases in soil<br />
erosion rates are unlikely to have occurred<br />
within these areas in the recent past. But<br />
in other areas, particularly in developing<br />
countries, a rapidly expanding population<br />
has led to recent land clearance and rapid<br />
expansion of cultivated land. Since 1960<br />
world population has approximately doubled,<br />
and cropland has increased by more<br />
than 10%. 17<br />
From a global perspective, however, such<br />
recent increases in soil loss are likely<br />
to have been at least partially offset by<br />
reduced erosion in other regions following<br />
implementation of soil conservation<br />
programmes and improved land management<br />
during the 20th century. In the<br />
United States soil conservation and related<br />
measures promoted by the Food Security<br />
Act of 1985 have reduced total annual erosion<br />
from cropland by an estimated 40%,<br />
from 3.4 gigatonnes (Gt) a year to 2.0 Gt. 18<br />
In China erosion control measures in the<br />
loess region of the Middle Yellow River<br />
basin after 1978 helped reduce the annual<br />
sediment load of the Middle Yellow River<br />
from about 1.6 Gt in the mid-20th century<br />
to 0.7 Gt at the end of the 20th century. 19<br />
Elsewhere, the progressive introduction of<br />
no-till and minimum till practices – now<br />
implemented on an estimated 5% of world<br />
cropland 20 – has also reduced erosion rates<br />
on cultivated land. Such measures typically<br />
reduce erosion rates by more than<br />
one order of magnitude. 21<br />
While an accurate assessment of the relative<br />
importance of these opposing trends<br />
for the contemporary global soil erosion<br />
budget is still not possible, it is clear that<br />
significant changes are occurring. Furthermore,<br />
there is increasing recognition<br />
that, with the greater variability of rainfall<br />
and the higher frequency of extreme<br />
storm events accompanying future climate<br />
change, erosion rates in many areas of the<br />
world are likely to rise. A recent study in<br />
the Midwestern United States, combining<br />
the output from general circulation<br />
models with erosion models that also took<br />
into account the likely impact of climate<br />
change on crop management and crops<br />
grown, suggested that erosion rates would<br />
increase in 10 of the 11 study area regions.<br />
Increases relative to 1990-99 were predicted<br />
to range from 33% to 274% by 2040-59.<br />
Sediment loads<br />
A river’s sediment load is sensitive to a<br />
range of environmental controls related to<br />
both the supply of sediment to the river<br />
and its ability to transport that sediment.<br />
Long-term sediment measurements are unavailable<br />
for most of the world’s rivers, precluding<br />
detailed analysis of global trends,<br />
but available data show that important<br />
changes are occurring. 22 For many rivers<br />
there is evidence of reduced sediment<br />
218 World Water Development Report 3
evolving hazards – and emerging opportunities<br />
PART<br />
3<br />
loads in recent years, 23 primarily because<br />
of the construction of dams, which trap<br />
a large proportion of the sediment load<br />
previously transported by the river. One<br />
estimate suggests that more than 40% of<br />
global river discharge is intercepted by<br />
large dams (dams with a storage capacity<br />
of more than 0.5 cubic kilometre). 24 Dams<br />
on the Colorado and the Nile Rivers have<br />
reduced the sediment load of those rivers<br />
to near zero.<br />
Changes in sediment load have important<br />
implications for global geochemical<br />
cycling and sediment-associated carbon<br />
fluxes. From a more local perspective<br />
increased sediment loads frequently cause<br />
degradation of water quality and aquatic<br />
habitats and increased siltation of reservoirs,<br />
river channels, canal systems and<br />
harbours. In many contexts reduced sediment<br />
loads bring benefits, but in deltas<br />
and coastal areas reduced sediment inputs<br />
can remove important nutrient sources<br />
and lead to shoreline recession. Landslides,<br />
the most dramatic erosion process, present<br />
the gravest hazard to human communities.<br />
Until the International Geotechnical<br />
Society UNESCO Working Party on World<br />
Landslide Inventory was established during<br />
the International Decade for Natural<br />
Disaster Reduction of 1990-2000, there<br />
was no common definition of landslides.<br />
The international unified definition was<br />
agreed as ‘the movement of a mass of rock,<br />
debris or earth down a slope’. 25 Landslides<br />
are classified by a combination of the type<br />
of material (rock, debris and earth) and<br />
type of movement (fall, slide, flow, topple<br />
and spread).<br />
While the definition has been approved<br />
internationally, no unified map of the<br />
distribution of landslides has ever been<br />
prepared. However, a global-scale landslide<br />
susceptibility map was produced by the<br />
International Programme on Landslides<br />
with World Bank funding. 26 Landslide<br />
susceptibility is calculated from topography,<br />
earthquake and rainfall data. The<br />
model does not include the shear strength<br />
of soils, which is difficult to quantify at<br />
the global scale. Recently, the US National<br />
Aeronautics and Space Administration<br />
(an International Consortium on Landslides<br />
member) also compiled a landslide<br />
susceptibility map using Shuttle Radar<br />
Topography Mission data, the Food and<br />
Agriculture Organization’s digital soil map<br />
and other information.<br />
Changes in precipitation or precipitationcausing<br />
phenomena (such as cyclones<br />
and typhoons) can lead to increased<br />
severity or frequency of landslides. If<br />
these changes are accompanied by seismic<br />
activities, there is a strong potential for<br />
an increase in landslide-triggering events.<br />
For example, in 2004 Japan experienced<br />
the greatest number of typhoons in its<br />
history. After one of these typhoons the<br />
2004 Niigata-ken Chuetsu earthquake<br />
occurred. The earthquake triggered more<br />
large-scale landslides than had events of<br />
a similar magnitude, such as the 1995<br />
Hyogo ken-Nanbu (Kobe) earthquake and<br />
the 2005 Fukuoka-ken Saiho-oki offshore<br />
earthquake. In February 2006 a small<br />
earthquake, which occurred five days after<br />
three days of continuous rainfall, triggered<br />
a huge landslide in Leyte Island, Philippines,<br />
killing more than 1,000 people.<br />
Climate change will affect water quality<br />
and ecosystem health through higher<br />
water temperatures, lower water levels,<br />
more flooding and changes in lake<br />
stratification patterns. Aquatic ecosystem<br />
dynamics are driven by temperature and<br />
water availability, which determine energy<br />
flow; the primary production, composition,<br />
structure and biological diversity of<br />
ecosystems; the range of global biomass;<br />
pattern of ecosystem succession and the<br />
type of climax biome.<br />
Increased water temperatures promote<br />
algal blooms and increase toxic cyanobacteria<br />
bloom. A toxin produced by microcistis<br />
(Microcistina-LR) is 10 times more<br />
toxic than strychnine. Toxic cyanobacteral<br />
blooms, already present on all continents,<br />
may intensify, requiring restrictions on<br />
people’s use of water resources.<br />
Relatively small increases in temperature<br />
also accelerate energy flow and matter<br />
cycling: a 1°C warming enhances ecosystem<br />
productivity by 10%-20% at all<br />
trophic levels. An increase in zooplankton<br />
consumption may reduce the density of<br />
this food source, resulting in a decline in<br />
the food base for fish, inhibiting growth<br />
and favouring small species over large<br />
(an insufficient food base for larger species).<br />
An overlapping of changing abiotic<br />
conditions, such as rising temperature and<br />
declining dissolved oxygen content, may<br />
be an additional stressor, contributing<br />
to a lowering of biodiversity and ecosystems<br />
function. This could mean shifts<br />
in dominant species, a destabilization of<br />
the ecosystem equilibrium and a shift to<br />
another steady-state. Rising water temperatures<br />
and related changes in ice cover,<br />
salinity, oxygen levels and water circulation<br />
have already contributed to global<br />
shifts in the range and abundance of algae,<br />
Climate change will<br />
affect water quality<br />
and ecosystem<br />
health through<br />
higher water<br />
temperatures,<br />
lower water levels,<br />
more flooding<br />
and changes in<br />
lake stratification<br />
patterns<br />
Water in a changing world 219
PART<br />
3<br />
Chapter 12<br />
if hazards become<br />
more severe<br />
(in intensity or<br />
magnitude),<br />
countries will face<br />
new challenges,<br />
requiring<br />
additional<br />
cooperation with<br />
other concerned<br />
countries in<br />
mitigating hazards<br />
zooplankton and fish in high-latitude<br />
oceans and high-altitude lakes, as well as<br />
to earlier migrations of fish in rivers.<br />
The effects of increased temperatures and<br />
the acceleration of biological processes<br />
will differ depending on hydrologic type<br />
and the characteristics and complexity of<br />
aquatic ecosystems. In colder regions, for<br />
example, rising water temperatures can<br />
improve water quality during winter and<br />
spring, with earlier ice breakup increasing<br />
oxygen levels and reducing winter fishkills.<br />
27<br />
The response of river ecosystems to climate<br />
change will depend on their location<br />
within the river basin. Longitudinal linkages<br />
are important to the functioning of<br />
river ecosystems. Upper sections of rivers<br />
are usually driven by abiotic factors (flow<br />
and water quality), and the biotic structures<br />
are better adapted to high abiotic<br />
(hydrologic) variability, resistant to rapid<br />
and unexpected changes and better able to<br />
recover from stress. Down the river course,<br />
with more stable abiotic characteristics,<br />
biotic processes determine ecosystem dynamics,<br />
and ecosystems are more vulnerable<br />
to global warming.<br />
Modification of precipitation patterns due<br />
to climate change will directly influence<br />
runoff and the timing and intensity of<br />
nutrient and pollutant supplies to rivers<br />
and lakes. Greater changes are expected in<br />
catchments with degraded vegetation cover,<br />
landscape drainage and wetland loss. Open<br />
nutrient cycles in the terrestrial ecosystems<br />
due to reduced nutrient retention in biomass<br />
and mineralization of organic matter<br />
in soils will intensify nutrient loss to freshwater.<br />
More intense rainfall events will also<br />
lead to greater fluvial erosion and increases<br />
in suspended solids loads (turbidity) in lakes<br />
and reservoirs. 28 Extension of the growing<br />
season due to global warming may increase<br />
the duration of agricultural activities, which<br />
may cause more nutrient leaching from<br />
agricultural areas. 29 All these processes will<br />
contribute to intensification of eutrophication,<br />
a common problem in lakes and rivers<br />
all over the world and a serious hazard for<br />
human activities (drinking water, aquaculture,<br />
recreation) and ecosystem functioning.<br />
The expected overall lowering of water<br />
levels in rivers and lakes will worsen water<br />
quality. Water reserves will become more<br />
turbid through the resuspension of bottom<br />
sediments, 30 and the reduction in water<br />
supply will increase the concentration of<br />
pollutants in water resources. Oxygenation<br />
of river water – a key indictor of biological<br />
water quality – is enhanced under high<br />
flow conditions that encourage surface<br />
aeration. Simulations of stream conditions<br />
under several climate change scenarios<br />
found that decreased streamflows resulted<br />
in decreased oxygen levels and water<br />
quality. 31 Salinity levels will increase<br />
with decreasing streamflow in semi-arid<br />
and arid areas. Salt concentrations are<br />
predicted to increase 13%-19% by 2050 in<br />
the upper Murray-Darling River basin in<br />
Australia. 32 Salinization of water resources<br />
is also predicted to be a major hazard for<br />
island nations, where coastal seawater<br />
intrusion is expected with rising sea levels.<br />
The higher temperature, change in precipitation<br />
patterns and shift in regional wind<br />
regimes associated with climate change are<br />
likely to alter the thermal stratification of<br />
lakes and reservoirs. Higher temperatures<br />
are likely to increase thermal stability and<br />
alter mixing patterns in lakes, resulting<br />
in reduced oxygen concentrations and<br />
increased release of phosphorous from<br />
sediments. 33 Simulations suggest that lakes<br />
in subtropical zones (latitude 30° to 45°)<br />
and subpolar zones (latitude 65° to 80°)<br />
are subject to greater relative changes in<br />
thermal stratification patterns than are<br />
mid-latitude or equatorial lakes and that<br />
in subtropical zones deep lakes are more<br />
sensitive than are shallow lakes. 34<br />
Simulations also show that winter stratification<br />
in cold regions would be weakened<br />
and the anoxic zone would disappear. 35<br />
The greatest increases in water temperatures<br />
are foreseen in lakes where the<br />
duration of ice cover will be substantially<br />
reduced. In addition, simulations show a<br />
10° or more northward shift in the boundary<br />
of ice-free conditions in the Northern<br />
Hemisphere. 36 Observations during<br />
droughts in the boreal region of northwestern<br />
Ontario, Canada, show that lower<br />
inflows and higher temperatures produce a<br />
deepening of the thermocline. 37 Changes<br />
in wind speed and direction contributing<br />
to patterns of lake and reservoir mixing<br />
and thermal stratification may alter the<br />
biomass cycling in lakes. Countries that<br />
share water resources may face additional<br />
challenges under conditions of changing<br />
hazards. In areas with experience of hazards<br />
countries are used to managing such<br />
crises. But if hazards become more severe<br />
(in intensity or magnitude), countries will<br />
face new challenges, requiring additional<br />
cooperation with other concerned countries<br />
in mitigating hazards. 38<br />
In new hazard-exposed areas there will be<br />
great variations in how countries mitigate<br />
220 World Water Development Report 3
evolving hazards – and emerging opportunities<br />
PART<br />
3<br />
hazards affecting international waters. In<br />
broad terms OECD countries in Europe,<br />
North America and South East Asia would<br />
be able to direct their institutional and<br />
financial resources towards new cooperative<br />
efforts. Developing countries, with limited<br />
resources and hazard mitigating experience,<br />
would be more exposed. Examples include<br />
the Mekong River basin and some of the<br />
major basins in West and Central Africa. 39<br />
Changes in transboundary water resources<br />
(through engineered developments or<br />
climate change) will present opportunities<br />
for international cooperation. The<br />
cooperation must be based on a common<br />
understanding of the nature of the resource<br />
as well as its value to the countries<br />
who share it. And it must involve collecting<br />
and sharing reliable data and applying<br />
compatible data analysis methods.<br />
Attention is coming to transboundary<br />
groundwater issues much later than to<br />
surface water concerns. Governments,<br />
institutions and other stakeholders that<br />
have developed strategies for effective<br />
groundwater resources management at<br />
the local and national levels are learning<br />
that coordination is also necessary across<br />
administrative boundaries (see box 12.5<br />
on the Guaraní aquifer). As a result, over<br />
Box 12.5<br />
Towards transboundary management of the Guaraní aquifer<br />
The Guaraní aquifer<br />
in Argentina, Brazil,<br />
Paraguay and Uruguay<br />
averages some 250<br />
metres in thickness and<br />
covers an estimated<br />
area of 1.2 million<br />
square kilometres. The<br />
aquifer’s groundwater<br />
resources are contained<br />
in sand and sandstone<br />
beds deposited since<br />
the Mesozoic Era and<br />
mostly confined below<br />
volcanic rocks. Estimated<br />
annual recharge is about<br />
166 cubic kilometres,<br />
produced mainly in<br />
the zones where there<br />
are outcroppings of<br />
unconfined parts of the<br />
aquifer. The climate in<br />
the area is humid to<br />
subhumid, with annual<br />
precipitation of 1,200-<br />
1,500 millimetres.<br />
The quality of the<br />
Guaraní’s groundwater<br />
is generally good, with<br />
a few exceptions. About<br />
20 million people live<br />
over the aquifer, and<br />
some parts are intensely<br />
exploited, while others<br />
are virtually untouched.<br />
There are still many gaps<br />
in knowledge about the<br />
state and performance of<br />
this aquifer system.<br />
Location of the Guaraní transboundary aquifer<br />
Catamarca<br />
BOLIVIA<br />
Jujuy<br />
Salta<br />
Tucumán<br />
ARGENT<strong>IN</strong>A<br />
Córdoba<br />
Santiago<br />
del Estero<br />
PARAGUAY<br />
Santa Fe<br />
Resistencia<br />
Paraná<br />
Formosa<br />
Concordia<br />
Buenos Aires<br />
Corrientes<br />
Source: Guaraní Aquifer System Project 2003.<br />
Cuiabá<br />
Asunción<br />
Encarnación (Itapúa)<br />
Salto<br />
Posadas<br />
Santana do<br />
Livramento<br />
Rivera<br />
URUGUAY<br />
Montevideo<br />
Campo Grande<br />
Porto Alegre<br />
ATLANTIC OCEAN<br />
Goiânia<br />
BRAZIL<br />
Curitiba<br />
Florianópolis<br />
Brasília<br />
Ribeirão Preto<br />
São Paulo<br />
Belo Horizonte<br />
Potential indirect recharge areas<br />
From surface runoff<br />
From underground flows<br />
Potential direct recharge areas<br />
Porous: Guaraní outcroppings<br />
Fractured/porous:<br />
basalt and sandstone<br />
Potential discharge areas<br />
Porous: Guaraní outcroppings<br />
Fractured/porous:<br />
basalt and sandstone<br />
Fractured/porous: to be defined<br />
Cities (pilot areas)<br />
State/provincial capitals<br />
National capitals<br />
National boundaries<br />
Plata watershed basin<br />
Paraná geological basin<br />
Paraná geological basin<br />
(to be defined)<br />
Wetlands<br />
The four countries have cooperated<br />
since early 2003 in a project for sustainable<br />
management and protection<br />
of the aquifer, with support from the<br />
Global Environment Facility, the World<br />
Bank and the Organization of American<br />
States and with participation of the<br />
International Atomic Energy Agency<br />
and the German Federal Institute for<br />
Geosciences and Natural Resources. The<br />
project aims to explore and assess the<br />
aquifer system in more detail and to<br />
develop a framework for coordinated<br />
management. In addition, four pilot<br />
areas with emerging problems have<br />
been selected to gain experience in<br />
local management.<br />
Source: www.sg-guarani.org/index;<br />
UNESCO/OAS ISARM 2007.<br />
Water in a changing world 221
PART<br />
3<br />
Chapter 12<br />
Over many<br />
generations the<br />
human race has<br />
shown an amazing<br />
ability to adapt and<br />
adjust to climate<br />
variability and<br />
increasing pressure<br />
on resources<br />
the last decade international and regional<br />
organizations have developed initiatives<br />
related to internationally shared aquifer<br />
resources management, in cooperation<br />
with countries in the regions concerned. 40<br />
Mapping and descriptions of transboundary<br />
aquifers are the first steps. The United<br />
Nations Economic Commission for Europe<br />
conducted an inventory of transboundary<br />
aquifers in Europe in 1999, 41 and inventories<br />
in other regions followed. Recent<br />
outcomes are an atlas of the 68 identified<br />
transboundary aquifers of the Americas 42<br />
and an assessment report on transboundary<br />
rivers, lakes and aquifers that includes<br />
51 transboundary aquifers in Southeastern<br />
Europe and 18 in the Caucasus<br />
and Central Asia region. 43 International<br />
projects are facilitating the exchange of<br />
information and experiences and developing<br />
improved methodologies and the<br />
scientific basis of transboundary aquifer<br />
management. A 2007 agreement created<br />
the UNESCO Regional Centre for Shared<br />
Aquifer Resources Management for Africa<br />
in Tripoli. The United Nations International<br />
Law Commission, in cooperation with<br />
the UNESCO-International Hydrological<br />
Programme, drafted articles on the Law<br />
on Transboundary Aquifers, which was<br />
subsequently approved by the UN General<br />
Assembly on 11 December 2008.<br />
Challenges: hazards and<br />
opportunities<br />
Based on identified trends, the future will<br />
see increased pressure on water resources<br />
and changes in the patterns and magnitudes<br />
of resource availability related to<br />
changing climate patterns. While climate<br />
change represents a huge challenge, it<br />
also represents an opportunity – for new<br />
growth, innovation in the management<br />
of water resources and development of a<br />
modern economy. Because humans have<br />
modified and adapted their lifestyles<br />
to the existing climate and its inherent<br />
variability, climate change is expected to<br />
affect most aspects of human life, notably<br />
through the hazardous aspects of<br />
water- related events. Some areas may gain<br />
greater access to water through increased<br />
precipitation, while others may have less<br />
or more variable water resources.<br />
Over many generations the human race<br />
has shown an amazing ability to adapt<br />
and adjust to climate variability and<br />
increasing pressure on resources. There<br />
are many examples of countries that have<br />
managed their scarce resources efficiently<br />
and effectively, despite low rainfall and<br />
streamflows. Spain, a traditionally dryclimate<br />
country, has historically succeeded<br />
in managing its water resources through<br />
adaptation. An example of potential<br />
water gain is South Africa. Analysis of the<br />
actual evapotranspiration and yield of five<br />
commonly grown crops (beans, groundnuts,<br />
maize, millet and sorghum) in two<br />
selected districts found that yield increases<br />
with evapotranspiration, although the<br />
gap remains wide between actual and<br />
potential yield and actual and maximum<br />
evapotranspiration, especially for rainfed<br />
crops. 44 The analysis also showed that a<br />
2°C rise in temperature and a doubling<br />
of carbon dioxide concentration in the<br />
atmosphere will shorten the growing<br />
period of maize, lowering crop water<br />
requirements.<br />
The increased exposure to potential climate<br />
change hazards has raised awareness<br />
of critical issues related to water resources<br />
management that require solutions regardless<br />
of the impacts of climate change.<br />
The revision of management strategies<br />
in response to potential climate change<br />
threats therefore represents an opportunity<br />
to implement policies and practice<br />
that will lead to more sustainable use of<br />
resources. These could include improved<br />
observation networks (see chapter 13),<br />
increased integration of groundwater and<br />
surface water supplies (including artificial<br />
recharge), improved early warning and<br />
forecasting systems for hazardous events,<br />
improved risk-based approaches to management<br />
and the raising of community<br />
awareness of sustainable water resources<br />
use and individual responses to waterrelated<br />
hazards.<br />
The threat of climate change has led to<br />
many developments in the simulation<br />
of atmospheric processes, improving the<br />
accuracy of climate and weather forecasts.<br />
Combined with improved technology<br />
for monitoring, collecting and analysing<br />
information, these developments should<br />
lead to improvements in warning systems<br />
for floods and droughts and other major<br />
water-related events. If these can be combined<br />
with hazard mitigation strategies<br />
involving all levels of affected communities,<br />
there are enormous opportunities to<br />
avoid loss of human life and economic<br />
losses.<br />
There are also many specific examples of<br />
turning potential hazards into opportunities.<br />
These include using increased runoff<br />
from glacial melting to develop more<br />
reliable water supplies for larger areas and<br />
using flood water storage to increase the<br />
222 World Water Development Report 3
evolving hazards – and emerging opportunities<br />
PART<br />
3<br />
reliability of water supplies and improve<br />
floodplain management and planning<br />
(box 12.6).<br />
Box 12.6<br />
Lake Sarez, Tajikistan – turning a hazard into<br />
an opportunity<br />
Small and shallow alluvial aquifers scattered<br />
over the Earth’s arid and semi-arid<br />
regions – preferential zones for human<br />
settlement – are probably the most vulnerable<br />
groundwater systems to climate<br />
change. 45 Yet in areas of increasing water<br />
stress groundwater is an important buffer<br />
resource, capable of responding to overall<br />
increased water demands or of compensating<br />
for loss in surface water availability.<br />
This buffer capacity of groundwater<br />
systems depends on the ratio between<br />
the volume of stored groundwater and<br />
the mean annual recharge. Some major<br />
aquifers with non-renewable groundwater<br />
resources are found in arid environments<br />
of North and Southern Africa, the Arabian<br />
Peninsula and Australia and under permafrost<br />
in Northern Asia. 46 The direct impact<br />
of climate change on such resources is<br />
negligible, as their stored volumes are usually<br />
at least a thousand times the volume<br />
of mean annual recharge. Their stocks may<br />
be reduced more quickly than before, however,<br />
because of larger demands created by<br />
climate change and the decline of alternative<br />
water sources. Renewable groundwater<br />
systems with considerable storage will<br />
provide similar buffers in other parts of<br />
the world, and an increasingly larger share<br />
of total water abstraction is expected to<br />
come from groundwater.<br />
The storage capacity of aquifers also offers<br />
opportunities for enhancing groundwater<br />
storage by artificial recharge or managed<br />
aquifer recharge. Managed aquifer<br />
Lake Sarez, deep in the centre of the<br />
Pamir Mountains of Tajikistan, was<br />
created in February 1911, when an<br />
enormous rock collapsed from the<br />
bank of the Murgab River Valley,<br />
blocking the river and forming a dam<br />
behind which a lake formed. Lake<br />
Sarez is 55.8 kilometres long and<br />
averages 1.44 kilometres wide, with a<br />
maximum depth of 499.6 metres and<br />
maximum water volume of 16.074<br />
cubic kilometres. The lake’s water level<br />
is currently about 50 metres below<br />
the top of the dam and rising at a rate<br />
of 20 centimetres a year as a result of<br />
increased glacial melt, due largely to<br />
global warming. At the same time,<br />
the permeability of the dam material<br />
is changing, and the mineralization of<br />
water at the bottom levels is increasing.<br />
There is also a real threat of new<br />
landslides around the lake.<br />
Multiple hypotheses were developed<br />
recently on how the natural barrier<br />
would behave in a future earthquake<br />
or other catastrophe. Evaluations<br />
varied from the categorical ‘it will<br />
burst’ to the no less firm ‘it will not’.<br />
recharge, applied at an ever-growing rate, 47<br />
should be part of integrated water and<br />
catchment management strategies along<br />
with surface water and soil management,<br />
erosion and pollution control, demand<br />
and environmental management and<br />
wastewater reuse. Its role will become<br />
increasingly important as the impacts of<br />
climate change and variability become<br />
more apparent. 48<br />
While some sources stress that a<br />
catastrophic flood is unlikely, no one<br />
is dismissive of the risk considering<br />
the potential for devastation. A World<br />
Bank statement indicated that ‘should<br />
such a flood occur, the impact on<br />
the downstream valleys would be<br />
devastating, affecting up to 5 million<br />
people’. The impact of a dam break<br />
would be felt not only across Tajikistan<br />
but also in Afghanistan, Turkmenistan<br />
and Uzbekistan.<br />
Tajikistan recently proposed construction<br />
of a water pipeline that would<br />
serve all of Central Asia with safe<br />
drinking water through the regulated<br />
drainage of Lake Sarez. This would<br />
reduce the risk of a dam break or overflow,<br />
while supplying drinking water<br />
to the region. Lake Sarez is the largest<br />
freshwater reservoir in the upper watershed<br />
zone of the Aral Sea basin.<br />
Source: Vefa Mustafaev, UNESCO;<br />
Sirodjidin Aslov, Ambassador of Tajikistan<br />
to the United Nations; and N. F. Gorelkin<br />
Uzbekistan Department of Hydrometerology;<br />
World Bank 2005.<br />
Notes<br />
1. Huntington 2006.<br />
2. IPCC 2007.<br />
3. For example, Williams, Jackson, and<br />
Kutzbach 2007.<br />
4. IPCC 2007.<br />
5. IPCC 2007.<br />
6. IPCC 2001.<br />
7. Milly et al. 2002.<br />
8. Kundzewicz et al. 2005.<br />
9. Zhang et al. 2007.<br />
10. van Lanen, Tallaksen, and Rees 2007;<br />
Huntington 2006.<br />
11. Hisdal et al. 2001.<br />
12. Tallaksen, Demuth, and van Lanen<br />
2007.<br />
13. Easterling et al. 2007.<br />
14. Dai, Trenberth, and Qian 2004.<br />
15. Giordano and Villholth 2007.<br />
16. Montgomery 2007.<br />
17. Wilkinson and McElroy 2007.<br />
18. Uri and Lewis 1999.<br />
19. Hu et al. 2008.<br />
20. Lal et al. 2004.<br />
21. Montgomery 2007.<br />
22. Walling 2006.<br />
23. Walling and Fang 2003.<br />
24. Vörösmarty et al. 2003.<br />
25. Cruden 1991, p. 27.<br />
26. IPL n.d.<br />
27. IPCC 2007.<br />
28. IPCC 2007.<br />
29. Hillbricht-Ilkowska 1993.<br />
30. Atkinson, DePinto, and Lam 1999.<br />
31. Mimikou et al. 2000.<br />
32. IPCC 2007.<br />
33. Bates et al. 2008.<br />
34. Meyer et al. 1999.<br />
35. Fang and Stefan 1997.<br />
36. Hostetler and Small 1999.<br />
37. Schindler and Stainton 1996.<br />
38. Romm 2007.<br />
39. International Crisis Group 2007.<br />
40. For details see www.isarm.net.<br />
41. Almássy and Buzás 1999.<br />
42. UNESCO/OAS ISARM 2007.<br />
43. UNECE 2007.<br />
44. World Bank 2007.<br />
Water in a changing world 223
PART<br />
3<br />
Chapter 12<br />
45. van der Gun forthcoming.<br />
46. Foster and Loucks 2006.<br />
47. UNESCO 2005; Fox 2007.<br />
48. Gale 2005.<br />
References<br />
Almássy, E., and Z. Buzás. 1999. Inventory<br />
of Transboundary Groundwaters. Lelystad,<br />
Netherlands: United Nations Economic<br />
Commission for Europe.<br />
Atkinson, J. F., J. V. DePinto, and D. Lam.<br />
1999. Water Quality. In Potential Climate<br />
Change Effects on the Great Lakes Hydrodynamics<br />
and Water Quality, eds. D. Lam<br />
and W. Schertzer. Reston, VA: American<br />
Society of Civil Engineers.<br />
Bates, B., Z. W. Kundzewicz, S. Wu, and J.<br />
Palutik, eds. 2008. Climate Change and<br />
Water. Technical Paper of the Intergovernmental<br />
Panel on Climate Change. Geneva:<br />
Intergovernmental Panel on Climate<br />
Change.<br />
Bell, J. W., F. Amelung, A. Ferretti, M.<br />
Bianchi, and F. Novali. 2008. Permanent<br />
Scatterer in SAR Reveals Seasonal and<br />
Long-Term Aquifer-System Response<br />
to Groundwater Pumping and Artificial<br />
Recharge. Water Resources Research 44<br />
(2): W02407.<br />
Carbognin L., P. Teatini, and L. Tosi. 2005.<br />
Land Subsidence in the Venetian Area:<br />
Known and Recent Aspects. Giornale di<br />
Geologia Applicata 1 (1): 5-11.<br />
Carmon, N., and U. Shamir. 1997. Water-<br />
Sensitive Urban Planning: Concept and<br />
Preliminary Analysis. In Groundwater in<br />
the Urban Environment: Problems, Processes<br />
and Management, eds. J. Chilton, K.<br />
Hiscock, P. Younger, B. Morris, S. Puri, S.<br />
W. Kirkpatrick, H. Nash, W. Armstrong, P.<br />
Aldous, T. Water, J. Tellman, R. Kimblin,<br />
and S. Hennings. London: Balkema, Rotterdam,<br />
Brookfield.<br />
Chai J. C., Shen S. L., Zhu H. H, and<br />
Zhang X. L. 2004. Land Subsidence Due<br />
to Groundwater Drawdown in Shanghai.<br />
Géotechnique 54 (2): 43-147.<br />
Cruden, D. M. 1991. A Simple Definition of<br />
a Landslide. Bulletin of Engineering Geology<br />
and the Environment 43 (1): 27-9.<br />
Dai, A., K. E. Trenberth, and T. Qian. 2004.<br />
A Global Data Set of Palmer Drought Severity<br />
Index for 1870-2002: Relationship<br />
with Soil Moisture and Effects of Surface<br />
Warming. Journal of Hydrometeorology 5<br />
(6): 1117-30.<br />
Easterling, W. E., P. K. Aggarwal, P.<br />
Batima, K. M. Brander, L. Erda, S. M.<br />
Howden, A. Kirilenko, J. Morton, J. F.<br />
Soussana, J. Schmidhuber, and F. N.<br />
Tubiello. 2007. Food, Fibre and Forest<br />
Products. In Climate Change 2007:<br />
Impacts, Adaptation and Vulnerability.<br />
Contribution of Working Group II to the<br />
Fourth Assessment Report of the Intergovernmental<br />
Panel on Climate Change, eds.<br />
M. L. Parry, O. F. Canziani, J. P. Palutikof,<br />
P. J. van der Linden, and C. E. Hanson.<br />
Cambridge, UK: Cambridge University<br />
Press.<br />
Fang, X., and H. G. Stefan. 1997. Simulated<br />
Climate Change Effects on Dissolved<br />
Oxygen Characteristics in Ice-covered<br />
Lakes. Ecological Modelling 103 (2-3):<br />
209-29.<br />
Foster, S., and D. P. Loucks, eds. 2006.<br />
Non-Renewable Groundwater Resources:<br />
A Guidebook on Socially-Sustainable Management<br />
for Water-Policy Makers. Paris:<br />
United Nations Educational, Scientific,<br />
and Cultural Organization.<br />
Fox, P., ed. 2007. Management of Aquifer<br />
Recharge for Sustainability. Phoenix, AZ:<br />
Acacia Publications.<br />
Gale, I., ed. 2005. Strategies for Managed<br />
Aquifer Recharge (MAR) in Semi-Arid Areas.<br />
Paris: United Nations Educational, Scientific,<br />
and Cultural Organization.<br />
Giordano, M., and K. Villholth, eds. 2007.<br />
The Agricultural Groundwater Revolution:<br />
Opportunities and Threats to Development.<br />
Comprehensive Assessments of<br />
Water Management in Agriculture No 3.<br />
Colombo: International Water Management<br />
Institute and CABI.<br />
Guaraní Aquifer System Project. 2003.<br />
Preliminary Map of the Guaraní Aquifer<br />
System. General Secretariat, Guaraní<br />
Aquifer System Project, Monte video.<br />
www.sg-guarani.org/index/site/<br />
sistema_acuifero/sa001.php.<br />
Hillbricht-Ilkowska, A. 1993. Lake Ecosystems<br />
and Climate Changes. Kosmos 42<br />
(1): 107-21.<br />
Hisdal, H., K. Stahl, L. M. Tallaksen, and<br />
S. Demuth. 2001. Have Streamflow<br />
Droughts in Europe Become More Severe<br />
or Frequent? International Journal of<br />
Climatology 21 (1): 317-33.<br />
Hostetler, S. W., and E. E. Small. 1999.<br />
Response of North American Freshwater<br />
Lakes to Simulated Future Climates.<br />
Journal of the American Water Resource<br />
Association 35 (6): 1625-38.<br />
Hu C., Liu C., Zhou Z., and R. Jayakumar.<br />
2008. Changes in Water and Sediment<br />
Loads of Rivers in China. Working Paper<br />
prepared as a contribution to UNESCO’s<br />
World Water Development Report 3, International<br />
Research and Training Center on<br />
Erosion and Sedimentation, Beijing.<br />
Hu R. L., Yue Z. Q., Wang L. C., and Wang<br />
S. J. 2004. Review on Current Status and<br />
Challenging Issues of Land Subsidence<br />
in China. Engineering Geology 76 (1-2):<br />
65-77.<br />
Huntington, T. G. 2006. Evidence for<br />
Intensification of the Global Water Cycle:<br />
Review and Synthesis. Journal of Hydrology<br />
319 (1-4): 83-95.<br />
International Crisis Group. 2007. Nigeria:<br />
Ending Unrest in the Niger Delta. Africa<br />
Report 135, International Crisis Group,<br />
Brussels.<br />
IPCC (Intergovernmental Panel on Climate<br />
Change). 2001. Climate Change<br />
2001: Impacts, Adaptation and Vulnerability<br />
Contribution of the Working Group II to<br />
the Third Assessment Report of the Intergovernmental<br />
Panel on Climate Change,<br />
eds. J. J. McCarthy, O. F. Canziani, N.<br />
A. Leary, D. J. Dokken, and K. S. White.<br />
Cambridge, UK: Cambridge University<br />
Press.<br />
———. 2007. Climate Change 2007: The<br />
Physical Science Basis. Summary for<br />
Policymakers. Contribution of the Working<br />
Group I to the Fourth Assessment Report<br />
of the Intergovernmental Panel on Climate<br />
Change. Cambridge, UK: Cambridge<br />
University Press.<br />
IPL (International Programme on Landslides).<br />
n.d. IPL Leaflet. International<br />
Consortorium on Landslides, Kyoto<br />
University, Disaster Prevention Research<br />
Institute, Uji, Kyoto, Japan. http://iclhq.<br />
org/IPL-Leaflet-2004.pdf.<br />
Kundzewicz, Z. W., D. Graczyk, T. Maurer,<br />
I. Pińskwar, M. Radziejewski, C.<br />
Svensson, and M. Szwed. 2005. Trend<br />
Detection in River Flow Series: 1. Annual<br />
Maximum Flow. Hydrological Sciences<br />
Journal 50 (5): 797-810.<br />
Lal, R., M. Griffin, J. Apt, L. Lave, and M.<br />
N. Granger. 2004. Managing Soil Carbon.<br />
Science 304 (5669): 393.<br />
Meyer, J. L., M. J. Sale, P. J. Mulholland,<br />
and N. L. Poff. 1999. Impacts of Climate<br />
Change on Aquatic Ecosystem Functioning<br />
and Health. Journal of the American<br />
Water Resources Association 35 (6):<br />
1373-86.<br />
Milly, P. C. D., R. T. Wetherald, K. A.<br />
Dunne, and T. L. Delworth. 2002. Increasing<br />
Risk of Great Floods in a Changing<br />
Climate. Nature 415 (6871): 514-17.<br />
Mimikou, M. A., E. Malta, E. Varanou, and<br />
K. Pantazis. 2000. Regional Impacts<br />
of Climate Change on Water Resources<br />
Quantity and Quality Indicators. Journal<br />
of Hydrology 234 (1-2): 95-109.<br />
Montgomery, D. R. 2007. Soil Erosion and<br />
Agricultural Sustainability. Proceedings<br />
of the National Academy of Sciences 104<br />
(33): 13268-72.<br />
Neilson, R. P., and D. Marks. 1994. A<br />
Global Perspective of Regional Vegetation<br />
and Hydrologic Sensitivities from<br />
Climatic Change. Journal of Vegetation<br />
Science 5 (5): 715-30.<br />
Neilson, R. P., I. C. Prentice, B. Smith,<br />
T. G. F. Kittel, and D. Viner. 1998. Simulated<br />
Changes in Vegetation Distribution<br />
under Global Warming. In The Regional<br />
Impacts of Climate Change: An Assessment<br />
of Vulnerability, eds., R. T. Watson, M. C.<br />
Zinyowera, R. H. Moss, and D. J. Dokken.<br />
Cambridge, UK: Cambridge University<br />
Press.<br />
224 World Water Development Report 3
evolving hazards – and emerging opportunities<br />
3 PART<br />
Poland, J. F., ed. 1984. Guidebook to Studies<br />
of Land Subsidence Due to Ground-<br />
Water Withdrawal. Paris: United Nations<br />
Educational, Scientific, and Cultural<br />
Organization.<br />
Romm, J. 2007. Hell and High Water: Global<br />
Warming – the Solution and the Politics<br />
– and What We Should Do. New York:<br />
William Morrow.<br />
Schindler, D. W., and M. P. Stainton. 1996.<br />
The Effects of Climatic Warming on the<br />
Properties of Boreal Lakes and Streams at<br />
the Experimental Lakes Area, Northwestern<br />
Ontario. Limnology and Oceanography<br />
41 (5): 1004-17.<br />
Scholze, M., W. Knorr, N. W. Arnell, and<br />
I. C. Prentice. 2006. A Climate-Change<br />
Risk Analysis for World Ecosystems.<br />
Proceedings of the National Academy of<br />
Science 103: 13116-120.<br />
Tallaksen, L. M., S. Demuth, and H. A.<br />
J. van Lanen. 2007. Low Flow and<br />
Drought Studies – the Northern European<br />
(NE) FRIEND Experience (keynote<br />
paper). In Climatic and Anthropogenic<br />
Impacts on the Variability of Water Resources<br />
International Seminar, 22-24<br />
November 2005. Montpellier, France,<br />
ed. G. Mahé. Paris: United Nations<br />
Educational, Scientific, and Cultural<br />
Organization, International Hydrological<br />
Programme.<br />
UNECE (United Nations Economic Commission<br />
for Europe). 2007. Our Waters:<br />
Joining Hands across Borders. First Assessment<br />
of Transboundary Rivers, Lakes and<br />
Groundwaters. Geneva and New York:<br />
United Nations. www.unece.org/env/<br />
water/publications/ assessment/assessmentweb_full.pdf.<br />
UNESCO (United Nations Educational,<br />
Scientific, and Cultural Organization).<br />
2005. Recharge Systems for Protecting<br />
and Enhancing Groundwater Resources.<br />
Proceedings of the Fifth International<br />
Symposium on Management of Aquifer<br />
Recharge, Berlin, Germany, 11-16 June<br />
2005. Paris: United Nations Educational,<br />
Scientific, and Cultural Organization.<br />
UNESCO (United Nations Educational, Social,<br />
and Cultural Organization)/OAS<br />
(Organization of American States)<br />
ISARM (International Shared Aquifer<br />
Resource Management). 2007. Transboundary<br />
Aquifers of the Americas. Final<br />
Report of 4th Coordination Workshop,<br />
20-22 November 2006, San Salvador.<br />
United Nations Educational, Social, and<br />
Cultural Organization/Organization of<br />
American States, International Shared<br />
Aquifer Resource Management Americas<br />
Program, Washington, DC.<br />
Uri, N. D., and J. A. Lewis. 1999. Agriculture<br />
and the Dynamics of Soil Erosion in<br />
the United States. Journal of Sustainable<br />
Agriculture 14 (2-3): 63-82.<br />
van der Gun, J. A. M. Forthcoming.<br />
Climate Change and Alluvial Aquifers in<br />
Arid Regions – Examples from Yemen. In<br />
Climate Change Adaptation in the Water<br />
Sector. London: Earthscan.<br />
van Lanen, H. A. J., L. M. Tallaksen, and<br />
G. Rees. 2007. Droughts and Climate<br />
Change. In Commission Staff Working<br />
Document Impact Assessment: Accompanying<br />
Document to Communication<br />
Addressing the Challenge of Water Scarcity<br />
and Droughts in the European Union.<br />
Brussels: Commission of the European<br />
Communities.<br />
Vörösmarty, C. J., M. Meybeck, B.<br />
Fekete, K. Sharma, P. Green, and<br />
J. P. M. Syvitski. 2003. Anthropogenic<br />
Sediment Retention: Major Global<br />
Impact from Registered River Impoundments.<br />
Global and Planetary Change 39<br />
(1-2): 169-90.<br />
Walling, D. E. 2006. Human Impact on<br />
Land-Ocean Sediment Transfer by the<br />
World’s Rivers. Geomorphology 79 (3-4):<br />
192-216.<br />
Walling, D. E., and D. Fang. 2003. Recent<br />
Trends in the Suspended Sediment Loads<br />
of the World’s Rivers. Global and Planetary<br />
Change 39 (1): 111-26.<br />
Wang P. 2007. The Dragon Head’s Story:<br />
Water/Land Conflict in Shanghai. Geophysical<br />
Research Abstracts 9: 11655.<br />
Wilkinson, B. H., and B. J. McElroy. 2007.<br />
The Impact of Humans on Continental<br />
Erosion and Sedimentation. Geological<br />
Society of America Bulletin 119 (1-2):<br />
140-56.<br />
Williams, John W., Stephen T. Jackson,<br />
and John E. Kutzbach. 2007. Projected<br />
Distributions of Novel and Disappearing<br />
Climates by 2100 AD. Proceedings<br />
of the National Academy of Sciences of<br />
the United States of America 104 (14):<br />
5738-42.<br />
World Bank. 2005. A Safer Lake Sarez.<br />
World Bank, Washington, DC. http://<br />
go.worldbank.org/NL<strong>IN</strong>TLWL00.<br />
———. 2007. Actual Crop Water Use in<br />
Project Countries: A Synthesis at the<br />
Regional Level. Policy Research Working<br />
Paper 4288, Sustainable Rural and<br />
Urban Development Team, World Bank,<br />
Washington, DC.<br />
Zhang X., F. W. Zwiers, G. C. Hegerl, F. H.<br />
Lambert, N. P. Gillett, S. Solomon, P.<br />
A. Stott, and T. Nozawa. 2007. Detection<br />
of Human Influence on Twentieth-<br />
Century Precipitation Trends. Nature<br />
448: 461-65.<br />
Water in a changing world 225
PART<br />
3<br />
Chapter 13<br />
Bridging the<br />
observational gap<br />
Author: Wolfgang Grabs<br />
Coordinator: Andras Szöllösi-Nagy (UNESCO)<br />
Associate coordinator: Wolfgang Grabs (WMO)<br />
Facilitator: Denis Hughes<br />
Key messages<br />
Worldwide, water observation networks provide incomplete and<br />
incompatible data on water quantity and quality for managing<br />
water resources and predicting future needs – and these networks<br />
are in jeopardy of further decline. Also, no comprehensive information<br />
exists on wastewater generation and treatment and receiving<br />
water quality on a regional or global scale.<br />
There is little sharing of hydrologic data, due largely to limited physical<br />
access to data, policy and security issues; lack of agreed protocols<br />
for sharing; and commercial considerations. This hampers regional<br />
and global projects that have to build on shared datasets for scientific<br />
and applications-oriented purposes, such as seasonal regional hydrologic<br />
outlooks, forecasting, disaster warning and prevention, and<br />
integrated water resources management in transboundary basins.<br />
Improving water resources management requires investments in<br />
monitoring and more efficient use of existing data, including traditional<br />
ground-based observations and newer satellite-based data<br />
products. Most countries, developed and developing, need to give<br />
greater attention and more resources to monitoring, observations<br />
and continual assessments of the status of water resources.<br />
There is little doubt that global hydrologic<br />
data are inadequate in both spatial coverage<br />
and frequency of observations. Moreover,<br />
hydrologic observation networks are<br />
worsening in many countries because of<br />
changing national investment priorities<br />
and declining human capacity. 1<br />
Beyond physical inadequacy, there is widespread<br />
reluctance to share hydrologic data,<br />
largely because of inadequate national administrative<br />
procedures and mechanisms,<br />
issues related to commercial use of hydrologic<br />
data and information, and security<br />
concerns and political sensitivities about<br />
transboundary resources. Sharing is also<br />
hampered by inadequate telecommunications<br />
systems. But the main reason for the<br />
decline of networks is insufficient awareness<br />
of the global value of hydrologic data.<br />
The importance of hydrologic<br />
observations<br />
Sound water resources management should<br />
be based on a quantitative understanding<br />
of the state of the resource. Because the<br />
components of the water cycle vary over<br />
time, long time series of observational data<br />
are essential. Lack of such data compromises<br />
the validity of information used for assessments<br />
and subsequent decision-making.<br />
When sufficient observational data are<br />
lacking, models can be used to generate<br />
information for decision-making, provided<br />
they have a baseline from which to<br />
be calibrated. But synthetically generated<br />
data cannot substitute for real-world observations.<br />
To keep networks affordable and<br />
sustainable, a minimum-density network<br />
226 World Water Development Report 3
Bridging the observational gap<br />
PART<br />
3<br />
can effectively coexist with model-derived<br />
data and information. Established analytical<br />
procedures can offer insight into<br />
observational and model uncertainties and<br />
provide a basis for thoroughly analysing<br />
permissible reduction of information as a<br />
result of minimizing networks.<br />
Data are also crucial to improving understanding<br />
of the hydrologic cycle for<br />
weather- and climate-related science<br />
and for water resources management<br />
through better assessment methods and<br />
improved forecasting services that can<br />
reduce disaster damages. One justification<br />
for improving hydrologic networks is<br />
to minimize uncertainties in hydrologic<br />
forecasting and prediction and therefore<br />
to minimize decision-making risk. This<br />
can be achieved in several ways, including<br />
new and better-quality information from<br />
improved measurements (quantity, quality,<br />
timeliness) and measurement techniques,<br />
improved model structures based on better<br />
understanding of physical processes, and<br />
better mathematical representation and<br />
use of available information during model<br />
identification and calibration.<br />
Aside from technical considerations, uncertainty<br />
in hydrologic data can be attributed<br />
to the general inadequacy of observations<br />
in spatial and temporal coverage.<br />
‘Uncertainty’ in this context relates to the<br />
adequacy and quality of technical observations<br />
for forecasting and assessment – not<br />
to the aberrations in technical observations.<br />
Uncertainty for assessment and<br />
forecasting varies, but is generally high in<br />
subtropical and tropical regions as well as<br />
polar and mountainous regions. Developing<br />
countries, especially the least developed<br />
countries, generally have inadequate<br />
networks associated with a high uncertainty<br />
of hydrologic observations.<br />
There is a critical need for more availability<br />
and access to global hydrologic data,<br />
information and products for climate and<br />
hydrologic research and applications –<br />
including the validation and refinement of<br />
global circulation models and the quantification<br />
of the water balance and its variation<br />
over large basins and regions up to<br />
the global level. Important scientific issues<br />
include the quantification of a postulated<br />
accelerated hydrologic cycle as a result of<br />
global warming and the contribution of<br />
continental runoff to sea level change. In<br />
a general sense global hydrologic observations<br />
help quantify key environmental<br />
and human-induced changes and interactions,<br />
identify significant trends, assess<br />
variability of freshwater resources and<br />
develop adequate response strategies.<br />
While characterizing all components of<br />
the water cycle (including water quantity<br />
and quality, groundwater and surface<br />
water) is important, measuring everything<br />
is impractical. The components of surface<br />
water measured most frequently are<br />
precipitation, streamflow, evaporation and<br />
water in storage (reservoirs and natural<br />
lakes). Other components (soil moisture,<br />
for example) are generally quantified using<br />
models that rely on the other measurements.<br />
The components of groundwater<br />
measured most frequently are inputs (recharge<br />
and inflow), aquifer storage capacity<br />
and natural outflows. While effective<br />
management of groundwater resources<br />
depends on measuring these components,<br />
none can be measured directly as a single<br />
value because they all depend on a large<br />
number of variables.<br />
Water quality observation networks are<br />
sparse and frequently use spot rather than<br />
continuous observations. The numerous<br />
water quality variables that determine how<br />
water can be used and the treatment technologies<br />
required for safe use make it very<br />
difficult to design effective and affordable<br />
monitoring systems and to identify<br />
relationships between water quantity and<br />
quality variations. Such information can<br />
be extrapolated to sites that have no observations.<br />
The problem is exacerbated when<br />
natural water quality is modified by both<br />
point and diffuse anthropogenic pollution<br />
sources. And deteriorating water quality<br />
greatly affects the potential use of water,<br />
increasing the need for networks of water<br />
quality observations.<br />
It is recognized worldwide that management<br />
of water resources should be environmentally<br />
sustainable and that adequate<br />
protection of aquatic ecosystems is extremely<br />
important. Aquatic ecosystems are<br />
sensitive to changes in water quantity and<br />
quality, but the precise manner in which<br />
they react to changes in abiotic drivers<br />
is poorly understood. Better understanding<br />
is vital for allocating water and can<br />
be achieved only by monitoring abiotic<br />
drivers (flow and water quality) and biotic<br />
responses (biomonitoring of biological<br />
conditions; see chapter 8). 2<br />
Recent developments in<br />
observation methods, networks<br />
and monitoring<br />
The adequacy of any hydrologic observation<br />
network is related to the accuracy of<br />
Data are crucial<br />
to improving<br />
understanding<br />
of the hydrologic<br />
cycle for weatherand<br />
climate-related<br />
science and for<br />
water resources<br />
management<br />
Water in a changing world 227
PART<br />
3<br />
Chapter 13<br />
The adequacy<br />
of observational<br />
networks varies<br />
widely by region,<br />
but observations<br />
for many water<br />
cycle variables<br />
have inadequate<br />
spatial and<br />
temporal coverage<br />
measurement systems, the density and<br />
representativeness of the network, and<br />
monitoring, data retrieval, storage and dissemination<br />
practices.<br />
Observational errors are generally minimal<br />
when instruments are used in environments<br />
and under conditions for which<br />
they were designed. But instruments must<br />
be well maintained and calibrated, and<br />
rigid quality management procedures must<br />
be observed from the field to the release of<br />
the primary data. Further reducing instrument<br />
errors is less critical than expanding<br />
operational networks to decrease observation<br />
uncertainties. Error bandwidths<br />
have not been significantly reduced, due<br />
mainly to inadequate network densities,<br />
poor quality and control over hydrologic<br />
observations and insufficient hydrologic<br />
data and information. 3<br />
The adequacy of observational networks<br />
varies widely by region, but observations for<br />
many water cycle variables have inadequate<br />
spatial and temporal coverage. 4 Continuously<br />
and consistently quantifying hydrologic<br />
variables at the global, regional and basin<br />
levels will require integrated observation<br />
systems that use both terrestrial and satellite<br />
observations. These systems will need data<br />
assimilation products, including models<br />
calibrated from the integrated networks and<br />
multiplatform observations.<br />
Most of today’s data for terrestrial observations<br />
and for many satellite observations<br />
are funded through national agencies,<br />
although satellite observations are increasingly<br />
carried out in the framework<br />
of multinational agreements. It would be<br />
worthwhile to investigate whether selected<br />
terrestrial observations could also be carried<br />
out under multinational agreements.<br />
Given the resource inputs from national<br />
agencies, product development and other<br />
derived services need to be responsive to<br />
national requirements to encourage continued<br />
national participation and funding.<br />
A close feedback loop needs to be established<br />
between national data providers<br />
and the users of global observation<br />
systems. For developing countries this<br />
requires more participation in global<br />
projects. Most information generated from<br />
global observation networks is used by<br />
developed countries, and much less is used<br />
by developing countries. Sharing information<br />
across regions, however, becomes<br />
increasingly valuable – especially for<br />
smaller countries, which can complement<br />
their spatially or technologically restricted<br />
national observation networks, and for<br />
hydrometeorological variables and hydrologic<br />
data and information from shared<br />
river basins used for forecasting.<br />
For network development and the design<br />
of multiplatform hydrologic observation<br />
systems, the heterogeneity of research<br />
fields makes it difficult to decide what variables<br />
should be collected and over what<br />
time and space. Network requirements<br />
also vary depending on the requirements<br />
of the research and application communities.<br />
A flexible network architecture with<br />
networks as subsets of larger composite<br />
networks or observation systems is thus<br />
desirable. Minimum operational baseline<br />
networks of routine observations (groundand<br />
satellite-based) need to be augmented<br />
by research networks on a long-term basis.<br />
Growing demand for precise assessments,<br />
forecasting and warnings requires quality<br />
management frameworks for all observation<br />
systems. The value of data depends<br />
on the accuracy and comparability of<br />
observations from different entities and<br />
instruments (including analytical laboratory<br />
procedures). Although regulatory data<br />
quality frameworks exist at the national<br />
and international levels, their implementation<br />
and adherence vary widely and are insufficiently<br />
documented from the country<br />
level to higher levels. Lack of adherence is<br />
frequently related to insufficient technical<br />
training of staff involved in measuring and<br />
managing data observations. The results<br />
are inadequately and irregularly calibrated<br />
instruments, few intercomparisons of different<br />
observation methods and analytical<br />
procedures, poor data quality control<br />
measures for consistency and homogeneity<br />
(the identification of systematic trends due<br />
to environmental or instrumental changes)<br />
and a lack of interaction and experience<br />
sharing among institutions.<br />
Objective assessment of data quality is rare<br />
but nonetheless indispensable for reliably<br />
using data in decision-making. For various<br />
reasons, including poor quality and security<br />
considerations, several data providers are<br />
hesitant to share data. In developing countries<br />
the attitude exists that collecting some<br />
data (of questionable reliability) is better<br />
than collecting no data at all. But confidence<br />
in good-quality data can be an incentive<br />
to share the data with other countries,<br />
development programmes and partners.<br />
Changing status of operational<br />
data over the recent past<br />
This section examines the status of operational<br />
data from terrestrial hydrologic<br />
228 World Water Development Report 3
networks, multiple uses of national hydrologic<br />
observing systems, integration<br />
of multisource observations, the sharing<br />
of observations, observations and data on<br />
water use, and hydrologic observations<br />
from space.<br />
State of terrestrial hydrologic<br />
networks<br />
For terrestrial hydrologic observation systems,<br />
especially in many developing countries,<br />
data collection is inadequate and<br />
deteriorating. Many systems lack adequate<br />
quality assurance and control standards<br />
for calibrating instruments and reducing<br />
data. And basic capacity to access, interpret<br />
and apply water cycle information<br />
from both terrestrial and satellite observation<br />
systems is often insufficient. 5<br />
Many terrestrial hydrologic networks are<br />
shrinking for several reasons:<br />
• Available records fulfil present hydrologic<br />
information requirements.<br />
• No direct economically justifiable use<br />
of hydrologic information is apparent<br />
(for example, in pristine basins or stations<br />
close to the mouths of rivers and<br />
delta areas).<br />
• Logistical problems.<br />
• Budgetary or resource problems.<br />
While the overall number of streamflow<br />
stations did not change significantly, stations<br />
with a long-term record were most<br />
affected by closures. The US Geological<br />
Survey reports that from 1980 to 2004,<br />
2,051 stream gauges with 30 or more<br />
years of streamflow data were discontinued,<br />
leaving 7,360 at the end of 2005. 6<br />
An important source of global hydrologic<br />
memory is being lost at a time when such<br />
information is needed to characterize the<br />
impacts of climate variability and change<br />
on hydrology and water resources. Another<br />
example is Kyrgyzstan in the Aral<br />
Sea basin, one of the best documented<br />
environmental disaster cases, where the<br />
number of hydrologic stations declined<br />
48% during 1985-2005. 7<br />
The technical challenges behind the<br />
current situation of hydrologic data in<br />
Africa can be traced to the low quality<br />
and quantity of basic equipment, poor<br />
technology, few laboratories for recalibrating<br />
equipment, inadequately trained<br />
human resources at both professional<br />
and technician levels and insufficient<br />
funding and capital to sustain current<br />
Bridging the observational gap<br />
operations or access new technologies. 8<br />
Many challenges in accessing datasets in<br />
Africa arise from the reluctance of countries<br />
to exchange data freely. One reason:<br />
many countries do not feel sufficiently<br />
involved in regional or global studies and<br />
believe that their data services are not<br />
appreciated. Other factors are the absence<br />
of protocols and conventions for sharing<br />
water in some shared or international<br />
basins and aquifers, limited feedback<br />
from researchers and studies that use<br />
African data and fear of losing ownership<br />
of data. 9<br />
Anecdotal evidence (because no globally<br />
representative studies are available) and<br />
reviews of funding in the water sector<br />
suggest that national agencies and donors<br />
are not prepared to invest in multipurpose<br />
hydrologic networks expanding to regional<br />
or global hydrologic networks. But<br />
ongoing projects include new gauging stations<br />
at a limited scale, though these stations<br />
often operate only for a limited time<br />
for specific projects (including scoping<br />
projects, such as for proposed irrigation<br />
schemes) and rarely have historic records.<br />
One major effort to stem the decline of<br />
hydrologic networks is the World Meteorological<br />
Organization’s World Hydrological<br />
Cycle Observation System. Implemented at<br />
the regional and transboundary river basin<br />
levels, the programme focuses on establishing<br />
and operating requirements-driven<br />
hydrologic information systems. 10<br />
There is no systematic monitoring of<br />
groundwater, which constitutes 21% of<br />
the world’s freshwater resources, at the regional<br />
or global level. 11 Few of the publicly<br />
accessible systems that contain relevant<br />
general information on water at the global<br />
level store data on groundwater quantity<br />
or quality. In many countries little attention<br />
is paid to the uniformity of hydrogeological<br />
data, precluding cross-comparisons.<br />
Few countries have up-to-date<br />
groundwater databases from which the<br />
current quality and quantity of groundwater<br />
resources can be elaborated. Without<br />
such systems information is obtained from<br />
model-derived data.<br />
Information availability differs across<br />
time and space, as do the methods used<br />
to process this information. To address<br />
this situation, the International Groundwater<br />
Resources Centre has established the<br />
Global Groundwater Monitoring Network,<br />
which uses available data and derived<br />
information to periodically assess global<br />
groundwater resources.<br />
PART<br />
3<br />
An important<br />
source of global<br />
hydrologic memory<br />
is being lost at<br />
a time when<br />
such information<br />
is needed to<br />
characterize<br />
the impacts of<br />
climate variability<br />
and change on<br />
hydrology and<br />
water resources<br />
Water in a changing world 229
PART<br />
3<br />
Chapter 13<br />
Major investments<br />
are needed to<br />
reverse the decline<br />
of hydrologic<br />
observation<br />
networks, including<br />
surface water<br />
and groundwater<br />
observations and<br />
water quality<br />
monitoring<br />
Surface observations reveal only indirect<br />
indicators of groundwater system status,<br />
such as changes in vegetation patterns,<br />
changes in river base flows, appearing or<br />
disappearing springs and wetlands, land<br />
subsidence and visible changes in the<br />
water levels of shallow, large-diameter<br />
wells. Subsurface observations are required<br />
to quantify groundwater storage through<br />
variations in groundwater levels, changing<br />
aquifer conditions and alterations in<br />
the chemical composition of groundwater.<br />
Groundwater levels and water sample<br />
collection are carried out using observation<br />
wells. Advanced data loggers such as<br />
pressure transducers and salinity sensors<br />
allow groundwater and salinity levels to<br />
be automatically measured at variable<br />
intervals. Geophysical methods (well logs<br />
and surface studies) help reveal changes<br />
in moisture content and salinity and<br />
trace some pollutants. There is promising<br />
evidence that gravimetric remote sensing<br />
methods allow aquifer monitoring on<br />
global to subregional levels, especially in<br />
sparsely gauged areas. 12<br />
The availability of usable freshwater is<br />
determined not only by the quantity<br />
of the resource but increasingly by its<br />
quality, which may further reduce the<br />
net availability of water resources for<br />
different uses and have critical environmental<br />
consequences. More than<br />
100 countries contribute to the Global<br />
Environment Monitoring System<br />
– Water, a programme with more than<br />
3,000 stations operated by Environment<br />
Canada under the auspices of the United<br />
Nations Environment Programme. The<br />
global database that it has built is key<br />
for global freshwater quality assessment.<br />
But a general lack of institutionalized,<br />
continuous dataflow into the database<br />
severely hampers further regional and<br />
global assessments as well as programmes<br />
to improve water quality, especially in<br />
transboundary basins. 13<br />
National data holdings are frequently<br />
fragmented, with no metadata catalogue<br />
in place that allows a complete picture of a<br />
country’s water quality situation. Notwithstanding<br />
some positive examples, monitoring<br />
networks in developing countries are<br />
rudimentary, irregularly updated, rarely<br />
objective driven and without sufficient<br />
quality control to make observations truly<br />
useful. It would be a formidable task not<br />
only to establish sustainable baseline and<br />
specialized water quality observation<br />
networks, but also to make them interoperable<br />
with surface water and groundwater<br />
quantity observations that enable<br />
calculating pollutant loads and biogeochemical<br />
fluxes, for example.<br />
Observational gaps result from failure to<br />
observe and collect data or from lack of<br />
access to data. Increasingly, the gaps are<br />
due to lost data and information as a result<br />
of disasters, social unrest and technological<br />
evolution. Data rescue programmes are<br />
thus crucial to retaining historical information<br />
and to expanding knowledge bases<br />
as far back as possible. This is especially<br />
important when considering that long<br />
records of observations are a prerequisite<br />
for detecting climate variability and changes<br />
in observations as well as for establishing<br />
the baseline hydrologic conditions that<br />
existed prior to development activities.<br />
Major investments are needed to reverse<br />
the decline of hydrologic observation<br />
networks, including surface water and<br />
groundwater observations and water quality<br />
monitoring. National investment can<br />
be mobilized with assistance from development<br />
partners, but doing so is very difficult<br />
when investments are sought for transboundary<br />
hydrologic observation systems<br />
or global data collection and monitoring<br />
systems. This is partly due to the fact that<br />
most development partners, including<br />
institutional donors, focus their technical<br />
assistance on bilateral needs rather than on<br />
regional or global observing systems.<br />
The general trends of in-situ observation<br />
methods include:<br />
• Increasing use of automatic logging<br />
systems and replacement of instruments<br />
with mechanical recording<br />
devices.<br />
• Widespread use of motionless observing<br />
methods, including measurement<br />
of hydrostatic pressure for gauge<br />
heights and observation methods<br />
without water contact, such as instruments<br />
using small radar devices<br />
suspended over the water surface to<br />
obtain gauge heights.<br />
• Coupling of in-situ stations with<br />
automatic data transmission and telecommunications<br />
systems, including<br />
mobile phone communication using<br />
Global System for Mobile/General<br />
Packet Radio Service standards.<br />
• Increasing integration of in-situ<br />
observation systems with basinwide<br />
hydrologic information systems,<br />
including forecasting and decisionsupport<br />
systems.<br />
230 World Water Development Report 3
Bridging the observational gap<br />
PART<br />
3<br />
Observation networks for different<br />
purposes<br />
National hydrologic observation networks<br />
often serve several purposes – such as<br />
providing information for water resources<br />
assessments and forecasting and serving<br />
as least influenced baseline hydrologic<br />
stations for climate studies. A clear delineation<br />
of national hydrologic observation<br />
systems for different uses is the exception<br />
rather than the rule. Specialized hydrologic<br />
networks are justified, especially when<br />
regular network observations do not provide<br />
the appropriate specific observations.<br />
One example is the need for extreme event<br />
data, which are generally less available<br />
than regular network observations.<br />
Justifying networks with higher observational<br />
density and higher reporting<br />
frequency needs to be based on multipleobjective<br />
requirements analysis to assess<br />
additional economic or scientific value<br />
gained. The rational use of national hydrologic<br />
networks would be enhanced by<br />
clearly delineating priority use of stations<br />
based on such criteria as quality of data,<br />
length of records, location of the station<br />
and reporting cycle. Classifying hydrologic<br />
networks this way would allow rapid<br />
identification of subnetworks for specialized<br />
purposes. Of particular interest would<br />
be hydrologic stations recording flows<br />
of water to and from national territories<br />
to support assessment of the resource at<br />
the national level. In addition, observational<br />
networks are sometimes established<br />
for specific purposes – in particular for<br />
environmental assessment studies. Most<br />
of these stations are operated for only a<br />
limited time, and their data deliveries are<br />
generally poorly documented. One recommendation<br />
is to document and preserve<br />
short-duration hydrologic observations to<br />
supplement regular national hydrologic<br />
networks.<br />
From data to information –<br />
integrating observations<br />
Hydrologic forecasting and assessment<br />
products increasingly use multisource<br />
observations and complex data assimilation<br />
algorithms to improve accuracy,<br />
reliability and timeliness. For example,<br />
flood forecasts can be based on observations<br />
of precipitation from conventional<br />
rain gauges, hydrologic radars and satellite<br />
precipitation estimates combined with<br />
current (real-time) measurements of soil<br />
moisture and other variables. Thus, aside<br />
from technical opportunities and challenges,<br />
integrating multiple observation<br />
systems that operate at different spatial<br />
and temporal scales requires systems to<br />
ensure internally consistent data products,<br />
keeping in mind that local, regional and<br />
global datasets are equally important because<br />
they serve different purposes.<br />
Sharing hydrologic observations<br />
Other than technical obstacles, sharing of<br />
hydrologic data can be hampered by limited<br />
physical access to data, national data<br />
policy and security issues, lack of agreed<br />
protocols for sharing and commercial considerations.<br />
Whether hydrologic data are a<br />
public good or commodity does not have a<br />
simple answer. One argument is that data<br />
do not have an intrinsic value and therefore<br />
are not commercial products. Societal,<br />
scientific and commercial value is added as<br />
a result of information and service delivery<br />
products (such as hydrologic forecasts<br />
or assessments) that have identifiable and<br />
quantifiable socioeconomic values. For<br />
example, flood disaster damages are often<br />
less when an effective forecasting service<br />
exists. The cost-benefit ratio for hydrologic<br />
data used for forecasting ranges from 1:10<br />
to 1:15. 14<br />
The basis for sharing data and information<br />
is defined requirements from national<br />
sectors, planning commissions, river basin<br />
organizations, hydrologic and climate research<br />
communities, and national and regional<br />
development partners. Commercial<br />
entities, including the public utility sector,<br />
are also increasing requirements for shared<br />
hydrologic data. A needs-based approach<br />
should form the basis of any data-sharing<br />
policy. Many data-sharing protocols and<br />
agreements already exist at the national,<br />
regional and global levels. Data-sharing<br />
agreements between riparian countries in<br />
transboundary basins where lower riparian<br />
countries have a disproportionally larger<br />
benefit from upstream observations could<br />
also require downstream users to contribute<br />
to the maintenance and operation of<br />
upstream stations in order to ensure longterm<br />
availability of hydrologic observations.<br />
Generally, scientific and technological<br />
advances and better management of<br />
water resources and hydrologic forecasting<br />
at all levels should not be hampered by<br />
restrictions in data-sharing arrangements.<br />
The United Nations Economic Commission<br />
for Europe Convention on the<br />
Protection and Use of Transboundary<br />
Watercourses and International Lakes<br />
requires its parties to exchange data on<br />
water quality and quantity and pollution<br />
sources as well as environmental conditions<br />
of transboundary waters. The first<br />
Assessment of Transboundary Rivers,<br />
Lakes and Groundwaters in the region,<br />
integrating<br />
multiple<br />
observation<br />
systems that<br />
operate at different<br />
spatial and<br />
temporal scales<br />
requires systems to<br />
ensure internally<br />
consistent data<br />
products, keeping<br />
in mind that local,<br />
regional and<br />
global datasets are<br />
equally important<br />
because they serve<br />
different purposes<br />
Water in a changing world 231
PART<br />
3<br />
Chapter 13<br />
the paucity of<br />
contributions to<br />
the Global Runoff<br />
Data Centre is<br />
often related<br />
not to lack of<br />
infrastructure<br />
but to general<br />
unwillingness to<br />
share data in an<br />
institutionalized,<br />
regular manner<br />
developed under the Water Convention in<br />
2007, describes the hydrologic regime of<br />
140 transboundary rivers, 30 transboundary<br />
lakes and 70 transboundary aquifers<br />
together with pressure factors in their<br />
basins, their status and transboundary<br />
impact, as well as trends and envisaged<br />
management measures. 15<br />
Observational gaps also arise when hydrologic<br />
observations are not shared. Regional<br />
differences in data provided to the Global<br />
Runoff Data Centre are apparent in both<br />
quantity and timeliness. Hydrologic data<br />
from North and Central America, the<br />
Caribbean, Europe and Mediterranean<br />
Asia are far greater than data from other<br />
regions (map 13.1). In other regions few<br />
hydrologic stations provide data to the<br />
centre, and update intervals are too great<br />
(figure 13.1). The paucity of contributions<br />
is often related not to lack of infrastructure<br />
but to general unwillingness to<br />
share data in an institutionalized, regular<br />
manner. This regional picture also suggests<br />
that most data are shared by a rather<br />
constant number of national hydrologic<br />
services, with few new services added over<br />
time. This hampers regional and global<br />
projects that have to build on such datasets<br />
for scientific and applications-oriented<br />
purposes. Examples include the calibration<br />
of models to provide seasonal regional<br />
hydrologic outlooks, forecasting, disaster<br />
warning and prevention, and water management<br />
in transboundary basins.<br />
Inadequate use of current information<br />
technologies severely threatens data and<br />
information sharing even when basic<br />
hydrologic observations are available.<br />
Typical inadequacies relate to incompatible<br />
information systems, which effectively<br />
block the seamless exchange of data and<br />
information between systems and different<br />
operators and programmes from the<br />
national to the global level. These inadequacies<br />
lead to an effective blackout of<br />
potentially valuable data and information<br />
because they are not part of the information<br />
management cycle. The situation is<br />
especially critical for forecasting purposes<br />
when data need to be shared in real or<br />
near real time.<br />
Observations and data related to<br />
water use<br />
Many models used to extrapolate from<br />
observations to areas with no observations<br />
available are designed to simulate natural<br />
conditions based on hydrometeorological<br />
inputs. For model outputs to reflect quantitative<br />
changes of water resources availability<br />
and use over space and time, model<br />
components that simulate anthropogenic<br />
development impacts (such as population<br />
trends, economic activities and land use<br />
changes) need to be integrated. Model<br />
calibration and validation likewise rely on<br />
information on water storage in lakes and<br />
reservoirs, water abstractions and return<br />
flows.<br />
Global data on water use exist primarily<br />
for the agricultural sector (for example,<br />
the AQUASTAT database by the Food and<br />
Agriculture Organization of the United<br />
Nations). Data on consumptive and nonconsumptive<br />
use of water resources are not<br />
a regular part of many national statistics,<br />
Map 13.1<br />
Distribution of Global Runoff Data Centre streamflow gauges<br />
Global Runoff<br />
Data Centre stations<br />
time series end<br />
1919-79<br />
1980-84<br />
1985-89<br />
1990-94<br />
1995-99<br />
2000-04<br />
2004-present<br />
Source: Global Runoff Data Centre (http://grdc.bafg.de/).<br />
232 World Water Development Report 3
Bridging the observational gap<br />
PART<br />
3<br />
Figure 13.1<br />
Data delivery rate from runoff gauging stations to the Global Runoff Data Centre<br />
(number of stations from which data have been received, 2001-07)<br />
Region 1, Africa (888 stations) Region 2, Asia (1,880 stations) Region 3, South America (585 stations)<br />
150<br />
125<br />
100<br />
75<br />
50<br />
25<br />
0<br />
2001 2002 2003 2004 2005 2006 2007<br />
1,200<br />
1,000<br />
800<br />
600<br />
400<br />
200<br />
0<br />
2001 2002 2003 2004 2005 2006 2007<br />
40<br />
30<br />
20<br />
10<br />
0<br />
2001 2002 2003 2004 2005 2006 2007<br />
Region 4, North and Central America and<br />
the Caribbean (2,320 stations)<br />
2,500<br />
2,000<br />
1,500<br />
1,000<br />
500<br />
0<br />
2001 2002 2003 2004 2005 2006 2007<br />
Region 5, The Pacific and Australia<br />
(434 stations)<br />
400<br />
300<br />
200<br />
100<br />
0<br />
2001 2002 2003 2004 2005 2006 2007<br />
Region 6, Europe & Mediterranean Asia<br />
(1,225 stations)<br />
500<br />
400<br />
300<br />
200<br />
100<br />
0<br />
2001 2002 2003 2004 2005 2006 2007<br />
Note: Regions are World Meteorological Organization classifications.<br />
Source: Global Runoff Data Centre (http://grdc.bafg.de/).<br />
although where abstractions are licensed,<br />
information on the maximum use of<br />
water may be available. This situation is<br />
unsatisfactory because it prevents effective<br />
management of water demand relative to<br />
availability and supply of freshwater.<br />
Despite the importance for the integrated<br />
management of water quantity and quality<br />
and for understanding water-related health<br />
hazards, no comprehensive information<br />
exists on the regional or global extent of<br />
wastewater generation and treatment and<br />
receiving water quality. Even at the national<br />
level such information is either inconsistently<br />
gathered or unavailable – partly<br />
because of ill-defined data collection<br />
responsibilities that rest with a multitude<br />
of national organizations and commercial<br />
entities that rarely share their information.<br />
Hydrologic observations from space<br />
Satellite observations are important means<br />
for providing hydrologic data with acceptable<br />
spatial and temporal resolution,<br />
especially in areas with no or limited<br />
infrastructure. However, ‘acceptable resolution’<br />
depends on what the data are to be<br />
used for. In-situ data provide acceptable<br />
coverage and temporal resolution mainly<br />
in more accessible regions. In-situ data are<br />
also used for calibrating and validating<br />
space-based information, hydrologic or<br />
water resources models and routine realtime<br />
forecasting services. For forecasting of<br />
runoff and water flows, data must be available<br />
within a fraction of an hour up to<br />
several hours, depending on the size of the<br />
basin and forecasting requirements. For<br />
assessment a temporal resolution of several<br />
weeks up to one month may suffice.<br />
High priority for additional observations<br />
should be focused on data-poor regions,<br />
poorly observed hydrologic variables,<br />
regions sensitive to change and variables<br />
with inadequate spatial resolution. The<br />
need for satellite-based observations that<br />
complement in-situ observations should<br />
be recognized. In-situ and space-based observations<br />
for hydrologic applications need<br />
to be integrated in a comparable space<br />
and time domain and under tight quality<br />
control. Such quality control would<br />
require increased efforts to assess observation<br />
quality through intercomparison<br />
and recalibration projects. This is especially<br />
important for achieving continuity<br />
between historical terrestrial observations<br />
and new satellite observations.<br />
Terrestrial water level observations can<br />
now be supplemented with sufficient accuracy<br />
by radar altimetry instruments flown<br />
on the Envisat, Jason and TOPEX satellites.<br />
Because the sensor carriers on these satellites<br />
are not geostationary, the altimetry<br />
observations are taken at virtual gauging<br />
Water in a changing world 233
PART<br />
3<br />
Chapter 13<br />
Merging data<br />
streams from<br />
both terrestrial<br />
and space-based<br />
observations will<br />
require new model<br />
structures that<br />
need to be tested<br />
for their utility<br />
in operational<br />
services<br />
stations along the path of the satellite at<br />
various stretches of a river with an approximately<br />
weekly repetition cycle. This allows<br />
for basinwide hydrologic assessments.<br />
Efforts are under way to derive discharge<br />
time series from altimetry observations<br />
through actual rating curves that use the<br />
river morphology and through virtual calibration<br />
curves that use idealized channel<br />
profiles in combination with hydraulic<br />
parameters. The use of altimetry observations<br />
is, however, restricted to large rivers,<br />
lakes and reservoirs and is not appropriate<br />
for smaller tributaries.<br />
Since 2002 gravimetric measurements<br />
using the Gravity Recovery and Climate<br />
Experiment (GRACE) satellite have provided<br />
the means to observe changes in<br />
large aquifers at a spatial scale over 40,000<br />
square kilometres. However, separating<br />
water masses (soil moisture, vegetation<br />
and groundwater) is still difficult. Inverse<br />
approaches are therefore needed to separate<br />
the hydrologic contributions of the<br />
main water reservoirs (oceans, atmosphere<br />
and total continental water storage including<br />
snow, soil wetness, groundwater and<br />
ice caps) from monthly synthetic GRACE<br />
geoïds. Nevertheless, at large scales gravimetric<br />
observations of changes in large<br />
aquifers from GRACE and next-generation<br />
missions like the Gravity Field and Steady-<br />
State Ocean Circulation Explorer (GOCE)<br />
satellite are nearing a stage where they<br />
could be used operationally.<br />
Apart from directly measuring hydrologic<br />
variables such as water levels, snow<br />
and ice cover extent, soil moisture and<br />
groundwater, satellites are invaluable for<br />
providing information for hydrologic<br />
estimation (modelling) studies. Satellite<br />
estimates of precipitation are an obvious<br />
example. Several precipitation estimation<br />
methods based on microwave and infrared<br />
instruments on numerous satellites<br />
and associated different data retrieval and<br />
interpretation algorithms have reached<br />
a semi-operational and, in a few cases,<br />
an operational level. 16 Some global or<br />
near-global precipitation products have<br />
spatial resolutions down to 4 kilometres<br />
and temporal resolutions down to threehourly,<br />
making them useful for water<br />
management and flood forecasting. Several<br />
hydrology-relevant products are associated<br />
with the Moderate Resolution Imaging<br />
Spectroradiometer instrument operating<br />
on both the Terra and Aqua spacecraft:<br />
inundation areas, surface changes of lakes<br />
and reservoirs, surface reflectance, temperature,<br />
land cover and indexes of vegetation<br />
change.<br />
Opportunities and challenges<br />
The combination of observations from<br />
GRACE, GOCE, satellite altimetry and<br />
other space systems such as active and<br />
passive microwaves, satellite radar interferometry<br />
and visible and radar imagery<br />
offer the potential for developing new<br />
hydrologic products, such as present-day<br />
satellite-derived precipitation products and<br />
the planned Global Precipitation Mission.<br />
Near-future developments are likely to<br />
include the operational generation of<br />
truly multiplatform information products<br />
from terrestrial observations merged with<br />
gravimetric observations from GRACE and<br />
GOCE, radar altimetry and precipitation<br />
estimates as inputs into hydrologic models<br />
for forecasting, water resources assessment<br />
and monitoring of the water balance of<br />
basins. Likewise, merged multiplatform<br />
information can be used to quantify<br />
spatial and temporal variations of flooded<br />
areas and water volumes. The improved<br />
cooperation between the national meteorological<br />
and hydrologic services of<br />
many countries with the aim to improve<br />
hydrologic forecasting is at the heart of<br />
the World Meteorological Organization<br />
Flood Forecasting Initiative, launched in<br />
2003. The availability of multiplatform,<br />
multivariate data streams in near real time<br />
and with high accuracy will be crucial to<br />
achieving this goal.<br />
Using the global concept of the World<br />
Hydrological Cycle Observing System,<br />
building on terrestrial hydrologic information<br />
systems and obtaining global hydrologic<br />
coverage from satellites to integrate<br />
terrestrial and satellite-based observations<br />
could close many gaps in hydrologic observations<br />
at all levels and support improved<br />
hydrologic and water resources assessments,<br />
forecasting and research. To make<br />
full use of satellite observations, a suite of<br />
intercomparison and validation projects is<br />
needed to assess the accuracy of satellitebased<br />
observations with terrestrial observations<br />
in a wide range of environmental<br />
conditions. Merging data streams from<br />
both terrestrial and space-based observations<br />
will require new model structures<br />
that need to be tested for their utility in<br />
operational services.<br />
Despite current technological and methodological<br />
developments, an important<br />
challenge remains. To mainstream<br />
satellite- based observations that complement<br />
terrestrial observations in operational<br />
water resources management and<br />
forecasting services on a routine basis and<br />
234 World Water Development Report 3
for critical assessments, awareness and<br />
capacity are needed in national meteorological<br />
and hydrologic agencies. Likewise,<br />
space organizations need to know the<br />
requirements for space-based observations<br />
in order to design and operate new and<br />
tailor-made missions and to create derived<br />
observational and model products for<br />
hydrology and water resources management.<br />
Space agencies will need to develop<br />
front-end tools that allow primary data to<br />
be converted into graphics and tables that<br />
can be used in models and forecasting routines.<br />
This will require an intensified dialogue<br />
among space agencies, the science<br />
community and hydrologic and meteorologic<br />
services to define interinstitutional<br />
cooperation and sharing of responsibilities<br />
on long-term archiving of satellite observations,<br />
access to data and information in<br />
support of science and research, and the<br />
development of products for operational<br />
applications.<br />
Some suggestions for bridging<br />
the observational gap<br />
Meta-information systems that promote<br />
information rescue and institutional<br />
sustainability of water information and<br />
knowledge are prerequisites for all levels<br />
of water management. Meta-information<br />
systems provide generic information<br />
about data, information, knowledge<br />
sources and data products that are applicable<br />
to operations and research. Online<br />
dedicated global information systemsbased<br />
applications can improve access<br />
to information. Through a geographic<br />
interface and standardized set of waterrelated<br />
attributes, information can be<br />
seen in spatial context that shows analogies<br />
and patterns. Such applications are<br />
indispensable for the global sharing of<br />
information and apply to all components<br />
of the water cycle.<br />
In addition to the key messages of this<br />
chapter, other important steps can be<br />
taken to improve the current situation of<br />
severe observational gaps in hydrologic<br />
observations include:<br />
• At the national, regional and global<br />
levels a minimum requirements analysis<br />
of long-term, multipurpose observational<br />
needs should be undertaken;<br />
a new requirement is climate-relevant<br />
Bridging the observational gap<br />
observations, including those from<br />
pristine basins.<br />
• Financing of hydrologic networks,<br />
including operation and maintenance,<br />
should be based on a multiple-source<br />
strategy rather than the prevailing<br />
single-source, sector-specific funding<br />
arrangements.<br />
• Integrated multiplatform network<br />
solutions that combine in-situ and<br />
space-based observations and that are<br />
affordable for developing countries<br />
should be promoted. This would enhance<br />
the observational base in spatial<br />
and temporal coverage.<br />
• Other hydrologic information – such<br />
as in-situ and remotely sensed soil<br />
moisture and meteorological data and<br />
information including precipitation,<br />
evaporation, humidity, temperature<br />
and wind fields – needs to be considered<br />
to complement hydrologic<br />
information and to enhance the information<br />
content of hydrologic data<br />
through integration in multivariate<br />
models and predictions.<br />
• In data-sparse regions in particular,<br />
modelling approaches need to be<br />
mainstreamed to generate modelderived<br />
observation time series. A<br />
promising tool is the reconstruction<br />
of hydroclimatic data by downscaling.<br />
Datasets from the National Centers<br />
for Environmental Prediction/<br />
National Center for Atmospheric<br />
Research for 1948-2007 are a widely<br />
used source.<br />
• As observational gaps are often directly<br />
related to deficiencies in data<br />
transmission and communication,<br />
this could be overcome to a large<br />
degree by connecting offline operating<br />
stations to modern telecommunication<br />
systems to increase spatial<br />
and temporal availability of data from<br />
already existing stations.<br />
• Making maximum use of existing<br />
hydrologic observations requires more<br />
effort to share hydrologic data and<br />
information on all levels, including<br />
transboundary river basins and shared<br />
aquifer systems.<br />
PART<br />
3<br />
Online dedicated<br />
global information<br />
systems-based<br />
applications are<br />
indispensable for<br />
the global sharing<br />
of information<br />
and apply to all<br />
components of<br />
the water cycle<br />
Water in a changing world 235
PART<br />
3<br />
Chapter 13<br />
Notes<br />
1.<br />
GCOS 2003b; US Geological Survey n.d.<br />
2. Personal communication with Richard<br />
Robarts, Global Environment Monitoring<br />
System–Water.<br />
3. Based on author’s discussions with<br />
instrument manufactures such as OTT<br />
and SEBA.<br />
4. GCOS 2003b.<br />
5. GCOS 2003b.<br />
6. US Geological Survey n.d.<br />
7. Grabs 2007a; and presentation by Kyrgyzstan<br />
Hydromet at an ARAL-HYCOS<br />
planning meeting, 6-7 December 2006,<br />
Almaty.<br />
8. GCOS 2003a.<br />
9. GCPS 2003a.<br />
10. World Hydrological Cycle Observing<br />
System (www.whycos.org).<br />
11. Based on data from the International<br />
Groundwater Resources Assessment<br />
Centre.<br />
12. Grabs 2007b.<br />
13. GEMS-Water 2008.<br />
14. WRI 2004.<br />
15. UNECE 2007.<br />
16. Grabs 2007b.<br />
References<br />
GCOS (Global Climate Observing System).<br />
2003a. Report of the GCOS/GTOS/<br />
HWRP Expert Meeting on Hydrological<br />
Data for Global Studies. WMO/TD-No.<br />
1156. Geneva: World Meteorological<br />
Organization.<br />
———. 2003b. The Second Report on the Adequacy<br />
of the Global Observing Systems for<br />
Climate in Support of the UNFCCC. WMO/<br />
TD No. 1143. Geneva: World Meteorological<br />
Organization.<br />
GEMS-Water (Global Environment Monitoring<br />
System–Water Programme).<br />
2008. Water Quality for Ecosystem and<br />
Human Health. 2nd ed. Nairobi: United<br />
Nations Environment Programme.<br />
Grabs, W. 2007a. The State of Hydrological<br />
Observation Networks: Technical and<br />
Operational Aspects. Overview of Global<br />
and Regional Programmes. Presentation<br />
for the Third International Conference<br />
on Water and Climate, 3-6 September,<br />
Helsinki.<br />
———. 2007b. Status of Hydrological In-<br />
Situ Networks and Future Developments<br />
Including Space-Based Observations.<br />
Presentation for the Second Space for<br />
Hydrology Workshop, 12-14 November,<br />
Geneva.<br />
UNECE (United Nations Economic<br />
Commission for Europe). 2007. Our<br />
Waters: Joining Hands across Borders.<br />
First Assessment of Transboundary Rivers,<br />
Lakes, and Groundwaters. Geneva and<br />
New York: United Nations. www.unece.<br />
org/env/water/publications/assessment/<br />
assessmentweb_full.pdf.<br />
US Geological Survey. n.d. Trends in the<br />
Size of the USGS Streamgaging Network.<br />
National Streamflow Information<br />
Program, Washington, DC. http://water.<br />
usgs.gov/nsip/streamgaging_note.html.<br />
WRI (World Resources Institute). 2004.<br />
World Resources 2002-2004: Decisions<br />
for the Earth: Balance, Voice, and Power.<br />
Washington, DC: World Resources<br />
Institute.<br />
236 World Water Development Report 3
Responses and choices<br />
Bridging the observational gap<br />
PART<br />
4<br />
Chapter 14<br />
Coordinator<br />
Håkan Tropp<br />
(UNDP)<br />
Facilitator<br />
George de Gooijer<br />
Chapter<br />
14 Options inside the water box<br />
15 Options from beyond the water box<br />
16 The way forward<br />
Chapters 15-16<br />
Coordinator<br />
Olcay Ünver<br />
(WWAP)<br />
Facilitator<br />
William Cosgrove
PART<br />
4<br />
Authors: George de Gooijer and Håkan Tropp<br />
The Report describes the costs of not<br />
investing in water resources development<br />
and management – the economic<br />
losses and the human suffering and<br />
underdevelopment. It also demonstrates<br />
the high rates of return generated by<br />
such investments.<br />
Part 4 is about response options and<br />
how to choose among them. What options<br />
are available to decision-makers<br />
to respond to the challenges identified<br />
in the previous chapters? How can they<br />
select among these options? And what<br />
are some of the trade-offs in choosing<br />
certain options? What can transform<br />
competition into synergy?<br />
We have many of the answers. Across<br />
the planet we have already shown that<br />
it can be done! But there is no onesize-fits-all<br />
solution. The best mix of<br />
responses to a country’s development<br />
objectives and policy priorities to meet<br />
its water challenges depends on the<br />
availability of water in space and in<br />
time and the country’s technical, financial,<br />
institutional and human capacities<br />
– its culture, political and regulatory<br />
frameworks, and markets.<br />
Responses outside the water domain<br />
strongly affect the macro changes that<br />
influence how water is used and allocated.<br />
They also make water adaptation<br />
measures more (or less) effective and<br />
less (or more) costly. The Report shows<br />
that decisions taken by external actors<br />
may have more impact on the state,<br />
use and management of water resources<br />
than decisions taken by managers<br />
within the water sector itself.<br />
The demand for and the provision of<br />
food and energy, the uneven ability to<br />
invest and a changing climate exert<br />
strong pressures on water. However,<br />
the most important decisions affecting<br />
water are often made without water<br />
as the primary concern, even though<br />
water may play an important role in<br />
addressing the issue. Policy decisions<br />
on health, food security and energy<br />
security, for example, can intensify or<br />
alleviate much of the pressure on water<br />
resources, affecting both supply and<br />
demand.<br />
Key drivers of water use changes – as<br />
seen in previous chapters – include demographics,<br />
economic development and<br />
trade, consumption and climate. These<br />
drivers have powerful implications for<br />
the options available inside and outside<br />
the water domain and for how to mobilize<br />
decision-makers and other important<br />
actors.<br />
Water resources are strongly affected<br />
by climate change and variability. The<br />
responses to the challenges posed by
PART<br />
4<br />
climate change, through best practices<br />
and low-regret measures, are also<br />
specific to each country, especially for<br />
vulnerable hot spots such as low-lying<br />
islands, deltas, mountain areas and arid<br />
regions, where action is not only cost effective<br />
in the long term but also urgent.<br />
Options within the water domain are<br />
distinct from those outside it. Leaders<br />
in the water domain can inform<br />
the processes outside their domain<br />
and implement decisions for the water<br />
domain; but it is the leaders in government,<br />
the private sector and civil society<br />
who determine the directions that will<br />
be taken.<br />
Many countries face multiple challenges<br />
but have limited financial and<br />
natural resources and implementation<br />
capacities. Countries need to fully use<br />
synergy opportunities and to make<br />
trade-offs and difficult decisions on<br />
how to allocate among uses and users<br />
to protect their water resources. Improved<br />
water management depends<br />
on several interrelated factors, including<br />
accurate knowledge of the waterrelated<br />
problems to be addressed, their<br />
root causes and the management options<br />
available to address them; political<br />
will; stakeholder participation and<br />
cultural acceptance; transparency in<br />
management and decision-making;<br />
effectiveness of institutional frameworks;<br />
and sustainable funding.<br />
An appropriate set of approaches and<br />
strategies must be assembled for each<br />
country and situation, based on the<br />
biophysical characteristics of a water<br />
system as well as local, national and<br />
sometimes international characteristics<br />
and capacities for achieving sustainability<br />
of water resources.<br />
The urgency to respond will be especially<br />
high for countries already facing<br />
severe water challenges and for countries<br />
that will face even more severe<br />
water challenges if current climate,<br />
demographic, socioeconomic and development<br />
trends continue.<br />
Responses outside the water domain<br />
are paramount in influencing the<br />
macro changes in how water is used<br />
and allocated and in making adaptation<br />
in the water domain more effective,<br />
better integrated and less costly. Population<br />
growth, urbanization and climate<br />
change are forcing the water domain to<br />
adapt. Broader policy change and political<br />
action are required to change fundamental<br />
allocations and uses of water.<br />
Global market conditions and trade<br />
regimes affect crop prices and choices<br />
and thus also have serious implications<br />
for agricultural water use and demand.
PART<br />
4<br />
Economic development can improve the<br />
water situation for many people, but it<br />
can also cause overexploitation of water<br />
and the environment.<br />
Traditionally within the water sector<br />
the first response to lack of water has<br />
been increasing supply. The second response<br />
became managing demand, enhancing<br />
efficiency and reducing losses.<br />
The third response is more drastic and<br />
requires decisions outside the water<br />
sector on reallocating resources, which<br />
can exclude some sectors from further<br />
supply. Effective water management<br />
combines all three responses and involves<br />
all sectors. To achieve results,<br />
many actors need to be involved. More<br />
often than not this requires convincing<br />
fellow decision-makers with well documented<br />
arguments. Water professionals<br />
who understand the social, economic<br />
and political conditions outside the<br />
water sector that directly and indirectly<br />
affect how water is being used<br />
and governed can better inform and<br />
participate in decision-making outside<br />
the water sector.<br />
Chapter 14 looks at possible responses<br />
within the water domain, and chapter<br />
15 looks at responses outside the water<br />
domain that affect how water is being<br />
used and allocated. The examples of<br />
response options are pragmatic and<br />
include responses by governments,<br />
private sector, civil society and consumers<br />
at various levels and scales. The<br />
options take into account geographic<br />
and hydroclimatic conditions, the level<br />
of economic development, water subsectors<br />
and the supply and demand side<br />
of the water resources equation within<br />
the broader socio economic framework.<br />
Chapter 16 discusses the need for accelerated<br />
investments and informed<br />
decision-making through partnerships.<br />
It also considers the consequences<br />
of increasing uncertainty and how<br />
to prepare for decisions under such<br />
conditions.
Chapter 14<br />
Options inside<br />
the water box<br />
PART<br />
4<br />
Authors: George de Gooijer, Walter Rast and Håkan Tropp<br />
Contributors: Virginie Aimard, Guy Allaerts, Maggie Black, Rutgerd Boelens, Stefano Burchi,<br />
Hein Engel, Joakim Harlin, Molly Hellmuth, Sarah Hendry, Andrew Hudson, Anders Jägerskog,<br />
Henrik Larsen, Patrick Moriarty, Eelco van Beek, Peter van der Zaag and James Winpenny<br />
Key messages<br />
Coordinator: Håkan Tropp (UNDP)<br />
Facilitator: George de Gooijer<br />
There are many practical examples of solutions within the water domain.<br />
Some options show particular promise:<br />
Supporting institutional development, to prepare institutions to deal<br />
with current and future challenges, through such reforms as decentralization,<br />
stakeholder participation and transparency, increased<br />
corporatization where feasible and fair, partnerships and coordination<br />
(public-private, public-public, public-civil society), and new<br />
administrative systems based on shared benefits of water, including<br />
when water crosses borders.<br />
Considering the influence of water law, both formal and customary,<br />
including regulations in other sectors that influence the management<br />
of water resources.<br />
Consulting with stakeholders and ensuring accountability in planning,<br />
implementation and management as well as building trust<br />
within the water and related sectors and fighting corruption and<br />
mismanagement.<br />
Strengthening organization structures and improving the operating<br />
efficiency of water supply utilities to improve service quality and increase<br />
the coverage and density of connections, while also boosting<br />
revenues and creating a more viable financial base to attract further<br />
investment.<br />
Developing appropriate solutions through innovation and research.<br />
Developing institutional and human capacity, both within the water<br />
domain and in areas or sectors outside the water domain. Capacity<br />
development can occur through traditional forms of education,<br />
on-the-job training, e-learning, public awareness raising, knowledge<br />
management and professional networks.<br />
Creating a favourable investment climate of sound management<br />
accountability and good governance within the water sector. This<br />
should include new approaches such as payment for environmental<br />
services.<br />
Programs and activities are under way<br />
around the world that directly address<br />
the assessment, allocation or conservation<br />
of water resources. Improving water<br />
governance includes more efficiently managing<br />
available water resources and current<br />
and anticipated water uses, and informing<br />
water users, stakeholders and decision-<br />
Water in a changing world 241
PART<br />
4<br />
Chapter 14<br />
Identifying and<br />
implementing<br />
effective<br />
governance<br />
responses to<br />
water-related<br />
problems remain<br />
an elusive goal<br />
makers about the consequences of actions<br />
taken (or not taken) to address such issues.<br />
This chapter focuses on what can be done<br />
within the domain of water managers to<br />
address water problems. Because other<br />
publications and reports already deal with<br />
the technical and engineering aspects of<br />
response options, 1 the main emphasis is<br />
on strengthening policy and laws, water<br />
resources management, technical capacity,<br />
finances and education and awareness.<br />
Undergirding solutions inside the water<br />
domain is good water governance, which<br />
influences the choices people make about<br />
the use (or misuse) of water resources.<br />
This focus includes such approaches as<br />
water supply and demand management, as<br />
well as processes to ensure the collection,<br />
analysis and use of the data necessary for<br />
making water allocation decisions within<br />
a policy framework that is flexible, comprehensive<br />
and realistic.<br />
Water governance reform:<br />
strengthening policy, planning<br />
and institutions<br />
In this Report water governance refers to<br />
the political, social, economic, legal and<br />
administrative systems that develop and<br />
manage water resources and water services<br />
delivery at different levels of society while<br />
recognizing the role played by environmental<br />
services. 2 It encompasses a range<br />
of water-related public policies and institutional<br />
frameworks and mobilization of the<br />
resources needed to support them. Governance<br />
issues overlap the technical, environmental<br />
and economic aspects of water resources<br />
and the political and administrative<br />
elements of solving water-related problems<br />
(see chapter 4). Identifying and implementing<br />
effective governance responses to waterrelated<br />
problems – taking into account the<br />
differing contexts in which they may be<br />
applied, their integration with other sectors<br />
and their impacts on water use equity, efficiency<br />
and environmental sustainability<br />
– thus remain an elusive goal.<br />
Although many governments have met<br />
increasing water demands primarily by<br />
augmenting water supplies, many also<br />
apply management and technological solutions<br />
to address water demands, including<br />
more efficient use and conservation. As<br />
pressures on water resources continue to<br />
rise, countries will also need to consider<br />
reallocating water resources from one<br />
sector to another, further politicizing<br />
water issues within countries and between<br />
them. Water reallocation and demand<br />
management options include administered<br />
solutions (such as allocating less water<br />
to agriculture) and economic incentives<br />
(providing price signals to decision-makers<br />
about the opportunity costs of water). Capital<br />
investments in infrastructure, sorely<br />
needed in many countries, also require<br />
investments in capacity and institutional<br />
development to realize and sustain the<br />
benefits of increased investments.<br />
The stages of water development and management<br />
range from situations in which<br />
virtually all water development possibilities<br />
have been exhausted (as the Fuyang<br />
basin in China, and in the Middle East<br />
and North Africa region) to situations in<br />
which water development potential still<br />
exists (such as the East Rapti River basin in<br />
Nepal and many sub-Saharan countries). 3<br />
Improved planning policies and laws are<br />
critical response options. Effective enforcement<br />
by government agencies and acceptability<br />
and compliance by providers, users<br />
and stakeholders are also important to the<br />
effectiveness of many water management<br />
reforms, as evaluation of the effectiveness<br />
of lake basin management interventions in<br />
many developing countries has shown. 4<br />
Integrated approaches to water<br />
planning and reform<br />
Both developed and developing countries<br />
are reforming their water resources planning<br />
policies and laws. European Union<br />
members, for example, are implementing<br />
the Water Framework Directive. Many<br />
middle- and low-income countries in<br />
Africa, Asia and Latin America are engaging<br />
in reform, focusing on principles of<br />
integrated water resources management.<br />
A recent United Nations report concluded<br />
that implementation of the practices, especially<br />
water use efficiency improvements,<br />
is lagging (box 14.1). 5<br />
Implementing integrated water resources<br />
management is proving more difficult<br />
than envisioned. The approach was meant<br />
to facilitate integrating water priorities and<br />
related environmental issues into national<br />
economic development activities, a goal<br />
often considered only after many development<br />
activities have already been undertaken<br />
(box 14.2). The Sixteenth Session of<br />
the Commission on Sustainable Development<br />
endorsed integrated water resources<br />
management as a framework and essential<br />
tool for effectively managing water resources.<br />
It recommended that its review on<br />
progress in the water and sanitation sector<br />
go beyond mere stocktaking of integrated<br />
water resources management efforts. 6<br />
242 World Water Development Report 3
options inside the water box<br />
PART<br />
4<br />
Box 14.1<br />
UN-Water survey on progress towards 2005 targets for integrated water resources<br />
management and water efficiency plans<br />
The growing stress on water resources<br />
presents managers with increasingly<br />
difficult decisions for managing water<br />
sustainability. Integrated water resources<br />
management assists such decision-making<br />
by drawing attention to efficient, equitable<br />
and environmentally sound approaches.<br />
At the World Summit on Sustainable<br />
Development in 2002 countries agreed<br />
on a global target to develop integrated<br />
water resources management and water<br />
efficiency plans by 2005, with support<br />
to developing countries throughout all<br />
levels.<br />
In 2007/08 UN-Water conducted a survey<br />
of government agencies in 104 countries<br />
(77 of them developing countries or<br />
economies in transition) to assess progress<br />
towards the target. A questionnaire was<br />
prepared by a UN-Water task force and<br />
sent to all Commission on Sustainable<br />
Development focal points by the United<br />
Nations Department of Economic and<br />
Social Affairs. It included questions in the<br />
following categories:<br />
• Main national instruments and strategies<br />
that promote integrated water<br />
resources management (policies,<br />
laws and integrated water resources<br />
management plans).<br />
• Water resources development, represented<br />
by such items as assessments,<br />
regulatory guidelines and basin<br />
studies.<br />
• Water resources management, as<br />
reflected in programs for watershed<br />
management, flood control and efficient<br />
allocation.<br />
• Water use, represented by water use<br />
surveys and programs for managing<br />
agricultural, industrial and domestic<br />
water uses.<br />
• Monitoring, information management<br />
and dissemination, as reflected<br />
in monitoring and data collection<br />
networks.<br />
• Institutional capacity building, represented<br />
by such items as institutional<br />
reforms, river basin management<br />
institutions and technical capacitybuilding<br />
programs.<br />
• Stakeholder participation, illustrated,<br />
for example, by decentralized<br />
structures, partnerships and gender<br />
mainstreaming.<br />
• Financing, represented by such items<br />
as investment plans, cost recovery<br />
mechanisms and subsidies.<br />
Of the 27 developed countries that<br />
responded, only 6 have fully implemented<br />
national integrated water resources management<br />
plans. Another 10 countries have<br />
plans in place and partially implemented.<br />
Particular areas of improvement are<br />
public awareness campaigns and gender<br />
mainstreaming.<br />
Of the 77 developing countries that responded<br />
38% had completed plans, with<br />
the Americas at 43%, Africa at 38% and<br />
Asia at 33%. Africa lags behind Asia and<br />
the Americas on most issues, although it<br />
is more advanced in stakeholder participation,<br />
subsidies and microcredit programs.<br />
Asia leads in institutional reform. The<br />
survey concluded that to adequately assess<br />
the needs for advancing implementation<br />
of integrated water resources management,<br />
countries needed better indicators<br />
and monitoring.<br />
Source: UN-Water 2008.<br />
Box 14.2<br />
Responses to impacts of non-integrated approaches to water<br />
resources management<br />
The transboundary Rio Grande River between<br />
the United States and Mexico (called Rio Bravo in<br />
Mexico) illustrates the negative impacts of nonintegrated<br />
water resources management. In both<br />
countries the region is one of the fastest growing,<br />
benefiting from the enhanced economic activities<br />
associated with the North American Free<br />
Trade Agreement (NAFTA). One result of NAFTA<br />
has been a proliferation of product assembly<br />
plants (maquiladoras) on the Mexican side of<br />
the border, making it a magnet for job seekers<br />
in Mexico. This growth was accompanied by a<br />
proliferation of informal settlements (colonias) on<br />
both sides of the border. Further, there is extensive<br />
agriculture in the lower Rio Grande Valley,<br />
making agriculture an important economic sector<br />
for Mexico and Texas. Finally, there are seven<br />
major paired urban areas along the international<br />
portion of the Rio Grande.<br />
Because of the associated water demands, approximately<br />
96% of the average flow of the river<br />
is allocated for municipal, agricultural and industrial<br />
uses. Although water allocations are governed<br />
by several treaties, the river also is subject<br />
to the jurisdictional concerns of federal and state<br />
agencies in three states in the United States and<br />
five states in Mexico. With responsibility for the<br />
river’s quantity, quality and allocations residing in<br />
several international, national and state organizations<br />
with differing mandates in two countries,<br />
much of the river is overallocated and degraded.<br />
An analysis of 67 EU projects related to integrated<br />
water resources management during<br />
1994-2006 provides insight into the practical<br />
challenges facing implementation. The analysis<br />
finds that integrated water resources management<br />
can provide a useful reform and planning<br />
framework, even though it has not yet provided<br />
unequivocal guidance on implementing national<br />
water planning and reforms. To be most effective,<br />
the analysis suggests, integrated water<br />
resources management must consider policy<br />
formulation and implementation as primarily a<br />
political process involving government officials,<br />
the private sector and civil society.<br />
Source: Moore, Rast, and Pulich 2002; Gyawali et al.<br />
2006.<br />
Water in a changing world 243
PART<br />
4<br />
Chapter 14<br />
Too often, only<br />
part of the<br />
sanitation system<br />
is implemented<br />
under the guise of<br />
being a sanitation<br />
solution, and it is<br />
later discovered<br />
that other<br />
components<br />
are missing<br />
For example, progress towards meeting<br />
the Millennium Development Goal for<br />
sanitation is lagging behind expectations<br />
partly because of the traditional approach<br />
to this issue. ‘Sanitation’ usually refers to a<br />
single technology or instrument designed<br />
to handle excreta and wastewater. Septic<br />
tanks, pit latrines and composting toilets,<br />
among others, are often referred to as<br />
‘sanitation systems’, when in fact they are<br />
technological components. When designed<br />
appropriately and linked to a range<br />
of other components, they form a robust,<br />
sustainable sanitation system.<br />
Too often, only part of the sanitation<br />
system is implemented under the guise of<br />
being a sanitation solution, and it is later<br />
discovered that other components are<br />
missing. Examples of such components include<br />
provisions for treated effluent (which<br />
is often diverted into open drains), fæcal<br />
sludge (which is often dumped in open<br />
fields) and other side streams that may be<br />
generated (such as water from sinks and<br />
showers). While the technological components<br />
themselves may work, the system as<br />
a whole will probably be short-lived.<br />
A sustainable sanitation system includes<br />
all the components (physical parts and<br />
actions) required to adequately manage<br />
human waste. When ‘sanitation’ is<br />
considered as a multistep process and<br />
not as a single point, waste products are<br />
accounted for from generation to ultimate<br />
destination. This concept describes<br />
the lifecycle of wastes generated at the<br />
household level, which are then processed<br />
(stored, transformed and transported)<br />
until reaching a final destination. Ideally,<br />
waste would be used beneficially, with the<br />
nutrients, biogas, soil-conditioner and irrigation<br />
water components recovered from<br />
wastes and with wastewater used to benefit<br />
society in a cycle (‘closing the loop’). For<br />
example, biogas could be used for cooking<br />
gas or electricity, soil fertility could be increased<br />
with added soil-conditioner from<br />
sludge drying beds and crop production in<br />
peri-urban agriculture could be improved<br />
through nutrient‐rich irrigation water<br />
from a constructed wetland.<br />
A more sustainable, holistic sanitation system<br />
can be designed by using components<br />
that would, in conjunction with existing<br />
or innovative new technologies, improve<br />
coverage and service while reducing the<br />
environmental burden. Several frameworks<br />
for a more systematic way of looking<br />
at sanitation systems already exist. 7<br />
Allocating and reallocating water and<br />
financial resources is unavoidable in<br />
water policy and management. Different<br />
Box 14.3<br />
Water resources management in Tunisia<br />
Water resources management in Tunisia began<br />
with development of the supply side, addressing<br />
the water demands of various sectors. The country<br />
has since established a system of interlinked<br />
water sources, making it possible to provide water<br />
for multiple purposes, including mixed low- and<br />
higher-salinity waters, which makes less usable<br />
water more productive. The country developed<br />
a national water-savings strategy for both urban<br />
and agricultural needs at an early stage of water<br />
planning, confirming a cultural ‘oasis’ tradition of<br />
frugal management of scarce water resources.<br />
Several principles underlie the Tunisian water<br />
strategy. First is shifting from isolated technical<br />
measures to a more integrated water management<br />
approach – for example, a participatory approach<br />
giving more responsibility to water users. Some<br />
960 water user associations were created, encompassing<br />
60% of the irrigated public areas. Second<br />
is the gradual introduction of water reforms and<br />
their adaptation to local situations. Third is the use<br />
of financial incentives to promote water-efficient<br />
equipment and technologies. Fourth is supporting<br />
farmer incomes to allow them to plan for and secure<br />
agricultural investment and labour. And fifth<br />
is a transparent and flexible water pricing system,<br />
aligned with national goals of food security, that<br />
will gradually lead to the recovery of costs.<br />
Irrigation water demands have been stable for<br />
the past six years, despite increasing agricultural<br />
development, seasonal peaks in water demands<br />
and unfavourable climate conditions (including<br />
droughts). The country is now addressing<br />
the current water demands of tourism (a source<br />
of foreign currency) and of urban areas, to<br />
maintain social stability. Wastewater from urban<br />
centres is treated and made available for agricultural<br />
use. A targeted pricing policy enables full<br />
recovery of operating costs of water services,<br />
with tourists paying the highest water prices<br />
and household users the lowest. Water system<br />
monitoring is extensive, including real-time<br />
information on all irrigation flows. One result is<br />
improved groundwater storage and vegetation<br />
recovery in sensitive natural areas. The current<br />
plan ends in 2010.<br />
Despite successes, however, Tunisia’s water<br />
resources are still under considerable stress. The<br />
combination of increasing population growth<br />
and rising water use in all sectors signals major<br />
future threats, providing the impetus for considering<br />
scenarios to address future allocation<br />
choices.<br />
Source: Blue Plan, MAP, and UNEP 2002; Treyer 2004;<br />
UNEP 2008.<br />
244 World Water Development Report 3
options inside the water box<br />
PART<br />
4<br />
stakeholders may see themselves as either<br />
winners or losers as a result of the changes<br />
arising from reform and planning efforts.<br />
Thus, planning should clearly identify the<br />
trade-offs among various management<br />
options (box 14.3). Further, coping with<br />
water deficits and challenges often requires<br />
improved engagement between water<br />
actors based on water management and<br />
allocation issues that extend beyond watershed<br />
boundaries. 8 One clear conclusion<br />
is that water governance, management<br />
and use cannot be considered independently<br />
if the goal is water resources sustainability.<br />
Both the causes of water problems<br />
and their solutions are partly embedded<br />
in processes and forces outside the water<br />
domain (see chapter 15).<br />
Some countries are developing scenariobased<br />
planning tools. The Netherlands<br />
has used scenario-based planning to help<br />
make decisions on water management options.<br />
Its first plan, during the late-1960s,<br />
addressed only water quantity, but more<br />
recent plans have evolved into a multifaceted<br />
water management process, with<br />
a main pillar being stakeholder involvement,<br />
from other ministries and local<br />
authorities to the private sector and the<br />
public (box 14.4).<br />
Many Asian countries have essentially<br />
exhausted opportunities to further expand<br />
irrigated agriculture and other water<br />
diversions. The objective in these cases is<br />
to increase the productivity of developed<br />
water resources and the effectiveness<br />
of water-management institutions. 9 But<br />
despite progress in improving water management,<br />
many countries still face major<br />
challenges, a consequence of increasing<br />
population, growing water use by all<br />
sectors and the approaching impacts of<br />
climate change.<br />
Institutional developments: current<br />
response options in water reform<br />
The ability of water management agencies<br />
to address water variability and to<br />
deal with risk and uncertainties such as<br />
climate change varies considerably, mainly<br />
because few countries have internalized<br />
water resources management concerns into<br />
their socioeconomic development policies<br />
and governance systems. Nor are countries<br />
fully including water stakeholders in the<br />
decision-making process, particularly at<br />
few countries<br />
have internalized<br />
water resources<br />
management<br />
concerns into their<br />
socioeconomic<br />
development<br />
policies and<br />
governance<br />
systems<br />
Box 14.4<br />
Integrated water planning in the Netherlands<br />
The Netherlands is preparing its fifth integrated<br />
water management plan, with the<br />
possible consequences of climate change<br />
high on the agenda.<br />
Its first plan, prepared in 1968, was<br />
supply-driven and addressed only quantity<br />
issues. Deteriorating water quality, and the<br />
very dry summer of 1976, led to fundamental<br />
changes in the country’s approach<br />
to water management. The second plan<br />
had to be completely different, so the<br />
Policy Analysis of Water Management for<br />
the Netherlands was carried out before<br />
drafting the second plan.<br />
For the second plan, despite a thousand<br />
years of experience in water management,<br />
the government enlisted the assistance of<br />
the RAND Corporation, a U.S.-based think<br />
tank with extensive experience in complex<br />
policy processes. The company had been involved<br />
in an earlier integrated water project<br />
in the Netherlands – the storm surge barrier,<br />
a multibillion dollar project to protect<br />
the southern part of the country – helping<br />
them secure close cooperation of other ministries<br />
and governmental levels involved.<br />
The plan was expected to achieve three<br />
primary ends: develop and apply a<br />
methodology for producing alternative<br />
water management policies, assess and<br />
compare their consequences and help create<br />
domestic capability to conduct similar<br />
analyses by the related Dutch entities.<br />
Using more than 50 models, the project<br />
resulted in a much better operational understanding<br />
of the water system. Multiple<br />
cost-benefit analyses of options to improve<br />
water management led to the identification<br />
of implementable local projects and<br />
helped avoid large, expensive infrastructure<br />
works that proved not to be cost-effective.<br />
An important conclusion was that water<br />
quality problems cannot be solved at the<br />
national level – for example, reallocating<br />
water could inflict large losses on some<br />
sectors. Tight restrictions on groundwater<br />
abstractions were needed to meet desired<br />
environmental standards, which would<br />
impose large losses on some users. The second<br />
plan, published in 1984, reflected this<br />
complete change in thinking about how to<br />
develop and manage the water system.<br />
Subsequent water management plans<br />
continued to develop integrated water<br />
resources management. The third plan<br />
(1989) added in-depth analysis of the role<br />
of ecology in water management, and<br />
the fourth plan (1998) focused on specific<br />
water systems and themes, facilitating<br />
implementation of needed actions and<br />
clarifying institutional roles.<br />
The evolution of these five water plans,<br />
each building on its predecessor and<br />
responding to changing circumstances,<br />
facilitated significant shifts in thinking<br />
and engendered new approaches to<br />
water management. From its origins in a<br />
technical, supply-oriented, model-based<br />
decision process, the planning process<br />
is now multifaceted, with a main pillar<br />
being stakeholder involvement (other<br />
ministries, local authorities, public and<br />
the like) with a focus on sustainability and<br />
climate proofing related to anticipated<br />
changes.<br />
The lessons learned from developing<br />
the five water management plans in an<br />
integrated manner are that implementing<br />
complete integrated water resources<br />
management takes time (more than 30<br />
years in the Netherlands), that external<br />
input can facilitate implementation of new<br />
concepts and that full involvement of all<br />
stakeholders is needed. While cooperation<br />
may not always be possible, involvement<br />
is essential. By helping stakeholders understand<br />
the difficult trade-offs, the participatory<br />
practices made it easier to accept<br />
the importance of change for the greater<br />
good of society.<br />
Source: E. van Beek, H. Engel and G. C. de<br />
Gooijer.<br />
Water in a changing world 245
PART<br />
4<br />
Chapter 14<br />
Many components<br />
of ongoing<br />
water reform are<br />
part of broader<br />
governance<br />
reform agendas<br />
the basin level. And still missing are the<br />
information, planning tools, management<br />
strategies, and human, institutional and<br />
system capacities needed to meet local<br />
demand for sustainable water development<br />
under conditions of climate variability and<br />
change.<br />
Many institutional systems are unable<br />
to adapt to current and future challenges<br />
because of such factors as political<br />
power monopolies, unilateral steering<br />
by government and bureaucracy, hierarchical<br />
control, top-down management<br />
and institutional fragmentation. These<br />
institutional characteristics also prevent<br />
political decision-makers from being<br />
fully informed by water sector managers.<br />
Still, many developing countries and<br />
economies in transition are transforming<br />
their water management systems through<br />
integrated water resources management<br />
approaches. They are incorporating such<br />
elements as decentralization (subsidiarity),<br />
transparency and stakeholder participation,<br />
administrative systems based on<br />
river basins and catchments, coordination<br />
and integration, partnerships (publicprivate,<br />
public-public, public-community/<br />
civil society), use of economic instruments<br />
and increased commercialization<br />
and privatization.<br />
Decentralization and participation. Many<br />
components of ongoing water reform are<br />
part of broader governance reform agendas.<br />
Uganda, for example, has transferred<br />
water responsibilities to district and lower<br />
levels, receiving broad and strong political<br />
support within the country and illustrating<br />
that water reform is an integral<br />
part of reform efforts. Most countries<br />
have devolved provision of drinking<br />
water to the municipal government level.<br />
Nevertheless, decentralization and devolution<br />
remain problematic. Ethiopia, for<br />
example, has transferred important decision-making<br />
responsibilities to district<br />
and village levels, but has not followed up<br />
with capacity development and transfers<br />
of funds. Ghana’s experience illustrates<br />
the importance of user participation and<br />
shows how financing can be resolved,<br />
demonstrating that decentralization and<br />
participation can yield positive outcomes;<br />
Bolivia’s experience illustrates the beneficial<br />
use of cooperatives in such efforts<br />
(box 14.5).<br />
Box 14.5<br />
Participatory approaches in decentralized provision of water supply and sanitation<br />
services<br />
Enhanced decentralization and participation<br />
for rural water supply and sanitation in<br />
Ghana. Ghana changed its rural water supply<br />
structure, expanding coverage through<br />
greater participation and more efficient<br />
delivery systems over a period of about 10<br />
years. Water supply coverage rose from<br />
55% in 1990 to 75% in 2004, with most of<br />
the increase in rural areas. Decentralization<br />
has been a part of broader political reform<br />
and improved governance structures.<br />
Responsibility for rural water supply was<br />
transferred to local municipal governments<br />
and communities, coordinated by<br />
the decentralized Community Water and<br />
Sanitation Agency. Elected district assemblies<br />
are responsible for processing and<br />
prioritizing community applications for<br />
water and sanitation, awarding contracts<br />
for wells and latrine facilities and running<br />
latrine subsidy programmes. Village-level<br />
participation is part of the new structure.<br />
Village water committees plan for local<br />
water supply and sanitation facilities and<br />
raise funds for investment and operation<br />
and management costs. An assessment in<br />
2000 found greater satisfaction with water<br />
quality and quantity at the village level.<br />
Most community residents contributed<br />
financially to these efforts, indicating that<br />
they received adequate value for their<br />
investments. Members of the village water<br />
and sanitation committees have received<br />
training and opened bank accounts, and<br />
women have played an active role in many<br />
communities.<br />
Cooperative for Urban Water and Sanitation<br />
Services Delivery in Santa Cruz, Bolivia. Utility<br />
cooperatives were initially formed to provide<br />
utility services – mainly in rural areas<br />
where investor-owned utilities would not<br />
expand because of profitability concerns –<br />
usually providing services at at-cost prices.<br />
The Cooperative for Urban Water and<br />
Sanitation Services in Santa Cruz (SAGUA-<br />
PAC) provides water and sewerage services<br />
to Santa Cruz, Bolivia, a city of 1.2 million<br />
inhabitants. The national government<br />
approved the autonomous water board’s<br />
request in 1979 to transform itself into a<br />
cooperative, recognizing that a different<br />
model was needed to provide services<br />
efficiently to a rapidly growing population.<br />
Civil opposition to state ownership and<br />
recognition that community participation<br />
was needed to achieve service improvements<br />
contributed to the adoption of a<br />
cooperative structure.<br />
SAGUAPAC’s service area covers about<br />
63% of the city area and 66% of its<br />
population. By 2002 SAGUAPAC was<br />
providing water to approximately 95%<br />
of the population in its service area and<br />
sewerage services to about 50%.<br />
Based on a classical cooperative model,<br />
SAGUAPAC has a 27-member Delegate<br />
Assembly (three members from each of<br />
the nine districts) that elects members of<br />
the Administration and Oversight Boards.<br />
(Some Bolivian utility cooperative boards<br />
have a general assembly instead, open to<br />
universal participation.)<br />
SAGUAPAC applies the principles of autonomy,<br />
accountability, customer orientation<br />
and market orientation. It has become<br />
one of the largest urban water cooperatives<br />
in the world – serving approximately<br />
three-quarters of a million people and<br />
billing close to $19 million a year. Assessed<br />
against international standards, its<br />
performance over the years is considered<br />
very good, providing continuous service<br />
with good quality water through house<br />
connections and maintaining satisfactory<br />
financial performance. Most connections<br />
are metered (97%), and tariff collection<br />
efficiency is 90%.<br />
Source: WSP-AF 2002; UNDP 2006; Ruiz-Mier<br />
and Van Ginneken 2006.<br />
246 World Water Development Report 3
options inside the water box<br />
PART<br />
4<br />
River basin management. River basin<br />
management integrates physical and<br />
administrative boundaries, nesting them<br />
within each other at different scales. The<br />
aim is to improve coordination in water<br />
decision-making. River basin management<br />
structures have been installed in many<br />
countries, including Australia, Brazil,<br />
Kazakhstan, Kenya, South Africa and EU<br />
member countries. The European Union<br />
Water Framework Directive is a stringent<br />
programme for establishing sustainable<br />
water resources management. It has had<br />
a major impact in new member countries,<br />
largely by mobilizing funding for<br />
improved water resources management.<br />
The government of Québec (Canada) has<br />
drafted a water law that identifies river<br />
basins as the fundamental water management<br />
unit.<br />
Evidence from countries such as South<br />
Africa suggests that organizations and<br />
catchment bodies smaller than the river<br />
basin scale may be ineffective, may be<br />
too complex to implement and may offer<br />
benefits that are difficult to clearly identify.<br />
Several river basin organizations have<br />
found implementation challenging, experiencing<br />
considerable uncertainty about<br />
their roles and functions in implementing<br />
integrated approaches to water resources<br />
management. Most organizations have<br />
limited financial autonomy and depend on<br />
money from the central government and<br />
the donor community. 10 Despite the spread<br />
of river basin organizations at both national<br />
and international levels (box 14.6),<br />
examples of progress are difficult to find.<br />
It is unclear whether this is due to unsatisfactory<br />
performance or too short a period<br />
to document experiences and results.<br />
Coordination and integration. Coordination<br />
with related sectors (agriculture, industry,<br />
energy and so on) is vital for improving<br />
water resources use and allocation (see<br />
chapter 15). But sectoral approaches to<br />
water resources management inevitably<br />
lead to fragmented, uncoordinated development<br />
and management. Fragmented institutional<br />
frameworks and overly complex<br />
coordination mechanisms in the water<br />
sector are common in many countries. 11<br />
When appropriate links are missing, different<br />
ministries and agencies deal separately<br />
sectoral<br />
approaches to<br />
water resources<br />
management<br />
inevitably lead<br />
to fragmented,<br />
uncoordinated<br />
development and<br />
management<br />
Box 14.6<br />
Integrated management of land-based activities in São<br />
Francisco basin, Brazil<br />
The United Nations Environment Programme<br />
(UNEP), in cooperation with the National Water<br />
Agency (ANA) of Brazil and the Organization of<br />
American States (OAS), and with funding from<br />
the Global Environment Facility, undertook a<br />
project during 1999-2002 to develop a watershed<br />
management programme for the São Francisco<br />
River basin. The basin traverses five states in<br />
Northeastern Brazil before discharging into the<br />
Atlantic Ocean.<br />
The basin is strategically important to the economic<br />
development of a vast region of Brazil,<br />
which has subjected its natural resources to<br />
increasing demands. Mining, agricultural, urban<br />
and industrial activities contribute large contaminant<br />
loads to the system, including organic<br />
chemicals, heavy metals and sediment. Environmentally<br />
sensitive estuarine wetlands at the<br />
river mouth were threatened by unsustainable<br />
hydrologic management and land use practices<br />
in the basin. The basin’s economic development<br />
has been haphazard, occurring within a weak<br />
institutional framework and resulting in less<br />
than optimal use and degradation of its water<br />
resources. Regulated flows over large stretches<br />
also have altered natural flows, causing changes<br />
in the freshwater, estuarine and marine flora and<br />
fauna.<br />
The initial project objective was to conduct planning<br />
and feasibility studies for formulating an<br />
integrated watershed management plan as the<br />
basis for environmentally sustainable economic<br />
development of the basin. Components included<br />
river basin and coastal zone environmental<br />
analyses, public and stakeholder participation,<br />
development of an organization structure and<br />
formulation of a watershed management programme.<br />
Concluded in 2002, the environmental<br />
analysis provided a sound scientific and technical<br />
basis for remedial actions to protect the coastal<br />
zone from land-based activities.<br />
Communities were involved in identifying and<br />
field testing remedial measures, and a process<br />
was established for dialogue among stakeholders<br />
and agencies with economic interests in the<br />
basin. Basin institutions are being equipped and<br />
trained to implement new laws, regulations and<br />
procedures for addressing environmental problems.<br />
Finally, agencies and individuals both inside<br />
and outside government synthesized data and<br />
experiences and prepared feasibility assessments<br />
and cost analyses for a long-term basin management<br />
programme. Some 217 public events were<br />
held, including seminars, workshops and plenary<br />
sessions. More than 12,000 stakeholders, including<br />
more than 400 organizations, universities,<br />
non-governmental organizations, unions, associations<br />
and federal, state and municipal government<br />
organizations, participated in the events. A<br />
comprehensive Diagnostic Analysis and Strategic<br />
Action Program for the Integrated Management<br />
of the São Francisco basin was completed in<br />
2003 and is currently being implemented.<br />
Source: ANA 2004.<br />
Water in a changing world 247
PART<br />
4<br />
Chapter 14<br />
Integrated water<br />
management<br />
approaches must<br />
have institutional<br />
and legislative<br />
governing<br />
frameworks to<br />
ensure oversight<br />
and monitoring<br />
of water resources<br />
and participation<br />
of target groups<br />
with water’s many subsectors. Weak water<br />
governance encourages economic sectors<br />
to compete for larger shares of water<br />
resources, to boost economic development<br />
or satisfy national production needs.<br />
Similarly, where interjurisdictional water<br />
governance is weak, riparian countries<br />
and jurisdictions sharing a water resource<br />
compete to develop their own water infrastructure<br />
and use. As this Report shows<br />
throughout, it is the leaders in government,<br />
business and civil society who make<br />
the decisions that determine effective<br />
water use policy (see also chapter 15).<br />
Some countries have identified a need for<br />
coordination not only among ministries<br />
but also with subnational levels in implementing<br />
water policy and legislation.<br />
Integrated water management approaches<br />
must have institutional and legislative<br />
governing frameworks to ensure oversight<br />
and monitoring of water resources and<br />
participation of target groups. Thus, intersectoral<br />
coordination of water uses and<br />
involvement of water users are necessary at<br />
different levels of decision-making. 12<br />
One approach is to establish water councils,<br />
including high-level national water<br />
councils, river and basin councils, subnational<br />
(regional, governorate, state) councils<br />
and water users associations (see box<br />
14.5). Experience with national and subnational<br />
water councils is extensive, and<br />
their functioning and political influence<br />
can vary considerably. Their main purpose<br />
is to develop links and structures for managing<br />
water resources across sectors and<br />
involving water users and stakeholders in<br />
planning and strategy development. 13<br />
Partnerships. Partnerships have been promoted<br />
within the water supply sector to<br />
improve services. Most have been publicprivate<br />
partnerships, and results have<br />
been mixed. Some countries are revising<br />
procedures for public-private partnerships<br />
(for example, Argentina), while others<br />
see no need for change. Some countries<br />
(Bolivia, for example) reject any private<br />
sector participation in water supply and<br />
sanitation.<br />
Other types of partnerships involve civil<br />
society, municipalities and the private<br />
sector. To be successful, these partnerships<br />
require adequate capacity in civil<br />
society and private sector organizations<br />
and commitment from municipal governments<br />
and agencies. Proper incentives<br />
and mutual trust are also important. 14<br />
Argentina, Colombia, Honduras, Paraguay<br />
and Peru have experience with partnerships<br />
going beyond the private sector.<br />
The Cartagena Partnership in Colombia,<br />
for example, was initially a partnership<br />
of municipal authorities, the community<br />
and a private water company. It explicitly<br />
involved community organizations in<br />
mobile payment collection units to collect<br />
fees from residents, establishing a clear accountability<br />
mechanism for fee collection.<br />
In Porto Alegro, Brazil, the municipality,<br />
community organizations and the public<br />
water company developed a partnership<br />
establishing participatory budgetary processes<br />
and charging water fees based on<br />
consumption rather than property taxes.<br />
The partnership improved the financial<br />
base for the public water company.<br />
Brazil developed its water resources with<br />
eight major coordination mechanisms over<br />
a long period and implemented far-reaching<br />
institutional and legal changes. The<br />
1988 Constitution specified federal and<br />
state government responsibilities and legal<br />
authority. The Ministry of Environment<br />
and Water Resources was created in 1995,<br />
and the National Water Resource Policy<br />
Law was passed in 1997. States also passed<br />
water laws. The reforms include establishing<br />
national, basin and state councils to<br />
improve managerial coordination and<br />
resolve water conflicts within the federal<br />
framework. The public utility (Municipal<br />
Department of Water and Sewage) operates<br />
Box 14.7<br />
The right to water<br />
Some countries identify access to water as<br />
a human right in their constitution or other<br />
high-level legal instrument, thereby opening up<br />
constitutional courts and legal mechanisms to individuals<br />
and communities seeking to challenge<br />
inadequate access. A referendum in Uruguay<br />
in 2004, for example, added a human right to<br />
water to the Constitution, with more than 64%<br />
of the population voting for the amendment.<br />
The High Court in South Africa ruled on 30 April<br />
2008 that prepayment meters in Johannesburg<br />
were unconstitutional on grounds of discrimination<br />
and that Johannesburg Water could afford<br />
to supply a minimum amount of water (50 litres<br />
a day) to each citizen. Courts in other countries<br />
(for example, Argentina, Brazil and India) have<br />
also sometimes reversed decisions to disconnect<br />
water supplies to poor people who cannot afford<br />
to pay. The long-term viability of this approach,<br />
however, remains unclear.<br />
Source: COHRE 2007.<br />
248 World Water Development Report 3
options inside the water box<br />
PART<br />
4<br />
under a no-dividend policy, reinvesting<br />
all profits and investing at least a quarter<br />
of annual revenue in water infrastructure.<br />
15 In Honduras the national water<br />
and sanitation operator (SANAA) has long<br />
worked with community-based organizations<br />
to improve services and procedures.<br />
And Malaysia entered into a partnership<br />
in an effort to reduce non-revenue losses<br />
(box 14.8).<br />
Involving the informal private sector<br />
(water vendors) also can improve service<br />
delivery and help reduce quality-related<br />
problems. New contractual approaches<br />
have been developed in Paraguay, for<br />
example, to target aguateros (mostly smallscale<br />
water companies), which have developed<br />
piped water supplies in peri-urban<br />
areas without public funding. These aguateros<br />
can now legally take part in public<br />
bidding processes, and their performance<br />
can be tracked, improving accountability. 16<br />
These examples show that opportunities<br />
exist for innovative partnerships and that<br />
there is room for new institutional models.<br />
Water institutions and law<br />
Law and policy are connected, with implementation<br />
of laws often being a trial and<br />
error effort requiring feedback and practical<br />
cases that interpret certain aspects of<br />
water law (see chapter 4). The government<br />
of Kenya, for example, enacted a Water<br />
Act in 2002 that established a new policy<br />
framework for the water sector. Guided by<br />
the legal framework and a draft Zero Investment<br />
Plan (2003), Kenya’s water sector has<br />
undergone radical reform in policies and<br />
strategies, with the aim of reducing poverty.<br />
Associated goals include efficient service<br />
delivery, respect for consumer rights,<br />
financial sustainability and service coverage<br />
to poor people in both urban and rural<br />
areas. Examples from some other countries<br />
are illustrated in boxes 14.7 and 14.9.<br />
Local water user groups and communities<br />
sometimes acknowledge customary rights<br />
to water use and allocation (box 14.10). In<br />
rural areas customary water rights often<br />
include operational rights and the right to<br />
participate in decision-making about operations,<br />
inclusion or exclusion of members,<br />
water distribution, irrigation schedules,<br />
flow rates and organizational positions and<br />
responsibilities. 17 African chiefs in charge<br />
of villager access to wells and the water<br />
court in Valencia, Spain, which regulates<br />
irrigation water access, are examples of<br />
practices that reflect customary rights.<br />
Another example of customary rights is<br />
the traditional subak system of irrigation<br />
water distribution and use among the traditional<br />
rice-growing communities in Bali,<br />
Indonesia. The Indonesian Water Act of<br />
2004 recognizes communal rights of local<br />
traditional communities as long as they<br />
do not contravene legislation and national<br />
interests. This is the standard formulation<br />
of customary rights protection in water<br />
Local water<br />
user groups and<br />
communities<br />
sometimes<br />
acknowledge<br />
customary rights<br />
to water use<br />
and allocation<br />
Box 14.8<br />
Public-private partnership for reducing non-revenue water<br />
losses in Malaysia<br />
Many water utilities lose large quantities of water<br />
through distribution system leakage or billing<br />
weaknesses (so-called ‘non-revenue water’),<br />
which can undermine their financial viability. The<br />
state of Selangor, in Malaysia, experienced a serious<br />
water crisis in 1997 attributed to the El Niño<br />
weather phenomenon. The distribution leakage<br />
rate for the State Waterworks Department was<br />
estimated at 25%, or 500,000 cubic metres (m 3 )<br />
a day, sufficient to serve an estimated 3 million<br />
people daily.<br />
To address the problem, the State Waterworks<br />
Department employed a locally led consortium,<br />
in a joint venture with an international operator.<br />
The contract called for reducing non-revenue<br />
water losses by 18,540 m 3 a day for a payment<br />
equivalent to $243 per cubic metre per day of<br />
non-revenue water saved. The contractor was<br />
given the flexibility to design and implement<br />
activities to reduce losses, with a payment arrangement<br />
in place to cover necessary work and<br />
materials for detecting and repairing water leaks,<br />
identifying illegal connections, replacing customer<br />
meters as needed and establishing zones<br />
for reducing non-revenue water (district-metered<br />
areas). During an initial 18-month phase I, the<br />
validity of the concept was tested on a limited<br />
portion of the water delivery network.<br />
Phase I exceeded its target, saving 20,898 m 3<br />
a day. Twenty-nine district-metered areas were<br />
established, with an average savings of 400 m 3 a<br />
day in each area, and some 15,000 water meters<br />
were replaced. The cost to the State Waterworks<br />
Department was about $215 per cubic metre<br />
a day. Phase II (2000-09) has an overall reduction<br />
target of 198,900 m 3 a day, for a payment<br />
equivalent to $528 per m 3 a day. Based on interim<br />
results at the beginning of the sixth project<br />
year, 222 district-metered areas were established,<br />
more than 11,000 leaks were repaired and<br />
119,000 water meters (of a contractual minimum<br />
of 150,000) were replaced. Non-revenue water<br />
losses were reduced by 117,000 m 3 a day (20%<br />
above the 2009 contract target of 97,500 m 3 a<br />
day), and commercial losses were reduced by<br />
50,000 m 3 a day.<br />
Source: Kingdom, Liemberger, and Marin 2006.<br />
Water in a changing world 249
PART<br />
4<br />
Chapter 14<br />
A growing number<br />
of countries<br />
and cities are<br />
incorporating<br />
water-related<br />
adaptations to<br />
climate change<br />
into planning and<br />
policy efforts<br />
Box 14.9<br />
Examples of legal frameworks for managing water<br />
Effectively managing competing water uses requires<br />
clear, widely accepted rules on allocating<br />
water resources, especially under conditions of<br />
scarcity. Water allocation systems should balance<br />
equity and economic efficiency.<br />
One means of avoiding conflicts of interests in<br />
water legislature is to separate policy, regulation<br />
and implementation functions, as Kenya does.<br />
The Ministry of Water and Irrigation focuses on<br />
policy formulation and guidance, while the Water<br />
Services Regulatory Board and Water Resources<br />
Management Authority address national and regional<br />
regulatory functions. Water service providers<br />
(such as community groups, non-governmental<br />
organizations, autonomous entities established<br />
by local authorities and the private sector under<br />
contract to regional water services boards) implement<br />
water supply and sanitation services.<br />
Mexico passed the Law on National Waters<br />
in November 1992, and implementation<br />
regulations were adopted in January 1994.<br />
Amendments in 2004 added a package of regulatory,<br />
economic and participatory approaches<br />
to water resources allocation and pollution<br />
control. These include river basin planning,<br />
licensing of water abstractions and uses, permitting<br />
for wastewater dischargers, charging for<br />
water abstractions and wastewater disposal and<br />
articulation of federal government administration<br />
at the river basin and aquifer levels. The amendments<br />
also include provisions for recording legal<br />
instruments in a public water rights registry and<br />
providing opportunities for community participation<br />
through water user organizations and<br />
membership in basin councils.<br />
Implementation and enforcement of the new<br />
regulatory structure began in 1993 with a survey<br />
and registration of abstractions and disposals.<br />
It took 10 years, and a series of intermediate<br />
regulatory adjustments and massive information<br />
campaigns, to complete the process.<br />
Source: Velasco 2003.<br />
Box 14.10<br />
Recognizing customary practices in drafting laws<br />
The framers of the Namibia Water Resources Management<br />
Act of 2004 were aware of the potential<br />
for deeply rooted customary practices – particularly<br />
livestock herding by traditional communities<br />
– to clash with the development of large-scale<br />
irrigated agriculture or tourism supported by<br />
administrative rights for the same waters used by<br />
herders. The new act prescribes the processing of<br />
abstraction licences and the criteria to inform decisions<br />
on licence applications. The law recognizes<br />
the existence of a ‘traditional community’ and the<br />
extent of its reliance on a water source affected by<br />
a proposed water abstraction (section 35(1)(h)).<br />
Accommodation of the ‘reasonable requirements’<br />
of any traditional community is included among<br />
the standard terms and conditions of abstraction<br />
licences (section 37(e)).<br />
Another example of customary rights is the<br />
traditional subak system of irrigation water<br />
distribution and use among the rice-growing<br />
communities in Bali, Indonesia. The Water Act<br />
of 2004 recognizes communal rights of local<br />
traditional communities as long as they do not<br />
contravene legislation and national interests. This<br />
is the standard formulation of customary rights<br />
protection in water legislation in countries where<br />
customary law is extensively practiced. Although<br />
lacking in detail and clarity, such statements can<br />
suffice in areas with strong social cohesion and<br />
where competition for water from ‘outsiders’ is<br />
limited.<br />
Source: Stefano Burchi, Food and Agriculture Organization<br />
of the United Nations.<br />
legislation in countries where customary<br />
law is extensively practiced. Although<br />
lacking in detail and clarity, such statements<br />
can suffice in areas with strong<br />
social cohesion and where competition for<br />
water from ‘outsiders’ is limited. 18<br />
Climate change and water resources<br />
As chapter 5 demonstrates, climate change<br />
and variability have many potential impacts,<br />
both locally and globally. They may<br />
directly affect the quantity and quality<br />
of water resources. Climate change and<br />
variability also act on the other drivers<br />
and thus on water use and demand. The<br />
responses to challenges posed by climate<br />
change will likely be specific for each<br />
country or even parts of each country.<br />
Developments are taking place at policy<br />
levels. The National Adaptation Programmes<br />
of Action under the United Nations<br />
Framework Convention on Climate<br />
Change are still in their early phases. Many<br />
least developed countries must still coordinate<br />
climate- and water-related policies and<br />
actions. Bhutan is one example of a country<br />
that has coordinated its national water<br />
and climate change adaptation policies to<br />
meet short- and long-term threats of glacier<br />
lake outburst floods resulting from climate<br />
change-induced glacier melting. 19<br />
A growing number of countries and cities<br />
are incorporating water-related adaptations<br />
to climate change into planning and<br />
policy efforts, along with institutional and<br />
250 World Water Development Report 3
options inside the water box<br />
PART<br />
4<br />
Box 14.11<br />
Water-related responses to climate change<br />
London and Venice are redesigning their urban<br />
stormwater drainage systems to accommodate<br />
predicted changes in precipitation frequency<br />
and intensity. Tokyo is designing urban holding<br />
ponds under roads and parks to temporarily<br />
store storm runoff to avoid flash floods. Jakarta<br />
recently initiated a programme to construct a<br />
major stormwater drainage canal system (East<br />
Canal) to provide adequate drainage to its eastern<br />
half. Viet Nam has developed an extensive<br />
system of dikes, including 5,000 kilometres of<br />
river dikes and 3,000 kilometres of sea dikes, to<br />
protect from typhoons and rising sea levels.<br />
Countries in the lower Danube River basin in<br />
Eastern Europe restored thousands of hectares of<br />
aquatic habitat through floodplain restoration.<br />
In Andhra Pradesh, India, removing silt from<br />
water tanks allows the capture of more monsoon<br />
runoff, resulting in additional benefits of less<br />
groundwater pumping, restoration of some dry<br />
wells and irrigation of an extra 900 hectares of<br />
land. Reconnecting lakes in the Hubei Province<br />
in China to the Yangtze River – by opening sluice<br />
gates and applying sustainable management<br />
techniques – increased wetland areas and wildlife<br />
diversity and population and will make the area<br />
more resilient to flood flows. There are potential<br />
scaling-up possibilities with this approach,<br />
as there are hundreds of sluice gates along the<br />
Yangtze River that disconnect it from nearby<br />
lakes.<br />
Source: World Bank 2008.<br />
Stakeholder<br />
engagement<br />
is important<br />
to improving<br />
water resources<br />
management<br />
through several<br />
channels, from<br />
direct participation<br />
in planning to<br />
expanding public<br />
awareness<br />
technological measures to mitigate such<br />
predicted impacts as sea-level rise, more<br />
frequent droughts and increased precipitation<br />
(box 14.11).<br />
Consulting with stakeholders<br />
and avoiding corruption:<br />
accountability in planning,<br />
implementation and<br />
management<br />
Stakeholder engagement is important to<br />
improving water resources management<br />
through several channels, from direct<br />
participation in planning to expanding<br />
public awareness. One benefit is reducing<br />
corruption, a source of devastating social,<br />
economic and environmental impacts, particularly<br />
for poor people, and which can<br />
increase the investment costs of achieving<br />
the Millennium Development Goals.<br />
Engaging stakeholders: benefits and<br />
challenges<br />
Stakeholder involvement through public<br />
hearings, advisory committees, focus<br />
groups, stakeholder forums and the like has<br />
often improved water projects, programmes<br />
and related human livelihood opportunities.<br />
It can also increase public awareness<br />
of water issues while informing both the<br />
facilitators of change and those involved<br />
in it. An example is the study on diffuse<br />
water pollution of the North American<br />
Great Lakes conducted by the US-Canada<br />
International Joint Commission during the<br />
1970s. The commission conducted public<br />
hearings throughout the basin, both to<br />
educate basin inhabitants about the study<br />
goals and to secure their inputs on potential<br />
problems and solutions (box 14.12).<br />
Some stakeholders who are left out of decision-making,<br />
such as small-scale farmers<br />
and poor urban households, may respond<br />
by organizing their own activities (box<br />
14.13). Irrigation management transfer in<br />
India, Mexico and Turkey, for example, led<br />
to investments in new techniques, better<br />
collection of water user fees and improved<br />
water resources management (box 14.14;<br />
see also box 4.4 in chapter 4). In 1998 in<br />
the Arwari River catchment in Rajasthan,<br />
India, the Arwari River Parliament, with<br />
2,055 members in 70 villages in 46 microwatersheds,<br />
was formed to improve water<br />
management through controlled use of<br />
water. The river parliament also explored<br />
improving soil, land and forest management;<br />
increasing agricultural productivity;<br />
seeking participation by women and generating<br />
self-employment and alternative<br />
livelihood options. Its social, economic<br />
and environmental impacts have generally<br />
been positive, and increased agricultural<br />
production has expanded livelihood opportunities.<br />
The Arwari River Parliament<br />
has provided a platform to resolve land,<br />
water and forest management disputes. 20<br />
To provide useful communication tools and<br />
systems for exchanging information, data<br />
and experiences, the Emilia-Romagna region<br />
in Italy developed a national forum on<br />
water conservation as a common platform<br />
for discussion and comparison of water conservation<br />
policies. The forum highlights the<br />
most modern, innovative policies for water<br />
saving and conservation at the national<br />
level. It is organized into thematic working<br />
groups (water saving in civil, agricultural<br />
and industrial sectors; drinking water losses<br />
in distribution systems; and communication).<br />
To expedite its work, the forum has a<br />
Website, 21 organizes an annual conference<br />
(held on World Water Day) and thematic<br />
workshops, produces newsletters and engages<br />
national and European experts.<br />
Water in a changing world 251
PART<br />
4<br />
Chapter 14<br />
Box 14.12<br />
Public participation panels in the North American Great Lakes basin review of water<br />
quality<br />
The United States and Canada established<br />
the International Joint Commission<br />
under the Boundary Waters Treaty<br />
of 1909. The two countries signed the<br />
Great Lakes Water Quality Agreement<br />
in 1972, with the goal of restoring and<br />
maintaining the chemical, physical and<br />
biological integrity of the Great Lakes<br />
basin ecosystem. The agreement called<br />
on the commission to conduct a study of<br />
pollution in the Great Lakes system from<br />
diffuse (non-point) sources in its drainage<br />
basin. The International Reference Group<br />
on Great Lakes Pollution from Land Use<br />
Activities (PLUARG) was established to<br />
undertake the study, focusing on three<br />
major questions:<br />
• Are the Great Lakes being polluted<br />
from land drainage from non-point<br />
sources in the basin?<br />
• If so, what is the extent of this pollution,<br />
what are its causes and where is<br />
the pollution occurring?<br />
• What remedial measures can address<br />
these sources, and what would they<br />
cost?<br />
The PLUARG study, which involved scientists,<br />
managers and policy-makers from<br />
both countries, concluded that non-point<br />
sources (particularly agricultural and urban<br />
runoff) were responsible for water quality<br />
problems from phosphorus, sediments,<br />
polychlorinated biphenyls, persistent<br />
pesticides, industrial organic chemicals<br />
and lead on either a lake-wide or localized<br />
basis. Non-point sources also contributed<br />
significant amounts of nitrogen, chloride,<br />
non-persistent pesticides and heavy metals,<br />
although these pollutants did not yet<br />
constitute a water quality problem.<br />
Considering the many jurisdictions<br />
involved (see map), and the diversity<br />
of opinions to be considered, PLUARG<br />
recognized the need for public input to<br />
identify concerns and workable management<br />
strategies. PLUARG established nine<br />
public panels in the United States and<br />
eight in Canada, comprising industrialists,<br />
small business owners, farmers, labour<br />
representatives, educators, environmentalists,<br />
women’s groups, sport and fishing associations,<br />
wildlife federations and elected<br />
and appointed government officials. Each<br />
panel met four times to discuss and make<br />
recommendations on the environmental,<br />
social and economic aspects of the study,<br />
with many expressing their goals for the<br />
Great Lakes. The panels reviewed and<br />
commented on a draft of the PLUARG<br />
report before its finalization and submission<br />
to the International Joint Commission.<br />
Each panel also submitted a report to<br />
PLUARG on its own views and recommendations<br />
on panel-identified problems,<br />
as well as suggested solutions. PLUARG<br />
also held numerous public meetings<br />
throughout the Great Lakes basin to gain<br />
additional perspectives. The input from<br />
the panels and the public meetings were a<br />
major contribution to the final report and<br />
the PLUARG technical report series.<br />
Source: IJC 1978; PLUARG 1978.<br />
Great Lakes provincial, state and county jurisdictional boundaries during 1978 PLUARG study<br />
M<strong>IN</strong>NESOTA<br />
L A K E S U P<br />
E R<br />
I O R<br />
CANADA<br />
USA<br />
ONTARIO<br />
GEORGIAN BAY<br />
WISCONS<strong>IN</strong><br />
M I C H I G A N<br />
MICHIGAN<br />
LAKE<br />
HURON<br />
CANADA<br />
USA<br />
CANADA<br />
USA<br />
LAKE<br />
ONTARIO<br />
NEW YORK<br />
L A K E<br />
ILL<strong>IN</strong>OIS<br />
L A K E<br />
E R<br />
I E<br />
CANADA<br />
USA<br />
PENNSYLVANIA<br />
Great Lakes basin<br />
United States–Canada border<br />
Counties and districts<br />
<strong>IN</strong>DIANA<br />
OHIO<br />
Source: Great Lakes Commission.<br />
252 World Water Development Report 3
options inside the water box<br />
PART<br />
4<br />
Box 14.13<br />
Grass-roots water federations in Ecuador<br />
In the highlands of Ecuador, as in other<br />
Andean countries, greater competition for<br />
declining water resources led to increasing<br />
conflicts and applications to register water<br />
rights. The provincial water agencies responsible<br />
for water allocations were understaffed,<br />
and water resources privatization,<br />
viewed as ineffective by many, was making<br />
national management and water conflict<br />
resolution more difficult. The decentralization<br />
of power to provincial authorities –<br />
rather than to user collectives – exacerbated<br />
perceptions of inequality and injustice<br />
in the water sector. In July 2005 thousands<br />
of water users demonstrated in Riobamba,<br />
demanding removal of the state water<br />
agency staff for inequitable treatment<br />
of indigenous peasant and female water<br />
users. Many community organizations<br />
also gathered to establish a provincial<br />
water user federation (interjuntas), to build<br />
capacity among water user organizations<br />
and foster discussion forums on water<br />
policy-making and law. This intersystem<br />
organization now facilitates participation<br />
by some 280 irrigation and drinking water<br />
users organizations, all with mostly indigenous<br />
and small-farmer household constituencies.<br />
The interjuntas also facilitates<br />
conflict management among water users<br />
and among associated systems, especially<br />
between poor groups and landlords and<br />
between indigenous rural peoples and the<br />
state, through its centre for the defence of<br />
rights and mediation of conflicts.<br />
Other new water user organizations are<br />
starting to emerge. In Cotopaxi Province<br />
the Federation of Cotopaxi Irrigation Users<br />
now comprises 370 water user organizations<br />
composed of tens of thousands of<br />
minifundio (small land holding) water<br />
user families. Community water quantity<br />
and quality rights are represented at the<br />
national level through collaboration with<br />
the national water civil society platform,<br />
National Water Forum, and direct negotiations<br />
with the state. Federations such as<br />
interjuntas and the Federation of Cotopaxi<br />
Irrigation Users illustrate that equitable<br />
water distribution requires democratic<br />
decision-making and transparency of public<br />
investments and monitoring of government<br />
activities in the water sector.<br />
Source: Dávila and Olazával 2006; Boelens<br />
2008.<br />
Box 14.14<br />
Participatory irrigation management and the role of water user associations<br />
Participatory irrigation management engages<br />
irrigation users at all levels and in all<br />
aspects of managing irrigation schemes.<br />
Based on the belief that water users are<br />
best suited to manage their water resources,<br />
participatory irrigation management<br />
allows considerable flexibility in water<br />
management methods.<br />
India. Despite large investments, the<br />
irrigation schemes in the Indian state of<br />
Andhra Pradesh have been in serious trouble<br />
because of deteriorating infrastructure<br />
and low agricultural productivity. Policy<br />
reforms were introduced in 1996/97 to<br />
deal with irrigation concerns, including a<br />
threefold increase in water user charges,<br />
creation of water user associations and capacity<br />
building in water user associations<br />
across the state. Institutional reforms included<br />
the creation of farmer-government<br />
partnerships in irrigation operations and<br />
maintenance, consolidation of irrigation<br />
management transfer, new cost recovery<br />
methods, expenditure prioritization and<br />
capacity building for state agencies and<br />
water user associations.<br />
Water user association board members are<br />
elected by local water users. Transferring<br />
management authority to user groups has<br />
created a strong sense of ownership and<br />
empowerment. Still, some studies criticize<br />
the reforms for being more a top-down<br />
government programme than a farmerinitiated<br />
effort, and some suggest that<br />
establishment of the water user associations<br />
resulted in needless proliferation of<br />
community organizations, when the village<br />
government could have handled the<br />
task (a view not shared by water users).<br />
Some constraints to the new management<br />
system include limited power<br />
supply in rural areas, below design<br />
water discharge levels and continuing<br />
dependence on government funds in<br />
many cases. Nevertheless, there have<br />
been many positive results. Collection<br />
of water tariffs increased from 54% to<br />
65% during the first year of implementation.<br />
Management of irrigation canals<br />
by water user associations has resulted<br />
in more effective water use, with an additional<br />
52,361 hectares being irrigated<br />
in 1998 in the Tungabadra High Level<br />
Canal. Irrigation canal water-carrying<br />
capacity rose about 20%-30%, and agricultural<br />
productivity increased. There<br />
was also a dramatic reduction in farmer<br />
complaints.<br />
Mexico. Most farming in Mexico is irrigated,<br />
with water services provided by<br />
the central government since the end of<br />
World War II. By the end of the 1980s the<br />
government was subsidizing more than<br />
75% of the operation, maintenance and<br />
administration of irrigation districts – a<br />
non-sustainable outcome. As a result,<br />
farmers received relatively low-quality<br />
services for which they were reluctant to<br />
pay.<br />
Under an extensive programme of agricultural<br />
reform, management of irrigation<br />
districts was transferred to water user<br />
associations, with responsibility for irrigation<br />
systems to be shared between the<br />
associations and the then newly formed<br />
National Water Commission (CNA). After<br />
the transfer of irrigation management<br />
responsibilities, the rate of tariff collection<br />
more than doubled in five years, peaking<br />
in 1997 at 72%. Water fees were raised,<br />
sometimes more than 100%. The expectation<br />
was that the water user associations<br />
would become financially self-sufficient,<br />
generating enough resources to cover the<br />
costs of CNA. That has not yet happened,<br />
however, so those costs are still being<br />
covered by a ministerial fund. Nevertheless,<br />
the irrigation systems have become<br />
financially more self-sufficient. In the lower<br />
Bajo Rio Bravo Irrigation District, for example,<br />
self-sufficiency rose from 36% in 1989<br />
to 100% in 1994.<br />
Turkey. Both the State Hydraulic Works and<br />
the General Directorate of Rural Services<br />
are responsible for managing soil and<br />
water resources in Turkey. The State Hydraulic<br />
Works is responsible for large-scale<br />
irrigation and water infrastructure; the<br />
General Directorate of Rural Services, for<br />
on-farm development and small irrigation<br />
schemes. Water scarcity has been a problem<br />
since the 1960s, and operation and<br />
maintenance of the country’s irrigation<br />
systems was a financial and institutional<br />
burden for the government. Revenue<br />
collection was difficult, and water use was<br />
very high.<br />
With support of the World Bank the<br />
central government began transferring<br />
irrigation schemes, even large ones, to<br />
water user associations in 1993, to reduce<br />
costs for the central agencies. Following<br />
Mexico’s example, Turkey transferred<br />
1,350,000 hectares of irrigated land to<br />
the water user associations by 1997, with<br />
87% of irrigation projects transferred<br />
by 2007. This rapid transfer of irrigation<br />
(continued)<br />
Water in a changing world 253
PART<br />
4<br />
Chapter 14<br />
Box 14.14<br />
Participatory irrigation management and the role of water user associations (continued)<br />
management was motivated by the rising<br />
costs of irrigation schemes to the central<br />
government, the availability of on-the-job<br />
training programmes in Mexico and the<br />
United States, the commitment of State<br />
Hydraulic Works staff and clearly defined<br />
goals and pilot projects. The transfer has<br />
resulted in more efficient use of water<br />
resources, increased investments in new<br />
technologies, higher water user tariff<br />
collection rates (from 42% in 1993 to 80%<br />
in 1997), lower energy costs (approximately<br />
25%) and more equitable allocation of<br />
water resources.<br />
The legal status of water user associations<br />
remains to be defined, and central agency<br />
obligations to provide technical and<br />
administrative assistance at the beginning<br />
of a transfer still need to be clarified. In<br />
2004 the government abolished General<br />
Directorate of Rural Services as part of<br />
broader administrative reforms, delegating<br />
its responsibilities to the provincial<br />
governments.<br />
Source: Jairath 2000; Raju 2001; Johnson 1997;<br />
Palacios 1999; Garces-Restrepo, Vermillion, and<br />
Muñoz 2007; Blue Plan, MAP, and UNEP 1999;<br />
Döker et al. 2003.<br />
The participation requirements of article<br />
14 of the EU Water Framework Directive<br />
are an attempt to launch a broader discussion<br />
about participatory approaches, as<br />
illustrated in box 14.15.<br />
Addressing corruption and<br />
mismanagement in the water sector<br />
Corruption can have enormous social, economic<br />
and environmental repercussions,<br />
particularly for poor people. Water-related<br />
construction projects such as aqueducts,<br />
sewer systems and basic sanitation and<br />
wastewater treatment plants have become<br />
magnets for corruption in many developing<br />
countries, which have limited oversight<br />
capacity for efficient use of public resources.<br />
Transparency International’s Global<br />
Corruption Report 2008, prepared in collaboration<br />
with the Water Integrity Network,<br />
estimates that corruption in the water supply<br />
sector increases the investment costs of<br />
achieving the water supply and sanitation<br />
target of the Millennium Development<br />
Goals by almost $50 billion. 22<br />
In recent years preventing corruption has<br />
captured the attention of governments,<br />
private firms, civil society organizations and<br />
donors. A positive example is the formation<br />
of the Water Integrity Network, a global network<br />
promoting water integrity by coalition<br />
building. Several countries of the Southern<br />
Africa Development Community region<br />
have taken positive steps. Zambia established<br />
water watch groups in some cities to<br />
monitor relations between water regulators<br />
and service providers. South Africa set up<br />
telephone hotlines for consumer redress and<br />
complaints. Some districts in Malawi developed<br />
water board anticorruption policies<br />
aimed at improving water sector efficiency<br />
by preventing malpractice and addressing<br />
water consumer problems. 23 Box 14.16 provides<br />
additional examples of such efforts.<br />
Capacity development for more<br />
effective action<br />
Effective interactions between individuals,<br />
sector organizations and regulatory and<br />
administrative authorities are critical to<br />
advances in all areas. Administrative systems<br />
and sector policies in many countries<br />
are in need of considerable reform. This<br />
section offers some suggestions for governments<br />
and other water stakeholders to<br />
increase their capacity for effective action.<br />
Assessing institutional and human<br />
capacities<br />
A first step in improving services is to<br />
assess their ability to deliver more effective<br />
services and to prepare for future<br />
Box 14.15<br />
Public participation in water resources management<br />
The RhineNet project highlights the value of<br />
public participation. The project covered floodplain<br />
restoration, construction of fish ladders,<br />
flood protection and recreational enhancement.<br />
Public involvement in projects increased public<br />
acceptance, even among those who might be<br />
considered ‘losers’ in the process.<br />
The project plans for reactivating the Saar River<br />
floodplains in Hostenback, Germany, provide<br />
an example. The plans were presented to the<br />
mayor of Wadgassen and the general public.<br />
The project received widespread support, with<br />
citizens showing considerable flexibility over details<br />
of the required construction. One important<br />
agreement called for use of a much less used<br />
alternative path for the estimated 8,000 trucks<br />
that would be involved in the project’s earth<br />
removal activities. Meetings and discussions<br />
were held regularly during the project, providing<br />
opportunities for citizens to voice their concerns,<br />
and events were reported in local bulletins,<br />
newspapers and electronic media. An important<br />
finding was that such efforts require considerable<br />
time for interviews and discussions with the<br />
individuals affected by the project – discussions<br />
that could not be replaced by media reports or<br />
press conferences.<br />
Source: Lange 2008.<br />
254 World Water Development Report 3
options inside the water box<br />
PART<br />
4<br />
Box 14.16<br />
Responding to corruption and mismanagement in the water sector – examples from<br />
Colombia, India and Lesotho<br />
Development of anticorruption agreement<br />
with Colombian water pipe manufacturing<br />
companies. The Colombian Association of<br />
Environmental and Sanitary Engineers,<br />
whose affiliated water pipe manufacturing<br />
companies had a 95% share of the national<br />
market and a monopoly on bids in<br />
public tenders for water supply and sewer<br />
systems, undertook an anticorruption<br />
initiative as part of a sectoral antibribery<br />
agreement. The association, together with<br />
Transparency International-Colombia,<br />
worked to develop an agreement among<br />
pipe manufacturers based on Transparency<br />
International’s Business Principles<br />
to Counteract Bribery. The agreement,<br />
signed in April 2005, resulted in substantial<br />
reductions in bid award prices, thereby<br />
reducing the scope for bribery.<br />
The agreement was developed in reaction<br />
to the lack of transparency in the pipe<br />
business sector, particularly in public sector<br />
procurement, which resulted in overpriced<br />
products and substandard quality<br />
in public projects and utilities, creating<br />
an environment of mistrust. The situation<br />
eventually became untenable for the<br />
companies and the trade association, as<br />
transaction costs became unsupportable.<br />
Under the agreement each company prepared<br />
a general anticorruption policy and<br />
specific guidelines for each area specified<br />
in the Business Principles to Counteract<br />
Bribery (pricing and purchasing, distribution<br />
and sales schemes, implementation<br />
mechanisms, internal controls and audits,<br />
human resources management, protection<br />
of ‘whistle blowers’ and communications,<br />
internal reporting and consulting). The<br />
agreement also laid out the roles of an<br />
Ethics Committee and a Working Group<br />
tasked to supervise implementation, as<br />
well as extensive legal and economic powers<br />
for dealing with companies that fail to<br />
comply. A similar agreement was signed in<br />
Argentina in December 2005, and agreements<br />
also are being considered by Brazil<br />
and Mexico.<br />
Citizen report cards for improved water<br />
services in Bangalore, India. To improve the<br />
quality of underperforming public water<br />
and sewer utilities in Bangalore, India, the<br />
national Public Affairs Centre established a<br />
system of benchmarks and citizen ‘report<br />
cards’. These report cards triggered a series<br />
of reforms enhancing public sector accountability<br />
and responsiveness. Although<br />
the first report card in 1994 gave low ratings<br />
to all major city service providers, only<br />
a few service providers acknowledged the<br />
problems and took corrective actions. The<br />
second report card in 1999 indicated partial<br />
improvement in some services, while<br />
the third report card in 2003 revealed substantial<br />
improvements by almost all service<br />
providers, as well as a visible decline in<br />
corruption. Satisfaction levels rose dramatically,<br />
from 4% in 1994 to 73% in 2003.<br />
Both supply and demand drivers of<br />
change contributed to this surprising<br />
turnaround. The trigger for public action<br />
seems to have been the public scrutiny<br />
and publicity attending the report cards,<br />
leading to important interventions on<br />
the supply side. A strategic decision of<br />
the state government was to establish a<br />
new public-private partnership forum to<br />
catalyse action and assist service providers<br />
in upgrading their services and<br />
responsiveness. The political support and<br />
commitment of the state’s chief minister,<br />
the innovative practices resulting from<br />
the partnership forum, the active role of<br />
external catalysts (civil society groups and<br />
donors) and the learning experiences from<br />
initial responses contributed to the better<br />
performance. An open and democratic<br />
society is a prerequisite for the use of this<br />
monitoring and accountability tool.<br />
Lesotho highlands project trials. The Lesotho<br />
Highlands Water project, the world’s largest<br />
international water transfer project,<br />
transfers water from the Orange River<br />
to the Vaal River, providing extra water<br />
to Johannesburg, South Africa. Lesotho<br />
receives royalties for the water ($31 million<br />
in 2004, about 5% of its GDP). Under<br />
phase 1 of the project four dams and 110<br />
kilometres of tunnels were completed at a<br />
cost of about $2 billion.<br />
The first chief executive of the Lesotho<br />
Highlands Development Authority,<br />
charged with overseeing the project, was<br />
tried on bribery and fraud charges in<br />
2001. His subsequent conviction was an<br />
important victory in the fight against corruption<br />
and illustrated what a determined<br />
government can do in fighting corruption.<br />
Recognizing that bribery has both a demand<br />
and supply component, the Lesotho<br />
government also brought charges against<br />
the multinational companies paying the<br />
bribes. Three major firms were convicted<br />
by the High Court of Lesotho, and all three<br />
were assessed fines. The World Bank also<br />
barred one company from bidding on<br />
future projects. The trials for future bribery<br />
prosecutions established several important<br />
precedents related to what the prosecution<br />
has to prove in regard to bribery,<br />
where the crime took place (determined<br />
by the location of the impacts of the<br />
crime) and what degree of financial transparency<br />
is required to prove the crime (a<br />
major breakthrough was the prosecution’s<br />
access to Swiss banking records of the accused<br />
companies).<br />
Source: Balcazar 2005; Stålgren 2006; Thampi<br />
2005; Stålgren 2006; Earle and Turton 2005.<br />
uncertainties. Such assessments can cover<br />
part of a sector (for example, management<br />
of river basins or sanitation) or focus on<br />
institutional architecture and capacity (for<br />
example, the education system, community<br />
management and the legal framework).<br />
Improving a weak institutional environment<br />
is not a linear process. 24 It often<br />
requires efforts on several fronts, focusing<br />
on alleviating acute problems while<br />
creating the conditions for more favourable<br />
change over time. The United Nations<br />
Development Programme, for example,<br />
supported rapid water sector assessments<br />
in Bolivia, China, Ghana, Mali, Mexico<br />
and Peru, providing modest international<br />
support to local agencies to assess the<br />
challenges to their water sector and each<br />
country’s capacities to devise new strategies<br />
with prioritized interventions. 25<br />
In China the Ministry of Water Resources<br />
and the Guizhou Provincial Administration<br />
worked on an institutional performance<br />
assessment, focusing on strengths<br />
and weaknesses in the economic and<br />
institutional aspects of water management,<br />
such as pricing, river basin management<br />
and stakeholder involvement in<br />
integrated water resources management.<br />
In Mexico the water initiative added to the<br />
National Water Commission’s broader efforts<br />
to improve the water sector’s overall<br />
performance. The Peruvian assessment<br />
guided a parliamentary debate on sectoral<br />
Water in a changing world 255
PART<br />
4<br />
Chapter 14<br />
governments will<br />
need to rely more<br />
on an informed<br />
and capable civil<br />
society whose<br />
role in water<br />
management<br />
complements<br />
the work of<br />
government<br />
agencies<br />
priorities, helping reform agencies and<br />
generating new skill mixes. 26 In Indonesia<br />
the 1998-2004 financial crisis triggered<br />
a deep institutional and administrative<br />
reform of the water sector, which is crucial<br />
to its economy, emphasizing decentralized<br />
decision-making, participatory irrigation<br />
management, cost recovery and cuts in<br />
staffing.<br />
Strengthening institutional<br />
arrangements and capacity to<br />
support an agenda of change<br />
Changes in society and in the environment<br />
call for regular adjustments of the institutional<br />
architecture of the water sector.<br />
Regular performance and capacity reviews<br />
can identify needed reforms and promote<br />
agreement on capacity development for implementing<br />
the reform. Uganda’s National<br />
Water and Sewerage Corporation (NWSC)<br />
transformed itself from an organization<br />
plagued by unaccounted-for water, weak<br />
billing practices and high operating costs<br />
to one with steadily improving performance<br />
since 1998. NWSC separated operations<br />
and maintenance from performance<br />
monitoring and regulation. The capacity of<br />
utilities to work with this system was developed<br />
incrementally by multidisciplinary<br />
teams, beginning with simple performance<br />
contracts and upgrading to more complex<br />
arrangements. NWSC became a ‘learning<br />
organization’, creating an environment<br />
where managers must account for performance<br />
against goals and staff are expected to<br />
embrace innovation and tackle problems<br />
(see box 14.23 later in the chapter).<br />
Engaging with civil society in<br />
developing its capacity<br />
With the large numbers of water management<br />
stakeholders, governments are<br />
increasingly constrained in what they can<br />
achieve alone. They will need to rely more<br />
on an informed and capable civil society<br />
whose role in water management complements<br />
the work of government agencies.<br />
As civil society becomes more water literate,<br />
it will come to a clearer understanding<br />
of the importance of water issues and lend<br />
solid support to water sector initiatives.<br />
That requires broad access to information<br />
and the capability to engage with governments<br />
on water service delivery issues –<br />
often requiring capacity-building efforts to<br />
be effective.<br />
Many resources are available for community<br />
and civil society capacity development<br />
in water and sanitation. Examples<br />
of Internet-accessible resources include<br />
a comprehensive collection of capacity<br />
building materials on ecological sanitation<br />
emerging from the 4th World Water<br />
Forum in Mexico in 2006; 27 material<br />
on gender, water and capacity building<br />
provided by the Gender and Water Alliance;<br />
28 an overview paper and guidelines<br />
for improving knowledge management at<br />
the personal and organizational level in<br />
the water and sanitation sector; 29 and a<br />
conceptual introduction to water sector alliances,<br />
case studies and lessons in scaling<br />
up innovations in water, sanitation and<br />
hygiene, both prepared by the International<br />
Water and Sanitation Centre. 30<br />
Stimulating professional knowledge<br />
Water sector professionals require a sophisticated<br />
understanding of the hydrologic<br />
cycle and its variability. They also need<br />
a better understanding of the relationship<br />
between water use and sustainable<br />
economic development and water-related<br />
interactions in society, and of the needs of<br />
decision-makers. Non-professionals often<br />
require a better understanding of their<br />
interactions with and influences on water<br />
systems. This knowledge can come from<br />
research, the traditional domains of local<br />
communities and education, training and<br />
focused workshops. But the knowledge<br />
is often fragmented, held by a growing<br />
number of water stakeholders, each with<br />
part of the solution. Thus, communication<br />
is critical for building the knowledge base<br />
and institutional and human capacities<br />
needed to forge political consensus.<br />
Networks are becoming increasingly important<br />
knowledge pools and mechanisms<br />
for knowledge dissemination (box 14.17),<br />
exchange and management. They must be<br />
structured, managed and funded according<br />
to their purpose (research, sharing of<br />
professional experience, training and so<br />
on). Networks are well suited to identifying<br />
and articulating large-scale, complex<br />
problems and to offering solutions and<br />
best practices tested in other places.<br />
Learning alliances are groups of representative<br />
stakeholders with a focus on developing<br />
jointly owned approaches to problems<br />
that create a broader sense of ownership<br />
and lead to more rapid implementation.<br />
The Euro-Med Participatory Water Resources<br />
Scenarios (EMPOWERS), a regional<br />
pilot project led by Care International–UK<br />
from 2003 to 2007, sought to increase<br />
sustainable access to water for vulnerable<br />
populations in Egypt (where water demands<br />
exceed supplies), in Jordan (which<br />
has one of the world’s lowest per capita<br />
water levels) and the West Bank and Gaza<br />
(where access to water is strictly controlled<br />
256 World Water Development Report 3
options inside the water box<br />
PART<br />
4<br />
Box 14.17<br />
Networking to share water resources management<br />
experiences<br />
Cap-Net is a network of 20 national and regional<br />
capacity-building networks and three global networks<br />
committed to capacity building in water<br />
resources management. Most of the member<br />
networks are informal voluntary associations of<br />
institutions and individuals committed to building<br />
capacity to address local needs and priorities.<br />
Cap-Net uses its global network structure to<br />
rapidly share international and regional knowledge.<br />
It facilitates knowledge development and<br />
exchange, supports the delivery of capacity<br />
development services to meet local priorities<br />
and brings expertise from networks and the<br />
international level to neglected areas. Having<br />
identified economic and financial instruments for<br />
implementing integrated water resources management<br />
as a neglected area, Cap-Net used its<br />
network experts to develop a training package<br />
structured to allow local adaptation. The training<br />
manual was tested, revised and translated into<br />
four languages within one year and has been<br />
implemented in Africa, Asia and Latin America<br />
through the partner networks.<br />
The Regional Centre for Urban Water Management<br />
in Tehran is an organization of 13 countries<br />
and six international organizations whose mission<br />
is to transfer practical scientific knowledge<br />
and develop capacities in all dimensions of urban<br />
water management, to promote sustainable<br />
development and enhance human well-being<br />
and to facilitate integrated, transboundary water<br />
management. Its governing board comprises<br />
10 water-related ministers (from Bangladesh,<br />
Egypt, India, Iran, Kuwait, Oman, Pakistan, Syria,<br />
Tajikistan and Yemen) and high-level representatives<br />
of three international organizations (the<br />
UNESCO Institute for Water Education, the International<br />
Water Academy and the International<br />
Water Association).<br />
Source: Cap-Net 2008 and www.cap-net.org.<br />
Increasingly, water<br />
stakeholders<br />
are being linked<br />
through online<br />
knowledge<br />
networks and<br />
partnerships<br />
linking researchers<br />
addressing<br />
similar issues<br />
by an external authority). The International<br />
Centre for Water Hazard and Risk<br />
Management (ICHARM), an Asia-Pacific<br />
water knowledge hub of the Asian Development<br />
Bank, provides hazards mapping<br />
and tsunami training courses.<br />
The Sustainable Water Management<br />
Improves Tomorrow’s Cities Health<br />
(SWITCH) project is a major research<br />
partnership for innovation in integrated<br />
urban water management in implementing<br />
action-oriented, water demand-led<br />
research programs. The project encourages<br />
learning alliances to better define the<br />
research agenda and initiate research in<br />
aspects of the urban water cycle to help<br />
cities improve water sector integration and<br />
scaling-up impacts. 31 SWITCH has led to<br />
the establishment of learning alliances in<br />
10 cities around the world.<br />
In the Netherlands government institutions<br />
for surface water, groundwater and<br />
coastal protection were merged to improve<br />
their output. Innovation and research also<br />
were boosted in countries in Southern and<br />
Eastern Africa through WaterNet, linking<br />
some 50 university departments and<br />
institutions with common interests and<br />
expertise in water-relevant topics. Pooling<br />
their knowledge allows them to cover all<br />
the major aspects of water resources management<br />
(such as hydrology, environmental<br />
engineering, economics, law and water<br />
and sanitation technologies).<br />
In India the Solution Exchange, which<br />
links people across the country and the<br />
globe, harnesses the power of communities<br />
of practice to leverage the knowledge<br />
and experience of multiple development<br />
practitioners for the common objective<br />
of problem-solving. In Madhya Pradesh,<br />
India, the UN-HABITAT Programme on<br />
Sustainable Cities works in four cities to<br />
improve and expand urban water supply,<br />
sewerage and sanitation, water drainage<br />
and solid waste management. The<br />
programme seeks to influence water use<br />
practices, policies and measures away from<br />
traditional approaches, which increase<br />
pressures on water resources and lead to<br />
overexploitation of groundwater, and toward<br />
innovative demand management to<br />
optimize available water in the municipal<br />
water supply system. The programme consolidated<br />
responses to a survey on experiences,<br />
suggestions and best practices from<br />
other parts of India, translated them into<br />
Hindi and circulated them at the Madha<br />
Pradesh State Parliamentarians Forum for<br />
Water.<br />
Information and communication systems<br />
are mostly Internet-based, offering new<br />
tools for multistakeholder information<br />
sharing and communication. By providing<br />
access to scenario and forecasting tools<br />
and facilitating communication across<br />
administrative levels (from the local to the<br />
national and regional), these tools are well<br />
suited to facilitate negotiation.<br />
Increasingly, water stakeholders are being<br />
linked through online knowledge networks<br />
and partnerships – communities of<br />
practice – linking researchers addressing<br />
Water in a changing world 257
PART<br />
4<br />
Chapter 14<br />
Water resources<br />
management plans<br />
can be difficult<br />
to fund and<br />
implement without<br />
the involvement<br />
of water users<br />
similar issues. Simple tools, such as e-mail<br />
lists, are the preferred low-technology<br />
avenue for this activity.<br />
Local stakeholders are usually the first to<br />
experience and address local problems<br />
and to find local solutions. Decisionmakers<br />
can learn from this local knowledge<br />
and apply its lessons to building the<br />
capacity of local institutions and civil<br />
society (box 14.18). Informed decisionmaking<br />
requires a balanced combination<br />
of top-down (often larger-scale) and<br />
bottom-up (often smaller scale) approaches<br />
and procedures.<br />
Stimulating public awareness<br />
Increasing public awareness about water<br />
resources also facilitates sustainable use.<br />
Water resources management plans can be<br />
difficult to fund and implement without<br />
the involvement of water users.<br />
One way to promote public knowledge is<br />
through science and education centres<br />
that compile, analyse and disseminate<br />
information on water resources. Such<br />
centres often focus on identifying and<br />
disseminating information on water system<br />
problems and sustainable use. They<br />
often consider the economic, ecosystem<br />
and cultural importance of specific water<br />
systems and their resources; direct and<br />
indirect uses and values and promising<br />
tools and strategies for management and<br />
lessons from case studies. They also provide<br />
valuable region-specific information,<br />
such as the public and media awareness<br />
campaign by the Yemen National Water<br />
Resources Authority, including the Yemen<br />
Water Awareness video. 32 Information<br />
centres such as the Lake Biwa Museum<br />
(Japan), Balaton Limnological Research<br />
Institute (Hungary) and Leahy Center<br />
of Lake Champlain (United States) focus<br />
their attention on lake basins. 33 The<br />
centres, sponsored by private foundations,<br />
corporations, government agencies, nongovernmental<br />
organizations and academic<br />
institutions, demonstrate and promote the<br />
benefits of advancing scientific, educational<br />
and community development goals<br />
for water systems.<br />
Public education and awareness raising<br />
can also be as simple as informing water<br />
stakeholders about changes in work routines<br />
or personal habits that can alleviate<br />
problems associated with unsustainable<br />
use of water resources (see chapter 2).<br />
Greater public awareness is facilitated by<br />
making details of water system problems<br />
and corrective programmes readily available<br />
to the public through the public education<br />
system, the information media and<br />
non-governmental organizations. 34<br />
The Emilia-Romagna Region in Italy<br />
launched a regional communication<br />
campaign on water conservation in<br />
2004 called “Acqua, risparmio vitale”<br />
(Water, vital saving). The campaign was<br />
relaunched in 2008 with a new slogan,<br />
“Mezzo pieno o mezzo vuoto? Comunque la<br />
pensi, l’acqua va risparmiata!” (Half full<br />
or half empty? Whatever you think, save<br />
water!). This education strategy uses a<br />
combination of brochures for the general<br />
public, television and radio spots and<br />
advertisements on city buses. 35 Water<br />
managers can also use such communication<br />
activities to inform the key decisionmakers<br />
working outside the water managers’<br />
domain (see chapter 15).<br />
Developing appropriate<br />
solutions through innovation<br />
and research<br />
Technological innovation covers a broad<br />
field, from technical issues to financial<br />
considerations, water service models and<br />
water governance issues (policy, sustainable<br />
financing, cultural values, political<br />
realities, law and so on). It can enable<br />
rapid and significant changes within the<br />
water sector. And it can improve existing<br />
systems (better hand pumps, for example)<br />
and develop new ways to address water<br />
issues.<br />
Box 14.18<br />
Incorporating local knowledge in networks – the Integrated<br />
Watershed Management Network of Eastern Africa<br />
The Integrated Watershed Management Network<br />
(IWMNET), is a three-year (2007-10) capacitybuilding<br />
initiative for integrated watershed<br />
management in Eastern Africa involving German<br />
and Eastern African universities. Activities include<br />
specialized training on integrated water resources<br />
management and related issues and support for<br />
ongoing water sector reforms in Ethiopia, Kenya,<br />
Tanzania and Uganda. Water user associations, for<br />
example, are assisted in drafting and executing<br />
subcatchment management plans and in sharing<br />
their experience in drafting participatory catchment<br />
management plans. An online e-learning<br />
component makes all information accessible to<br />
students and professionals, even in rural areas.<br />
Source: iwmnet-eu.uni-siegen.de and www.iwmnet.eu/<br />
index.html.<br />
258 World Water Development Report 3
options inside the water box<br />
PART<br />
4<br />
Developing a capability for<br />
innovation<br />
Experience suggests that at least three key<br />
factors have contributed to the innovation<br />
driving the rapid economic transformation<br />
of many emerging market economies. One<br />
is investing heavily in basic infrastructure<br />
(roads, schools, water supplies, sanitation<br />
facilities, irrigation systems, health centres,<br />
telecommunications, energy resources<br />
and the like) as the foundation for technological<br />
learning. A second is developing<br />
and nurturing small and medium-size<br />
enterprises, which can supply local operational,<br />
repair and maintenance expertise<br />
and technicians. A third is developing and<br />
nurturing institutions of higher education<br />
(engineering and technological academies,<br />
professional engineering and technological<br />
associations, industrial and trade<br />
associations and the like). 36 Most of these<br />
efforts are outside the scope of water managers’<br />
responsibilities (some are discussed<br />
in chapter 15).<br />
Business enterprises and non-governmental<br />
organizations can be a focus for<br />
learning. 37 An example is the innovative<br />
adaptation for use in Cambodia of ceramic<br />
filters, long used elsewhere to remove contaminants<br />
from water. Because most Cambodians<br />
lack access to microbiologically<br />
safe water at point of use, household-based<br />
water treatment is critical for protecting<br />
them from waterborne diseases. Most<br />
Cambodians must still collect water, store<br />
it for household use and treat it themselves<br />
to ensure safe drinking water. Potters for<br />
Peace, a non-governmental organization,<br />
developed an innovative use of ceramic<br />
filters, inventing a low-cost, on-the-spot<br />
production method using clay and sawdust<br />
treated with colloidal silver to increase<br />
bactericidal properties. Potters for Peace<br />
now trains others to operate filter-making<br />
facilities in Cambodia, Cuba, El Salvador,<br />
Ghana, Guatemala, Honduras, Indonesia,<br />
Kenya, Mexico, Sudan and Yemen. 38 Water<br />
management techniques also can be used<br />
in innovative ways to address a range of<br />
issues (box 14.19).<br />
Because irrigation is the single largest<br />
water user on a global scale, improved irrigation<br />
technology is a good example of<br />
using technology to reduce water demands<br />
by improving water use efficiency (box<br />
14.20).<br />
Linking research and development in<br />
the developing world<br />
Expanding demand-driven research capacity<br />
in developing countries is essential for<br />
reaching a critical mass of people engaged<br />
in research and development who can advance<br />
economic development. 39 The Paris<br />
Declaration on Aid Effectiveness of 2005,<br />
an international agreement affirmed by<br />
more than 100 ministers, heads of agencies<br />
and other senior officials, stressed that<br />
developing countries must become more<br />
capable of solving their own problems,<br />
Most of the key<br />
factors that have<br />
contributed to the<br />
innovation driving<br />
the rapid economic<br />
transformation of<br />
many emerging<br />
market economies<br />
are outside the<br />
scope of water<br />
managers’<br />
responsibilities<br />
Box 14.19<br />
Using water management to preserve biodiversity and economic livelihoods – Kafue<br />
Flats, Zambia<br />
Large dams can disrupt the natural water<br />
cycle and the ecosystems that rely on it.<br />
Kafue Flats in Zambia illustrates the use of<br />
technological innovation and cooperation<br />
to alleviate such disruptions.<br />
Kafue Flats is a rich wildlife habitat occupying<br />
6,500 square kilometres along<br />
the Kafue River, a major tributary of the<br />
Zambezi River. It sustains the livelihoods of<br />
local people engaged in hunting, fishing<br />
and cropping when floods recede on the<br />
flats at the end of the wet season. In 1978<br />
the Itezhi-tezhi Dam was built upstream<br />
of the Kafue Gorge hydroelectric dam,<br />
Zambia’s primary source of power, to store<br />
wet season peak flows to maximize hydropower<br />
production at the hydroelectric<br />
dam. The Itezhi-tezhi Dam ended the beneficial<br />
wet season flooding of Kafue Flats,<br />
adversely affecting the 300,000 people<br />
who rely on it for their livelihoods.<br />
In 1999 the Zambian government and<br />
Zambia Electric Supply Corporation<br />
(ZESCO), in cooperation with WWF, local<br />
people and commercial farmers, initiated<br />
a project to restore a more natural flow to<br />
water releases from the Itezhi-tezhi Dam.<br />
An integrated water resources management<br />
study was undertaken in 2002,<br />
including development of a Kafue River<br />
basin hydrology model. The model was<br />
linked to real-time data from rainfall and<br />
river gauging stations in the catchment to<br />
predict water flows and reservoir levels.<br />
Based on this modelling exercise, agreement<br />
was reached among all the partners<br />
in 2004 to implement new dam operating<br />
rules. A major water flow mimicking the<br />
natural wet season flooding pattern was<br />
released for the first time in early 2007,<br />
and modules have been launched for wetlands<br />
rehabilitation, focusing on infrastructure<br />
development, tourism enhancement<br />
and community-based natural resources<br />
management.<br />
The long-term results are expected to<br />
include improved ecological health for<br />
Kafue Flats and improved livelihoods for<br />
local people (particularly increased fish<br />
and pasture productivity), development<br />
of a wildlife-based tourism industry and<br />
sustained irrigation capacity. The hydroelectric<br />
production potential of the Kafue<br />
Gorge Dam is expected to be maintained<br />
or to increase. Discussions are under way<br />
on scaling up the environmental flows<br />
model to the other dams in the watershed<br />
(Kafue Gorge, Cahorra Bassa and Kariba)<br />
to extend benefits to the entire course of<br />
the rivers in Zambia and Mozambique.<br />
Preparations also are under way on a joint<br />
operations and management strategy for<br />
the three dams, involving the Zambezi<br />
River Authority, the Joint Operational<br />
Technical Committee for Cahorra Bassa<br />
and Kariba Dams, and the Southern Africa<br />
Development Community agreement for<br />
an integrated water resources management<br />
strategy for the Zambezi River under<br />
the auspices of its shared water protocol.<br />
Source: WWF 2008.<br />
Water in a changing world 259
PART<br />
4<br />
Chapter 14<br />
Reliable and<br />
accurate water<br />
resources<br />
information and<br />
data, by reducing<br />
uncertainty about<br />
water resources,<br />
help decisionmakers<br />
make<br />
more reliable<br />
and politically<br />
persuasive<br />
assessments of<br />
water risks<br />
Box 14.20<br />
Using irrigation technology to increase water use efficiency<br />
Irrigation water can be delivered to crops<br />
through surface, sprinkler and drip irrigation systems.<br />
Although introducing new irrigation technology<br />
typically increases costs, it also increases<br />
water use efficiency, resulting in water savings.<br />
A California study, for example, found that water<br />
use efficiency ranged from 60%-85% for surface<br />
irrigation to 70%-90% for sprinkler irrigation and<br />
88%-90% for drip irrigation. Potential savings<br />
would be even higher if the technology switch<br />
were combined with more precise irrigation<br />
scheduling and a partial shift from lower-value,<br />
water-intensive crops to higher-value, more<br />
water-efficient crops.<br />
China introduced water-saving measures and<br />
irrigation system modernization in agriculture<br />
in the 1990s. China has some 400 large<br />
irrigation systems (each with an irrigated area<br />
of more than 20,000 hectares), which account<br />
for about a quarter of the total irrigated area of<br />
56 million hectares. Modernization included the<br />
application of new materials and technologies<br />
to upgrade irrigation system structures and the<br />
application of modern irrigation concepts and<br />
institutions to improve irrigation management.<br />
Water conveyance and irrigation intervals have<br />
been shortened, and water losses have been<br />
reduced. Agricultural output in the programme<br />
area increased 46%, even though irrigation<br />
withdrawals have fallen from about 80% of<br />
total water withdrawals in 1980 to 60% today, a<br />
dramatic reduction.<br />
Source: Cooley, Christian-Smith, and Gleick 2008; ICID<br />
2008.<br />
including through stronger research<br />
capacities that will enable them to absorb<br />
and use knowledge from other sources and<br />
countries as well as to advance knowledge<br />
(box 14.21).<br />
Data and information needs<br />
Reliable and accurate water resources<br />
information and data, by reducing uncertainty<br />
about water resources, help decisionmakers<br />
make more reliable and politically<br />
persuasive assessments of water risks. More<br />
detailed and accurate information also<br />
guides better choices on needed infrastructure<br />
and makes public institutions more accountable<br />
for the impacts of their actions.<br />
Water resources data and<br />
information<br />
Water resources data include information<br />
on the quantity and quality of water<br />
resources and also on governance. Such<br />
data are crucial to a wide range of water<br />
resources stakeholders.<br />
The World Bank conducted an assessment<br />
of the water supply and sanitation sectors<br />
in Ethiopia, including progress towards<br />
the Millennium Development Goals. 40 The<br />
amount and quality of data available for<br />
the assessment from different regions varied<br />
considerably, and some data were contradictory.<br />
The data thus could not be used<br />
for a sound public review of expenditures<br />
Box 14.21<br />
Research links in developing countries<br />
The Water Law and Indigenous Rights programme<br />
(2001-07) began as an international<br />
action-research alliance to inform the debate on<br />
peasant, indigenous and customary rights in the<br />
Andean region and to facilitate action on local,<br />
national and international platforms. A major<br />
objective was to better understand local water<br />
rights and water management. The strategy<br />
was to focus on research and action, together<br />
with local, regional and international networks<br />
(both indigenous and non-indigenous), while<br />
training policy-makers, water professionals and<br />
grass-roots leaders. The programme deepened<br />
water policy debates on recognition of water<br />
rights, enabling better legislation and more<br />
democratic water governance and management<br />
policies. Network participants have extended<br />
their activities into new policy research and<br />
action networks on the plurality of water rights,<br />
multiscale water user organizations and ways<br />
to strengthen and recognize such processes<br />
through training and user-oriented intervention<br />
strategies.<br />
Concertación (2006-11) is an interdisciplinary<br />
research and capacity-building network<br />
concentrating on peasant empowerment and<br />
indigenous water management, with a focus on<br />
the Andean region. The Water Research Fund for<br />
Southern Africa, established in 1999, is available<br />
to researchers and institutions in any Southern<br />
Africa Development Community country. A peer<br />
review system ensures that high quality research<br />
proposals are selected for funding. A board<br />
consisting of researchers with different professional<br />
backgrounds and from different countries<br />
formulates the fund’s research policy and defines<br />
priority areas. Although external donors are the<br />
main source of funding, rather than the research<br />
end users, the fund is exploring ways to better<br />
link societal demands to the research community<br />
and of reviewing its role in promoting this<br />
connection so that the supported research is<br />
responsive to the region’s needs.<br />
Source: Rap 2008; www.eclac.cl/drni/proyectos/walir/<br />
homee.asp; www.iwsd.co.zw/index.cfm.<br />
260 World Water Development Report 3
options inside the water box<br />
PART<br />
4<br />
in these sectors. The study revealed that<br />
most town water utilities do not have<br />
proper accounts, data on sanitation are<br />
absent or fragmentary and work by nongovernmental<br />
organizations in the water<br />
supply and sanitation sectors is uncoordinated<br />
and undertaken without collaboration<br />
with responsible national authorities.<br />
The assessment also found that funding<br />
of these sectors, on both a sectoral and<br />
per capita basis, was low, resulting in poor<br />
water service throughout the country.<br />
Water resources monitoring<br />
Data on technical and scientific aspects of<br />
water resources management often come<br />
from monitoring activities, including<br />
measurements of chemical, biological and<br />
other parameters of the quantity or quality<br />
of water systems. Such data can illustrate<br />
the limits of the water resources, expose<br />
hard-to-see connections and contribute<br />
to innovative solutions to water resources<br />
problems, as illustrated in box 14.22.<br />
Monitoring networks are inadequate and<br />
weakening (see chapter 13). Although<br />
modelling is not a substitute for accurate<br />
field measurements, modelling experience<br />
has advanced to the extent that some data<br />
can now be generated with models.<br />
The Lake Naivasha Riparian Association<br />
in Kenya used modelling to investigate<br />
the potential impacts of water abstractions<br />
to supply intensive horticultural activities<br />
that began in the early 1980s. Association<br />
members were concerned that the<br />
horticultural activities were responsible<br />
for falling lake water levels. Horticultural<br />
interests denied the claim, pointing out<br />
that the lake was higher than it had been<br />
in the 1950s, prior to development of their<br />
industry. The modelling work considered<br />
the contributions of surface and groundwater<br />
to the lake levels, clearly illustrating<br />
that the declining lake levels coincided<br />
with commencement of horticultural<br />
activities in 1982. The results were<br />
ultimately accepted by all stakeholders,<br />
including the horticulturalists, resulting<br />
in their working more closely together to<br />
promote a stronger conservation ethic for<br />
the lake. 41<br />
Traditional knowledge and experiences<br />
of the people directly affected by a water<br />
system, whether as members of its shoreline<br />
community or as economic actors<br />
dependent on it for their livelihoods, are<br />
also important. Traditional knowledge can<br />
come from the legends and oral histories<br />
of indigenous people. In some areas<br />
such memories may be the only source<br />
of information on the history of a water<br />
system. The Ugandan government, for<br />
example, used local knowledge to identify<br />
and protect important fish breeding areas<br />
on the eastern shore of Lake Albert on the<br />
Uganda-Democratic Republic of Congo<br />
border. 42<br />
Financing<br />
The need for sustainable financing is one<br />
of the most persistent concerns in water<br />
The need for<br />
sustainable<br />
financing is one<br />
of the most<br />
persistent concerns<br />
in water resources<br />
decision-making<br />
Box 14.22<br />
Using monitoring information in water resources management<br />
Information from monitoring activities can be<br />
used to expose the limits of water resources, reveal<br />
hidden connections and develop innovative<br />
solutions to water resources problems. Data on<br />
fishing intensity and gear were used in declaring<br />
temporary fishing moratoriums for Lakes<br />
Baringo and Naivasha in Africa and in setting<br />
restrictions on allowable fishing technologies for<br />
Lake Victoria. These measures contributed to the<br />
recovery or significant improvements of these<br />
fisheries.<br />
Biophysical processes in water systems are<br />
complex and often expressed in small incremental<br />
changes that are not readily observable.<br />
Detailed measures and investigations at Lake<br />
Biwa, Japan, showed that declining snowfall over<br />
several decades, combined with a weakening<br />
water profile in the lake, had led to a decline in<br />
the dissolved oxygen levels in the lake’s bottom<br />
waters, increasing lake eutrophication and pointing<br />
to the potential effects of global warming on<br />
the lake.<br />
Field monitoring in the Lake Chad basin in Africa<br />
demonstrated that wet season conditions could<br />
be simulated by water releases from the Tiga<br />
and Challawa Dams and that artificial flooding of<br />
wetlands could be undertaken with the existing<br />
infrastructure.<br />
Several years of monitoring data from Lake Ohrid<br />
in the Former Yugoslav Republic of Macedonia<br />
suggested that the phytoplankton and zooplankton<br />
communities in the lake were changing,<br />
consistent with its increasing eutrophication and<br />
making an unequivocal case for nutrient control.<br />
Monitoring data collected from Lake Dianchi<br />
in China demonstrated the success of policies<br />
to reduce the external nutrient load from local<br />
enterprises. Such post-project monitoring can<br />
help marshal support for the often considerable<br />
outlays required for water resources management<br />
programmes and activities.<br />
Source: ILEC 2005; World Bank 2005.<br />
Water in a changing world 261
PART<br />
4<br />
Chapter 14<br />
Small-scale<br />
water providers<br />
typically include<br />
entrepreneurs<br />
filling a void left by<br />
the market failure<br />
of the formal<br />
water sector and<br />
small companies<br />
providing services<br />
to municipalities<br />
under contract<br />
resources decision-making. Ultimately,<br />
all financing in the sector comes from<br />
tariffs, the national budget and external<br />
aid. Decision-makers in the water sector do<br />
not control all of the factors influencing<br />
these financing sources, but they can help<br />
create a favourable investment climate and<br />
ensure good management of the financial<br />
resources at their disposal. Several key<br />
initiatives over the past five years have<br />
shaped the agenda of water financing,<br />
including the World Panel on Financing<br />
Water Infrastructure (chaired by Michel<br />
Camdessus), the Task Force on Financing<br />
Water for All (chaired by Angel Gurria)<br />
and the UN Secretary General’s Advisory<br />
Board on Water and Sanitation (UNSGAB).<br />
This section offers examples of how some<br />
countries are tackling the problems and<br />
implementing the recommendations identified<br />
in these reports.<br />
Water supply service providers<br />
manage financial resources well,<br />
creating favourable investment<br />
climates<br />
Reforms have responded to the failure of<br />
public sector water providers to provide<br />
adequate levels of service and quality,<br />
often because of poor governance and<br />
inadequate investments. Reforms have also<br />
focused on transparency and accountability,<br />
low revenue collection, infrastructure<br />
deterioration and service breakdown.<br />
Privatization of water services is still<br />
an exception, and there is not enough<br />
experience to establish its long-term efficacy.<br />
Although the number of people<br />
served by the private water sector has<br />
grown from roughly 50 million in 1990 to<br />
about 300 million in 2002, most people<br />
in developing countries are not served by<br />
either private or partially private companies<br />
(see chapters 4 and 7 for additional<br />
discussion). 43<br />
The National Water and Sewerage Corporation<br />
(NWSC) in Uganda is a public sector<br />
utility that has assumed a more formal<br />
business structure. Within a short period<br />
this once poorly performing utility had<br />
improved service quality (expanding coverage<br />
from 12 towns in 1998 to 22 towns<br />
today) and strengthened financial viability<br />
through more efficient service provision<br />
and increased revenue collection. Its experience<br />
also illustrates the importance of<br />
good leadership, showing that substantial<br />
changes can occur rapidly under the right<br />
conditions. 44<br />
To improve efficiency and finances, NWSC<br />
introduced performance-based contracts<br />
for local utilities and separated operations<br />
and maintenance from performance monitoring<br />
and regulation. Results included a<br />
substantially larger service base, increased<br />
staff efficiency and a more viable financial<br />
base (box 14.23).<br />
The Tunisian water authority SONEDE is<br />
another example of a water supply agency<br />
operating with good management practices.<br />
As indicated in box 14.3, a targeted<br />
pricing policy enables full cost recovery of<br />
operating the service, with tourist establishments<br />
paying the highest rates and<br />
households the lowest. Unaccounted for<br />
water in Tunis has been reduced below<br />
10%.<br />
Providing official development<br />
assistance for water resources in<br />
more user-friendly forms<br />
In Kenya, output-based aid underpins<br />
the loans being made by a commercial<br />
microfinance agency. The international<br />
aid repays part of the investment cost once<br />
the work is completed. This approach differs<br />
from a normal guarantee of the lender<br />
in that it creates a strong incentive for the<br />
bank to ensure timely and effective completion<br />
of the project.<br />
Small-scale local water providers<br />
Small-scale water providers serve an<br />
estimated 25% of the urban population<br />
in Latin America and East Asia and about<br />
50% in Africa and South-East Asia. 45<br />
Small-scale water providers typically<br />
include entrepreneurs filling a void left by<br />
the market failure of the formal water sector<br />
and small companies providing services<br />
to municipalities or public authorities<br />
under contract.<br />
The main obstacle to the expansion of<br />
small-scale water providers is lack of<br />
financing. Financing is generally from personal<br />
assets, profits from other businesses,<br />
community contributions and short-term<br />
credit from local banks or microcredit<br />
agencies. Options to increase access to<br />
financing for small-scale providers include<br />
microfinance schemes, access to local<br />
development and infrastructure banks,<br />
projects funded by non-governmental<br />
organizations or donors and investment<br />
subsidies (for example, in Cambodia grants<br />
from the International Development Association<br />
cover 50%-60% of investment<br />
costs). The Philippines has successfully<br />
used loan financing at market rates, while<br />
Colombia has used a middle path that<br />
preserves incentives and enhances financial<br />
sustainability by plotting increased<br />
tariffs over time and placing revenues in<br />
an investment fund. 46<br />
262 World Water Development Report 3
options inside the water box<br />
PART<br />
4<br />
Box 14.23<br />
Addressing water supply and sanitation challenges in Uganda<br />
Uganda faced numerous challenges in<br />
addressing water supply and sanitation<br />
services related to urbanization and population<br />
growth pressures, including lack<br />
of harmony in water policies, inadequate<br />
governance, divergent stakeholder preferences,<br />
managerial inefficiencies and limited<br />
investment capital. To address these<br />
deficiencies, the government initiated a<br />
series of complementary activities:<br />
• Instituting timely, rational expansion of<br />
water production and network facilities.<br />
Performance indicator 1998 2007<br />
Service coverage (percent) 47 71<br />
New water connections (number per year) 3,317 24,418<br />
Total number of water connections 50,826 180,697<br />
Number of employees 1,784 1,388<br />
Staff per 1,000 water connections 37 7<br />
Non-revenue water (percent of total) 51 32.5<br />
Income (billions of Uganda shillings) 21.9 70.4<br />
Profit after depreciation (billions of Uganda shillings) -2.0 6.5<br />
• Using an optimal mix of technologybased<br />
approaches (such as yard taps,<br />
prepaid meters and public standposts).<br />
• Introducing and subsidizing public access<br />
to water connections.<br />
• Implementing innovative capital<br />
financing mechanisms (such as tariff<br />
indexation and conservation, ‘soft’ loan<br />
financing and bond issuance).<br />
• Using output-based investment approaches<br />
to strengthen service targeting.<br />
• Using community-based approaches<br />
and mainstreaming consumer<br />
preferences.<br />
• Establishing stakeholder coordination<br />
forums, such as water councils, at different<br />
levels.<br />
• Equitably providing water and sanitation<br />
infrastructure, with an emphasis<br />
on sanitation.<br />
As a result of these activities, water delivery<br />
and service efficiency and profitability<br />
rose dramatically during 1998-2007<br />
(see table). Coverage increased more<br />
than 50%, with total water connections<br />
more than 3.5 times higher in 2007<br />
than in 1998. Employee efficiency also<br />
increased, and income rose more than<br />
300%.<br />
Several activities were especially helpful in<br />
improving Uganda’s urban water supply<br />
and sanitation services:<br />
• Using performance-contract arrangements<br />
that promote a private sectorlike<br />
perspective, including market<br />
orientation, customer focus, incentive<br />
plans and accountability.<br />
• Applying managerial subsidarity,<br />
keeping decision-making close to<br />
beneficiaries.<br />
• Separating water supply and sanitation<br />
operations from monitoring and regulation<br />
to improve accountability.<br />
• Incorporating sanitation improvement<br />
initiatives into water supply and sector<br />
plans based on appropriate technologies<br />
for affordability and social acceptability.<br />
• Coordinating investment activities,<br />
operations management and user communities<br />
to ensure maximum impact.<br />
Source: Mugisha and Sanford 2008.<br />
Lack of legal recognition of small-scale<br />
providers is another obstacle to expansion.<br />
To strengthen legitimacy, local water authorities<br />
in Mauritania and Uganda enter<br />
into management contracts with private<br />
operators, which then provide water supplies<br />
to small towns.<br />
Payment for environmental goods<br />
and services<br />
Payment for environmental services is based<br />
on the recognition that the environment,<br />
such as wetlands and watersheds, provides a<br />
range of life-supporting goods and services,<br />
including potable water supply, irrigation<br />
water, food and fibre, wastewater treatment,<br />
flood control and aesthetic benefits (figure<br />
14.1). Environmental goods and services,<br />
traditionally thought of as provided for<br />
‘free’ by nature, lack a functioning market<br />
for pricing them. Further, for many environmental<br />
goods and services there is no<br />
direct link between the service provider and<br />
the consumer – for example, between an<br />
upstream provider (a land owner or resource<br />
manager) and a downstream user (public<br />
water supply, agriculture and industry).<br />
With the market for these services often<br />
poorly developed or non-existent, ecosystem<br />
managers have little economic incentive<br />
to improve their management efforts.<br />
The payment for environmental services<br />
concept attempts to address this problem<br />
by creating markets for environmental<br />
services, collecting money from water users<br />
and paying those providing the resource,<br />
thereby encouraging efficient and sustainable<br />
delivery of watershed services.<br />
Experience with payment for environmental<br />
services is growing in several countries.<br />
In the United States New York City obtains<br />
its drinking water from watersheds in the<br />
Catskill Mountains north of the city. Water<br />
quality was traditionally very good, requiring<br />
little or no treatment. By the end of<br />
the 1980s, however, agricultural and other<br />
development in the Catskills threatened the<br />
water quality. New York City planners chose<br />
to work with upstream land owners in the<br />
Catskill watersheds to address potential<br />
water quality problems. The resultant plan<br />
included payments for both on-farm capital<br />
costs and pollution-reducing agricultural<br />
Water in a changing world 263
PART<br />
4<br />
Chapter 14<br />
Figure 14.1<br />
Ecosystems and some of the services they provide<br />
Mountain and polar<br />
Food<br />
Fibre<br />
Freshwater<br />
Erosion control<br />
Climate regulation<br />
Recreation and ecotourism<br />
Aesthetic values<br />
Spiritual values<br />
Inland water<br />
Rivers and other wetlands<br />
Freshwater<br />
Food<br />
Pollution control<br />
Flood regulation<br />
Sediment retention and transport<br />
Disease regulation<br />
Nutrient cycling<br />
Recreation and ecotourism<br />
Aesthetic values<br />
Cultivated<br />
Food<br />
Fibre<br />
Freshwater<br />
Dyes<br />
Timber<br />
Pest regulation<br />
Biofuels<br />
Medicines<br />
Nutrient cycling<br />
Aesthetic values<br />
Cultural heritage<br />
Coastal<br />
Food<br />
Fibre<br />
Timber<br />
Fuel<br />
Climate regulation<br />
Waste processing<br />
Nutrient cycling<br />
Storm and wave protection<br />
Recreation and ecotourism<br />
Aesthetic values<br />
Forest and woodlands<br />
Food<br />
Timber<br />
Freshwater<br />
Fuelwood<br />
Flood regulation<br />
Disease regulation<br />
Carbon sequestration<br />
Local climate regulation<br />
Medicines<br />
Recreation<br />
Aesthetic values<br />
Spiritual values<br />
Drylands<br />
Food<br />
Fibre<br />
Fuelwood<br />
Local climate regulation<br />
Cultural heritage<br />
Recreation and ecotourism<br />
Spiritual values<br />
Urban<br />
Parks and gardens<br />
Air quality regulation<br />
Water regulation<br />
Local climate regulation<br />
Cultural heritage<br />
Recreation<br />
Education<br />
Island<br />
Food<br />
Freshwater<br />
Recreation and<br />
ecotourism<br />
Marine<br />
Food<br />
Climate regulation<br />
Nutrient cycling<br />
Recreation<br />
Note: Different combinations of services are provided to human populations from the various types of ecosystems represented here. Their ability to<br />
deliver the services depends on complex biological, chemical and physical interactions, which are in turn affected by human activities.<br />
Source: Based on MEA 2005.<br />
measures, which helped reduce the costs of<br />
conventional water treatment. This approach<br />
also protected the watersheds and<br />
the other environmental goods and services<br />
they provided (such as recreation and<br />
biodiversity conservation). The payments<br />
to water providers come directly from the<br />
revenues collected from water users in<br />
New York City. 47 A similar approach was<br />
used in Heredia, Costa Rica, which taxed<br />
its approximately 50,000 connected water<br />
users to pay farmers in the watershed for<br />
improved conservation measures.<br />
Another example of payment for environmental<br />
services focuses on rewarding<br />
rural people for programmes that reduce<br />
the loss of topsoil from cropland in Kenya<br />
(box 14.24).<br />
Some examples 48 suggest that, for<br />
payment for environmental services<br />
systems to create an enabling environment,<br />
infrastructure development may<br />
be necessary. This would be expected to<br />
increase the costs of implementing such<br />
systems. 49<br />
264 World Water Development Report 3
options inside the water box<br />
4 PART<br />
Box 14.24<br />
Paying for environmental services – green water credits in Kenya<br />
Over the last 25 years much of the<br />
cropland in Kenya has lost its topsoil.<br />
Meanwhile, the population has roughly<br />
doubled, increasing demand for food<br />
and power. The International Fund for<br />
Agricultural Development (IFAD)-supported<br />
green water credits initiative is an<br />
innovative mechanism for rewarding rural<br />
people for sustainable water management<br />
practices. The long-term goal is to empower<br />
upstream rural communities in the<br />
Tana River basin to better manage their<br />
land and water resources to improve food<br />
and water security and livelihoods both<br />
upstream and downstream in the watershed.<br />
It is also expected to decrease flood<br />
potential, improve blue water resources<br />
delivery downstream and provide diversified<br />
rural income sources.<br />
Begun in the Tana River basin in 2006,<br />
this programme was also intended to<br />
demonstrate the feasibility of green water<br />
credits as an environmental service tool.<br />
The project builds on the difference<br />
between green water and blue water.<br />
Green water, which is soil moisture generated<br />
by rainfall that infiltrates the soil,<br />
is a fully consumptive water use, while<br />
some blue water (such as rivers and lakes)<br />
is used non-consumptively and can be<br />
reused.<br />
The green water credits scheme includes<br />
quantifying current water fluxes<br />
in the watershed and estimating fluxes<br />
under the scheme, identifying potential<br />
participants (demand assessment) and<br />
developing a payment and reward mechanism<br />
for upstream land managers and<br />
downstream clients based on appropriate<br />
incentives. The main activities include<br />
upstream soil and water conservation<br />
techniques applied by farmers, leading<br />
to more water being available downstream.<br />
Results to date include lessened<br />
land degradation and improved quantity<br />
and quality of blue water supply. With<br />
the support of the Kenyan government,<br />
the green water credits concept is being<br />
scaled up to help improve food and<br />
water supplies nationwide. Increased<br />
power security has been another byproduct.<br />
Concurrent with implementation of this<br />
large scale, market-based scheme to improve<br />
land and water management, Kenya<br />
is reforming its entire water sector. To this<br />
end, the Tana River basin programme was<br />
strategically aligned with recent Kenyan<br />
water sector reforms, including the 2002<br />
Water Act and the Kenyan National Water<br />
Resources Management Plan, which assign<br />
an economic value to water resources.<br />
These efforts reflect past success and<br />
future intentions by addressing water allocation<br />
issues along with financial considerations,<br />
to reward Kenya’s land stewards,<br />
generating benefits for the rural poor and<br />
the country as a whole.<br />
Source: Falkenmark 2003; ISRIC 2007;<br />
www.isric.org/UK/About+ISRIC/Projects/<br />
Current+Projects/Green+Water+Credits.htm<br />
Notes<br />
1.<br />
2.<br />
3.<br />
4.<br />
5.<br />
6.<br />
7.<br />
8.<br />
9.<br />
10.<br />
11.<br />
12.<br />
13.<br />
14.<br />
15.<br />
16.<br />
17.<br />
18.<br />
19.<br />
20.<br />
21.<br />
22.<br />
23.<br />
24.<br />
25.<br />
26.<br />
27.<br />
28.<br />
29.<br />
30.<br />
31.<br />
32.<br />
33.<br />
34.<br />
35.<br />
36.<br />
37.<br />
38.<br />
39.<br />
40.<br />
41.<br />
42.<br />
43.<br />
44.<br />
45.<br />
46.<br />
47.<br />
Examples include WCD 2000 and US<br />
EPA 2005.<br />
Rogers and Hall 2002.<br />
Bandaragoda 2006.<br />
ILEC 2005; World Bank 2005.<br />
UN-Water 2008.<br />
UN-Water 2008.<br />
See, for example, Eawag-WSSCC-<br />
SuSanA (2008); and IWA (2008).<br />
Gyawali et al. 2006.<br />
Bandaragoda 2006.<br />
Cap-Net 2008.<br />
Rast 1999.<br />
ILEC 2005.<br />
Bayoumi and Abumoghli 2007.<br />
Phumpiu and Gustafsson 2009.<br />
See WWAP 2006; Phumpiu and<br />
Gustafsson 2009; Caplan 2003; UNDP<br />
2006.<br />
Phumpiu and Gustafsson 2009.<br />
Beccar, Boelens, and Hoogendam<br />
2002.<br />
Burchi 2005.<br />
UNDP WGF-SIWI 2008.<br />
Moench et al. 2003.<br />
www.forumrisparmioacqua.it.<br />
Transparency International 2008;<br />
UNDP and WGF-SIWI 2008.<br />
Cap-Net 2008.<br />
World Bank 2007.<br />
UNDP 1997.<br />
UNDP 1997.<br />
www2.gtz.de/dokumente/bib/06-<br />
1322.pdf.<br />
www.genderandwater.org/<br />
page/4208.<br />
Visscher et al. 2006; www.irc.nl/<br />
page/29472.<br />
Smits, Moriarity, and Sijbesma 2007;<br />
www.irc.nl/page/35887.<br />
Butterworth et al. 2008.<br />
www.youtube.com/<br />
watch?v=btWcXNSvOHw.<br />
ILEC 2003.<br />
ILEC 2005.<br />
www.forumrisparmioacqua.it.<br />
Conceição and Heitor 2003.<br />
UN Millennium Project 2005; Juma<br />
and Agwara 2006.<br />
WSP-UNICEF 2007; see also http://<br />
s189535770.onlinehome.us/<br />
pottersforpeace/?page_id=9.<br />
UNDP 2006.<br />
Watson et al. 2005.<br />
ILEC 2005; World Bank 2005.<br />
ILEC 2003.<br />
UNDP 2006.<br />
World Bank Institute 2005.<br />
Dardenne 2006; McIntosh 2003.<br />
Triche, Requena, and Kariuki 2006.<br />
Pagiola and Platais 2002, 2007.<br />
48.<br />
49.<br />
Muñoz Piña et al. 2008.<br />
Pagiola and Platais 2007; World Bank<br />
2007.<br />
References<br />
ANA (Brazil National Water Agency),<br />
GEF (Global Environment Facility),<br />
UNEP (United Nations Environment<br />
Programme), and OAS (Organization<br />
of American States). 2004. Strategic<br />
Action Program for the Integrated<br />
Management of the São Francisco River<br />
Basin and Its Coastal Zone – SAP. Brazil<br />
National Water Agency, Global Environment<br />
Facility, United Nations Environment<br />
Programme, and Organization<br />
of American States. www.gefweb.org/<br />
interior_right.aspx?id=238.<br />
Balcazar, R. A. 2005. The Establishment of<br />
an Anti-Corruption Agreement with Pipe<br />
Manufacturing Companies: A Colombian<br />
Experience. Presentation at Seminar<br />
on Meeting International Targets without<br />
Fighting Corruption, World Water<br />
Week, 20-26 August 2005, Stockholm.<br />
Bandaragoda, D. J. 2006. Status of Institutional<br />
Reforms for Integrated Water Resources<br />
Management in Asia: Indications<br />
from Policy Reviews in Five Countries.<br />
Working Paper 108. International Water<br />
Management Institute, Colombo.<br />
Bayoumi, M., and I. Abumoghli. 2007.<br />
National Water Councils: Comparative<br />
Water in a changing world 265
PART<br />
4<br />
Chapter 14<br />
Experiences. United Nations Development<br />
Programme–Iraq, Amman.<br />
Beccar, L., R. Boelens, and P. Hoogendam.<br />
2002. Water Rights and Collective<br />
Action in Community Irrigation. In Water<br />
Rights and Empowerment, eds. R. Boelens<br />
and P. Hoogendam. The Netherlands:<br />
Gorcum Publishers.<br />
Blue Plan, MAP (Mediterranean Action<br />
Plan), and UNEP (United Nations Environment<br />
Programme). 1999. Participatory<br />
Irrigation Management Activities and<br />
Water User Organizations Involvement<br />
in Turkey. Sophia Antipolis, France: Blue<br />
Plan.<br />
———. 2002. Plan Bleu, CMDD (2002)<br />
Études de cas. Forum avancées de<br />
la gestion de la demande en eau en<br />
Méditerranée, Fiuggi, Italie, 3-5 Octobre<br />
2002.<br />
Boelens, R. 2008. The Rules of the Game<br />
and the Game of the Rules: Normalization<br />
and Resistance in Andean Water<br />
Control. Ph.D. diss., Wageningen University,<br />
The Netherlands.<br />
Burchi, S. 2005. The Interface between<br />
Customary and Statutory Water Rights<br />
– A Statutory Perspective. Legal Papers<br />
Online No.45, Food and Agriculture Organization<br />
of the United Nations, Rome.<br />
Butterworth, J. A., A. Sutherland, N.<br />
Manning, B. Darteh, M. Dziegielewska-Geitz,<br />
J. Eckart, C. Batchelor, T.<br />
Moriarty, C. Schouten, J. Da Silva, J.<br />
Verhagen, and P. J. Bury. 2008. Building<br />
More Effective Partnerships for Innovation<br />
in Urban Water Management.<br />
SWITCH Learning Alliance, Loughborough,<br />
UK. http://switchurbanwater.<br />
lboro.ac.uk/outputs/pdfs/WP6-2_<br />
PAP_Effective_partnerships_in_UWM_<br />
abridged.pdf.<br />
Caplan, D. 2003. Investment in Water<br />
Infrastructure Benefits Orillia. Canada-<br />
Ontario Infrastructure Program, Infrastructure<br />
Canada, Toronto, Ontario.<br />
Cap-Net. 2008. Performance and Capacity<br />
of River Basin Management Organizations:<br />
Cross-Case Comparison of Four<br />
RBOs. Cap-Net, Pretoria.<br />
COHRE (Centre on Housing Rights and<br />
Evictions), AAAS (American Association<br />
for the Advancement of Science),<br />
SDC (Swiss Agency for Development<br />
and Cooperation), and UN-HABITAT<br />
(United Nations Human Settlements<br />
Programme). 2007. Manual on the<br />
Right to Water and Sanitation. Geneva:<br />
Centre on Housing Rights and Evictions.<br />
www.cohre.org/store/attachments/<br />
RWP - Manual_final_full_final.pdf.<br />
Conceição, P., and M. V. Heitor. 2003.<br />
Techno-Economic Paradigms and<br />
Latecomer Industrialization. United Nations<br />
Educational, Social, and Cultural<br />
Organization Encyclopedia, Paris.<br />
Cooley, H., J. Christian-Smith, and P. H.<br />
Gleick. 2008. More with Less: Agricultural<br />
Water Conservation and Efficiency in<br />
California. Oakland, CA: Pacific Institute.<br />
www.pacinst.org/reports/more_with_<br />
less _delta.<br />
Dávila, G., and H. Olazával. 2006. De la<br />
Mediación a la Movilización Social: Análisis<br />
de Algunos Conflictor por el Aqua en<br />
Chimborazo. Quito: Abya-Yala.<br />
Döker, E., D. Er, F. Cenap, H. Özlü, and E.<br />
Eminoglu. 2003. Decentralization and<br />
Participatory Irrigation Management in<br />
Turkey. Water Demand Management<br />
Forum: Decentralization and Participatory<br />
Irrigation Management, 2-4 February<br />
2003, Cairo, Egypt.<br />
Earle, A., and A. Turton. 2005. No Duck<br />
No Dinner: How Sole Sourcing Triggered<br />
Lesotho’s Struggle against Corruption.<br />
Presentation at seminar on Can<br />
We Meet International Targets without<br />
Fighting Corruption? World Water Week,<br />
20-26 August, 2005, Stockholm.<br />
Eawag (Swiss Federal Institute of Aquatic<br />
Science and Technology)-Sandec (Department<br />
of Water and Sanitation in<br />
Developing Countries)-SuSanA (Sustainable<br />
Sanitation Alliance). 2007.<br />
Towards More Sustainable Sanitation Solutions.<br />
Swiss Federal Institute of Aquatic<br />
Science and Technology, Dübendorf,<br />
Switzerland. http://esa.un.org/iys/docs/<br />
Susana_backgrounder.pdf.<br />
Falkenmark, M. 2003. Water Management<br />
and Ecosystems: Living with Change.<br />
TEC Background Paper No. 9, Global<br />
Water Partnership, Stockholm.<br />
Garces-Restrepo, C., D. Vermillion, and<br />
G. Muñoz. 2007. Irrigation Management<br />
Transfer. Worldwide Efforts and Results.<br />
Water Reports No. 32. Rome: Food and<br />
Agriculture Organization of the United<br />
Nations.<br />
Gyawali, D., J. A. Allan, P. Antunes, A. Dudeen,<br />
P. Laureano, C. L. Fernández, P.<br />
Monteiro, H. Nguyen, P. Novácek, and<br />
C. Pahl-Wostl. 2006. EU-<strong>IN</strong>CO Water<br />
Research from FP4 to FP6 (1994-2006)<br />
– A Critical Review. Luxembourg: Office<br />
for Official Publications of the European<br />
Communities.<br />
ICID (International Commission on Irrigation<br />
and Drainage). 2008. China<br />
Reduces Irrigation Water Withdrawals by<br />
25 Percent. ICID Newsletter, International<br />
Commission on Irrigation and<br />
Drainage, New Delhi.<br />
IJC (International Joint Commission).<br />
1978. Great Lakes Water Quality Agreement,<br />
with Annexes and Terms of<br />
Reference, Between the United States of<br />
America and Canada, Signed at Ottawa,<br />
November 22, 1978. International Joint<br />
Commission, Washington, DC.<br />
ILEC (International Lake Environment<br />
Committee Foundation). 2003. World<br />
Lake Vision: A Call to Action. Kusatsu,<br />
Shiga, Japan: World Lake Vision Committee<br />
Foundation.<br />
———. 2005. Managing Lakes and Their<br />
Basins for Sustainable Use: A Report for<br />
Lake Basin Managers and Stakeholders.<br />
Kusatsu, Shiga, Japan: International Lake<br />
Environment Committee Foundation.<br />
ISRIC (International Soil Research and<br />
Information Centre). 2007. Political,<br />
Institutional and Financial Framework<br />
for Green Water Credits in Kenya. Green<br />
Water Credits (GWC) Proof-of-Concept<br />
Report No.6, International Soil Research<br />
and Information Centre, Wageningen,<br />
The Netherlands.<br />
IWA (International Water Association).<br />
2008. Sanitation Challenges and Solutions.<br />
Sanitation 21 Task Force. International<br />
Water Association, London.<br />
Jairath, J. 2000. Participatory Irrigation<br />
Management in Andhra Pradesh – Contradictions<br />
of a Supply Side Approach.<br />
Paper delivered at workshop on South<br />
Asia Regional Poverty Monitoring and<br />
Evaluation, 8-10 June 2000, New Delhi.<br />
Johnson, S. H. 1997. Irrigation Management<br />
Transfer in Mexico: A Strategy to Achieve<br />
Irrigation District Sustainability. Research<br />
Report 16. Colombo: International Irrigation<br />
Management Institute.<br />
Juma, C., and H. Agwara. 2006. Africa<br />
in the Global Knowledge Economy:<br />
Strategic Options. International Journal<br />
of Technology and Globalisation 2 (3/4)<br />
218-31.<br />
Kingdom, B., R. Liemberger, and P.<br />
Marin. 2006. The Challenge of Reducing<br />
Non-revenue Water (NRW) in Developing<br />
Countries. How the Private Sector<br />
Can Help: A Look at Performance-Based<br />
Service Contracting. Water Supply and<br />
Sanitation Board Discussion Paper Series<br />
8, World Bank, Washington, DC.<br />
Lange, J. 2008. A Guide to Public Participation,<br />
According to Article 14 of the EC<br />
Water Framework Directive. RhineNet<br />
Project Report, Freiburg, Germany.<br />
McIntosh, A. 2003. Asian Water Supplies.<br />
Reaching the Poor. Manila: Asian Development<br />
Bank and London: International<br />
Water Association. www.adb.org/documents/books/asian_water_supplies/<br />
asian_water_supplies.pdf.<br />
MEA (Millennium Ecosystem Assessment).<br />
2005. Living Beyond Our Means:<br />
Natural Assets and Human Well-Being,<br />
266 World Water Development Report 3
options inside the water box<br />
4 PART<br />
Statement from the Board. Washington,<br />
DC: World Resources Institute.<br />
Moench, M., A. Dixit, S. Janakarajan, M.<br />
S. Rathore, and S. Mudrakartha. 2003.<br />
The Fluid Mosaic: Water Governance in<br />
the Context of Variability, Uncertainty and<br />
Change. Ottawa: Ottawa International<br />
Development Research Centre.<br />
Moore, J. G., W. Rast, and W. M. Pulich.<br />
2002. Proposal for an Integrated<br />
Management Plan for the Rio Grande/<br />
Rio Bravo. In 1st International Symposium<br />
on Transboundary Waters Management,<br />
eds. A. Aldama, F. J. Aparicio, and R.<br />
Equihua. Avances en Hidraulica 10, XVII<br />
Mexican Hydraulics Congress, Monterrey,<br />
Mexico, Nov. 18-22, 2002.<br />
Mugisha, S., and B. Sanford. 2008. State-<br />
Owned Enterprises: NWSC’s Turnaround<br />
in Uganda. African Development Review<br />
20 (2): 305-34.<br />
Muñoz-Piña, C., A. Guevara, J. M. Torres,<br />
J. and Braña, J. 2008. Paying for the<br />
Hydrological Services of Mexico’s Forests:<br />
Analysis, Negotiations and Results.<br />
Ecological Economics 65 (4): 725-36.<br />
Palacios, E. V. 1999. Benefits and Second<br />
Generation Problems of Irrigation<br />
Management Transfer in Mexico. Water<br />
Conservation and Use in Agriculture<br />
Discussion Paper, Food and Agriculture<br />
Organization of the United Nations,<br />
Rome.<br />
Phumpiu, P., and J. E. Gustafsson. 2009.<br />
When Are Partnerships a Viable Tool for<br />
Development? Institutions and Partnerships<br />
for Water and Sanitation Service in<br />
Latin Americ Water Resources Management<br />
23 (1): 19-38.<br />
PLUARG (Pollution from Land Use<br />
Activities Reference Group). 1978.<br />
Environmental Management Strategy<br />
for the Great Lakes System. Great Lakes<br />
Regional Office, International Joint Commission,<br />
Windsor, Ontario.<br />
Raju, K. V. 2001. Participatory Irrigation<br />
Management in India (Andhra Pradesh)<br />
- IMT Case Study. International E-mail<br />
Conference on Irrigation Management<br />
Transfer, International Network on<br />
Partcipatory Irrigation Management,<br />
June-October 2001.<br />
Rap, E. 2008. Interdisciplinary Research<br />
and Capacity Building Program on<br />
Water Policy and Water Management in<br />
Andean Countries. Background Paper for<br />
Knowledge on the Move Conference,<br />
27-28 February 2008, The Hague.<br />
Rast, W. 1999. Overview of the Status<br />
of Implementation of the Freshwater<br />
Objectives of Agenda 21 on a Regional<br />
Basis. Sustainable Development International<br />
Journal 1: 53-6.<br />
Rogers, P., and A. W. Hall. 2002. Effective<br />
Water Governance. TEC Background<br />
Paper No. 7, Global Water Partnership,<br />
Stockholm.<br />
Ruiz-Mier, F., and M. van Ginneken. 2006.<br />
Consumer Cooperative: An Alternative<br />
Institutional Model for Delivery of Urban<br />
Water Supply and Sanitation Services.<br />
Note No. 5, Water Supply & Sanitation<br />
Working Notes, World Bank, Washington,<br />
DC.<br />
Stålgren, P. 2006. Corruption in the Water<br />
Sector: Causes, Consequences and<br />
Potential Reform. Policy Brief No. 4,<br />
Stockholm International Water Institute,<br />
Stockholm.<br />
Thampi, G. K. 2005. Community Voice as<br />
an Aid to Accountability: Experiences<br />
with Citizen Report Cards in Bangalore.<br />
Presentation at seminar on Can<br />
We Meet International Targets without<br />
Fighting Corruption? World Water Week,<br />
Stockholm, August 2005.<br />
Transparency International. 2008. Global<br />
Corruption Report 2008: Corruption in the<br />
Water Sector. Cambridge, UK: Cambridge<br />
University Press.<br />
Triche, T., S. Requena, and M. Kariuki.<br />
2006. Engaging Local Private Operators<br />
in Water Supply and Sanitation Services.<br />
Initial Lessons from Emerging Experience<br />
in Cambodia, Colombia, Paraguay, the<br />
Philippines and Uganda. Water Supply<br />
and Sanitation Working Notes No 12,<br />
World Bank, Washington, DC.<br />
Treyer, Sébastien. 2004. Introducing<br />
Political Issues in the Debate on Water<br />
Resources Planning in Tunisia: A Necessity<br />
for the Implementation of Water<br />
Demand Management Policies. In<br />
Proceedings of the Workshop on Water<br />
and Politics: Understanding the Role of<br />
Politics in Water Management, Marseille,<br />
France, 26-27 February 2004. Marseille,<br />
France: World Water Council. www.<br />
worldwatercouncil.org/fileadmin/wwc/<br />
Library/Publications_and_reports/<br />
Proceedings_Water_Politics/proceedings_waterpol_full_document.pdf.<br />
UNDP (United Nations Development<br />
Programme). 1997. Capacity Building<br />
for Sustainable Management of Water<br />
Resources. New York: United Nations<br />
Development Programme, Sustainable<br />
Energy and Environment Division.<br />
———. 2006. Human Development Report<br />
2006: Beyond Scarcity: Power, Poverty<br />
and the Global Water Crisis. New York:<br />
Palgrave Macmillan.<br />
UNDP (United Nations Development<br />
Programme) and WGF-SIWI (Water<br />
Governance Facility, Stockholm<br />
International Water Institute). 2008.<br />
Water Adaptation: Freshwater in National<br />
Adaptation Programs of Action, NAPAs,<br />
and Climate Adaptation in Freshwater<br />
Planning. Stockholm: United Nations Development<br />
Programme and Stockholm<br />
International Water Institute.<br />
UNEP (United Nations Environment<br />
Programme). 2008. Africa: Atlas of<br />
our Changing Environment. Division of<br />
Early Warning and Assessment. Nairobi:<br />
United Nations Environment Programme.<br />
www.unep.org/dewa/africa/<br />
AfricaAtlas.<br />
UN Millennium Project. 2005. Investing in<br />
Development: A Practical Plan to Achieve<br />
the Millennium Development Goals. New<br />
York: United Nations.<br />
UN-Water. 2008. Status Report on IWRM<br />
and Water Efficiency Plans for CSD 16.<br />
Paper prepared for 16th session of the<br />
Commission on Sustainable Development<br />
in May 2008, UN-Water.<br />
US EPA (Environmental Protection<br />
Agency). 2005. Handbook for Developing<br />
Watershed Plans to Restore and<br />
Protect Our Waters. Washington, DC:<br />
U.S. Environmental Protection Agency.<br />
Velasco, H. G. 2003. Water Rights<br />
Administration – Experiences, Issues and<br />
Guidelines. Rome: Food and Agriculture<br />
Organization of the United Nations.<br />
Watson, P. L., J. Gadek, E. Defere, and C.<br />
Revels. 2005. Assessment of Resource<br />
Flows in the Water Supply and Sanitation<br />
Sector. Ethiopia Case Study. World<br />
Bank, Washington, DC.<br />
WCD (World Commission on Dams).<br />
2000. Dams and Development. A New<br />
Framework for Decision-Making. London:<br />
Earthscan.<br />
World Bank. 2005. Lessons for Managing<br />
Lake Basins for Sustainable Use.<br />
Environment Department, World Bank,<br />
Washington, DC.<br />
———. 2007. Promoting Market-Oriented<br />
Ecological Compensation Mechanisms:<br />
Payment for Ecosystem services in<br />
China. Policy Report, World Bank Analytical<br />
and Advisory Assistance Program,<br />
East Asia and Pacific Region, World Bank,<br />
Washington, DC.<br />
———. 2008. Climate Resilient Cities. 2008<br />
Primer: Reducing Vulnerabilities to Climate<br />
Change Impacts and Strengthening<br />
Disaster Relief Management in East<br />
Asian Cities. Washington, DC: World<br />
Bank.<br />
World Bank Institute. 2005. When Passionate<br />
Leadership Stimulates Enduring<br />
Change: A Transformational Capacity<br />
Development Anecdote from Uganda.<br />
Capacity Development Brief No. 13.<br />
World Bank Institute, Washington, DC.<br />
Water in a changing world 267
PART<br />
4<br />
Chapter 14<br />
WSP-AF (Water and Sanitation Programme<br />
– Africa). 2002. Rural Water<br />
Sector Reform in Ghana: A Major<br />
Change in Policy and Structure. Blue<br />
Gold Series, Field Note 2, Water and<br />
Sanitation Programme, Nairobi.<br />
WSP (Water and Sanitation Programme)-<br />
UNICEF (United Nations Children’s<br />
Fund). 2007. Use of Ceramic Water<br />
Filters in Cambodia. Field Note,<br />
Combating Waterborne Disease at the<br />
Household Level. Water and Sanitation<br />
Programme, Cambodia Field Office,<br />
Phnom Penh. www.wsp.org/UserFiles/<br />
file/926200724252_eap_cambodia_<br />
filter.pdf.<br />
WWAP (World Water Assessment Programme).<br />
2006. The United Nations<br />
World Water Development Report 2.<br />
Water: A Shared Responsibility. Paris:<br />
United Nations Educational, Scientific<br />
and Cultural Organization, and New<br />
York: Berghahn Books.<br />
WWF. 2008. Kafue Flats, Zambia: Preserving<br />
Biodiversity through Water<br />
Management. Innovation for Sustainable<br />
Development: Case Studies from<br />
Africa. World Wildlife Fund, Gland,<br />
Switzerland.<br />
268 World Water Development Report 3
options inside the water box<br />
Chapter 15<br />
Options from<br />
beyond the<br />
water box<br />
PART<br />
4<br />
Authors: William Cosgrove and Joana Talafré<br />
Contributors: Richard Connor, William Cosgrove, George de Gooijer,<br />
Gerry Galloway, Molly Hellmuth, Håkan Tropp and James Winpenny<br />
Coordinator: Olcay Ünver (WWAP)<br />
Facilitator: William Cosgrove<br />
Key messages<br />
Dealing with risk and uncertainty has long been a routine challenge<br />
for water resources managers and policy-makers across<br />
sectors and the world. However, issues like climate change and<br />
demographic dynamics have made the risks greater and the task<br />
more complex. Risk management is now much more important<br />
– indeed essential – to analysis and decision-making.<br />
Drivers and policies outside the water sector have more impact<br />
on water management than do many policies championed and<br />
implemented by water-related ministries. Identifying trade-offs<br />
and synergies between water and other policy sectors can enhance<br />
policy impacts in all sectors and avoid some adverse effects<br />
on water.<br />
Because governments, civil society and business leaders make decisions<br />
every day that can affect water, it is important to identify<br />
where such decisions can also lead to improvements in water sector<br />
management and in water sector and environmental services.<br />
Examples of win-win situations abound – whether created by<br />
governments, communities or businesses – that point to promoting<br />
deliberate cooperation between water and non-water actors<br />
and integrating water issues into external decisions.<br />
International organizations, notably the UN system, can provide<br />
support and expertise to governments, help civil society<br />
build capacity and catalyse leadership in the private sector.<br />
Chapter 14 shows that many actions defined<br />
within the water sector also require<br />
decisions by leaders and policy-makers<br />
outside the sector. Furthermore, external<br />
drivers and policies related to sectors that<br />
affect overall economic diversification –<br />
such as agriculture, trade, energy, health,<br />
housing, finance and social protection –<br />
have more impact on water management<br />
than do many policies championed and<br />
implemented by water-related ministries. 1<br />
The preceding parts of this Report demonstrate<br />
the complex links between those<br />
external drivers and water.<br />
Leaders in governments, civil society<br />
and the private sector all make decisions<br />
every day that affect water. It is important<br />
to identify how decisions motivated by<br />
economic or social objectives can also lead<br />
to improvements in water sector management<br />
and in water sector and environmental<br />
services. This chapter illustrates such<br />
win-win situations.<br />
There are essentially two ways such winwin<br />
scenarios can unfold. First, policy<br />
decisions or reforms made outside the water<br />
sector can create space for change within<br />
Water in a changing world 269
PART<br />
4<br />
Chapter 15<br />
curbing corruption<br />
in the water<br />
sector could save<br />
an estimated<br />
20%-70% of<br />
invested resources<br />
the water sector (discussed in the first part<br />
of this chapter). In many cases the success<br />
of reforms in the water sector has depended<br />
on broader enabling conditions – such as<br />
transparency and accountability in public<br />
institutions, sound trade conditions and access<br />
to information. Responses to some external<br />
drivers may therefore indirectly lead<br />
to improvements in water management.<br />
Improving governance: promoting<br />
transparency and accountability<br />
Governance provides the context for<br />
making water management decisions,<br />
establishing partnerships, mobilizing and<br />
distributing resources and giving accounts.<br />
Decisions about governance imply complex<br />
political processes and are heavily<br />
influenced by history, culture and values.<br />
Box 15.1<br />
The second way is more direct and involves<br />
avoiding the negative impacts of<br />
non-water sectoral interventions by taking<br />
water into account in decision-making<br />
(discussed in the second part of this chapter)<br />
or cultivating deliberate cooperation<br />
between water and non-water actors (discussed<br />
in the third part of this chapter).<br />
The examples in this chapter provide<br />
useful insights into how programme and<br />
policy decisions can achieve multiple<br />
benefits when implemented so as to take<br />
impacts on water into account.<br />
Promoting win-win scenarios by<br />
creating space for change<br />
There are many paths to improving water<br />
resources management. Direct water interventions<br />
need to be supported by a broader<br />
enabling framework. Other chapters point<br />
to the need to increase investment in the<br />
water sector; to enhance water-related information,<br />
science and monitoring systems<br />
and to create durable financial mechanisms<br />
to enable better performance in the water<br />
sector. This section provides examples of<br />
decisions outside the ‘water box’ and their<br />
contribution to improving water services.<br />
Combating corruption<br />
Donors are increasingly requesting<br />
anticorruption measures in their<br />
development assistance programming,<br />
to promote aid effectiveness.<br />
Transparency and accountability in<br />
government, along with clear rules<br />
and procedures, will go far in ensuring<br />
the stability needed to promote social<br />
and economic development. Efforts to<br />
promote integrity, transparency and<br />
accountability in one sector can pave<br />
the way for similar reforms in other<br />
sectors as they benefit from the successes<br />
and lessons learned.<br />
Key elements of a successful anticorruption<br />
strategy include citizen<br />
participation and access to information,<br />
independent checks and<br />
balances and oversight mechanisms,<br />
public sector codes of conduct and<br />
attention to incentives to corruption in<br />
public administration.<br />
Anticorruption strategies can be<br />
incorporated at all levels of project development<br />
and implementation, from<br />
procurement to monitoring and evaluation.<br />
For example, the Kecamatan<br />
Development Program in Indonesia, a<br />
project implemented by the Indonesian<br />
Ministry of Home Affairs (Community<br />
Development Office) and supported in<br />
part by the World Bank, encouraged<br />
village communities to participate in a<br />
water infrastructure project. Competition<br />
among villages was used to single<br />
out bad construction proposals and to<br />
strengthen social control in measuring<br />
quality throughout the project cycle.<br />
Source: Martinez 2007; Olken 2005.<br />
The capacity to formulate and implement<br />
appropriate policies is affected by the inclusiveness<br />
of decision-making, the strength of<br />
institutions and attitudes towards corruption.<br />
Curbing corruption has particular<br />
relevance as corruption diverts resources,<br />
lowers effective investment and undermines<br />
public confidence and government<br />
decentralization efforts (see chapter 14).<br />
Building integrity and accountability in<br />
public decision-making systems also involves<br />
promoting the role of civil society,<br />
non-governmental organizations and the<br />
private sector. This could be particularly<br />
relevant in the water services sector, where<br />
curbing corruption could save an estimated<br />
20%-70% of invested resources. 2<br />
Box 15.1 shows how government and<br />
donor efforts to combat corruption have<br />
also allowed for greater citizen participation<br />
in community water development, an<br />
essential part of water governance.<br />
Citizen participation in decision-making<br />
at all levels is also central to promoting<br />
good governance – creating a climate of<br />
accountability and transparency. Organized<br />
interest groups, community-based<br />
associations and other groups with the<br />
capacity and legitimacy to express views<br />
are crucial. Promoting a culture of consultation<br />
within the water sector and increasing<br />
consultative and participatory capacity<br />
in general, will deliver benefits for collaborative<br />
water management.<br />
Strengthening decision-making<br />
through decentralization<br />
Decentralization involves complex processes<br />
to enable decision-making and promote<br />
the sharing of resources and responsibilities<br />
among various levels of government.<br />
Occasionally, it includes the devolution of<br />
some power and responsibilities to civil society.<br />
In the water sector decentralization of<br />
management places decision-making closer<br />
to the level at which services are provided.<br />
Decentralization is typically part of a<br />
broader package of governance reform. The<br />
autonomy and resources accorded to local<br />
governments will vary. In some countries<br />
where decentralization is ongoing (for<br />
270 World Water Development Report 3
options from beyond the water box<br />
PART<br />
4<br />
example, Uganda), local governments receive<br />
resources based on performance, and<br />
local officials are held accountable based<br />
on service and management standards.<br />
Decentralized governance implies cooperation<br />
among a broader group of actors and<br />
stakeholders, including central and provincial<br />
government institutions and sometimes<br />
civil society, the private sector and resource<br />
users. ‘When it works well, decentralization<br />
has many benefits: it can allow for a democratisation<br />
of decision-making through<br />
improved stakeholder inclusiveness, transparency<br />
and accountability. . . . It can also<br />
encourage the integration of traditional<br />
knowledge and practice with innovative<br />
technologies and science to promote fair<br />
and efficient management of water resources<br />
and services.’ 3 The benefits of decentralization<br />
for water management depend on<br />
assigning adequate authority and resources<br />
to local governments (box 15.2).<br />
Australia provides a model of such coordination.<br />
Its National Resource Management<br />
Ministerial Council develops policies and<br />
strategies for national approaches to conservation<br />
and sustainable use of Australia’s natural<br />
resources, including land, vegetation,<br />
biological resources and water. The council’s<br />
role is to facilitate, oversee and monitor<br />
implementation of national programmes<br />
and action plans and to evaluate outcomes,<br />
which would otherwise be difficult because<br />
of the division of constitutional powers and<br />
responsibilities among territorial, state and<br />
national government entities. The council<br />
is responsible for promoting community<br />
engagement in conserving natural resources<br />
and for coordinating with other ministerial<br />
councils and bodies. 4<br />
Promoting conducive<br />
macroeconomic policies<br />
The effectiveness of water institutions<br />
depends on macroeconomic policies and<br />
the environment created by these policies.<br />
In the long term macroeconomic<br />
policies are so powerful and structurally<br />
influential that the best sectoral institutions<br />
cannot completely counteract their<br />
influence.<br />
Many countries look to economic diversification<br />
– economy-wide and within<br />
sectors – to reduce economic risk and<br />
promote growth opportunities (box 15.3).<br />
Economic activity in most least developed<br />
countries is heavily concentrated<br />
in commodities, with agriculture and<br />
fisheries contributing more than 36% of<br />
GDP and 80% of export earnings. 5 A few<br />
commodities account for the bulk of each<br />
country’s exports, with a single commodity<br />
often accounting for more than 60%<br />
of export earnings. More than 70% of<br />
the population of least developed countries<br />
is employed in primary commodity<br />
production.<br />
Some diversification schemes have direct<br />
impacts on water use or water demand because<br />
they target a sector that uses water.<br />
Others have an indirect impact on water,<br />
for example, by altering patterns of energy<br />
use. Decisions about diversification are<br />
rarely made with water impacts in mind.<br />
Rather, they are made in response to a perceived<br />
economic vulnerability or opportunity<br />
(such as expanding biofuel markets),<br />
trends in the terms of trade, instability or<br />
price changes in commodity markets or<br />
the depletion of mineral or other natural<br />
resources.<br />
The effectiveness<br />
of water<br />
institutions<br />
depends on<br />
macroeconomic<br />
policies and the<br />
environment<br />
created by<br />
these policies<br />
Box 15.2<br />
Decentralization in Uganda – making room for better environmental governance at the<br />
local level<br />
Devolving decision-making powers over<br />
natural resources to publicly accountable<br />
local authorities is frequently advocated<br />
to achieve social development goals and<br />
enhance environmental management.<br />
Uganda’s experience, however, suggests<br />
that to pave the way for better water governance<br />
and services, decentralization has<br />
to be accompanied by adequate legislative<br />
and regulatory powers, executive and<br />
enforcement authority for local authorities<br />
and adequate resources.<br />
Under the Uganda Local Government<br />
Act of 1997 district and city councils can<br />
enact by-laws, provided the by-laws do<br />
not conflict with the national constitution<br />
or other laws. District councils are<br />
responsible for disease control, environmental<br />
sanitation, entomological<br />
services and vermin control, and forests<br />
and wetlands. Despite this transfer of<br />
authority, however, executive powers on<br />
environmental matters have not been<br />
effectively devolved. Instead, administrative<br />
deconcentration within line ministries<br />
in charge of particular resources has been<br />
attempted.<br />
Local governments are required to help<br />
enforce environment-related rules and<br />
laws. Local councils below the subcounty<br />
level have the power to decide on penalties<br />
when rules are broken, but the lack of<br />
clarity regarding the powers of sanction<br />
and arbitration has undermined good<br />
environmental practices. In many cases<br />
responsibility has been transferred but resources<br />
have not, impeding local council<br />
efforts to promote better environmental<br />
management.<br />
Despite these constraints, there have<br />
been positive achievements. In many<br />
areas supplemental resources have been<br />
mobilized from external aid sources to<br />
support local council efforts. Local governments<br />
have made significant progress<br />
in fulfilling their legal responsibility to<br />
protect wetlands and river banks by<br />
negotiating land and water use with the<br />
local communities.<br />
Source: Bazaara 2003.<br />
Water in a changing world 271
PART<br />
4<br />
Chapter 15<br />
Measures to<br />
improve education,<br />
both access and<br />
quality, can<br />
improve access<br />
to water and<br />
sanitation<br />
Box 15.3<br />
Economic diversification in Mauritius helps promote access to<br />
water<br />
In the late 1970s and early 1980s Mauritius<br />
launched a policy to diversify away from traditional<br />
exports (sugar and garments). In 1988<br />
the government relaunched its tourism strategy,<br />
emphasizing low-environmental-impact,<br />
high-spending tourism. In 1970 agriculture<br />
accounted for 16% of global domestic product<br />
(GDP) and most exports (sugar), whereas<br />
manufacturing accounted for only 14% of<br />
GDP and mainly for the domestic market. The<br />
service sector, which made up the bulk of GDP,<br />
was largely non-tradable. By 1997 agriculture’s<br />
share in GDP had fallen to 9% and less than a<br />
quarter of exports. Manufacturing’s share had<br />
nearly doubled (to 25%). A flourishing tourism<br />
industry, which accounted for 15.7% of GDP<br />
and 26.8% of exports, had transformed services<br />
into a tradable sector. By 1999 manufactured<br />
goods accounted for 75% of merchandise<br />
exports.<br />
Today, as an indirect result of these economic diversification<br />
efforts of the 1970s and 1980s, 94%<br />
of the population in both rural and urban areas<br />
has access to piped water and basic sanitation.<br />
While agriculture is still by far the greatest water<br />
user, accounting for 68%, the domestic sector is<br />
the second, at 30%. This is largely to support the<br />
tourism industry, the other economic mainstay of<br />
Mauritius, whose development was aided by significant<br />
investment in water supply infrastructure.<br />
Source: Benevides and Pérez-Lucy 2001; FAO-AQUA-<br />
STAT database; Zhang 2003; Bird, Chenje, and Medina<br />
2002; Chang 2008; WHO/UNICEF Joint Monitoring Programme<br />
for Water Supply and Sanitation 2008, p. 48.<br />
Box 15.4<br />
Economic diversification alone is not<br />
necessarily good for the environment or<br />
water systems. Its impacts depend on the<br />
trade-offs and choices that are being made,<br />
including which sectors are growing and<br />
what technology is being used. It is also<br />
increasingly recognized that longer-term<br />
considerations such as climate change (see<br />
chapters 5 and 11) should be factored into<br />
diversification schemes at local and national<br />
levels to ensure their sustainability<br />
and long-term economic viability.<br />
Creating space through social<br />
policies for education and health<br />
There are close and multiple links between<br />
education and water and sanitation.<br />
More relevant schools lead to benefits for<br />
water<br />
Efforts to increase the effectiveness<br />
of basic education programmes by<br />
integrating students’ environment<br />
into the curriculum (school gardening<br />
in rural areas, for example) show that<br />
attendance increases and students<br />
learn appropriate ways of interacting<br />
with their environment, including in<br />
agriculture, land and water management.<br />
Schools are able to forge<br />
stronger links with their communities<br />
as service providers, including of agricultural<br />
information, making school<br />
more relevant.<br />
Policy decisions that are essentially<br />
driven by education goals – increasing<br />
school attendance – can also create<br />
space for improvements in water<br />
management. The 2000 National Programme<br />
for Curriculum Development<br />
in Sri Lanka acknowledged that<br />
‘information regarding food habits<br />
and types of food . . . can be used in<br />
introducing innovative strategies in<br />
education. Outdoor activities using<br />
agricultural plots in the school and the<br />
home can also make learning more<br />
meaningful and hence attractive.<br />
These plots could be used for introducing<br />
concepts in mathematics, language<br />
and social studies, etc. . . . Since<br />
agriculture is the main occupation of<br />
the parents in the Sinhala Medium<br />
areas, every attempt must be made to<br />
help them to learn better practices.<br />
Well maintained agricultural plots in<br />
the school could . . . also serve as demonstration<br />
plots for the community.’<br />
Source: Atchoarena and Gasperini 2003,<br />
pp. 180-85.<br />
Provision of adequate sanitation in education<br />
facilities, particularly for girls, goes<br />
hand in hand with access to education.<br />
Similarly, interventions to increase access<br />
to basic education are often accompanied<br />
by efforts to provide drinking water in or<br />
around schools. In addition, education<br />
about health, water and sanitation, water<br />
in agriculture and environmental issues<br />
more broadly can lead to more sustainable<br />
performance (box 15.4).<br />
Measures to improve education, both<br />
access and quality, can improve access<br />
to water and sanitation. Women with<br />
education have fewer children, which has<br />
beneficial consequences for the health of<br />
mothers and children and results in lower<br />
demand per family for food and water (see<br />
chapter 2, especially figure 2.3). Removing<br />
or reducing school fees could free<br />
household income to pay for other services<br />
– including food and water or agricultural<br />
inputs that could increase water productivity.<br />
Higher schooling achievement may<br />
contribute to better water management by<br />
increasing prospects for non-agricultural<br />
employment, potentially reducing the<br />
land under cultivation and, in turn, the<br />
amount of water used for irrigation. For<br />
land under cultivation to shrink, however,<br />
off-farm employment has to generate<br />
enough income to reduce a family’s reliance<br />
on agriculture for its livelihood – still<br />
unlikely in most rural areas. In China,<br />
for example, estimates of the returns on<br />
investment in education show that the<br />
increase in rural income during the 1990s<br />
came mainly from off-farm employment.<br />
Studies have shown that government policies<br />
that increased investment in education<br />
and in infrastructure for non-farm<br />
272 World Water Development Report 3
sectors in rural areas contributed significantly<br />
to rural non-farm employment and<br />
to household income. 6 In many cases this<br />
can make the agricultural sector more efficient,<br />
by generating income that can be<br />
used to provide better agricultural inputs.<br />
There are indirect links between the loss<br />
of agricultural labour force to diseases<br />
such as HIV/AIDS and land degradation<br />
and unsustainable agricultural practices. 7<br />
HIV-related disease and death cause<br />
agricultural productivity to decline. This<br />
creates or accelerates a feedback loop<br />
between poverty and pressures on natural<br />
resources, including water. There are similar<br />
links between agriculture and malaria,<br />
with integrated pest management or an<br />
ecosystem approach helpful in preventing<br />
malaria transmission as well as improving<br />
land and water productivity and food<br />
security. 8 An agricultural intervention in<br />
Kenya paved the way for improvements<br />
in natural resources management, including<br />
water, although its primary goal was<br />
malaria prevention (box 15.5).<br />
Other interventions in the health sector<br />
also promote better water management or<br />
sanitation. For example, HIV/AIDS education<br />
and awareness programmes can be<br />
closely tied to education reform, including<br />
efforts to integrate the students’ environment<br />
into education programmes (see box<br />
15.4). Initiatives to limit the public’s exposure<br />
to toxic chemicals (including agrochemicals)<br />
include efforts to limit chemical<br />
dispersal in the environment (air, land<br />
or water) and can have an impact on water<br />
quality. The United Nations Economic<br />
Commission for Europe and World Health<br />
Organization Euro Protocol on Water<br />
options from beyond the water box<br />
and Health, adopted in 1999, recognizes<br />
this mutually reinforcing relationship<br />
between health and water policies. The<br />
protocol is the first international treaty<br />
designed to reduce water-related deaths<br />
and diseases through improved water<br />
management and universal access to safe<br />
water and adequate sanitation. This goal<br />
is to be achieved through such measures<br />
as establishing systems of surveillance<br />
and response to water-related outbreaks<br />
and adopting national targets and mechanisms<br />
to ensure mutual support and<br />
compliance review. 9<br />
Clearing pathways towards<br />
win-win situations: avoiding<br />
negative impacts<br />
Decisions at many levels and sectors can<br />
have large impacts on water, while water<br />
constraints can pose challenges to private<br />
entrepreneurship, economic development,<br />
poverty reduction and sustainable<br />
environmental services. Avoiding negative<br />
impacts on water is a matter not only of<br />
social responsibility, but also of the longterm<br />
sustainability of public and private<br />
investments.<br />
Economic decisions rarely consider their<br />
potential environmental impacts, including<br />
possible adverse effects on water. And<br />
although water constraints can influence<br />
the outcomes of economic strategies, water<br />
managers and water actors rarely participate<br />
in economic decisions. But recognition<br />
is building that water use will need to<br />
be more sustainable to achieve economic<br />
growth agendas, especially where the<br />
economy is highly dependent on water.<br />
For example, in Djibouti, where water<br />
PART<br />
4<br />
Decisions at<br />
many levels and<br />
sectors can have<br />
large impacts on<br />
water, while water<br />
constraints can<br />
pose challenges<br />
to private<br />
entrepreneurship,<br />
economic<br />
development,<br />
poverty reduction<br />
and sustainable<br />
environmental<br />
services<br />
Box 15.5<br />
The ecohealth approach: combating malaria through<br />
agricultural practices in Kenya<br />
A project in Kenya – under the umbrella of the<br />
International Development Research Centre<br />
Program Initiative on Ecosystem Approaches to<br />
Human Health and bringing together experts<br />
from the International Centre for Insect Physiology<br />
and Ecology and the International Water Management<br />
Institute as well as the local community<br />
– is examining links between agriculture and<br />
malaria using an ecosystem approach. The goal<br />
is to reduce the incidence of malaria through a<br />
range of agricultural practices:<br />
• Reduce mosquito-breeding habitats by limiting<br />
the water used for rice cultivation.<br />
• Reduce the length of time that paddies<br />
are wet, by changing flooding schedules<br />
or alternating rice cultivation with dryland<br />
crops such as soya. In addition to limiting<br />
the mosquitoes’ habitat, planting soya<br />
could boost income, improve nutrition and<br />
save water.<br />
• Introduce naturally occurring bacteria into<br />
stagnant water to kill mosquito larvae during<br />
the peak breeding season.<br />
The heart of the ecosystem approach is to<br />
actively include community members in the<br />
research process, therefore helping researchers<br />
understand people’s perceptions about the<br />
health and development problems in the area.<br />
This approach also seeks interventions and solutions<br />
that are transdisciplinary.<br />
Source: Poverty-Environment Partnership 2008.<br />
Water in a changing world 273
PART<br />
4<br />
Chapter 15<br />
As the example of<br />
Ethiopia shows,<br />
all decisions about<br />
water use and<br />
management take<br />
place in a context<br />
of macro- and<br />
microeconomic<br />
Box 15.6<br />
policies and<br />
decisions<br />
scarcity is severe, the 2004 Poverty Reduction<br />
Strategy Paper recognizes that ‘the<br />
absence of a natural resources base, weak<br />
human capital, high costs of labour and<br />
production factors (energy, telecommunications<br />
and water), inadequate financial<br />
intermediation, and administrative constraints<br />
of all kinds are the key obstacles to<br />
economic growth and to the development<br />
of private initiative’. 10<br />
Tunisia, a country with very limited water<br />
resources, has succeeded in stabilizing<br />
its demands and has plans for more active<br />
demand management (see box 14.3<br />
in chapter 14). Tunisia implemented a<br />
national water-saving strategy at an early<br />
stage for both urban and agricultural<br />
needs, in line with its long tradition as<br />
an ‘oasis’ culture with experience managing<br />
common but scarce water resources.<br />
Water demand for irrigation has been<br />
stable for more than six years, despite<br />
agricultural development, seasonal peaks<br />
in demand and unfavourable climate conditions<br />
(drought). The water demands of<br />
tourism (a source of foreign currency) and<br />
cities (a source of social stability) have<br />
been met.<br />
Several principles underlie the Tunisian<br />
strategy:<br />
• Abandoning isolated technical<br />
measures in favour of an integrated<br />
approach.<br />
• Empowering users through a participatory<br />
approach (960 water user associations<br />
were created covering 60%<br />
of the irrigated public area).<br />
Measuring the water limits to growth in<br />
Ethiopia<br />
Until recently, most policy and macroeconomic<br />
decisions in Ethiopia have<br />
been based on growth models that<br />
assume that rainfall is consistently<br />
distributed at historical average levels.<br />
These models do not take into account<br />
shocks to the economy caused by<br />
extreme water events, such as floods<br />
and droughts.<br />
A World Bank study on Ethiopia estimated<br />
the magnitude of the impacts<br />
of high water variability on growth<br />
and poverty to assist the government<br />
in better managing water and<br />
other parts of the economy (trade,<br />
transport) and to reduce the impacts<br />
of water shocks. The study found<br />
that considering the effects of water<br />
variability reduced projected rates<br />
of economic growth 38% a year and<br />
increased projected poverty rates 25%<br />
over a 12-year period. It also found<br />
that investments in water infrastructure,<br />
such as irrigation systems, were<br />
needed to reduce vulnerability to<br />
rainfall variability and that transport<br />
infrastructure helped communities<br />
adjust to localized crop failures by<br />
enabling farms to sell their surplus<br />
in food-deficit areas. The analysis,<br />
conducted with the Ethiopian government,<br />
helped make water resources<br />
management a central focus of the<br />
government’s national poverty reduction<br />
strategy.<br />
Source: Sadoff 2006.<br />
• Introducing reforms gradually and<br />
adapting them to local conditions.<br />
• Applying financial incentive mechanisms<br />
to promote use of water-efficient<br />
equipment and technologies (equipment<br />
purchases subsidized at 60%).<br />
• Supporting farmers’ incomes, to allow<br />
them to plan for agricultural investment<br />
and labour.<br />
• Introducing a transparent and flexible<br />
pricing system, aligned with the<br />
national goals of food security and<br />
equity, leading to gradual recovery<br />
of costs. The drinking water pricing<br />
system supplies a basic-need level of<br />
services at low cost. 11<br />
As the example of Ethiopia shows, all<br />
decisions about water use and management<br />
take place in a context of macroand<br />
microeconomic policies and decisions<br />
(box 15.6). To be attractive to public and<br />
private actors, sustainable water management<br />
must also make economic sense.<br />
Even in the growing number of companies<br />
that promote social responsibility,<br />
economic viability remains the key driver<br />
of business decisions. But as the examples<br />
of the Coca-Cola Company (box 15.7)<br />
and Mondi (box 15.8) show, reducing the<br />
adverse effects of production on water is<br />
not only a matter of social responsibility<br />
– it can also make good business sense.<br />
Box 15.9 illustrates this point with several<br />
examples.<br />
The Coca-Cola example shows that companies<br />
have much to lose in public image<br />
and consumer trust when they compete<br />
with traditional uses of water. In this case<br />
the damage to the company’s image was<br />
potentially higher than the costs of taking<br />
preventive action. In the Mondi example<br />
another large company coupled its plans<br />
for expansion and profitability with measures<br />
designed to have a positive effect on<br />
the environment.<br />
Further demonstration of rising private<br />
sector awareness of the centrality of<br />
sustainable water management is the<br />
adoption of the CEO Water Mandate by<br />
the members of the UN Global Compact<br />
as a voluntary platform for addressing<br />
sustainability in business operations and<br />
supply chains. 12 Launched 5-6 March<br />
2008 by the UN Secretary-General and<br />
committed business leaders to help<br />
companies develop a comprehensive approach<br />
to water management, the mandate<br />
covers six areas: direct operations,<br />
274 World Water Development Report 3
options from beyond the water box<br />
PART<br />
4<br />
Box 15.7<br />
The Coca-Cola controversy in Kala Dera, India – learning from mistakes<br />
In 2000 the Coca-Cola Company began<br />
bottling operations in Kala Dera, a large<br />
village outside Jaipur, Rajasthan, India,<br />
where irrigated agriculture is the primary<br />
source of livelihood. Within a year the<br />
community noticed a rapid decline in<br />
groundwater levels, for which the plant<br />
was blamed. The community demanded<br />
closure of the plant, and the cause received<br />
some international support, mainly<br />
from university students in Canada, the<br />
United Kingdom and the United States,<br />
some of Coca-Cola’s largest markets.<br />
In late 2004 the company agreed to<br />
an independent enquiry into its water<br />
management practices by the Energy and<br />
Resources Institute (TERI), a non-profit international<br />
research organization based in<br />
New Delhi. Released in January 2008, the<br />
report was welcomed by both sides, each<br />
finding some support for its positions.<br />
For the activists opposed to the bottling<br />
plant the report confirmed that the<br />
plant was operating in an ‘overexploited’<br />
groundwater area and that the plant’s<br />
operations were contributing to a worsening<br />
water situation and were a source of<br />
stress to the community. The assessment<br />
made four recommendations: the plant<br />
could transport water from the nearest<br />
unstressed aquifer, store water from<br />
low-stress seasons, relocate the plant to<br />
a water-surplus area or shut down this<br />
facility.<br />
For Coca-Cola the report noted that<br />
the company was a very small user of<br />
water, tapping less than 1% of the area’s<br />
available water. Nonetheless, the report<br />
recommended more consideration of<br />
community water needs in plant location<br />
and operations, arguing that ‘assessment<br />
of water availability in the vicinity<br />
of a bottling operation should be from a<br />
perspective . . . wider than business continuity’.<br />
Coca-Cola India pledged to reach<br />
a net-zero balance in groundwater use<br />
by the end of 2009, installed a rainwater<br />
harvesting system for groundwater recharge<br />
and drafted guidelines for engaging<br />
with the community. To help farmers<br />
use water more efficiently, Coca-Cola, in<br />
partnership with local farmers and the<br />
government, has started drip irrigation<br />
projects with 15 farmers. Some 15 more<br />
projects are planned in 2008-09.<br />
Assessments across various plant sites<br />
indicated that the state governments<br />
in India have not been able to value<br />
their water resources appropriately. The<br />
review report seems to move towards a<br />
view that holds corporations responsible<br />
for their environmental impact beyond<br />
the strictures of existing regulations.<br />
The report recommends that Coca Cola<br />
‘define a strategy wherein it is able to<br />
offset this anomaly through appropriate<br />
and commensurate interventions that . . .<br />
result in a stream of benefit flows to the<br />
community.’<br />
Source: TERI 2008.<br />
Box 15.8<br />
Mondi South Africa achieves sustainable expansion<br />
Mondi South Africa, a wholly owned subsidiary<br />
of Anglo American plc, produces<br />
pulp, paper, board, corrugated containers<br />
and mining support systems. Activities<br />
range from forestry operations to highly<br />
technical manufacturing and converting<br />
processes. To increase its competitiveness<br />
in a demanding international pulp<br />
market, Mondi implemented a 2.3 billion<br />
rand (approximately $24 million) expansion<br />
project, raising the mill’s production<br />
capacity 25% and accommodating a<br />
40% increase in timber supply from more<br />
than 2,800 small growers who form part<br />
of Mondi’s Khulanathi timber growers<br />
scheme.<br />
The project began in 2001 with an engineering<br />
study, followed by a detailed<br />
environmental impact assessment in<br />
2002. Through improvements in energy<br />
supply infrastructure and targeted<br />
equipment and technology upgrades,<br />
the company achieved its expansion<br />
objectives, while realizing the following<br />
benefits:<br />
• A 50% reduction in sulphur dioxide<br />
(2,177 tonnes).<br />
• A 35% reduction in nitrous oxide<br />
(509 tonnes).<br />
• A 50% reduction in carbon dioxide<br />
(297,121 tonnes).<br />
• A 60% reduction in total sulphur.<br />
• Total energy and water cost-savings<br />
of 38,678,843 rand (approximately<br />
$4.9 million).<br />
• A reduction in water use of some<br />
13,000 cubic metres per day.<br />
• A more than 25% reduction in<br />
wastewater.<br />
Source: WBCSD 2006.<br />
supply chain and watershed management,<br />
collective action, public policy,<br />
community engagement and transparency.<br />
The endorsing members of the CEO<br />
Water Mandate include the chief executive<br />
officers of 32 companies working in<br />
all economic sectors around the world,<br />
from agrifood to textile and financial<br />
institutions.<br />
Secretary-General Ban Ki-moon called on<br />
the business and international community<br />
during the 2009 Economic Forum meeting<br />
in Davos, Switzerland, to make water<br />
security one of the key topics for climate<br />
change adaptation and emphasized the<br />
importance of a Global Agenda Council on<br />
Water Security. 13<br />
Promoting win-win scenarios<br />
through cooperation and<br />
knowledge<br />
In addition to avoiding negative impacts,<br />
win-win choices need to be cultivated in all<br />
aspects of social life to deal with the urgency<br />
of the water situation around the world.<br />
Examples of win-win scenarios can be<br />
found in all policy areas – from traditional<br />
water-using sectors to security policies – and<br />
implemented at various scales and levels.<br />
Consultation and cooperative<br />
management<br />
Citizen participation in decision-making is<br />
central to promoting good governance and<br />
creating a climate of accountability and<br />
Water in a changing world 275
PART<br />
4<br />
Chapter 15<br />
Box 15.9<br />
Examples of clean production processes<br />
• In Turkey a tyre-making factory in the<br />
Izmit region reduced its water consumption<br />
by nearly three-quarters,<br />
from 900,000 litres a day to 250,000<br />
litres, thus also reducing its discharges<br />
into the community sewers.<br />
A detailed analysis made it possible<br />
to replace a cooling system with a<br />
closed-circuit system for an investment<br />
cost of $5,000 and a return<br />
time of two years.<br />
• In Egypt one of the largest tinnedfood<br />
manufacturers (Montazah, near<br />
Alexandria) underwent an eco-audit<br />
and introduced measures to reduce<br />
energy consumption: insulating steam<br />
pipes, replacing leaky parts, fitting<br />
a pressure regulator to the sterilizers<br />
and improving the recuperation<br />
system and boiler efficiency. Water<br />
consumption was reduced by implementing<br />
water-consumption hydrometer<br />
monitors, installing sprinklers (so<br />
that water flows only when needed)<br />
and improving the water collection<br />
and recycling system. The savings in<br />
water, steam and energy (nearly 40%<br />
savings in fuel consumption) made it<br />
possible to reduce discharges and amortize<br />
investments over 1-44 months.<br />
• One of Croatia’s biggest dairy companies,<br />
LURA in Zagreb-Lurat, undertook<br />
measures such as employee<br />
training, reducing the diameter of<br />
cleaning pipes and changing the hotwater<br />
circuit that reduced effluents<br />
by 286,000 cubic metres a year (or<br />
27%) and drinking water by 280,000<br />
cubic metres a year. These simple,<br />
low-cost measures (investment of<br />
€31,000) involved employees, saved<br />
water and energy (equivalent to<br />
€328,000 a year) and reduced effluents,<br />
with an investment amortization<br />
of less than one month.<br />
• In Tunisia a manufacturer of car batteries<br />
identified 19 ways of preventing<br />
contamination and pollution<br />
(acids, lead scoria and wastewater)<br />
and saving lead and energy. The costs<br />
of the new measures were $522,500,<br />
while savings amounted to $1.5 million<br />
a year.<br />
• In Mexico the General Motors de<br />
Mexico Ramos Arizpe Complex (2001<br />
Stockholm Water Award recipient)<br />
employed physical, chemical and<br />
biological wastewater treatment<br />
processes to recover and reuse 70%<br />
of its industrial wastewater. It also<br />
promoted use of brackish well water<br />
by separating salts and increasing the<br />
useable amount withdrawn from 67%<br />
to 94%. It helped reduce pressure on<br />
the only source of water for a population<br />
of 40,000, a small confined and<br />
brackish aquifer.<br />
• In India the Staple Fibre Division of<br />
Grasim Industries Ltd (2004 Stockholm<br />
Water Award recipient), a<br />
producer of viscose staple fibre, has<br />
reduced water consumption by 85%,<br />
process steam by 51% and electrical<br />
usage by 43% since 1980. The company<br />
was among the first to replace<br />
zinc – a pollutant particularly harmful<br />
to marine and aquatic life – with aluminium<br />
in its production process.<br />
• In Australia, the driest inhabited<br />
continent in the world, Sydney Water<br />
(2006 Stockholm Water Award<br />
recipient) supplies water to 4.2 million<br />
people. As part of its operating<br />
licence, Sydney Water is required to<br />
reduce per capita consumption by<br />
35% before 2011. Since the inception<br />
of its water conservation programme<br />
in 2001, Sydney Water has saved<br />
more than 20 million litres a day and<br />
more than 310 organizations have<br />
joined the initiative.<br />
• In the United States, Orange County,<br />
California, (2008 Stockholm Water<br />
Award recipient) focused on reuse in<br />
its groundwater replenishment system,<br />
which diverts and purifies highly treated<br />
sewer water that was previously<br />
discharged into the ocean and returns<br />
the cleaned water to the groundwater<br />
basin. The system will provide enough<br />
additional water to meet the needs<br />
of 500,000 more people without<br />
diminishing groundwater resources for<br />
current users (2.3 million).<br />
Source: Adapted from Benoit and Comeau 2005<br />
and www.siwi.org/sa/node.asp?node=77.<br />
transparency. Interventions to promote<br />
a culture of consultation and to increase<br />
consultative and participation capacity<br />
will help to deliver benefits in all areas, including<br />
collaborative water management.<br />
In 1978 Québec, Canada, created the<br />
Bureau d’audiences publiques sur l’environnement<br />
(BAPE), an independent entity<br />
charged with consulting with citizens on<br />
projects that might have environmental<br />
implications (box 15.10). The BAPE example<br />
shows that an adequately mandated<br />
consultative process can legitimize policy<br />
decisions and identify multiple social, economic<br />
and environmental benefits around<br />
sound water management.<br />
Creating institutions concerned with<br />
major water-related issues helps identify<br />
possibilities for collaborative initiatives in<br />
other areas of the economy as well. In the<br />
BAPE case the point of entry was the need<br />
for a new water policy that would answer<br />
the requirements of various users. Other<br />
points of entry can also be found. For<br />
example, technical investigations can pave<br />
the way to collaborative learning processes<br />
among scientists and decision-makers, as<br />
seen in the Upper San Pedro Partnership<br />
in Arizona in the United States (box 15.11).<br />
Cooperative management can occur between<br />
different types of actors, including<br />
public-private partnerships. One example<br />
is payments for environmental services,<br />
using market-based tools to create incentives<br />
for maintaining a water resource or<br />
paying for watershed services (see chapter<br />
14). In Costa Rica the water utility in the<br />
Heredia region pays landholders to protect<br />
forests on the hill slopes from which they<br />
derive their water, benefiting both landowners<br />
and municipal water customers. 14<br />
Win-win scenarios from sectoral<br />
interventions<br />
Agriculture. Lasting win-win benefits for<br />
water and agriculture often result from explicitly<br />
recognizing and analysing trade-offs<br />
276 World Water Development Report 3
options from beyond the water box<br />
PART<br />
4<br />
Box 15.10<br />
Québec’s Bureau d’audiences publiques sur l’environnement consultation on water<br />
resources management<br />
In 1998 the minister of the environment<br />
called on the Bureau d’audiences publiques<br />
sur l’environnement (Office for Public<br />
Hearings on the Environment, BAPE) to<br />
hold a public consultation on water management<br />
in Québec. The consultations<br />
– conducted through written comments,<br />
public hearings and discussions – helped<br />
develop recommendations on better water<br />
management.<br />
From 15 March 1999 to 1 May 2000 the<br />
commission held 142 public meetings in<br />
the 17 administrative regions of Québec<br />
and heard 379 briefs. The BAPE report,<br />
Water: A Resource to Be Protected, Shared<br />
and Enhanced, was submitted to the minister<br />
of the environment on 1 May 2000.<br />
The report emphasized three areas:<br />
• Improving governance through water<br />
management at the river basin level.<br />
• Preparing regional portraits covering<br />
the public’s expectations for<br />
water management and aquatic<br />
ecosystems.<br />
• Reforming legislation and institutions<br />
needed to implement an integrated<br />
water and aquatic ecosystem policy.<br />
The report addresses 16 themes, among<br />
them agricultural pollution abatement,<br />
hydroelectricity, integrated management<br />
of water and aquatic ecosystems at the<br />
watershed level, water exports and the<br />
special case of the St. Lawrence River.<br />
The commission made 13 main recommendations<br />
for the short, medium and<br />
long terms. It also presented findings and<br />
observations for the government’s reflection.<br />
In 2002 the government of Québec<br />
released its water policy, Water: Our Life,<br />
Our Future. The policy seeks to protect<br />
water resources as a unique heritage, manage<br />
water in a sustainable development<br />
perspective and better protect public<br />
health and the health of ecosystems.<br />
The policy adopts most of the BAPE<br />
recommendations. It reaffirms that water<br />
is part of the collective heritage of the<br />
province and incorporates measures<br />
intended to:<br />
• Implement integrated river basin<br />
management.<br />
• Implement this form of management<br />
in the St. Lawrence River, by granting<br />
it a special status.<br />
• Protect water quality and aquatic<br />
ecosystems.<br />
• Continue water clean-up efforts and<br />
improve water services management.<br />
• Promote water-related recreation and<br />
ecotourism activities.<br />
Source: Cosgrove 2009; BAPE 2000; Québec<br />
Ministry of the Environment 2002.<br />
Box 15.11<br />
Collaborative learning processes – adopting an adaptive management framework<br />
The Upper San Pedro Partnership in<br />
Arizona in the United States represents a<br />
diverse consortium of interests, including<br />
municipal, state and federal government<br />
institutions. From its initial goal of developing<br />
a definitive regional groundwater<br />
management plan in 1998, it evolved into<br />
a more complex, yet flexible, ongoing<br />
adaptive management planning process<br />
that endures a decade later.<br />
An adaptive management approach allows<br />
actions with low risk or uncertainty to be<br />
taken early on. Member agencies realized<br />
that implementing certain water management<br />
strategies required substantial<br />
information through monitoring, research<br />
and modelling efforts as well as political<br />
assessments, while other projects represented<br />
relatively low-risk strategies and<br />
could be implemented sooner. By 2003<br />
the partnership had identified more than<br />
100 projects for implementation, including<br />
repair of leaky infrastructure, car-wash<br />
water recycling, voluntary retirement of<br />
agricultural pumping through conservation<br />
easements, recharge of treated<br />
effluent and reintroduction of beavers. In<br />
the 2004 Water Management and Conservation<br />
Plan the partnership prioritized<br />
additional projects – developing model<br />
codes and ordinances, establishing waterconservation<br />
surcharges for excessive use,<br />
exploring a transfer of development rights<br />
programme and other measures. Projects<br />
with greater uncertainty, higher political<br />
risks or significant costs were targeted for<br />
additional feasibility studies or evaluation<br />
using a decision-support system model.<br />
The partnership uses the model to evaluate<br />
combinations of management options<br />
(scenarios) such as the possible relocation<br />
of municipal wells, construction of<br />
additional recharge facilities and various<br />
water augmentation strategies. Unlike a<br />
simple annual ‘bottom line’ water-budget<br />
approach, the model considers spatial and<br />
temporal groundwater management concerns,<br />
essential to sustain the ecological<br />
values of the San Pedro Riparian National<br />
Conservation Area.<br />
In San Pedro complex and controversial<br />
strategies such as water importation,<br />
the transfer of development rights and<br />
surcharges for excessive water use all had<br />
the potential to divide the community. To<br />
engage the community early on in planning<br />
processes, the partnership conducted<br />
a series of community meetings to provide<br />
citizens with an opportunity to thoughtfully<br />
consider issues and provide meaningful<br />
input.<br />
Source: Holly Richter, Udall Center for Studies in<br />
Public Policy.<br />
and factoring them into decision-making.<br />
Doing so may depend on the availability of<br />
information, collaborative decision-making<br />
and perceptions of available alternatives.<br />
In poor communities where survival is the<br />
main concern, people may have few choices<br />
about how they use land and water, or the<br />
perceived risks of alternatives could outweigh<br />
the potential benefits. This is why<br />
most successful integrated rural development<br />
initiatives are designed to help such<br />
communities reduce risks, develop alternatives<br />
and bring trade-offs to the forefront in<br />
decision-making (box 15.12).<br />
Investment in water infrastructure and<br />
sanitation can reduce poverty by stimulating<br />
productive activity (see chapter 6).<br />
In rural areas there is no definitive line<br />
between ‘household’ water use and water<br />
use for productive purposes – watering<br />
plots for food and cash crop production,<br />
Water in a changing world 277
PART<br />
4<br />
Chapter 15<br />
Box 15.12<br />
By the 1960s severe deforestation had<br />
seriously harmed the ecosystems and<br />
livelihoods of the people of Madhya<br />
Pradesh, India, resulting in widespread<br />
soil erosion, overgrazing and inappropriate<br />
land use, barren landscapes and<br />
seasonal migration of men in search<br />
of employment. Under a project<br />
implemented by the National Centre<br />
for Human Settlements and Environment<br />
and local communities with<br />
funds from the government of India,<br />
multiple interventions attempted to<br />
restore natural resources and improve<br />
the socioeconomic conditions of<br />
district residents. The project took an<br />
integrated management approach,<br />
based on community needs. Activities<br />
included:<br />
• Protected afforestation on community<br />
land.<br />
• Distribution of seedlings to encourage<br />
planting on private land.<br />
• Soil and water conservation.<br />
The Integrated Watershed Development<br />
Programme in Jhabua District, Madhya<br />
Pradesh, India<br />
• Pasture improvement through<br />
planting pasture grasses.<br />
• Water harvesting.<br />
• Distribution of subsidized fuel and<br />
energy-saving devices.<br />
• Integration of land use innovations<br />
with measures to improve community<br />
livelihoods.<br />
• Promotion of alternative incomegenerating<br />
activities to reduce poverty<br />
and reduce seasonal migration.<br />
In addition to immediate land productivity<br />
benefits, there were many<br />
positive ecosystem-wide benefits, including<br />
a marked increase in groundwater<br />
recharge and water supply from<br />
harvesting. Livelihoods improved as<br />
well. The model was subsequently<br />
adopted by neighbouring states.<br />
Source: National Rural Development Institute<br />
n.d.; www.mprlp.in; www.nchse.org/<br />
projects.htm.<br />
livestock, trade and other income-generating<br />
activities. The amount of water provided<br />
to poor households with access to<br />
land needs to be sufficient for these other<br />
income-generating purposes.<br />
Multiple-use initiatives for water recognize<br />
the benefits to poor households of<br />
having adequate water for non-household,<br />
income-earning activities (box 15.13). But<br />
such initiatives are often not in line with<br />
water efficiency efforts. Surface irrigation<br />
is the most water-demanding form of<br />
irrigation, but the excess water can have<br />
other benefits: it enables aquaculture (as in<br />
rice fields in China) and washes off the salt<br />
accumulating in topsoil (avoiding salinization<br />
of cultivated lands). Efforts to save<br />
water by reducing water input would thus<br />
mean the loss of an income source (fish<br />
production) and potentially of cultivated<br />
lands, if salt accumulation becomes severe.<br />
Integrated multiple-use systems are found<br />
worldwide – usually documented at the<br />
farm and field levels – but conflicting<br />
management objectives are just as common<br />
and create hurdles for the promotion<br />
of these systems. Multiple uses of<br />
water imply multiple interest groups<br />
whose water management objectives may<br />
not always be compatible. Despite much<br />
evidence of integrated water use at the<br />
farm level (such as rice-fish systems and<br />
irrigation- aquaculture systems), sectoral<br />
management at higher levels impedes true<br />
integration of water and irrigation with<br />
other sectors, including fisheries, forestry<br />
and sanitation. Furthermore, multiple<br />
uses and demands for water can generate<br />
opportunity costs and externalities, even<br />
when some uses are non-consumptive (fish<br />
farming in irrigation canals, for example).<br />
These problems are intensified by<br />
the seasonality of supply and the limited<br />
availability of irrigation water in semi-arid<br />
tropical countries as well as the common<br />
pool, open access nature of the resource. 15<br />
Box 15.13<br />
Experience with multiple-use water services in Nepal<br />
Since 2003 Winrock International Development<br />
Enterprises and local partners have<br />
worked with more than 70 communities in<br />
14 districts in Nepal to develop multipleuse<br />
water systems serving some 1,600<br />
households (more than 9,300 people). The<br />
approach combines multiple-use water<br />
services with supporting business services<br />
that allow the rural poor to realize health<br />
benefits as well as sustainable increases<br />
in income. Proven low-cost technologies<br />
(nearby low-flow sources that are often bypassed<br />
by conventional programmes) are<br />
used to provide cost-effective water services<br />
to small communities (15-50 households).<br />
Related business services focus on<br />
income-generating opportunities from<br />
productive water use activities, primarily<br />
high-value horticulture. Typically, such<br />
business services involve assessing rural enterprises<br />
(inputs, costs, demand, markets<br />
and prices) and identifying ways to add<br />
value through products and services.<br />
An evaluation of the Nepal pilot programme<br />
found that, in addition to<br />
receiving water for drinking and domestic<br />
uses, households with multiple-use water<br />
services had increased their average gross<br />
incomes by $250 a year through the<br />
production and sale of horticultural products,<br />
made possible by reliable access to<br />
productive water. For 70% of the systems,<br />
gross margins covered costs within one<br />
year. All schemes are managed by water<br />
user associations, which are responsible<br />
for securing water rights, operating and<br />
maintaining the systems and managing<br />
finances. Households contribute to operation,<br />
maintenance and capital replacement<br />
of the system. About 75% of water<br />
user associations have savings and credit<br />
schemes, and many provide revolving<br />
microcredit for income-generating activities.<br />
Some 85% of households surveyed<br />
were highly satisfied with multiple-use<br />
water services, reporting greater quantities<br />
of water available within close proximity<br />
(less than 60 metres away, on average) for<br />
household use, irrigation and livestock.<br />
Other important benefits included time<br />
saved from no longer hauling water,<br />
reduced incidence of diarrhoeal diseases,<br />
higher consumption of nutrient-rich vegetables<br />
and increased school attendance<br />
by girls (more than 65% of households).<br />
More than 60% of households had installed<br />
sanitary latrines, a combined effect<br />
of more water for sanitation, increased<br />
income and sanitation marketing.<br />
Source: Development Vision – Nepal 2007.<br />
278 World Water Development Report 3
options from beyond the water box<br />
PART<br />
4<br />
Energy. Energy demand and water use are<br />
closely linked (see chapter 7). Energy costs<br />
and concerns about energy efficiency can<br />
be brought to bear in addressing water<br />
issues. In parts of South Asia and other<br />
regions where farmers use groundwater<br />
drawn from private wells, the price of electricity<br />
needed for pumping is a powerful<br />
instrument for controlling groundwater<br />
abstraction by influencing farmers’ pumping<br />
behaviour.<br />
However, electricity is underpriced in<br />
many areas. The arguments against raising<br />
electricity prices, and the practical problems<br />
in doing so, are similar to those for<br />
holding down irrigation water prices for<br />
small farmers. However, the rising cost of<br />
public subsidies for fuel and electric power<br />
has steeled the resolve of many governments<br />
to tackle this perverse incentive for<br />
overabstraction of water. The metering<br />
of electricity to farmers in North China<br />
shows the efficacy of economic pricing<br />
for resource management, given the right<br />
institutional structure. 16<br />
In the example in box 15.14 decisions<br />
about energy sources and consumption are<br />
motivated primarily by profitability and<br />
cost reduction, but they can also generate<br />
benefits for water.<br />
Adequate water and energy are prerequisites<br />
for breaking the cycle of poverty.<br />
Using renewable energy in rural electrification,<br />
for example, is a win-win scenario<br />
at the local level. Greater availability of<br />
electricity would lessen dependence on<br />
fuelwood (still a significant source of<br />
energy in Africa, for example), reducing<br />
deforestation and its effects on the local<br />
water cycle, while providing an engine for<br />
growth.<br />
Local benefits vary by setting, but health<br />
benefits (from reductions in indoor air<br />
pollution), environmental benefits (from<br />
reduced deforestation and emissions) and<br />
economic benefits (from use of a renewable<br />
energy source) are all possible.<br />
Tourism. With 898 million travellers worldwide<br />
in 2007 and 1.6 billion forecast for<br />
2020, tourism is a growing sector of the<br />
economy in many developing countries. 18<br />
In addition to direct employment and<br />
investment, tourism generates jobs and<br />
revenues in surrounding communities and<br />
stimulates infrastructure investment. Sustainable<br />
tourism, or ecotourism, can also<br />
provide the impetus for conservation efforts.<br />
Tourism depends on the availability<br />
of natural resources, landscapes and ecosystem<br />
services, chief among them water<br />
and biological diversity. But construction<br />
of tourism installations and infrastructure<br />
can also harm ecosystems through pollution,<br />
deforestation and overexploitation.<br />
Tourism also requires increased water<br />
supply and sanitation services, which can<br />
divert water from other uses. Antigua and<br />
Barbuda, whose economy is dependent on<br />
tourism, must purchase water from neighbouring<br />
Dominica to satisfy demand.<br />
There is increasing evidence that win-win<br />
scenarios for tourism and water are possible,<br />
as well as for tourism and community<br />
development. In Tunisia higher water tariffs<br />
for tourist establishments cross-subsidize<br />
water supplied to Tunisians (see box 14.3<br />
in chapter 14). With the recent rise in<br />
consumer awareness, tourism enterprises<br />
everywhere are trying to demonstrate corporate<br />
social and environmental responsibility.<br />
Governments are also working to<br />
promote more integrated tourism investment<br />
planning, sustainable use of protected<br />
the rising cost of<br />
public subsidies for<br />
fuel and electric<br />
power has steeled<br />
the resolve of many<br />
governments to<br />
tackle this perverse<br />
incentive for<br />
overabstraction<br />
of water<br />
In the Dominican Republic, where many<br />
people in rural areas have no access to<br />
electricity, the non-governmental organization<br />
Association for Solar Energy Development<br />
helped more than 5,000 households<br />
obtain home solar power systems,<br />
and numerous other public facilities have<br />
been powered by solar energy. The association<br />
estimates that 3-6 tonnes of carbon<br />
dioxide emissions are avoided for each 50<br />
gigawatt panel that replaces kerosene lighting.<br />
17 In addition to enabling communities<br />
to engage in alternative income-generating<br />
activities, the programme helped develop<br />
solar-powered potable water systems.<br />
Using solar energy to draw groundwater<br />
reduces the costs of access to water while<br />
providing access to higher-quality water,<br />
since surface waters are often polluted.<br />
Box 15.14<br />
Eco-efficiency, a microeconomic<br />
objective, focuses on reducing the<br />
amount of water, energy, chemicals<br />
and raw materials used per unit of<br />
output. Eco-efficiency is motivated<br />
not only by environmental concerns<br />
but also by prospects of financial<br />
savings through reduced energy<br />
and water bills, less money spent on<br />
raw materials and fewer regulatory<br />
hurdles.<br />
The drive for competitive advantage leads to<br />
water benefits<br />
Swiss-based ST Microelectronics cut<br />
electricity use 28% and water use 45%<br />
in 2003 and reported saving $133<br />
million. DuPont committed to keeping<br />
energy use flat no matter how much<br />
production increased, which has<br />
reportedly saved more than $2 billion<br />
over the past decade. Advanced Micro<br />
Devices tracks kilowatt hours per<br />
manufacturing index and reports a<br />
60% reduction from 1999 to 2005.<br />
Although motivated by the need to<br />
innovate and increase profitability,<br />
competitiveness and market shares,<br />
these measures have all had the added<br />
benefit of decreasing water use and<br />
limiting pollution.<br />
Source: Worldwatch Institute 2008.<br />
Water in a changing world 279
PART<br />
4<br />
Chapter 15<br />
Water is emerging<br />
as a strategic<br />
resource that<br />
underpins many<br />
dimensions<br />
of security<br />
areas, impact assessments and certification<br />
programmes. Ecotourism can help promote<br />
conservation, poverty reduction and sustainable<br />
water management when adequate<br />
enforcement and benefit-sharing mechanisms<br />
are in place (box 15.15).<br />
Promoting multiple objectives<br />
through regional economic<br />
development<br />
Regionally based development efforts at<br />
the subnational level usually involve a<br />
package of interventions in multiple and<br />
mutually reinforcing sectors. Because<br />
water resources are a cornerstone of economic<br />
development in many areas, regional<br />
economic development programmes<br />
are either organized around water interventions<br />
(as in the Southeast Anatolia<br />
example in box 15.16) or indirectly related<br />
to the water sector. As the example of the<br />
Tennessee Valley Authority in the United<br />
States shows, achieving multiple economic,<br />
social and environmental objectives<br />
simultaneously is not only possible,<br />
but also potentially easier than pursuing a<br />
single objective (box 15.17).<br />
Promoting win-win scenarios<br />
through security and crisis<br />
prevention<br />
There are multiple links between water<br />
and human security and, to some extent,<br />
national security – from individual food<br />
security, health, hygiene and sanitation,<br />
and economic security to regional conflicts<br />
among water users. Climate change, with<br />
its associated pressures on water resources,<br />
is expected to worsen human security<br />
everywhere – by undermining development<br />
efforts and by exposing more people<br />
to disasters resulting from extreme weather<br />
events and disrupted ecosystems.<br />
Governments are increasingly concerned<br />
about security, including energy security,<br />
development and socioeconomic security<br />
and physical security. Political stability, a<br />
tenuous achievement in many countries,<br />
also depends on perceptions of economic<br />
vulnerability (as evidenced in early 2008<br />
riots over rising food costs in such countries<br />
as Bangladesh, Haiti, Somalia and<br />
Yemen) and physical safety. The water-stability<br />
link is also stronger where water resources<br />
are scarce and competition among<br />
users is likely to occur on a large scale. 19<br />
Promoting human security. Water is emerging<br />
as a strategic resource that underpins<br />
many dimensions of security. And many<br />
interventions at the local, regional and<br />
global levels that are designed to address<br />
security concerns are linked to water resources<br />
management (box 15.18).<br />
An example is the development of renewable<br />
energy to promote energy security.<br />
This can generate significant benefits for<br />
water – freeing it for other uses and for<br />
the protection of ecosystem integrity.<br />
Disaster preparedness and climate early<br />
Box 15.15<br />
Sustainable tourism, Çıralı, Turkey<br />
Having experienced a surge in tourism,<br />
Turkey is predicted to join Greece and<br />
Croatia as a leading tourist destination in<br />
the Mediterranean by 2020. The Southwestern<br />
Anatolian coast of Turkey, identified<br />
by WWF as one of the most ecologically<br />
important in the Mediterranean, is<br />
also the most affected by mass tourism<br />
development. To avoid the destruction<br />
of its fragile coastline, the government of<br />
Turkey has adopted an integrated coastal<br />
management approach aimed at preserving<br />
not only the natural heritage but also<br />
social and cultural integrity.<br />
Çıralı was chosen for a pilot project to<br />
implement this approach. Çıralı had<br />
shifted from an agricultural economy<br />
towards tourism in the late 1980s. The<br />
resulting construction of tourism facilities<br />
led to multiple problems. Pesticides from<br />
agricultural activities had already polluted<br />
soil and water sources, which were further<br />
threatened by the growth of tourist restaurants<br />
around the village’s main spring.<br />
Illegal construction spread due to the<br />
lack of enforcement of land development<br />
regulations.<br />
What precipitated a change was that Çıralı<br />
beach was a major nesting site for the<br />
endangered loggerhead sea turtle (Caretta<br />
caretta). WWF Turkey (formerly known as<br />
the Turkish Society for the Conservation<br />
of Nature) entered the scene initially to<br />
help protect the turtle. In 1997 the project<br />
was broadened from turtle protection to<br />
stimulating community awareness of its<br />
responsibility for the natural environment<br />
and to developing a model of sustainable<br />
tourism in Çıralı. WWF examined land<br />
resources management in the area and the<br />
potential to create diverse, sustainable and<br />
environment-friendly economic opportunities<br />
and to protect biodiversity.<br />
With a new awareness of the need to<br />
become guardians of their natural heritage,<br />
the local community pressured for<br />
enforcement of the existing Coastal Law.<br />
The responsible ministry, with buy-in<br />
from local residents, moved the kiosks<br />
and restaurants that had been built too<br />
close to the shore in violation of the law.<br />
WWF and the ministry prepared further<br />
guidelines and recommendations for wise<br />
use of land resources, including a land use<br />
plan that defined the positioning of building<br />
infrastructure in the area and a land<br />
management plan. Ecotourism activities<br />
were started to generate support for conservation<br />
and create economic opportunities<br />
for the local community throughout<br />
the year, instead of just seasonally. As<br />
part of the venture locals were trained as<br />
nature guides, and trekking paths were<br />
identified – activities that attracted young<br />
people in the community. A move was also<br />
promoted from input-intensive agriculture,<br />
which polluted soil and water supplies, to<br />
organic agriculture. A cooperative was set<br />
up by the farmers to produce and market<br />
organic products and to create a brand for<br />
produce of Çıralı origin.<br />
Source: peopleandplanet.net 2002; www.<br />
panda.org/news_facts/newsroom/news/index.<br />
cfm?uNewsID=13382&uLangID=1.<br />
280 World Water Development Report 3
options from beyond the water box<br />
PART<br />
4<br />
Box 15.16<br />
Integrating multiple sectors in Southeast Anatolia, Turkey<br />
Turkey’s Southeastern Anatolia Project<br />
(GAP) is a multisectoral, socioeconomic<br />
development project designed to raise<br />
incomes in this less-developed region to<br />
narrow the regional income disparities<br />
by improving the economic structure,<br />
increasing productivity and employment<br />
opportunities in rural areas, enhancing<br />
the assimilative capacity of larger cities<br />
in the region and contributing to the<br />
national objectives of sustained economic<br />
growth, export promotion and social<br />
stability.<br />
Begun as a water infrastructure development<br />
project, GAP evolved into a programme<br />
that supports sustainable social<br />
and economic development through additional<br />
investments in urban and rural infrastructure,<br />
agriculture, transport, industry,<br />
education, health, housing, tourism,<br />
environmental protection, gender equality<br />
and poverty reduction. The programme’s<br />
total costs are split between investments<br />
in water-related projects (48%) and those<br />
in other sectors (52%).<br />
The project area is home to 6.5 million<br />
people, or 10% of the country’s population.<br />
The project will generate 27,470<br />
gigawatt hours of electricity, boosting national<br />
hydroelectrical output by 70%, and<br />
add 1.7 million hectares to the 4.5 million<br />
hectares of irrigated land.<br />
Governance of the project changed with<br />
the evolution of its philosophy. Management<br />
of the project began under the<br />
national water authority in the 1970s and<br />
shifted to the national planning organization<br />
in the 1980s. In 1989 the government<br />
established a mandated entity, the GAP<br />
Regional Development Administration,<br />
to coordinate special programmes and<br />
projects in social services (education,<br />
health), gender equity and empowerment,<br />
urban management, participatory irrigation<br />
management, agricultural productivity,<br />
resettlement, environmental conservation<br />
and protection, and institutional and community<br />
capacity-building. The GAP Higher<br />
Council, the highest decision-making body,<br />
is chaired by the prime minister and initially<br />
included ministers for planning, energy and<br />
natural resources, and public works. Ministers<br />
for agriculture and environment were<br />
added later. It has a coordinating body<br />
of line ministries operating in the project<br />
area, local governments, local chambers<br />
of industry and trade, local chambers of<br />
agriculture and regional universities.<br />
The overall cost of the GAP is projected at<br />
$32 billion, of which $17 billion has been<br />
invested. Per capita farm incomes have tripled<br />
since irrigation was expanded. Rural<br />
electrification and accessibility reached<br />
90%, literacy rates rose, infant mortality<br />
rates fell, and a more equitable land tenure<br />
system is in place. Urban settlements<br />
served with water supply quadrupled. The<br />
region’s economy, once the least developed<br />
in the country, is now at the national<br />
average.<br />
Source: Aysegül Kibaroglu, Department of<br />
International Relations, Middle East Technical<br />
University, Ankara, Turkey; Government of<br />
Turkey 1989.<br />
Box 15.17<br />
The Tennessee Valley Authority: economic and social transformation in<br />
a river basin and beyond<br />
During the Great Depression of the 1930s<br />
the Tennessee River Valley, which stretches<br />
through seven southern states in the<br />
United States and drains a basin of 105,930<br />
square kilometres, was a land of despair.<br />
More than 90% of valley residents had no<br />
electricity, and nearly 40% had no toilets<br />
or outhouses. Most of the power required<br />
for agriculture came from horses, and most<br />
of the residents were subsistence farmers<br />
working degraded soil or in areas experiencing<br />
serious and repeated flooding.<br />
President Franklin Roosevelt launched many<br />
programmes designed to bring the economy<br />
out of depression and to improve the lot<br />
of people mired in poverty. With a strong<br />
interest in basin planning and in developing<br />
system-level solutions, he asked Congress<br />
to create ‘a corporation clothed with the<br />
power of government but possessed of<br />
the flexibility and initiative of a private<br />
enterprise’. In 1933 Congress authorized the<br />
Tennessee Valley Authority (TVA).<br />
Given a broad charter, the TVA focused on<br />
carrying out its mission on an integrated,<br />
watershed basis, dealing concurrently<br />
with hydropower production, navigation<br />
on the Tennessee River, flood control,<br />
health problems such as malaria prevention<br />
and resource challenges that<br />
included reforestation, erosion control<br />
and restoration of fisheries. It would have<br />
been labelled integrated water resources<br />
management, had the concept been<br />
identified in 1933.<br />
By 1945 TVA had completed more<br />
than a dozen large dams and built a<br />
1,050- kilometre navigation channel. It also<br />
had become the largest supplier of electricity<br />
in the United States and a major driver for<br />
rural electrification. Evaluations noted that<br />
the TVA was substituting order and design<br />
for haphazard, unplanned and unintegrated<br />
development in its programme for flood<br />
and navigation control, land reclamation<br />
and cheap electricity for light and power.<br />
By the 1960s residents of the Tennessee<br />
Valley were sharing in unprecedented<br />
economic growth and a higher standard<br />
of living, with electricity, clean<br />
water and sanitation provided to most<br />
homes.<br />
Today, the TVA provides electric power, recreation,<br />
improved water quality and a reliable<br />
supply of water to cool power plants<br />
and meet municipal and industrial needs.<br />
It generates more electricity than any other<br />
public utility, operates a system of 49 dams<br />
and res ervoirs on the Tennessee River<br />
and its tributaries and manages 118,572<br />
hectares of public land. It operates the river<br />
system as an integrated whole to provide<br />
year-round navigation. Barges on the Tennessee<br />
River carry some 50 million tonnes<br />
of goods annually. Structural and nonstructural<br />
approaches prevent an estimated<br />
$230 million in flood damages annually. In<br />
one decade, through the development of<br />
water resources, the Tennessee Valley lifted<br />
itself out of poverty; in seven decades it has<br />
become a powerful economic and social<br />
force in the United States.<br />
Source: Gerald Galloway, Department of Civil and<br />
Environmental Engineering, University of Maryland;<br />
www.tva.gov/heritage/hert_history.htm.<br />
warning systems, increasingly used as<br />
preventive responses to climate variability,<br />
are directly linked to water management.<br />
In Djibouti, whose capital was severely<br />
affected by flooding in 2004, the World<br />
Bank supported the Flood Emergency<br />
Rehabilitation Project for the construction<br />
and rehabilitation of wadi banks, drainage<br />
infrastructure and flood control dikes. Although<br />
an immediate response to physical<br />
security concerns, these measures have a<br />
potentially long-term beneficial effect on<br />
Water in a changing world 281
PART<br />
4<br />
Chapter 15<br />
Box 15.18<br />
Nepal: a community-led initiative to mitigate water-induced disasters<br />
The Himalaya Mountain range is among<br />
the richest freshwater locations on Earth;<br />
the combined basins of nine major Asian<br />
rivers rise there and are home to some<br />
1.3 billion people. It is also among the most<br />
fragile ecosystems, due primarily to the<br />
mountain system’s propensity to masswasting<br />
(movement downslope of soil and<br />
rock under the force of gravity), seasonal<br />
monsoon precipitation fraught with extreme<br />
events and increasing population<br />
pressure. Nepal, located in the middle of<br />
the Himalaya range, has been subject to<br />
the risks associated with mass-wasting and<br />
flooding, which account for more than half<br />
the disaster-related deaths in the country.<br />
The situation has worsened in recent decades,<br />
with more intense and frequent extreme<br />
climate events associated with global<br />
climate change, such as torrential rains.<br />
The community of Madhumalla in Morang<br />
District in southeastern Nepal is on the<br />
bank of the Mawa River, a small river with<br />
an upper watershed of about 20 square<br />
kilometres. This 25 kilometre long river has<br />
an average gradient of 4% in the upper<br />
reaches and 2% in the lower reaches, and<br />
its width varies from 200 metres to 700<br />
metres. As do most rivers originating in<br />
the southern belt of Nepal, the Mawa<br />
River experiences unpredictable flooding<br />
caused mainly by monsoon rains, with<br />
sudden cloudbursts in the upper watershed<br />
generating torrents laden with debris,<br />
boulders and sediments. This causes rapid<br />
changes in river morphology, with a cycle<br />
of aggradation and degradation of the<br />
river bed, undercutting, erosion, overflowing<br />
of river banks and shifting of the entire<br />
river course. The local population is under<br />
constant threat of being washed away, and<br />
homes and crops are frequently damaged.<br />
The Madhumalla community, led by<br />
then-Chairman Kashi Nath Paudyal,<br />
embarked on a remarkable mission some<br />
14 years ago to address the threats posed<br />
by unpredictable and devastating floods.<br />
To defend against undercutting and<br />
erosion of the banks and degradation of<br />
floodplains, the community employed the<br />
bioengineering technique of planting a<br />
stratified greenbelt along the river bank<br />
using native trees, shrubs and grasses in<br />
conjunction with reinforcing materials.<br />
Structural measures, such as embankments<br />
and spurs made of gabion boxes,<br />
were used to protect the greenbelt from<br />
damage during the initial years.<br />
The project was designed and implemented<br />
drawing on indigenous knowledge of<br />
locally available plant varieties and their<br />
ability to withstand the forces of river<br />
water and the community’s understanding<br />
of the local physical environment<br />
and river morphology. The project is also<br />
preparing to sell forestry products from<br />
the plantation area, which are expected<br />
to generate hundreds of thousands of dollars<br />
annually within a few years – turning<br />
risks into rewards. The project mobilized<br />
substantial resources internally in the form<br />
of cash, labour and material assistance<br />
and received grants from several national<br />
and international donors totalling about<br />
$40,000.<br />
The approach worked as intended and<br />
has been replicated in several other communities<br />
in the region, including nearby<br />
refugee camps. The project area is currently<br />
a training centre on bioengineering<br />
technology.<br />
Source: Dinesh L. Shrestha, senior water and<br />
sanitation officer, United Nations Refugee<br />
Agency (UNHCR), Geneva, Switzerland, and<br />
Tako Ganai, consulting engineer, UNHCR, Jhapa,<br />
Nepal.<br />
Box 15.19<br />
groundwater replenishment by controlling<br />
runoff from regular rainfall, thus contributing<br />
to the long-term water and food<br />
security of the city dwellers.<br />
Rapid urban migration creates human<br />
security challenges. Many cities are illequipped<br />
to deal with a rapid influx of<br />
rural inhabitants, who frequently establish<br />
informal settlements. Governments adopt<br />
a variety of strategies to deal with these<br />
rapidly growing settlements; some invest<br />
in rural development and infrastructure to<br />
stem the flow of urban migrants.<br />
Resettlement in Rwanda<br />
Rwanda’s Imidugudu (group settlement)<br />
Policy was launched in 1997,<br />
after the civil war and genocide, to<br />
resettle returned refugees. By focusing<br />
on group settlement, the government<br />
hoped to solve the problem of land<br />
scarcity and more easily and efficiently<br />
provide social and economic services.<br />
During the initial phases of resettlement<br />
many families had to leave the<br />
lowlands that provided ready access<br />
to water for higher areas where access<br />
to safe water was more difficult. In a<br />
2002 status update Rwanda’s Ministry<br />
for Infrastructure noted that while<br />
22% of Rwandans had adopted the<br />
group settlement scheme, inadequate<br />
infrastructure development remained<br />
a major challenge, particularly access<br />
to clean water and adequate sanitation.<br />
Several supplementary initiatives<br />
were put in place to respond to this<br />
challenge, many of them funded by<br />
foreign assistance, to invest in rural<br />
water infrastructure and management.<br />
Source: Rwanda Ministry of Infrastructure<br />
2008; Japan International Cooperation<br />
Agency 2006.<br />
Rural development and increased agricultural<br />
productivity may help to avoid<br />
slum formation by reducing migratory<br />
pressures. Like slum-upgrading initiatives,<br />
rural development initiatives are<br />
not entirely outside the domain of water<br />
managers, since they usually require some<br />
form of water intervention along with<br />
measures to increase basic social services<br />
and safety nets (food security and health<br />
care).<br />
Crisis recovery. Economic and humanitarian<br />
crises, often brought about by<br />
prolonged droughts or other natural disasters,<br />
can quickly set back development<br />
progress. Crisis recovery efforts increasingly<br />
aim to build greater resilience to<br />
avoid future crises. For example, food<br />
aid programmes can be coupled with<br />
sustainable livelihoods initiatives and<br />
environmental rehabilitation. In most<br />
cases, as in Rwanda’s group resettlement<br />
programme, crisis recovery and postconflict<br />
reconstruction efforts involve<br />
interventions to restore damaged water<br />
services and infrastructure (box 15.19).<br />
In this sense they provide an opportunity<br />
to build stronger, more sustainable<br />
and more resilient water systems and to<br />
integrate risk management and climate<br />
change into planning.<br />
282 World Water Development Report 3
Initiatives designed to address population<br />
growth, movement and geographic<br />
distribution alter water use and impose<br />
changes on the way water is managed.<br />
Land redistribution policies are currently<br />
being implemented in several countries.<br />
Their potentially controversial aspects<br />
aside, recent evidence has shown that effective<br />
land redistribution (in terms of its<br />
contribution to poverty reduction) also depends<br />
on adequate postsettlement support,<br />
including infrastructure development. 20 In<br />
Namibia, where most agricultural activity<br />
consists of livestock farming, many newly<br />
allocated farms remain underproductive<br />
due to lack of functioning water delivery<br />
points. 21<br />
Crisis recovery also often includes dealing<br />
with returning populations and with<br />
the movement of internally displaced<br />
people. As the examples of Rwanda (box<br />
15.19) and Iraq (box 15.20) show, successfully<br />
reintegrating returning refugees<br />
requires an environment that allows<br />
them to meet their basic needs. Thus,<br />
returning a region to stability requires<br />
consideration of ecological services,<br />
particularly access to safe water and sanitation.<br />
Identifying win-win situations<br />
early on in crisis recovery efforts can<br />
prepare the way for sustainable peace<br />
and security.<br />
options from beyond the water box<br />
In addition to promoting human security<br />
at the local level, interregional cooperation<br />
around shared waters can promote peacebuilding<br />
and trust among countries, as in<br />
the cases of the Nile River basin and the<br />
Senegal River (box 15.21). Although the<br />
causal pathways between water scarcity<br />
and conflict are still under debate, there is<br />
no doubt that international cooperation<br />
on shared waterways is occurring, even<br />
where tensions unrelated to water issues<br />
exist (for example, in Central Asia). The<br />
creation of international water institutions<br />
demonstrates that cooperation is possible<br />
and can be successful provided the<br />
rules are transparent and consensual. Box<br />
15.22 also demonstrates the importance of<br />
institutions, including clear dispute resolution<br />
mechanisms, and the need to find<br />
solutions to water disputes, particularly in<br />
cases of increasing scarcity.<br />
Tackling risk and uncertainty<br />
Dealing with risk and uncertainty has<br />
long been a routine challenge for water resources<br />
managers and policy-makers across<br />
sectors and the world. However, issues like<br />
climate change and demographic dynamics<br />
are outside their control and have made<br />
the risks greater and their task more complex.<br />
Risk management is now much more<br />
important – indeed essential – to analysis<br />
and decision-making for water.<br />
PART<br />
4<br />
The creation of<br />
international<br />
water institutions<br />
demonstrates<br />
that cooperation<br />
is possible and<br />
can be successful<br />
provided the rules<br />
are transparent<br />
and consensual<br />
Box 15.20<br />
Rehabilitating the Iraqi Mesopotamian Marshlands for integration and stability<br />
The Iraqi Mesopotamian Marshlands constitute<br />
part of the largest wetland ecosystem<br />
in the Middle East and Western Eurasia.<br />
They are a crucial part of inter continental<br />
flyways for migratory birds, support endangered<br />
species and sustain freshwater fisheries<br />
and the marine ecosystem of the Persian<br />
Gulf. In addition to their ecological importance,<br />
these marshlands have been home<br />
to indigenous communities for millennia.<br />
The destruction of the marshlands, and the<br />
displacement of its indigenous Marsh Arab<br />
population, is one of the major humanitarian<br />
and environmental challenges facing<br />
Iraq. The competing roles of the marshlands<br />
as a transboundary water resource and a<br />
source of petroleum reserves have made the<br />
future of the marshlands region a priority<br />
on Iraq’s reconstruction agenda while also<br />
presenting trade-offs for decision-makers.<br />
Assessments in 2003 and 2004 reported<br />
that 85,000-100,000 Marsh Arabs reside<br />
within and near the remaining marshlands,<br />
with fewer than 10% of them leading<br />
a traditional subsistence existence. An<br />
estimated 100,000-200,000 Marsh Arabs<br />
remain internally displaced, and 100,000<br />
are thought to be living as refugees outside<br />
Iraq, primarily in Iran. Other communities<br />
also reside within the marshlands region.<br />
Following the collapse of the regime<br />
in mid-2003, local residents opened<br />
floodgates and breached embankments<br />
to bring water back into the marshlands.<br />
Satellite images analysed by the United<br />
Nations Environment Programme (UNEP)<br />
in 2003 revealed that some formerly driedout<br />
areas have been re-inundated, helped<br />
by wetter than usual climate conditions.<br />
By April 2004 approximately 20% of the<br />
original marshland area was re-inundated,<br />
up from 5%-7% in 2003.<br />
UNEP initiated the Iraqi Mesopotamia<br />
Marshlands project in 2004 through its<br />
International Environmental Technology<br />
Centre in Osaka and Shiga, Japan, with<br />
funds from the governments of Italy and<br />
Japan and in cooperation with the Centre<br />
for the Restoration of Iraqi Marshlands of<br />
the Ministry of Water Resources. Phase<br />
III commenced in 2007. The project has<br />
produced multiple benefits:<br />
• Environmentally sound technologies<br />
on drinking water and sanitation<br />
provision and wetland restoration are<br />
being introduced and implemented,<br />
drawing on Iraqi expertise.<br />
• Some 22,000 people in six pilot<br />
communities now have access to<br />
safe drinking water. Water treatment<br />
facilities (with a capacity of 750 cubic<br />
metres a day), 23 kilometres of water<br />
distribution pipes and 127 common<br />
distribution taps have been installed.<br />
Some displaced residents are returning<br />
to pilot site areas, partly because<br />
of the drinking water made available<br />
through the project. As stability<br />
returns, possibilities for rebuilding life<br />
in the marshlands grow.<br />
• A sanitation system pilot project<br />
has been implemented in the<br />
Al-Chibayish community. Environmentally<br />
sound technology, using<br />
constructed wetlands, aims to serve<br />
approximately 170 inhabitants, who<br />
face health hazards from discharges<br />
of untreated wastewater to a nearby<br />
canal.<br />
Source: http://marshlands.unep.or.jp.<br />
Water in a changing world 283
PART<br />
4<br />
Chapter 15<br />
The consequences<br />
of global climate<br />
change are<br />
manifested<br />
primarily through<br />
water – in glacial<br />
melt, floods,<br />
droughts and<br />
sea level<br />
Box 15.21<br />
Sustainable water institutions promote regional cooperation<br />
and stability – the case of the Senegal River<br />
Created in 1972 by an agreement among the<br />
three riparian states (Mali, Mauritania and Senegal),<br />
the Organization for the Development of<br />
the Senegal River (OMVS) established the river as<br />
an international waterway and identified rational<br />
exploitation and management as a goal. In 2002<br />
member states adopted a charter on using the<br />
river that sets out principles and modalities for<br />
distributing water resources among sectors and<br />
defines project approval criteria, environmental<br />
rules and participation modalities for broader<br />
public engagement.<br />
The OMVS is a key institution through which<br />
countries agree on future projects (such as dams,<br />
hydropower and agricultural investments) and<br />
sectoral priorities. It is known as a water-focused<br />
institution that promotes collaboration on multiple<br />
uses of water and integrated water management.<br />
The OMVS also has an environmental<br />
observation arm that tracks the state of the<br />
resource and its associated ecosystems to ensure<br />
sustainability. Because of the river’s central role in<br />
many activities in all three countries, cooperation<br />
has gradually extended to tripartite discussions<br />
at the central and local levels in other sectors,<br />
such as agriculture and enterprises, contributing<br />
to regional stability and integration.<br />
Source: www.omvs.org.<br />
Box 15.22<br />
Allocation of water from the Rio Grande/Rio Bravo River<br />
between Mexico and the United States<br />
In summer 2002 Texas farmers breathed a sigh<br />
of relief as the scarce water of the Rio Grande<br />
(called Rio Bravo in Mexico) began to flow again<br />
on their side of the border.<br />
Under a 1944 treaty Mexico and the United<br />
States had agreed to share the waters of the Rio<br />
Grande and Colorado Rivers. Mexico agreed<br />
to assign 254,880 cubic metres of water from<br />
international storage, with the actual amount<br />
of water to be released from the Amistad and<br />
Falcon reservoirs determined by a complex accounting<br />
of reservoir inflows and water use by<br />
both countries that would ensure that neither<br />
country would run dry. But because of drought,<br />
Mexico had fallen in arrears on its water<br />
contributions.<br />
A key part of the 2002 deal to resolve this dispute<br />
was infrastructure modernization, with the goal<br />
of increasing efficiency in water use. For the first<br />
time the two governments agreed to share costs<br />
and benefits by jointly investing in measures for<br />
water conservation, sustainability and efficiency.<br />
The agreement endorsed a bilateral financial<br />
package for water conservation initiatives.<br />
Source: Moore, Rast, and Pulich 2002.<br />
Climate change. The consequences of global<br />
climate change are manifested primarily<br />
through water – in glacial melt, floods,<br />
droughts and sea level rise. Planners can<br />
no longer rely on past hydrologic conditions<br />
to forecast future risks. Climate<br />
change increases the risk of failure or<br />
underperformance of structures and<br />
institutions. Developing countries are the<br />
most vulnerable to climate change because<br />
of their heavy dependence on climatesensitive<br />
sectors, low capacity to adapt and<br />
poverty. Current climate variability and<br />
weather extremes already severely affect<br />
economic performance in many developing<br />
countries (see figure 5.2 in chapter 5). 22<br />
One way to cope with the uncertainty of<br />
climate change is through management<br />
measures that are flexible and robust<br />
under conditions of uncertainty. Such<br />
adaptive management principles, which<br />
involve a systematic process for improving<br />
management policies and practices<br />
by learning from previous strategies, are<br />
particularly relevant for decision-making<br />
under climate change. 23<br />
As this Report emphasizes throughout, the<br />
water sector must look beyond its traditional<br />
boundaries for solutions. Similarly,<br />
actors outside the water sector must be<br />
aware of links to risks in the water sector.<br />
For example, because natural disasters are<br />
often related to water, closer collaboration<br />
and coordination are needed between<br />
disaster risk-reduction agencies and those<br />
engaged in water resources management.<br />
Water managers and those outside the<br />
water sector can all contribute to innovative,<br />
integrated solutions. One innovation<br />
reducing risk is the provision of insurance<br />
linked to rainfall (box 15.23).<br />
Several broader analytical tools offer<br />
promise in dealing with risk and uncertainty.<br />
Environmental impact assessments<br />
have long been used to promote<br />
a do-no-irreversible-harm approach to<br />
policy and business decisions. Strategic<br />
environmental assessments are also<br />
emerging as powerful tools to identify<br />
both potential damages and opportunities,<br />
which could help in identifying<br />
win-win scenarios. Their effective use<br />
284 World Water Development Report 3
options from beyond the water box<br />
PART<br />
4<br />
Box 15.23<br />
Rainfall-related index insurance for farmers<br />
Reducing climate risk for small farmers<br />
requires tools that can adjust to climate<br />
variability and underpin other adaptation<br />
strategies. Insurance schemes linked to the<br />
amount of rain (index insurance) provide<br />
security as well as productivity incentives.<br />
Traditional insurance contracts that insure<br />
against crop failure have several shortcomings.<br />
They can create perverse incentives<br />
to allow crops to fail to collect the insurance.<br />
And they can result in a situation<br />
where less productive farmers buy insurance,<br />
while more productive farmers do<br />
not. This results in more payouts, leading<br />
to higher premiums, ultimately making<br />
this type of insurance too expensive for<br />
farmers in poor countries.<br />
In one new type of insurance, contracts<br />
are written against a rainfall index. The<br />
index depends on an established relationship<br />
between lack of rainfall and crop<br />
failure, ideally verified by long historical<br />
records of rainfall and yield. If rainfall is<br />
below an agreed trigger point, farmers<br />
receive payouts. However, farmers still<br />
have the incentive to make the best productive<br />
choices, regardless of whether the<br />
insurance pays out. Index insurance is also<br />
cheaper to implement because the insurance<br />
company does not need to verify<br />
damage in the field. That also means that<br />
when rainfall is low enough to cause crops<br />
to fail, insurers will pay out to farmers<br />
within days or weeks. Thus farmers do not<br />
need to sell assets to survive, which can<br />
make them dependent on aid long after<br />
the drought has ended.<br />
With rainfall-indexed insurance farmers<br />
might take greater risks with potentially<br />
higher returns, such as investing in fertilizers<br />
or sustainable land management practices.<br />
To address the impacts of climate variability<br />
and change, farmers must be able to take<br />
advantage of good years. By using index<br />
insurance to protect against massive losses<br />
during major droughts, farmers are able to<br />
put resources into being productive in good<br />
years instead of being limited by the low<br />
productivity of rare bad years.<br />
There are also some disadvantages. If<br />
crops fail for reasons other than drought,<br />
or if rainfall at a farmer’s field differs from<br />
that measured at the central rain gauge,<br />
the farmer receives no compensation.<br />
Index insurance systems are typically<br />
developed as a part of a larger risklayering<br />
strategy in which index insurance<br />
is applied at the most appropriate point,<br />
and other tools – such as traditional insurance,<br />
government social safety nets and<br />
reinsurance – complete the package.<br />
In Malawi farmers can now purchase<br />
index insurance to guarantee loans for<br />
agricultural inputs that would have otherwise<br />
been unavailable because of the<br />
threat of drought. Thousands of groundnut<br />
farmers in Malawi have purchased<br />
a packaged product that bundles index<br />
insurance with a loan giving them access<br />
to high-yielding groundnut seeds bred to<br />
be productive in the local climate. Index<br />
insurance packages and seed varieties<br />
can be designed to adapt together as<br />
risks change. In focus groups on climate<br />
change farmers in Malawi have volunteered<br />
that the index insurance is their<br />
primary mechanism to adapt to the<br />
changing climate. As climate change<br />
exacerbates risks, farmers can use the<br />
improved varieties and index insurance to<br />
take advantage of new opportunities.<br />
Source: Dan Osgood, International Research<br />
Institute for Climate and Society (IRI); Molly<br />
Hellmuth, IRI, Columbia University.<br />
depends on adequate enforcement and<br />
institutional capacity.<br />
Knowledge and technology. Better knowledge<br />
about the state of resources and the<br />
impacts of decisions can also reduce uncertainty.<br />
Sound information on the state<br />
of water resources is needed not only for<br />
water planning but also for making policy<br />
choices in other sectors that are likely to<br />
affect water services or availability. As seen<br />
in the case of Ethiopia, information on<br />
water availability can help in making informed<br />
economic decisions (see box 15.6).<br />
Building strong water monitoring networks<br />
is thus an essential part of water<br />
governance. In Australia the lead organization<br />
responsible for water monitoring<br />
relies on information from multiple water<br />
users, including individuals and corporations<br />
(box 15.24). However, monitoring<br />
networks are often beyond the reach of<br />
developing countries because they require<br />
technical means and financing that are<br />
unavailable (see chapters 13 and 14).<br />
The principle of ‘decentralized’ collaboration,<br />
as applied in Australia, can also be<br />
found at different scales. For example, the<br />
United Nations Environment Programme<br />
Global Environment Monitoring System<br />
on Water (GEMS/Water), financed by the<br />
Canadian government, relies on data<br />
provided by countries and provides capacity<br />
development for water monitoring.<br />
Another example is World Water Monitoring<br />
Day , an international education and<br />
outreach programme coordinated by the<br />
Water Environment Federation and the<br />
International Water Association. World<br />
Water Monitoring Day builds public<br />
awareness and involvement in protecting<br />
water resources around the world<br />
by engaging citizens to conduct basic<br />
monitoring of their local water bodies.<br />
It provides an easy-to-use test kit that<br />
enables everyone from children to adults<br />
to sample local water bodies for a core set<br />
of water quality parameters, including<br />
temperature, acidity, clarity (turbidity) and<br />
dissolved oxygen. Results are shared with<br />
participating communities around the<br />
globe through the World Water Monitoring<br />
Day Website. 24<br />
Sustaining change: changing<br />
habits through awareness<br />
The important changes required to face<br />
the challenges of managing the world’s<br />
water resources will be determined by<br />
changes in behaviour. The most profound<br />
changes in consumption patterns at a<br />
Water in a changing world 285
PART<br />
4<br />
Chapter 15<br />
Because of water’s<br />
contributions to<br />
every aspect of<br />
development,<br />
funding for water<br />
need not compete<br />
with funding for<br />
other priorities<br />
Box 15.24<br />
Getting a complete picture of water resources through user<br />
contributions – a new role for Australia’s Bureau of Meteorology<br />
The Australian Bureau of Meteorology’s role has<br />
expanded to transform Australia’s water resources<br />
information. To secure a long-term water supply<br />
for all Australians, the government announced<br />
Water for the Future, a $12.9 billion water investment<br />
programme. The programme includes<br />
$450 million for the Improving Water Information<br />
Programme, administered by the Bureau of<br />
Meteorology and backed by the Commonwealth<br />
Water Act 2007 and key stakeholders.<br />
The bureau will enhance the quality and utility<br />
of Australia’s water information by producing a<br />
national water account, supported by a national<br />
water monitoring and data collection network.<br />
The programme includes development and<br />
maintenance of an integrated, national water<br />
information system accessible to the public.<br />
Responsibilities of the bureau include:<br />
• Issuing national water information<br />
standards.<br />
• Collecting and publishing water information.<br />
• Conducting regular national water resources<br />
assessments.<br />
• Publishing an annual national water<br />
account.<br />
• Providing regular water availability<br />
forecasts.<br />
• Advising on matters relating to water<br />
information.<br />
• Enhancing understanding of Australia’s<br />
water resources.<br />
A national system for water information storage,<br />
analysis and reporting requires an unprecedented<br />
level of collaboration with stakeholders. Under the<br />
new arrangements individuals, corporations and<br />
other organizations that possess, control or manage<br />
water are required by law to transmit information<br />
to the bureau for compilation and analysis.<br />
Source: www.bom.gov.au/water/regulations/<br />
water-2008.shtml.<br />
collective level are those that occur as the<br />
cumulative result of individual choices,<br />
when new patterns of behaviour enter the<br />
collective culture (see chapter 2).<br />
One approach to changing behaviour is<br />
to use controls. Public institutions such<br />
as schools and hospitals can be mandated<br />
and enabled to provide sanitation and safe<br />
water, construction can be forbidden in<br />
fragile areas, and penalties can be imposed<br />
for the release of certain pollutants into air<br />
and water. Governments can also encourage<br />
or promote certain types of behaviour<br />
through subsidies, taxes and other incentives,<br />
such as payment for environmental<br />
services.<br />
Awareness raising and social marketing<br />
are other tools for promoting behaviour<br />
change. Examples of social marketing<br />
campaigns around water issues can be<br />
found in almost all countries. In the<br />
Danube riparian countries educational<br />
institutions and the private sector created<br />
a Danube Educational Toolkit, called<br />
the ‘Danube Box’. Problems and needs in<br />
several riparian countries were discussed<br />
and collected in national workshops, from<br />
which a prototype of a transboundary<br />
educational kit emerged. At least five Danube<br />
countries (Austria, Germany, Hungary,<br />
Romania and Serbia) are now promoting<br />
the Danube Box in various projects and activities.<br />
These efforts are being organized<br />
in close cooperation with the ministries<br />
for environment, water and education,<br />
along with pedagogical institutes and<br />
school authorities.<br />
Ensuring sustainable financing<br />
Because of water’s contributions to every<br />
aspect of development – social, economic,<br />
political and environmental – funding<br />
for water need not compete with funding<br />
for other priorities. However, to realize<br />
maximum benefit, water’s contributions<br />
should be recognized in every aspect of<br />
government and business planning. This<br />
may entail adopting new forms of costing<br />
or valuation. But it certainly means ensuring<br />
that water managers and stakeholders<br />
take part in decisions likely to affect<br />
water. Thus, this section explores ways to<br />
integrate water resources management in<br />
development planning. It also considers<br />
new ways of mobilizing resources for the<br />
water sector.<br />
Integrating water resources<br />
management in development<br />
planning<br />
Traditional funding mechanisms, including<br />
national budget allocations and<br />
development assistance, are likely to<br />
remain the main source of resources for<br />
water, environment and poverty reduction<br />
(see chapter 4). Evolution in development<br />
policies around the world points<br />
to the need for broader, more integrated<br />
platforms. Poverty reduction strategies<br />
286 World Water Development Report 3
options from beyond the water box<br />
PART<br />
4<br />
provide a consensual basis for decisions<br />
on allocating national budgets and aid.<br />
Reliable information on water (including<br />
trends in availability and quality) could<br />
also be integrated into national budgets to<br />
inform economic objectives and investment<br />
packages that benefit water. As Zambia’s<br />
experience shows, integrating water<br />
considerations in national development<br />
planning instruments can help leverage<br />
national and international financing and<br />
prepare the way for broad-based reforms<br />
(box 15.25).<br />
International assistance for water provision<br />
will remain necessary, and some governments<br />
have demonstrated a commitment<br />
to financing water and sanitation. For<br />
example, the government of the Autonomous<br />
Community of the Basque Country<br />
(Spain) recently adopted a resolution<br />
reiterating its commitment to the Millennium<br />
Development Goals and proposing<br />
to dedicate 5% of its water fees to promote<br />
the sanitation target. 25<br />
International organizations, notably the<br />
UN system, can provide support and expertise<br />
to governments, help civil society<br />
build capacity and catalyse leadership in<br />
the private sector.<br />
Cultivating innovations in financing<br />
Innovative mechanisms are being devised<br />
in many countries for mobilizing and<br />
channelling resources to the water sector.<br />
Public-private partnerships, payments for<br />
ecosystem services and similar schemes<br />
are being explored for generating financing<br />
for the water sector. Such schemes also<br />
offer innovative modalities of cooperation<br />
at all levels (box 15.26).<br />
Managing the multiple ecosystem services<br />
of water use to optimize benefits and minimize<br />
adverse impacts is another promising<br />
approach. Using urban wastewater<br />
for agricultural production, for example,<br />
avoids discharging pollutants directly into<br />
waterways and safeguards water quality<br />
for domestic users. 26 This role of farmers<br />
as environmental stewards should be<br />
recognized and valued through economic<br />
incentives from other sectors. This is the<br />
aim of programmes such as green water<br />
credits in Kenya (see box 14.24 in chapter<br />
14). Cross-sectoral incentives can also be<br />
applied at a broader level, as in Ecuador,<br />
where the water sector is financed through<br />
a tax on telecommunications (box 15.27).<br />
* * *<br />
Government, the private sector and civic<br />
organizations – having faced and dealt<br />
with water issues – provide many examples<br />
of the way forward. The examples in this<br />
chapter show how government policy,<br />
business decisions and civic initiatives<br />
can benefit water services and achieve<br />
multiple benefits. They show that sustainable<br />
development is possible when links<br />
The examples in<br />
this chapter show<br />
how government<br />
policy, business<br />
decisions and<br />
civic initiatives<br />
can benefit water<br />
services and<br />
achieve multiple<br />
benefits<br />
Box 15.25<br />
Zambia’s experiences linking integrated water resources management with national<br />
development plans<br />
Zambia still has adequate water resources,<br />
but declining rainfall patterns and increased<br />
water use are causing increased<br />
water stress. Water is used by households<br />
and for industrial production, as well as for<br />
hydropower production, which earns Zambia<br />
on average some $10 million a year in<br />
exports. Agriculture is also a key sector for<br />
development, depending on water for irrigation,<br />
livestock watering and other uses.<br />
During the past 10 years Zambia has<br />
grown rapidly in response to economic<br />
and administrative reforms. Increasing<br />
pressure on water resources for economic<br />
expansion led the government to undertake<br />
broad water sector reforms. As early<br />
as 1994 the government introduced the<br />
National Water Policy, following up with<br />
reforms of water supply and sanitation and<br />
then water resources management. The<br />
reforms were planned through the 2001<br />
Water Resources Action Programme, which<br />
included an institutional and legal framework<br />
and water resources demand, supply<br />
and infrastructure components. Reforms<br />
included a new water policy, legislation<br />
and a new institution to manage and<br />
develop water resources.<br />
In the Fifth National Development Plan<br />
2006-10 the government of Zambia<br />
expressed concern with ensuring that the<br />
benefits of a healthier economy reach the<br />
rural and urban poor. Recognizing the<br />
importance of water for development, the<br />
government integrated the water sector<br />
reforms, including the new integrated<br />
water resources management plan, and<br />
the National Development Plan. Linking<br />
these was seen as fundamental to poverty<br />
reduction and achieving all the Millennium<br />
Development Goals.<br />
In formulating the Fifth National Development<br />
Plan, the government used a<br />
participatory approach, involving 17 sector<br />
advisory groups including water and a<br />
government-led high-level forum to improve<br />
sector coordination and advise the<br />
government on water sector reform, performance,<br />
and monitoring and evaluation.<br />
The forum includes representatives from<br />
key institutions and stakeholders inside<br />
and outside the water sector. This process<br />
secured political support for the integrated<br />
water resources management plan, which<br />
was selected as the instrument for implementing<br />
the water-related programmes of<br />
the development plan.<br />
The 1994 water policy had dealt mainly with<br />
reforms within the sector. The new integrated<br />
water resources management policy<br />
is intent on integrating water management<br />
throughout all sectors in Zambia. As a result<br />
of this integration of water and national<br />
development planning, many donors have<br />
incorporated water-related investment in<br />
their assistance packages to Zambia.<br />
Source: Mike Muller, visiting professor, Graduate<br />
School of Public and Development Management,<br />
Witwatersrand University, based on<br />
Nyambe and Feilberg n.d.<br />
Water in a changing world 287
PART<br />
4<br />
Chapter 15<br />
are forged between water managers and<br />
decision-makers in other sectors. Because<br />
water issues are central to every aspect of<br />
development, actors within and outside<br />
the water sector need to strengthen their<br />
collaboration to create and promote appropriate<br />
mechanisms for collecting and<br />
sharing information, financing priority<br />
investments and building responsive institutions.<br />
The political will to address water<br />
issues worldwide remains crucial, along<br />
with a willingness to consider innovative<br />
ways to approach local, regional and international<br />
cooperation.<br />
Box 15.26<br />
Payments for ecosystem services help curb climate change and conserve biodiversity<br />
while protecting water resources<br />
The highland forests and paramos (treeless<br />
plateaus) of the Andes mountain chain<br />
provide a variety of ecosystem services<br />
for human and natural communities in<br />
northern South America. In the centre of<br />
the Colombian Andes the Chingaza and<br />
Sumapaz National Parks cover more than<br />
225,000 hectares of these fragile ecosystems,<br />
which contain habitats for a variety<br />
of threatened flora and fauna and provide<br />
crucial water for downstream human<br />
populations. The area is the watershed for<br />
Bogota, which has more than 7 million<br />
residents. In recent years the water supply<br />
has declined considerably due to human<br />
activities such as agriculture and livestock<br />
raising, which have led to degradation of<br />
the high Andes ecosystems. The Bogota<br />
Water and Sewerage Company (EAAB)<br />
estimates that water demand will rise substantially<br />
by 2020. Immediate measures<br />
are necessary to protect the watershed in<br />
order to meet that anticipated demand.<br />
Recently EAAB, together with the Colombian<br />
government and the support of<br />
Conservation International, implemented<br />
a pilot project for financing and protecting<br />
these critical watersheds. The project<br />
provides multiple benefits. Conceived to<br />
provide climate change mitigation benefits<br />
as well as reliable freshwater supplies, it<br />
provides clean, renewable energy while<br />
protecting the watershed and supplying<br />
funding both to EAAB and the Colombian<br />
national parks.<br />
EAAB’s Santa Ana small-scale hydroelectric<br />
power plant generates electricity<br />
without the greenhouse gas emissions<br />
associated with traditional fossil fuel<br />
plants. The dam is recognized as a Clean<br />
Development Mechanism project by the<br />
United Nations Framework Convention<br />
on Climate Change. It generates about<br />
23,000 certified emission reduction units<br />
each year with an approximate value of<br />
$450,000. EAAB has committed to giving<br />
half this revenue to the Colombian<br />
Park Service, which uses the resources<br />
to consolidate and expand Chingaza<br />
National Park. Increased funds for park<br />
management will slow deforestation and<br />
ecosystem degradation, by reducing<br />
another source of greenhouse gases while<br />
conserving biodiversity and improving<br />
water supplies.<br />
In the next phase of the project Conservation<br />
International and partners are<br />
supporting an initiative to consolidate a<br />
regional biological corridor to connect<br />
Chingaza with Sumapaz National Park,<br />
the eastern Andean mountain slopes<br />
and the San Rafael water basin. A variety<br />
of financing mechanisms will generate<br />
income based on the water and climate<br />
mitigation services the area provides.<br />
Through a large-scale reforestation effort<br />
on degraded lands in the corridor, the<br />
project will expand its carbon sequestration<br />
and water provision, providing benefits<br />
to other communities that depend on<br />
the water from threatened high Andean<br />
ecosystems.<br />
Source: www.conservation.org/explore/regions/<br />
south_america/andes/Pages/andes.aspx.<br />
Box 15.27<br />
A water services concession with public funding in Guayaquil, Ecuador<br />
Guayaquil, Ecuador’s economic capital,<br />
is home to 2.4 million people, or a third<br />
of the national urban population. When<br />
a concessionaire took over management<br />
of water services in 2001, water coverage<br />
lagged far behind the national average:<br />
only 60% of residents had household<br />
connections in 2000, compared with the<br />
national urban average of 81% in 1998.<br />
The gap was smaller for sewerage, with<br />
coverage of 56% compared with a national<br />
urban average of 61%. The concession<br />
is the second largest in Latin America by<br />
population served after Buenos Aires. 1<br />
The concession rapidly expanded access<br />
to piped water through household connections.<br />
Starting with 245,000 connections<br />
in 2000, it installed 160,000 new<br />
connections in the first five years of operation<br />
– a more than 10% annual increase<br />
and three times the contractual target of<br />
55,000. Those gains brought water coverage<br />
in the city up to 82% in 2005 and<br />
benefited about 800,000 people, most of<br />
them living in poor neighbourhoods not<br />
previously served by the network. Over<br />
the same period progress in extending<br />
urban water access at the national level<br />
stagnated. The concessionaire’s performance<br />
in improving sewer access was more<br />
modest, rising from 56% to 62%.<br />
The good performance on water access<br />
was made possible by a special tax transfer<br />
mechanism that the central government<br />
introduced in the 1980s to subsidize<br />
new water connections. Revenues from a<br />
10% tax on telephone bills is transferred<br />
to utilities to support expansion of the<br />
water network in uncovered urban areas.<br />
New water connections are provided free<br />
of charge in urban areas not previously<br />
covered by the water network (areas<br />
where most of the population is poor).<br />
Part of the cost of expanding the network<br />
is also subsidized. Sewer connections<br />
were ineligible for these tax transfers and<br />
subsidies, explaining the more modest<br />
progress.<br />
Note<br />
1. Santiago de Chile (5.3 million customers)<br />
is larger but operated under a divestiture<br />
scheme (private ownership of infrastructure).<br />
Source: Yepes 2007.<br />
288 World Water Development Report 3
options from beyond the water box<br />
4 PART<br />
Notes<br />
1.<br />
2.<br />
3.<br />
World Bank 2007.<br />
ADB and OECD 2001.<br />
WWAP 2006, p. 75.<br />
4. See Bayoumi and Abumoghli 2007 for<br />
further examples.<br />
5. CFC and Benevides and Pérez-Lucy<br />
2001; Zhang 2003.<br />
6. Fan, Zhang, and Zhang 2004; De Brauw<br />
et al. 2002.<br />
7. See, for example, Hlanze, Gama, and<br />
Mondlane 2005; www.fao.org/hivaids/<br />
publications/farming_en.htm.<br />
8. Poverty-Environment Partnership 2008.<br />
9. UNECE 1999.<br />
10. Djibouti Government 2004, p. 5.<br />
11. Blue Plan, MAP, and UNEP 2003, 2007.<br />
12. United Nations Global Compact 2008.<br />
13. www.un.org/apps/sg/sgstats.<br />
asp?nid=3682.<br />
14. Worldwatch Institute 2008, p. 119.<br />
15. Palanisami and Easter 2000.<br />
16. Shah et al. 2004.<br />
17. GEF Small Grants Facility 2003; Smith<br />
2000.<br />
18. World Tourism Organization ( www.<br />
unwto.org).<br />
19. Trondalen 2008.<br />
20. See for example, Binswanger et al.<br />
2008.<br />
21. Werner and Kruger 2007.<br />
22. AfDB et al. 2003; Stern 2006.<br />
23. Pahl-Wostl 2007; Pahl-Wostl, Kabat, and<br />
Möltgen 2007.<br />
24. www.worldwatermonitoringday.org/<br />
About/About_Main.html.<br />
25. www.lehendakaritza.ejgv.euskadi.net/<br />
r48-11912/en/contenidos/informacion/<br />
organismos_multilaterales/en_multilat/<br />
presentacion.html.<br />
26. Ragab and Koo-Oshima 2006.<br />
References<br />
ADB (Asian Development Bank) and<br />
OECD (Organisation for Economic Cooperation<br />
and Development). 2001.<br />
Progress in the Fight against Corruption<br />
in Asia and the Pacific. Manila: Asian<br />
Development Bank; and Paris: Organisation<br />
for Economic Co-operation and<br />
Development.<br />
AfDB (African Development Bank), ADB<br />
(Asian Development Bank), DfID (Department<br />
for International Development),<br />
DGD-EC (Directorate-General<br />
for Development, European Commission),<br />
BMZ (German Federal Ministry<br />
for Economic Cooperation and<br />
Development), BuZa (Dutch Ministry<br />
of Foreign Affairs), OECD (Organization<br />
for Economic Cooperation and<br />
Development), UNDP (United Nations<br />
Development Programme), and the<br />
World Bank. 2003. Poverty and Climate<br />
Change: Reducing the Vulnerability of<br />
the Poor through Adaptation. Consultative<br />
draft presented at the Eighth<br />
Conference of Parties to the United Nations<br />
Framework Convention on Climate<br />
Change in New Delhi, 23 October-1<br />
November 2002.www.unpei.org/PDF/<br />
Poverty-and-Climate-Change.pdf.<br />
Atchoarena, David and Lavinia Gasperini,<br />
eds. 2003. Education for Rural Development:<br />
Towards New Policy Responses.<br />
Rome: Food and Agriculture Organization<br />
of the United Nations, and Paris:<br />
United Nations Educational, Scientific,<br />
and Cultural Organization.<br />
BAPE (Bureau d’audiences publiques<br />
sur l’environnement). 2000. Water:<br />
A Resource to Be Protected, Shared and<br />
Enhanced. Québec City: Government of<br />
Québec.<br />
Bayoumi, Mohammed, and Iyad Abumoghli.<br />
2007. National Water Councils:<br />
Comparative Experiences; Report submitted<br />
to UNDP, February 2007.<br />
Bazaara, Nyangabyaki. 2003. Decentralization,<br />
Politics and Environment in<br />
Uganda. Environmental Governance in<br />
Africa. Working Paper 7, World Resources<br />
Institute, Washington, DC.<br />
Benavides, D. D., and E. Pérez-Ducy. 2001.<br />
Tourism in the Least Developed Countries.<br />
Madrid: United Nations Conference on<br />
Trade and Development, World Tourism<br />
Organization.<br />
Benoit, G., and A. Comeau, eds. 2005. A<br />
Sustainable Future for the Mediterranean:<br />
The Blue Plan’s Environment and Development<br />
Outlook. London: Earthscan.<br />
Binswanger, Hans P., Roland Henderson,<br />
Zweli Mbhele, and Kay Muir-Leresche.<br />
2008. Accelerating Sustainable, Efficient,<br />
and Equitable Land Reform: Case Study<br />
of the Qedusizi/Besters Cluster Project,<br />
Africa Region Working Paper Series<br />
109. World Bank, KwaZulu Natal, South<br />
Africa. www.worldbank.org/afr/wps/<br />
wp109.pdf.<br />
Bird, Geoffrey, Jacquie Chenje, and Sarah<br />
Medina. 2002. Africa Environment<br />
Outlook: Past, Present and Future Perspectives.<br />
Hertfordshire, UK: EarthPrint. www.<br />
unep.org/ dewa/Africa/publications/<br />
aeo-1/159.htm.<br />
Blue Plan, MAP (Mediterranean Action<br />
Plan), and UNEP (United Nations Environment<br />
Programme). 2003. Results of<br />
the Fiuggi Forum on Advances of Water<br />
Demand Management in the Mediterranean:<br />
Findings and Recommendations.<br />
Document prepared for the Next Mediterranean<br />
Commission for Sustainable<br />
Development Meeting, Sophia Antipolis,<br />
France, United Nations Environment<br />
Programme/Mediterranean Action Plan,<br />
Athens.<br />
———. 2007. Water Demand Management,<br />
Progress and Policies: Proceedings of the<br />
3rd Regional Workshop on Water and<br />
Sustainable Development in the Mediterranean.<br />
Zaragoza, Spain, 19-21 March.<br />
MAP Technical Reports Series 168.<br />
Athens: United Nations Environment<br />
Programme.<br />
CFC (Common Fund for Commodities)<br />
and UNCTAD (United Nations Conference<br />
on Trade and Development).<br />
2001. Enhancing Productive Capacities<br />
and Diversification of Commodities in<br />
LDCs and South-South Co-operation.<br />
Workshop. 21-23 March. Common Fund<br />
for Commodities and United Nations<br />
Conference on Trade and Development,<br />
Geneva.<br />
Chang, Philip. 2008. Armenia. In Asian<br />
Development Outlook 2008. Manila: Asian<br />
Development Bank.<br />
Cosgrove, William. 2009. Public Participation<br />
to Promote Water Ethics and Transparency.<br />
In Water Ethics: Marcelino Botin<br />
Water Forum 2007, eds. M. Ramon Llamas,<br />
L. Martinez Cortina, Aditi Mukherji.<br />
London: Taylor and Francis Group.<br />
De Brauw, A., Huang J., S. Rozelle, Zhang<br />
L., and Zhang Y. 2002. The Evolution<br />
of China’s Rural Labor Markets during<br />
the Reforms. Department of Agricultural<br />
and Resource Economics, University of<br />
California Davis Working paper 02-003.<br />
University of California, Davis.<br />
Development Vision – Nepal. 2007.<br />
Final Report on Evaluation of UJYALO<br />
Program. Volume 1, Main Text. Development<br />
Vision – Nepal (P.) Ltd., Kathmandu.<br />
http://pdf.usaid.gov/pdf_docs/<br />
PDACK585.pdf.<br />
Fan, S., Zhang L., and Zhang X. 2004.<br />
“Reforms, Investment, and Poverty in<br />
Rural China.” Economic Development and<br />
Cultural Change 52 (2): 395-421<br />
FAO (Food and Agriculture Organization<br />
of the United Nations). 2005. Toward<br />
Multi-Sectoral Responses to HIV/AIDS:<br />
Implications for Education for Rural People<br />
(ERP). Paper presented as Ministerial<br />
Seminar on Education for Rural People in<br />
Africa: Policy Lessons, Options and Priorities,<br />
7-9 September 2002, Addis Ababa.<br />
GAP (Southeastern Anatolia Project).<br />
1989. Southeastern Anatolia Project GAP<br />
Master Plan Study. Nippon-Koei and<br />
Yüksel Joint Venture, Ankara, Turkey.<br />
GEF Small Grants Programme. 2003.<br />
Solar Rural Electrification via Micro-<br />
Enterprises, Dominican Republic. Latin<br />
America & Caribbean: Dominican<br />
Republic-3. Global Environment Facility,<br />
Washington, DC, and United Nations<br />
Development Programme, New York.<br />
http://sgp.undp.org/download/SGP_<br />
DominicanRepublic3.pdf.<br />
Government of Djibouti. 2004. Poverty<br />
Reduction Strategy Paper, Djibouti.<br />
Water in a changing world 289
PART<br />
4<br />
Chapter 15<br />
Hlanze, Zakhe, Thanky Gama, and<br />
Sibusiso Mondlane. 2005. The Impact<br />
of HIV/AIDS and Drought on Local<br />
Knowledge Systems for Agrobiodiversity<br />
and Food Security. LinKS Project on Gender,<br />
Biodiversity and Local Knowledge<br />
Systems for Food Security Report 50.<br />
FAO-LinKSSwaziland, Mbabane.<br />
IMF (International Monetary Fund).<br />
2004. Djibouti: Poverty Reduction Strategy<br />
Paper. IMF Country Report No. 04/152.<br />
Washington, DC: International Monetary<br />
Fund. www.imf.org/external/.<br />
ISRIC (International Soil Research and<br />
Information Centre). 2008. Green Water<br />
Credits. World Soil Information, Wageningen,<br />
The Netherlands. www.isric.org/UK/<br />
About+ISRIC/Projects/ Current+Projects/<br />
Green+Water+Credits.htm.<br />
Japan International Cooperation Agency.<br />
2006. Project on Improvement of<br />
Water Supply and Sanitation in the<br />
Southern Part of the Eastern Province<br />
(Pura-Sani Project). 1-1 Details of the<br />
Project. Japan International Cooperation<br />
Agency, Tokyo. http://project.jica.go.jp/<br />
rwanda/0605427/english/01/01.html.<br />
Martinez, Grit. 2007. The Role of Donors in<br />
Tackling Sector Development Corruption.<br />
Power Point presentation 26 September<br />
2007, Water Integrity Network,<br />
Accra. www.waterintegritynetwork.net/<br />
content/download/2038/34265/file/3_<br />
The%20Role%20 of%20donors.pdf.<br />
Moore, J. G., W. Rast, and W. M. Pulich.<br />
2002. Proposal for an Integrated Management<br />
Plan for the Rio Grande/Rio<br />
Bravo. In 1st International Symposium on<br />
Transboundary Waters Management, eds.<br />
A. Aldama, F. J. Aparicio, and R. Equihua.<br />
Avances en Hidraulica 10, XVII Mexican<br />
Hydraulics Congress, Monterrey, Mexico,<br />
Nov. 18-22, 2002.<br />
National Rural Development Institute.<br />
n.d. Integrated Watershed Development<br />
Project in Madhya Pradesh. National<br />
Rural Development Institute, Hyderabad,<br />
India. http://nird.ap.nic.in/clic/water_<br />
madhya.html.<br />
Nyambe, Imasiku A., and Miriam Feilberg.<br />
n.d. Zambia – National Water Resources<br />
Report for WWDR3. Ministry of Energy<br />
and Water Development, Lusaka.<br />
Olken, Benjamin. 2005. Monitoring Corruption:<br />
Evidence from a Field Experiment in<br />
Indonesia. NBER Working Paper 11753.<br />
Cambridge, MA: National Bureau of<br />
Economic Research.<br />
Palanisami, K., and K.W. Easter. 2000.<br />
Tank Irrigation in the 21st Century – What<br />
Next? New Delhi: Discovery Publishing<br />
House.<br />
Pahl-Wostl, C. 2007. Transition towards<br />
Adaptive Management of Water Facing<br />
Climate and Global Change. Water Resources<br />
Management 21(1): 49-62.<br />
Pahl-Wostl, C., P. Kabat, J. Möltgen, eds.<br />
2007 Adaptive and Integrated Water<br />
Management: Coping with Complexity<br />
and Uncertainty. New York: Springer<br />
Publishing.<br />
Peopleandplanet.net. 2002. A Showcase<br />
for Sustainable Tourism in Turkey. Planet<br />
21, London. www.peopleandplanet.net/<br />
doc.php?id=1723.<br />
Poverty-Environment Partnership.<br />
2008. Poverty, Health and Environment:<br />
Placing Environmental Health on<br />
Countries’ Development Agenda. Joint<br />
Agency Paper. www.unpei.org/PDF/<br />
Pov-Health-Env-CRA.pdf.<br />
Québec Ministry of the Environment.<br />
2002. Water. Our Life, Our Future: Québec<br />
Water Policy. Québec: Bibliothèque Nationale<br />
du Québec.<br />
Ragab, Ragab, and Sasha Koo-Oshima.<br />
2006. Proceedings of the International<br />
Workshop on Environmental Consequences<br />
of Irrigation with Poor Quality Waters: Sustainability,<br />
Management and Institutional,<br />
Water Resources, Health and Social Issues.<br />
12 September 2006, Kuala Lumpur, Malaysia.<br />
New Delhi: International Commission<br />
on Irrigation and Drainage.<br />
Rwanda, Ministry of Infrastructure. 2008.<br />
Habitat and Urbanism Status in Rwanda.<br />
Kigali. www.mininfra.gov.rw/docs/<br />
HABITAT%20AND%20URBANISM<br />
%20<strong>IN</strong>%20RWANDA.pdf.<br />
Sadoff, Claudia. 2006. Can Water Undermine<br />
Growth? Evidence from Ethiopia. In<br />
Agriculture and Rural Development Notes.<br />
Issue 18. World Bank, Washington, DC.<br />
http://siteresources.worldbank.org/<br />
<strong>IN</strong>TARD/Resources/Note18_Ethiopia_<br />
web.pdf.<br />
Shah, Tushaar, Christopher Scott, Avinash<br />
Kishore, and Abhishek Sharma. 2004.<br />
The Energy-Irrigation Nexus in South Asia:<br />
Groundwater Conservation and Power<br />
Sector Viability. Colombo: International<br />
Water Management Institute.<br />
Smith, Julie, A. 2000. Solar-Based Rural<br />
Electrification and Microenterprise<br />
Development in Latin America: A Gender<br />
Analysis. NREL/SR-550-28955. National<br />
Renewable Energy Laboratory, Golden,<br />
CO. www.nrel.gov/docs/fy01osti/28995.<br />
pdf.<br />
Stern, Nicholas. 2006. Stern Review: The<br />
Economics of Climate Change. Cambridge,<br />
UK: Cambridge University Press.<br />
TERI (The Energy and Resources Institute).<br />
2008. Third Party Assessment of<br />
Coca-Cola Facilities in India. New Delhi:<br />
The Energy and Resources Institute.<br />
www.teriin.org/cocacola_report_toc.php.<br />
Trondalen, Jon-Martin, Simon Mason,<br />
and Adrian Muller. 2008. Water and<br />
Security: Entangled and Emerging Issues.<br />
Working paper. Compass Foundation,<br />
Geneva.<br />
UNECE (United Nations Economic Commission<br />
for Europe). 1999. Protocol on<br />
Water and Health to the 1992 Convention<br />
on the Protection and Use of<br />
Transboundary Watercourses and International<br />
Lakes. United Nations Economic<br />
Commission for Europe, London. www.<br />
unece.org/env/documents/2000/ wat/<br />
mp.wat.2000.1.e.pdf.<br />
United Nations Global Compact. 2008.<br />
CEO Water Mandate: An Initiative by<br />
Business Leaders in Partnership with the<br />
International Community. New York: UN<br />
Secretary-General.<br />
WBCSD (World Business Council for<br />
Sustainable Development). 2006.<br />
Anglo American/Mondi: Improved<br />
Energy and Efficiency. Case Study.<br />
World Business Council for Sustainable<br />
Development, Geneva. www.wbcsd.<br />
org/DocRoot/6NDZbCwuNlJpaFU9g0i6/<br />
mondi_energy_efficiency_full_case_web.<br />
pdf.<br />
Werner, Wolfgang, and Bertus Kruger.<br />
2007. Redistributive Land Reform and<br />
Poverty Reduction in Namibia: Livelihoods<br />
after Land Reform. Country Paper.<br />
Desert Research Foundation of Namibia,<br />
Windhoek.<br />
WHO (World Health Organization)/<br />
UNICEF (United Nations Children’s<br />
Fund) Joint Monitoring Programme<br />
for Water Supply and Sanitation. 2008.<br />
Progress on Drinking Water and Sanitation:<br />
Special Focus on Sanitation. New<br />
York: United Nations Children’s Fund,<br />
and Geneva: World Health Organization.<br />
World Bank. 2007. Making the Most of<br />
Scarcity: Accountability for Better Water<br />
Management Results in the Middle East<br />
and North Africa. MENA Development<br />
Report. Washington, DC: World Bank.<br />
Worldwatch Institute. 2008. State of the<br />
World: Innovations for a Sustainable<br />
Economy. New York: Norton Institute.<br />
WWAP (World Water Assessment Programme).<br />
2006. The United Nations<br />
World Water Development Report 2: Water:<br />
A Shared Responsibility. Paris: United Nations<br />
Educational, Scientific, and Cultural<br />
Organization, and New York: Berghahn<br />
Books.<br />
Yepes, G. 2007. Los subsidios cruzados en los<br />
servicios de agua potable y saneamiento.<br />
IFM Publications. Washington, DC: Inter-<br />
American Development Bank, Infrastructure<br />
and Financial Markets Division.<br />
Zhang Le-Yin. 2003. Economic Diversification<br />
in the Context of Climate Change.<br />
Background Paper for UNFCCC Workshop<br />
on Economic Diversification, 18-19<br />
October 2003, Teheran. United Nations<br />
Framework Convention on Climate<br />
Change, Tehran. http://unfccc.int/files/<br />
meetings/workshops/other_meetings/<br />
application/pdf/bgpaper.pdf.<br />
290 World Water Development Report 3
options from beyond the water box<br />
Chapter 16<br />
The way forward<br />
PART<br />
4<br />
Authors: Andrew Bullock and William Cosgrove<br />
Contributors: Fatma Attia, Gerry Galloway,<br />
Jack Moss, Uri Shamir and Albert Wright<br />
Coordinator: Olcay Ünver (WWAP)<br />
Facilitator: William Cosgrove<br />
Key messages<br />
Water and water systems must be managed to achieve social and economic<br />
development objectives and to sustain development. Water resources,<br />
properly managed, are critical to the survival and well-being<br />
of individuals. They can ensure equity and security in water and sanitation<br />
for families, businesses and communities. And they can ensure<br />
adequate water for food, energy and the environment as well as protection<br />
from floods and droughts.<br />
Decision-making on water requires seeking synergies and selecting appropriate<br />
trade-offs. It also requires distinguishing between short-term<br />
‘fire-fighting’ – responding to the urgent issues of the day – and longterm<br />
strategic development. Developing multipurpose water schemes<br />
and reusing water wherever feasible can lessen the need for trade-offs by<br />
enabling the same volumes of scarce water to deliver multiple outcomes.<br />
The donor community can incorporate water into the broader frameworks<br />
of development aid and focus assistance on areas where it is<br />
needed most – in sub-Saharan Africa, in Asian and Latin American<br />
slums and in states recovering from conflict. Recent G-8 efforts in this<br />
direction are promising.<br />
The chief executives of the UN agencies, following the example of their<br />
joint discussions of and collective responses to climate change, can<br />
convene to examine the role of water, water systems and water management<br />
in development and environmental services, providing direction<br />
to agencies and advice to member countries.<br />
The World Water Assessment Programme and its partners are working<br />
to help reduce uncertainty, facilitate decision-making and accelerate<br />
investment by highlighting the links between socioeconomic development<br />
and investment in water management capacity and infrastructure<br />
in other sectors.<br />
The challenges are great, but unsustainable management and inequitable<br />
access to water resources cannot continue. We might not have all<br />
the information we would like to have before acting, but we do know<br />
enough now to begin to take significant steps. Actions must include increased<br />
investment in water infrastructure and capacity development.<br />
Leaders in the water domain can inform the processes outside their<br />
domain and manage water resources to achieve agreed socioeconomic<br />
objectives and environmental integrity. But leaders in government, the<br />
private sector and civil society will determine the direction that actions<br />
take. Recognizing this responsibility, they must act now!<br />
Water in a changing world 291
PART<br />
4<br />
Chapter 16<br />
Good water<br />
resources<br />
management can<br />
transform social<br />
systems for the<br />
better and sustain<br />
development<br />
Making water an integral<br />
part of all planning and<br />
management decisions<br />
Good water resources management can<br />
transform social systems for the better and<br />
sustain development. It can alleviate the<br />
anxiety and fear arising from concerns<br />
about too little water – or too much. It can<br />
respond to humanity’s concerns for natural<br />
and social changes and to our growing understanding<br />
of uncertainties, thus helping<br />
avoid political instability in fragile states.<br />
Action today is more important than ever –<br />
for the poor as for those better off.<br />
Meeting the many objectives of water resources<br />
management with limited human,<br />
financial and institutional resources will<br />
require more integrated and collaborative<br />
procedures and stronger water management<br />
institutions and capacity. It will<br />
require better monitoring, data analysis<br />
and information products to fill the gaps<br />
in knowledge of how water is used and<br />
managed today and over time – and of the<br />
health of ecosystems that supply it. And it<br />
will require securing sustainable financing<br />
to meet the costs of service provision using<br />
existing infrastructure and to invest in<br />
essential new infrastructure, both physical<br />
and institutional.<br />
The challenges are daunting. But they are<br />
surmountable. Managers and professionals<br />
in the water sector can work with leaders<br />
and decision-makers in all sectors to meet<br />
the challenges. They need to act within a<br />
framework that:<br />
• Ensures accountability and transparency<br />
in planning and implementation,<br />
particularly through greater<br />
stakeholder participation, with the appropriate<br />
incentives and disincentives.<br />
• Integrates gender-sensitive and equitable<br />
approaches in water issues.<br />
• Provides options for decision-makers<br />
outside the ‘water box’, informed by<br />
clear messages substantiated by sound<br />
analyses from a water community<br />
that understands its role in the broad<br />
development agenda.<br />
• Develops solutions that strike a convincing<br />
balance between objectives<br />
and alternative means of achieving<br />
them, through consultation, innovation<br />
and research.<br />
• Provides data and information to<br />
reduce uncertainty.<br />
• Secures financing for investment in<br />
physical and institutional water infrastructure,<br />
using a variety of financing<br />
instruments.<br />
• Develops capacity to improve the effectiveness<br />
and scales of progress.<br />
• Recognizes that nature also needs<br />
water, to ensure the continuing delivery<br />
of life-supporting environmental<br />
goods and services.<br />
But leaders in the water sector, acting<br />
alone, risk being overlooked in broader<br />
decision-making for social and economic<br />
development. And leaders outside the<br />
water sector risk making uninformed and<br />
suboptimal development decisions. The<br />
most valuable evolution of integrated<br />
water resources management could be its<br />
extension into dialogue and partnerships<br />
with water-using sectors whose policies<br />
and strategies are governed by many factors<br />
outside the water sector.<br />
Chapter 14 offers practical examples of solutions<br />
within the water domain. Options<br />
that show promise involve:<br />
• Institutional and human capacity development,<br />
to prepare institutions for<br />
current and future water and related<br />
challenges.<br />
• Water law, both formal and customary,<br />
including regulations in other<br />
sectors that affect water resources<br />
management.<br />
• Consultation with stakeholders<br />
and accountability in planning,<br />
implementation and management<br />
to build trust, as effective management<br />
involves pluralistic governance,<br />
transparency and interactions among<br />
parties with different interests.<br />
• Use of financial options and economic<br />
instruments to support the reliability<br />
and quality of the services provided.<br />
• Innovation and research to develop<br />
appropriate realistic and sustainable<br />
solutions.<br />
• Payment for environmental services<br />
as an incentive for improving water<br />
management efforts and for supporting<br />
sustainable ecosystems and water<br />
security.<br />
• Creation by water sector decision-makers<br />
of a favourable investment climate<br />
292 World Water Development Report 3
the way forward<br />
PART<br />
4<br />
based on sound water management<br />
and accountability.<br />
Working through practical<br />
partnerships<br />
For decades hydrologists and water professionals<br />
have been writing about and<br />
advocating for the essential role of water<br />
resources management in addressing social<br />
and economic development, pointing to<br />
the need to balance objectives under financial,<br />
human and institutional constraints.<br />
But decisions on water development and<br />
management objectives, and the allocation<br />
of human, financial and environmental resources<br />
to meet them, are made by leaders<br />
in government, the private sector and civil<br />
society, not by water professionals alone.<br />
Therefore, water professionals need to inform<br />
the decisions of these leaders outside<br />
the water domain on such issues as spatial<br />
and development planning, demographic<br />
planning, health, education, agriculture,<br />
industry, energy, economic development<br />
and the environment.<br />
As government, business and community<br />
leaders respond to the needs and initiatives<br />
of water users, they should be guided<br />
by sound information about the economic<br />
and environmental trade-offs in providing<br />
these services. The international development<br />
community can provide guidance<br />
by collecting evidence on successful and<br />
failed interventions and introducing this<br />
information into national planning. Decision-makers<br />
can learn from the examples<br />
in chapters 14 and 15.<br />
This Report takes as a starting point that<br />
decisions and actions are most effective<br />
when implemented at the lowest institutional<br />
level qualified to do so. Where<br />
individuals are capable of meeting a<br />
challenge, their efforts should be supported.<br />
Where individual efforts are not<br />
enough, community members, including<br />
the professional and business community,<br />
can come together to meet the challenge,<br />
often working with local governments.<br />
To facilitate this possibility, a higher level<br />
of government may need to step in to<br />
delegate authority and provide the needed<br />
technical or financial support.<br />
Other actions may be beyond the capacity<br />
of individual communities and local<br />
governments. Controlling and allocating<br />
surface water and groundwater on a basin<br />
and aquifer scale and establishing pollution<br />
control standards require the involvement<br />
of the water authority or ministry.<br />
For national well-being, the president<br />
or prime minister is the ultimate water<br />
manager, supported by the cabinet as the<br />
water management team.<br />
International organizations, especially<br />
the UN agencies, can provide support for<br />
the member states, capacity assistance for<br />
civil society and catalytic guidance for the<br />
private sector in their efforts to incorporate<br />
water in decision-making processes<br />
within and outside the water domain. The<br />
leadership of the UN system and intergovernmental<br />
organizations can provide<br />
counsel, drawing on their experience<br />
worldwide. As in the joint discussion and<br />
collective response on climate change, the<br />
chief executives of the UN agencies could<br />
meet on the role of water and water management<br />
in socioeconomic development<br />
processes, environmental sustainability<br />
and achievement of the Millennium Development<br />
Goals. Donor governments and<br />
philanthropic organizations can enter this<br />
discussion, in ways compatible with their<br />
mission and objectives.<br />
Municipalities, decentralized bodies and<br />
local administrations are all engaged<br />
in delivery service and managing water<br />
resources. These responsibilities have typically<br />
been decentralized by the central<br />
governments, but often without transferring<br />
the necessary financial and human<br />
resources. These local bodies face difficult<br />
choices in managing water systems, water<br />
resources and water and sanitation systems<br />
– on whether to regulate through concessions<br />
and contracts with private partners<br />
and on how to engage with non-governmental<br />
organizations. They can inform<br />
their decisions by drawing on a growing<br />
base of water management experience<br />
worldwide. All groups with a stake in water<br />
resources management can work together<br />
to craft national development plans for<br />
water and sanitation, guided by poverty<br />
reduction and environmental strategies<br />
and international guidelines.<br />
Obtaining and sharing information<br />
Reducing environmental and social<br />
risks today and preparing for a future of<br />
increasing climate variability and climate<br />
extremes require information about<br />
the availability and variability of water<br />
resources today and tomorrow and about<br />
trends in demand. Mechanisms for gathering<br />
this information are needed even as<br />
countries proceed with infrastructure<br />
construction. Information and tools for<br />
decision-making under uncertainty will<br />
help to avoid making decisions for the<br />
short term that have irreversible harmful<br />
environmental and social effects over the<br />
long term.<br />
As government,<br />
business and<br />
community<br />
leaders respond<br />
to the needs<br />
and initiatives<br />
of water users,<br />
they should be<br />
guided by sound<br />
information about<br />
the economic and<br />
environmental<br />
trade-offs in<br />
providing these<br />
services<br />
Water in a changing world 293
PART<br />
4<br />
Chapter 16<br />
Because the<br />
demands on water<br />
are many and<br />
diverse, water<br />
management<br />
needs to be guided<br />
by broader social<br />
and economic<br />
development<br />
objectives that<br />
clarify expected<br />
Box 16.1<br />
outcomes<br />
Planning and response timescales may<br />
be categorized as follows:<br />
• Responses to crises (such as<br />
droughts, floods, civil strife) (1-2<br />
years).<br />
• Human resources changes (2-3 years).<br />
• Political horizons (3-5 years).<br />
• Small infrastructure horizons (3-5<br />
years).<br />
• Outcomes horizons (5-8 years).<br />
Hydrology has moved out of catchments<br />
and basins. While the volume of water in<br />
circulation on our planet remains constant,<br />
climate change models suggest some<br />
significant movements in water resources<br />
and changes in local ecosystems in response<br />
to human use and misuse. Data on water<br />
resources – where the water is, where and<br />
how it flows – are essential for understanding<br />
these global changes. Yet the necessary<br />
data are not being collected. As the need for<br />
information is increasing, attention to collecting<br />
environmental data is waning, even<br />
though technologies for collecting data,<br />
democratizing data access and gathering are<br />
becoming more affordable. We must invest<br />
in these technologies and in often-neglected<br />
local data-gathering systems to enhance our<br />
common understanding of water systems,<br />
water resources and water management.<br />
Equally important is information about<br />
how much water is being used, by whom<br />
and for what purposes, the ability and<br />
willingness of water users to pay, cost<br />
recovery rates and the investments needed<br />
to achieve socioeconomic objectives.<br />
Water synergies, balances and<br />
trade-offs<br />
Because the demands on water are many<br />
and diverse, water management needs to<br />
be guided by broader social and economic<br />
development objectives that clarify expected<br />
outcomes. ‘Integrated’ development<br />
plans – such as national development<br />
strategies, poverty reduction strategies,<br />
rural development strategies and regional,<br />
district and city development plans –<br />
should identify the full set of expected<br />
outcomes for water managers.<br />
Timescales for long-term planning<br />
• Behavioural change horizons (10<br />
years).<br />
• Large infrastructure horizons (10-20<br />
years).<br />
• Development horizons (15- 20<br />
years).<br />
• Long-term capacity and intragenerational<br />
equity horizons (25+<br />
years and beyond, depending on<br />
the level of the plan).<br />
Source: Authors’ compilation.<br />
Because drivers, demands and what can<br />
reasonably be achieved given limited<br />
resources differ, there will necessarily be<br />
trade-offs. Where water is abundant, tradeoffs<br />
may have little detrimental impact on<br />
concerned parties or the natural environment.<br />
As water becomes increasingly scarce,<br />
trade-offs will be harsher, requiring sound<br />
leadership to guide decision-making.<br />
A key area of decision-making concerns<br />
economic and environmental trade-offs,<br />
a highly political process. It is important<br />
to differentiate between short-term ‘firefighting’<br />
– responding to the urgent issues<br />
of the day – and strategic development.<br />
Multipurpose schemes and water reuse can<br />
reduce the need for trade-offs by enabling<br />
the same volumes of scarce water to deliver<br />
multiple outcomes.<br />
In negotiating trade-offs, interest groups<br />
strive to protect the interests of their members.<br />
Industry generally lobbies for self-regulation<br />
rather than control. Governments<br />
are concerned with enforcing laws and<br />
regulations. Local pressures and international<br />
regulators sometimes encourage<br />
price controls, which can have negative as<br />
well as positive impact, including preventing<br />
harmful price manipulations by speculators.<br />
Some international groups advocate<br />
for global public goods and services. Nongovernmental<br />
organizations advocate for<br />
water as a human right, charging governments<br />
with responsibility for service provision<br />
and users and beneficiaries for use<br />
that ensures long-term social, economic<br />
and environmental sustainability.<br />
Choices about water uses<br />
Options depend on social, economic and<br />
environmental conditions, the availability<br />
of water over space and time, and the<br />
threat of droughts and floods, all of which<br />
vary around the world.<br />
Where water is scarce, the challenge is to<br />
select the development path that attains<br />
the best social, economic and environmental<br />
outcomes. Such decisions shift<br />
the trade-offs away from water resources<br />
alone to broader concerns of environmental,<br />
economic and social benefits. Making<br />
decisions about water in this context<br />
can sometimes introduce inefficiencies in<br />
other development activities. For example,<br />
importing food rather than producing it<br />
domestically may permit water to be used<br />
for higher value outputs, but many farmers<br />
will then need to find other ways to<br />
earn a living.<br />
Scales of space and time<br />
Actions are constrained by the time horizon<br />
for which they are planned (box 16.1).<br />
Politicians and water managers can find<br />
long-term planning difficult, because the<br />
294 World Water Development Report 3
the way forward<br />
PART<br />
4<br />
plans and objectives often exceed the time<br />
horizon of their tenure. Overcoming this<br />
requires frameworks and incentives that<br />
support long-term planning.<br />
Status of economic development<br />
The stage of economic development and<br />
the financial and human resources available<br />
affect which water management<br />
options are feasible. For example, when<br />
financial resources are limited, choices may<br />
have to be made on allocating funds to<br />
sectors with the highest economic rate of<br />
return or to those that provide basic services.<br />
Lack of resources may require finances<br />
from sources outside the budget and using<br />
resources from outside the country.<br />
High-income countries are experiencing<br />
water management problems that are very<br />
different from those of poor countries.<br />
While high-income countries can afford<br />
to pay more attention to the environment<br />
and to long-term water system sustainability,<br />
developing countries prioritize<br />
eliminating poverty and raising the overall<br />
level of health and well-being, sometimes<br />
at the expense of environmental<br />
sustainability.<br />
The challenge is to build a new dialogue<br />
between developed countries and developing<br />
countries on water management and<br />
its role in sustainable development. Developed<br />
countries and developing countries<br />
must work together to identify socioeconomic<br />
priorities and to invest in and use<br />
water to power the engines of growth.<br />
They must break cycles of poverty while<br />
avoiding the harmful environmental and<br />
health consequences of unbridled development<br />
experienced in many developed<br />
countries. Cooperation between developed<br />
countries and developing countries can<br />
build mitigation, adaptation, avoidance<br />
and no-regret measures into decision-making,<br />
to avoid incurring the costs of neglected<br />
environmental management later.<br />
Working towards better<br />
development outcomes<br />
A nation’s water resources are used and<br />
managed most effectively when they are<br />
linked to broader development objectives.<br />
What are the objectives, for example,<br />
for feeding the population, for providing<br />
power for industry, commerce and<br />
households, for job creation and incomes,<br />
and for child education and health? What<br />
are the relations between these objectives,<br />
and water and water systems? How<br />
should water be managed to achieve these<br />
objectives?<br />
To incorporate these and other water<br />
considerations, countries need strategic<br />
policies and plans. Such plans must<br />
incorporate continuity despite changes in<br />
personnel and avoid loss of direction when<br />
administrations change or key individuals<br />
leave. Development partners can consult<br />
these plans to stay informed of government<br />
intentions and to direct water-related<br />
investments into actions responsive to the<br />
country’s needs.<br />
Actions in a world of change, risk<br />
and uncertainty<br />
Risk and uncertainty are part of decision-making.<br />
What level of protection<br />
is affordable (complex dams or simple<br />
refuges)? What are the trade-offs between<br />
investments that provide direct benefit<br />
(hospitals, schools) and those that protect<br />
against possible extreme events (flood<br />
protection)? How much should be invested<br />
in research where the stakes are high, but<br />
the results uncertain? Perception of risk is<br />
not fixed but is coloured by socioeconomic<br />
conditions, culture and religion, as well as<br />
environmental realities.<br />
Risk management encompasses more than<br />
managing extremes such as floods and<br />
droughts. It entails the use of a structured<br />
approach to manage uncertainty regarding<br />
these events. Decision-makers must<br />
take into account multiple uncertainties,<br />
including those associated with limited or<br />
low-quality data and information and the<br />
inherent unpredictability of climate and<br />
other environmental factors. A promising<br />
approach for dealing with climate risk is to<br />
integrate management of current climate<br />
variability and extremes with adaptation<br />
to climate change.<br />
The world faces major choices in meeting<br />
the challenge of climate change and its potential<br />
environmental and socioeconomic<br />
impacts. Public policy, so far dominated<br />
by mitigation, could benefit from a better<br />
balance between mitigation and adaptation.<br />
Carbon is a measure of the anthropogenic<br />
causes of climate change – water is a<br />
measure of its impacts. The international<br />
community also has to balance investing<br />
for tomorrow’s likely problems of greater<br />
climate variability and global warming<br />
against investing for today’s problems of<br />
climate variability to prevent losses from<br />
droughts and floods. While both are vital,<br />
focusing on today’s problems can also<br />
create greater resilience for dealing with<br />
tomorrow’s problems.<br />
Because of uncertainty, decisions on current<br />
problems should leave the way open<br />
Developed<br />
countries and<br />
developing<br />
countries must<br />
work together<br />
to identify<br />
socioeconomic<br />
priorities and to<br />
invest in and use<br />
water to power the<br />
engines of growth<br />
Water in a changing world 295
PART<br />
4<br />
Chapter 16<br />
Informed<br />
decisions – based<br />
on expected<br />
results and the<br />
consequences of<br />
failing to act – are<br />
needed now<br />
for future options. No-regrets strategies<br />
– actions that would significantly reduce<br />
the adverse impacts of change but would<br />
not cause harm if projections of impacts<br />
of change are wrong – are important in<br />
responding to climate change. In contrast,<br />
failure to act carries risks because the situation<br />
may deteriorate if no action is taken.<br />
The World Water Assessment Programme<br />
and its partners are working to reduce<br />
uncertainty, facilitate decision-making<br />
and accelerate investment by identifying<br />
the links between socioeconomic development,<br />
environmental sustainability,<br />
water management capacity and investments<br />
in water-related infrastructure and<br />
other sectors. Work has begun, in concert<br />
with UN-Water, to identify indicators and<br />
supporting databases to guide decisions<br />
on water policies and actions by leaders<br />
inside and outside the water sector. It will<br />
expand the information base on options<br />
tested in many contexts. The World Water<br />
Assessment Programme is also working on<br />
scenarios linking external drivers to the<br />
water sector that could be applied globally,<br />
regionally and nationally. The next United<br />
Nations World Water Development Report<br />
will include the fruits of that work, along<br />
with additional examples of how challenges<br />
are being addressed on the ground.<br />
Targeting official development<br />
assistance and philanthropic aid<br />
For members of the international community<br />
there are choices between pursuing<br />
their traditional regional financial and<br />
political interests and focusing on areas<br />
where aid of all types is needed most. The<br />
greatest gaps in access to such water-related<br />
services as drinking water supply and<br />
sanitation are in sub-Saharan Africa, Asian<br />
and Latin American slums and countries<br />
recovering from conflict. Inefficient water<br />
use in agricultural production also is a<br />
continuing problem in many countries<br />
around the world, both developed and<br />
developing.<br />
The 2008 World Economic Forum in<br />
Davos led to calls for policies to encourage<br />
a minimum water impact alongside a minimum<br />
carbon footprint; the 2009 forum<br />
included appeals to fight water scarcity.<br />
At the 2009 G-8 meeting in Italy the G-8<br />
leaders are scheduled to review the 2003<br />
G-8 Evian Water Action Plan and discuss<br />
strategies with their African partners for<br />
enhancing its implementation.<br />
Against a background of political and<br />
strategic alignments, the international<br />
community must look for ways to support<br />
the construction of the infrastructure<br />
required to provide a range of direct and<br />
indirect services provided by water systems,<br />
including water supply and sanitation,<br />
production of food and energy and<br />
adaptation and mitigation of climate<br />
variability. National and local governments<br />
can optimize their investments by identifying<br />
actions that will produce the greatest<br />
socioeconomic and environmental benefits.<br />
Supporting countries already on track<br />
to achieve the Millennium Development<br />
Goals at the expense of countries lagging<br />
behind can only entrench global divisions.<br />
sub-Saharan Africa in particular suffers<br />
from lack of development of its water resources<br />
infrastructure for multiple uses.<br />
Deciding – and acting!<br />
Informed decisions – based on expected<br />
results and the consequences of failing to<br />
act – are needed now. Lagging investment<br />
in water leaves hundreds of millions of<br />
people exposed to the risks of environmental<br />
degradation and water-related disasters<br />
and susceptible to political unrest.<br />
Billions of the world’s people suffer from<br />
water-related diseases and hunger. Acting<br />
to reduce such exposure can improve their<br />
health and well-being and provide access<br />
to healthcare for millions more. Country<br />
examples indicate that proper water<br />
management could increase gross domestic<br />
product by 5% to 14% – an impact that<br />
may be unachievable through any other<br />
intervention.<br />
The challenges are great, but the unsustainable<br />
management and inequitable<br />
access to water resources cannot continue<br />
– because the risks of inaction are even<br />
greater. We might not have all the information<br />
we would like to have before acting,<br />
but we know enough to begin to take<br />
significant actions. Some leaders are already<br />
acting, showing the way. Others are<br />
ready to act. Leaders inside and outside the<br />
water domain have critical, complementary<br />
roles. Leaders in the water domain can<br />
inform the processes outside this domain<br />
and manage water resources to achieve<br />
agreed socioeconomic and environmental<br />
objectives. But leaders in government, the<br />
private sector and civil society determine<br />
the direction that actions will take. Recognizing<br />
this, they must act now!<br />
296 World Water Development Report 3
local state<br />
PART<br />
2<br />
Chapter 9<br />
Figure 9.2<br />
Three types of response to water scarcity and<br />
competition<br />
15). A recent shift in emphasis from water<br />
sharing to benefit sharing promises greater<br />
transboundary cooperation.<br />
Canal lining, improved dam management, water management practices,<br />
Conserving<br />
Adopt microirrigation, improve management<br />
change cropping techniques and calendars,<br />
awareness campaigns, volumetric water pricing, institutions<br />
state local<br />
on-farm storage, reduce return flow<br />
Responses<br />
to basin<br />
closure<br />
Tap groundwater,<br />
gate small drains,<br />
introduce conjunctive use<br />
Reservoir building, groundwater abstraction, drains gated, transbasin<br />
diversion, wastewater treatment, desalination, cloud seeding, virtual water<br />
Developing<br />
Change of crops or varieties; arrangements for greater<br />
equity; conflicts, litigation; water grabbing,<br />
bribery; give up (release water)<br />
Sectoral reallocation, quotas, water rights<br />
and markets, basin-level institutions<br />
local state<br />
Allocating<br />
Source: Based on Comprehensive Assessment of Water Management in Agriculture 2007.<br />
and can lead to conflict. The Mekong River<br />
basin has been an exception, with concerns<br />
around water arising only recently. Partly<br />
because of conflicts unrelated to water the<br />
river has long-remained undisturbed, but<br />
dam development to meet the growing<br />
need for energy in most of the riparian<br />
countries is putting other downstream uses<br />
at risk – particularly fisheries (box 9.4).<br />
Despite competing demands and conflict,<br />
however, there is little historic evidence<br />
that water itself has led to international<br />
warfare or that a war over water would<br />
make strategic, hydrographic or economic<br />
sense. 6 At the international level water appears<br />
to provide reasons for trans boundary<br />
cooperation rather than war, often preventing<br />
instead of causing escalation. 7<br />
Many multilateral treaties on freshwater resources<br />
have stressed multiple objectives –<br />
economic development, joint management<br />
and water quality – rather than just water<br />
quantity and hydropower (see appendix<br />
2). 8 The way Mexico and the United States<br />
resolved their dispute over the allocation<br />
of water from the Rio Grande River, which<br />
included a cost-sharing arrangement for<br />
water conservation measures, offers interesting<br />
lessons for the peaceful resolution<br />
of water disputes (see box 15.22 in chapter<br />
Managing competition<br />
through supply and demand<br />
management and reallocation<br />
There are many shortcomings in how water<br />
is managed today in a context of increased<br />
scarcity: low efficiency, environmental degradation,<br />
and inequity. Despite some improvements<br />
competition is increasing and<br />
water use efficiency remains low in most<br />
sectors. But the answer is not just more<br />
efficient allocation mechanisms and more<br />
emphasis on greater yields and productivity,<br />
because these alone may lead to further<br />
losses in equity and environmental sustainability.<br />
Rather, a combination of supply and<br />
demand management measures is needed.<br />
Three common responses to<br />
competition<br />
The responses to increased competition for<br />
water are supply augmentation, conservation<br />
and reallocation (figure 9.2). The most<br />
conventional response is to develop new<br />
resources. For the state this typically means<br />
building new reservoirs or desalination<br />
plants or interbasin transfer. For users this<br />
means more wells or farm ponds or gating<br />
drains to store water. Conserving water<br />
includes increasing the efficiency of use<br />
by reducing losses. Changes in allocation,<br />
to ease competition or to maximize water<br />
use, are based on economic, social, environmental<br />
or other criteria. Augmentation<br />
is a supply management strategy, while<br />
conservation and reallocation are demand<br />
management strategies, roughly defined as<br />
‘doing better with what we have’. 9<br />
Supply augmentation is typically constrained<br />
by the availability of storage sites,<br />
the social and environmental costs and the<br />
rising financial cost of water. With needs<br />
outstripping available stocks in many basins,<br />
transfers between basins have become<br />
more frequent. Amman, Athens, Bangkok,<br />
Kathmandu, Los Angeles and Mexico City<br />
are procuring water further afield. The<br />
massive transfer of water now under way<br />
in China (from the Yangtze River to the<br />
Yellow River) is being emulated in Brazil,<br />
India, Jordan and Thailand. While this<br />
trend is likely to continue, its potential will<br />
gradually be exhausted and its costs will<br />
spiral upwards. Other small-scale options,<br />
such as farm ponds in Asia or wells, have<br />
also been widely developed. Desalination<br />
is an option in specific locations (islands<br />
and coastal cities), but its cost is likely to<br />
remain high (though it is declining) and its<br />
154 World Water Development Report 3
Appendixes<br />
the way forward
Appendix 1<br />
World Water<br />
Development<br />
Report indicators<br />
1<br />
Author: Mike Muller<br />
Even as we pay more attention to the<br />
current state, uses and impacts of water<br />
resources and identify the challenges that<br />
the global community faces in managing<br />
them, the flow of information to support<br />
this work is drying up rather than<br />
growing.<br />
The first edition of The United Nations<br />
World Water Development Report, published<br />
in 2003, included an extensive compilation<br />
of information, drawn from multiple<br />
sources, documenting the state of water,<br />
the resource and its uses. Many agencies<br />
and individuals opened their formal<br />
and informal archives to share information<br />
from their knowledge bases. These<br />
enthusiastic contributions established an<br />
important baseline from which to move<br />
forward.<br />
In all, more than 160 indicators were reported<br />
on, ranging from the global quantum<br />
of water available and withdrawals<br />
for human use to compliance with water<br />
quality standards for key pollutants and<br />
governance mechanisms to support water<br />
management.<br />
The first report also explicitly recognized<br />
the need for further work, notably in collecting<br />
biogeophysical and socioeconomic<br />
data as well as data on environmental<br />
protection and investment in water. It<br />
highlighted the danger of data availability<br />
driving the selection of indicators, which<br />
results in a ‘data-rich, but informationpoor’<br />
syndrome, in which plenty of data<br />
are produced but they are not tailored to<br />
information needs<br />
The second edition of The United Nations<br />
World Water Development Report discussed<br />
the consequences of poor data availability:<br />
Data on almost every subject<br />
related to water issues is usually<br />
lacking, unreliable, incomplete<br />
or inconsistent. We have learned<br />
that merely collecting data is not<br />
enough. It must be brought together,<br />
analysed and converted into<br />
information and knowledge, then<br />
shared widely within and between<br />
countries and stakeholders to focus<br />
attention on water problems at all<br />
scales. It is only when the data has<br />
been collected and analysed that<br />
we can properly understand the<br />
many systems that affect water<br />
(hydrological, socio-economic,<br />
financial, institutional and political<br />
alike), which have to be factored<br />
into water governance.<br />
The number of indicators presented in the<br />
second edition of the report declined to 62<br />
because there was no systematic process<br />
for updating the data used for most of the<br />
indicators presented in the first report.<br />
Water supply and sanitation has been an<br />
exception: the World Health Organization<br />
and United Nations Children’s Fund Joint<br />
Monitoring Programme has systematically<br />
addressed the challenge, investing to ensure<br />
a regular flow of updated information<br />
on this subsector.<br />
Three years later the production team for<br />
the third United Nations World Water Development<br />
Report is in a similar situation to its<br />
predecessors. During preparations for the<br />
Mike Muller is co-chair, World Water Assessment Programme Expert Group on Indicators, Monitoring and<br />
Data/Metadata Bases.<br />
298 World Water Development Report 3
PART<br />
World Water Development Report indicators<br />
report, a survey of data providers suggested<br />
that new data would be available for only<br />
some of the indicators used in the second<br />
report. At press time 30 indicators had<br />
been updated. Because some indicators<br />
included in the second report were identified<br />
as not useful by the source agency, 58<br />
indicators are now listed in table A1.1. The<br />
profile sheets describing these indicators<br />
are available on the World Water Assessment<br />
Programme Website (www.unesco.<br />
org/water/wwap/).<br />
While the indicators on the water resources<br />
situation in the first United Nations World<br />
Water Development Report provided policymakers<br />
at the national, regional and global<br />
levels with a critical overview of the situation,<br />
insight into the trends of key indicators<br />
is vital in a rapidly changing world.<br />
In most cases it has not proved possible<br />
to provide this insight. No new global<br />
estimates of available water resources or of<br />
volume abstracted by major sectoral users<br />
are available. So while this third edition of<br />
the report again contains much important<br />
information, it remains impossible to provide<br />
information on the evolution of key<br />
indicators. (One notable exception is a new<br />
indicator, Status of progression on Agenda<br />
21, which has been updated and included<br />
in this report.)<br />
Several actions are planned to address this<br />
gap: UN-Water has created the Task Force<br />
on Indicators, Monitoring and Reporting<br />
to address the challenge of producing<br />
key global indicators of the state of water<br />
resources to meet the needs of policy- and<br />
decision-makers at all levels. And the<br />
World Water Assessment Programme has<br />
established the Expert Group on Indicators,<br />
Monitoring and Data/Metadata<br />
Bases to support this work, specifically by<br />
promoting a dialogue between indicator<br />
users and data providers/interpreters about<br />
the feasibility of providing data for the<br />
key indicators on a sustainable, ongoing<br />
basis. The expert group will also propose<br />
strategies to improve data collection and<br />
interpretation.<br />
It is hoped that the next United Nations<br />
World Water Development Report will be<br />
able to report some substantive progress<br />
and answer key questions about whether<br />
and how changing water resources endowments<br />
affect countries and regions,<br />
whether the efficiency of water use for<br />
national socioeconomic development is<br />
improving and whether degradation of the<br />
water environment has been slowed. At<br />
the very least, it should be able to report<br />
on steps taken to improve the flow of data<br />
and information needed to establish and<br />
monitor key trends.<br />
Table A1.1<br />
Topic<br />
Level of<br />
stress on the<br />
resource<br />
Governance<br />
List of United Nations World Water Development Report indicators and location<br />
of detailed data<br />
Indicator<br />
Index of non-sustainable water use<br />
Category in<br />
cause-effect<br />
approach a<br />
Driving force,<br />
Pressure, state<br />
Type of<br />
indicator b<br />
In World Water<br />
Development<br />
Report 2<br />
Location c<br />
Key Section 1 na<br />
In World Water<br />
Development<br />
Report 3<br />
Rural and urban population Pressure, state Basic Section 1 Map 2.1<br />
Figure 2.1<br />
Relative Water Stress Index Pressure, state Key Section 2 na<br />
Sources of contemporary nitrogen loading Pressure, state Key Section 3 na<br />
Domestic and industrial water use Pressure, state Basic Section 3 Table 7.1<br />
Figure 7.1<br />
Impact of sediment trapping by large dams Pressure Key Section 4 na<br />
and reservoirs<br />
Coefficient of variation for the Climate State Key Section 4 na<br />
Moisture Index<br />
Water Reuse Index Pressure, state Key Section 4 Figure 8.6<br />
Access to information, participation and<br />
justice<br />
Assessing progress towards achieving the<br />
integrated water resources management<br />
target<br />
Response Developing Table 2.2 na<br />
Table 2.3<br />
Response Key Table 2.1 na<br />
(continued)<br />
Water in a changing world 299
PART<br />
Appendix 1<br />
Table A1.1<br />
Topic<br />
Settlements<br />
List of United Nations World Water Development Report indicators and location<br />
of detailed data (continued)<br />
Indicator<br />
Category in<br />
cause-effect<br />
approach a<br />
Type of<br />
indicator b<br />
In World Water<br />
Development<br />
Report 2<br />
Location c<br />
Index of performance of water utilities State Developing na na<br />
Urban water and sanitation governance index State Developing na na<br />
In World Water<br />
Development<br />
Report 3<br />
Slum profile in human settlements Pressure Developing na na<br />
Total actual renewable water resources State Key Table 4.3 *<br />
Precipitation Driving force Basic Table 4.3 Table 10.1<br />
Map 11.1<br />
**<br />
State of the<br />
resource<br />
Total actual renewable water resources<br />
per capita<br />
Surface water as share of total actual<br />
renewable water resources<br />
Overlap as share of total actual renewable<br />
water resources<br />
State Developing Table 4.3 **<br />
State Developing Table 4.3 na<br />
State Developing Table 4.3 na<br />
Inflow from other countries as share of State Developing Table 4.3 **<br />
total actual renewable water resources d<br />
Outflow to other countries as share of<br />
total actual renewable water resources<br />
State Developing Table 4.3 na<br />
Total use as share of total actual renewable State Developing Table 4.3 **<br />
water resources e<br />
Groundwater development as share of total<br />
actual renewable water resources<br />
State Key Table 4.3 na<br />
Fragmentation and flow regulation of rivers State, impact Key Map 5.3<br />
Figure 5.4<br />
Figure 8.2<br />
Ecosystems<br />
Dissolved nitrogen (nitrates + nitrogen<br />
dioxide)<br />
State Key Map 5.2 *<br />
Trends in freshwater habitat protection State, response Key Fig. 5.7 na<br />
Freshwater species population trends index State Key Fig. 5.2 Figure 8.1<br />
Disability-adjusted life year Impact Key Table 6.3 Table 6.3<br />
Health<br />
Prevalence of stunting among children under<br />
age 5<br />
Impact Developing na Map 6.2<br />
Mortality rate of children under age 5 Impact Developing Table 6.2 *<br />
Access to safe drinking water Impact Key Map 6.1 Figure 7.3<br />
Access to basic sanitation Impact Key Map 6.2 Figure 7.4<br />
Percentage of undernourished people State Key Map 7.2<br />
Figure 7.10<br />
Figure 7.11<br />
*<br />
Food,<br />
agriculture<br />
and rural<br />
livelihoods<br />
Percentage of poor people living in rural<br />
areas<br />
State Key na *<br />
Agriculture GDP as share of total GDP State Key na *<br />
Irrigated land as a percentage of cultivated<br />
land<br />
Pressure, state Key Map 7.1 Map 7.5<br />
Agriculture water withdrawals as share of<br />
total water withdrawals<br />
Pressure Key na Table 7.1<br />
Extent of land salinized by irrigation State Key na na<br />
Groundwater use as share of total irrigation Pressure, state Key na Figure 7.1<br />
(continued)<br />
300 World Water Development Report 3
PART<br />
World Water Development Report indicators<br />
Table A1.1<br />
Topic<br />
List of United Nations World Water Development Report indicators and location<br />
of detailed data (continued)<br />
Indicator<br />
Category in<br />
cause-effect<br />
approach a<br />
Type of<br />
indicator b<br />
In World Water<br />
Development<br />
Report 2<br />
Location c<br />
Trends in industrial water use Pressure Key Figure 8.1 na<br />
In World Water<br />
Development<br />
Report 3<br />
Water use by major sector State Key Figure 8.3 Table 7.1<br />
Figure 7.1<br />
Organic pollution emissions (biochemical<br />
oxygen demand) by industrial sector<br />
Impact Key Figure 8.4 *<br />
Industrial water productivity Response Key Table 8.4 Figure 7.8<br />
Industry<br />
and energy<br />
Trends in ISO 14001 certification Response Key Table 8.2 Figure 8.7<br />
Electricity generation by energy source State Key Figure 9.1 Figure 7.11<br />
Total primary energy supply by source State Key Figure 9.2 *<br />
Carbon intensity of electricity generation Impact Key Table 9.4 na<br />
Volume of desalinated water produced Response Key Table 9.1 Box 9.5<br />
Access to electricity and water for domestic<br />
use<br />
Pressure Key Table 9.5 *<br />
Capability for hydropower generation State Key Table 9.6 Map 7.6<br />
*<br />
Risk<br />
assessment<br />
Disaster Risk Index State Key Box 10.4 na<br />
Risk and policy assessment indicator Response Key Figure 10.7 na<br />
Climate Vulnerability Index State Key Map 10.3 na<br />
Water sector share in total public spending Response Developing na na<br />
Ratio of actual to desired level of public<br />
investment in drinking water supply<br />
Response Developing na na<br />
Valuing and<br />
charging for<br />
the resource<br />
Ratio of actual to desired level of public Response Developing na na<br />
investment in basic sanitation f<br />
Rate of cost recovery g<br />
Driving force,<br />
response<br />
Developing na na<br />
Water charges as percentage of household<br />
income h<br />
Driving force,<br />
response<br />
Developing Figure 12.5 na<br />
Knowledge<br />
base and<br />
capacity<br />
Knowledge Index State Developing Map 13.2 *<br />
na designates that the indicator is not used in the report, although for many of these indicators updated information is provided online (see table note).<br />
Note: An Indicator profile sheet with a detailed definition and explanation of how the indicator is computed (as well as data tables for some indicators)<br />
is available for most indicators at www.unesco.org/water/wwap/wwdr/wwdr3/indicators. Exceptions are subindicators for ‘Total actual renewable water<br />
resources’.<br />
*See table accompanying the online Indicator profile sheet.<br />
**See table accompanying the online Indicator profile sheet for Total actual renewable resources.<br />
a. The categories are based on the DPSIR (driving forces, pressures, state, impact, response) framework. For details, see www.unesco.org/water/wwap/wwdr/<br />
wwdr1/pdf/chap3.pdf and www.unesco.org/water/wwap/wwdr/wwdr2/pdf/wwdr2_ch_1.pdf (pp. 33-38).<br />
b. Basic indicators provide fundamental information and are well established and widely used; data are generally widely available for all countries. Key<br />
indicators are well defined and validated, have global coverage and are linked directly to policy goals. Developing indicators are in a formative stage and may<br />
evolve into key indicators following refinement of methodological issues or data development and testing.<br />
c. Because of updates to data and sources, data may not match across reports.<br />
d. Now called ‘Dependency ratio’.<br />
e. Now called ‘Millennium Development Goal water indicator’.<br />
f. Proposed for United Nations World Water Development Report 3.<br />
g. Now called ‘Rate of operation and maintenance cost recovery for water supply and sanitation’.<br />
h. Now called ‘Water and sanitation charges as percentage of various household income groups’.<br />
Source: Compiled by Engin Koncagül and Akif Altundaş.<br />
Water in a changing world 301
Appendix 2<br />
Water-related goals<br />
and objectives of<br />
major conferences and<br />
forums, 1972-present<br />
Table A2.1<br />
Water-related goals and objectives of major conferences and forums, 1972-present<br />
International forum<br />
UN Conference on the<br />
Human Environment,<br />
Stockholm, Sweden, 1972<br />
UN Conference on<br />
Water, Mar del Plata,<br />
Argentina, 1977<br />
International<br />
Drinking Water<br />
Supply and Sanitation<br />
Decade, 1981-90<br />
Global Consultation<br />
on Safe Water and<br />
Sanitation for the 1990s,<br />
New Delhi, India, 1990<br />
World Summit for<br />
Children, New York,<br />
United States, 1990<br />
International Decade<br />
for Natural Disaster<br />
Reduction, 1990-2000<br />
International<br />
Conference on Water<br />
and Environment,<br />
Dublin, Ireland, 1992<br />
Agreed goals and objectives<br />
• The main issues of the conference were preservation and enhancement of the human environment.<br />
• The declaration of the conference acknowledged that ‘a point has been reached in history when<br />
we must shape our actions throughout the world with a more prudent care for their environmental<br />
consequences.’<br />
• The main objective of this first global-scale conference on water was to promote greater awareness<br />
nationally and internationally of global problems related to water and to assess water resources and<br />
water use efficiency through an integrated approach to water resources management.<br />
• Led to declaring the 1980s International Drinking Water Supply and Sanitation Decade, with the<br />
objective of providing drinking water and sanitation for all people by 1990.<br />
‘The goal of the Decade was that, by the end of 1990, all people should possess an adequate water<br />
supply and satisfactory means of excreta and sullage disposal. This was indeed an ambitious target as<br />
it has been estimated that it would have involved the provision of water and sanitation services to over<br />
650,000 people per day for the entire ten year period. Although major efforts were made by government<br />
and international organisations to meet this target, it was not achieved.’ (C. Choguill, R. Francys and A.<br />
Cotton, 1993, Planning for Water and Sanitation)<br />
• The main issues were safe drinking water and environmental sanitation.<br />
• The New Delhi Statement declared: ‘Safe water and proper means of waste disposal . . . must be<br />
at the center of integrated water resources management.’ (Environment and health, New Delhi<br />
Statement)<br />
• The main issues were health and food supply.<br />
• The World Declaration on the Survival, Protection and Development of Children stated: ‘We will<br />
promote the provision of clean water in all communities for all their children, as well as universal<br />
access to sanitation.’<br />
Recognized the increased vulnerability of people and property to natural disasters and sought ‘to reduce<br />
through concerted international action, especially in developing countries, the loss of life, property<br />
damage and social and economic disruption caused by natural disasters.’ (Resolution 44/236 of the UN<br />
General Assembly)<br />
The most important achievement was the development of the Dublin Principles:<br />
• Freshwater is a finite and vulnerable resource, essential to sustain life, development and the<br />
environment.<br />
• Water development and management should be based on a participatory approach, involving users,<br />
planners and policy-makers at all levels.<br />
• Women play a central part in providing, managing and safeguarding water.<br />
Water has an economic value in all its competing uses and should be recognized as an economic good.<br />
(continued)<br />
302 World Water Development Report 3
PART<br />
Water-related goals and objectives of major conferences and forums, 1972-present<br />
Table A2.1<br />
Water-related goals and objectives of major conferences and forums, 1972-present (continued)<br />
International forum<br />
UN Conference on<br />
Environment and<br />
Development , Rio de<br />
Janeiro, Brazil, 1992<br />
Ministerial Conference on<br />
Drinking Water Supply<br />
and Environmental<br />
Sanitation, Noordwijk,<br />
The Netherlands, 1994<br />
UN International<br />
Conference on Population<br />
and Development,<br />
Cairo, Egypt, 1994<br />
World Summit for<br />
Social Development,<br />
Copenhagen,<br />
Denmark, 1995<br />
UN Fourth World<br />
Conference on Women,<br />
Beijing, People’s Republic<br />
of China, 1995<br />
Second UN Conference<br />
on Human Settlements<br />
(Habitat II), Istanbul,<br />
Turkey, 1996<br />
World Food Summit,<br />
Rome, Italy, 1996<br />
1st World Water Forum,<br />
Marrakech, Morocco, 1997<br />
International Conference<br />
on Water and Sustainable<br />
Development, Paris,<br />
France, 1998<br />
Millennium Declaration,<br />
New York, United<br />
States, 2000<br />
Agreed goals and objectives<br />
Agenda 21, chapter 18, ‘Protection of the quality and supply of freshwater resources: application of<br />
integrated approaches to the development, management and use of water resources’, dealt with the basis<br />
for action, objectives and activities concerning:<br />
• Integrated water resources development and management.<br />
• Water resources assessment.<br />
• Protection of water resources, water quality and aquatic ecosystems.<br />
• Drinking water supply and sanitation.<br />
• Water and sustainable urban development.<br />
• Water for sustainable food production and rural development.<br />
• Impacts of climate change on water resources.<br />
• The main issues were drinking water supply and sanitation.<br />
• The Programme of Action identified ‘assign[ing] high priority to programmes designed to provide<br />
basic sanitation and excreta disposal systems to urban and rural areas.’<br />
• The Programme of Action highlighted ‘ensur[ing] that population, environmental and poverty<br />
eradication factors are integrated in sustainable development policies, plans and programmes.’<br />
(Chapter III – Interrelationships between population, sustained economic growth and sustainable<br />
development)<br />
• The main issues were poverty reduction, water supply and sanitation.<br />
• The outcome was the Copenhagen Declaration on Social Development.<br />
• The main issues were gender, water supply and sanitation.<br />
• The outcome was the Beijing Declaration and Platform for Action.<br />
• The main issues were sustainable human settlements development in an urbanizing world.<br />
• The outcome was the Habitat Agenda.<br />
• The main issues were food, health, water and sanitation.<br />
• The outcome was the Rome Declaration on World Food Security.<br />
The main issues were water and sanitation, management of shared waters, preserving ecosystems,<br />
gender equity and efficient use of water ‘to recognize the basic human needs to have access to clean<br />
water and sanitation, to establish an effective mechanism for management of shared waters, to support<br />
and preserve ecosystems, to encourage the efficient use of water.’ (Marrakech Declaration)<br />
The outcome was the Paris Declaration on Water and Sustainable Development, whose objective was ‘to<br />
improve co-ordination between UN Agencies and Programmes and other international organizations,<br />
to ensure periodic consideration within the UN system. [To] emphasize the need for continuous political<br />
commitment and broad-based public support to ensure the achievement of sustainable development,<br />
management and protection, and equitable use of freshwater resources, and the importance of civil<br />
society to support this commitment.’ (Paris Declaration)<br />
The Millennium Development Goals include the following water-related targets:<br />
• ‘To halve, by the year 2015, the proportion of the world’s people whose income is less than one dollar<br />
a day and the proportion of people who suffer from hunger and, by the same date, to halve the<br />
proportion of people who are unable to reach or to afford safe drinking water.’<br />
• ‘To stop the unsustainable exploitation of water resources by developing water management<br />
strategies at the regional, national and local levels, which promote both equitable access and<br />
adequate supplies.’<br />
(continued)<br />
Water in a changing world 303
PART<br />
Appendix 2<br />
Table A2.1<br />
Water-related goals and objectives of major conferences and forums, 1972-present (continued)<br />
International forum<br />
2nd World Water<br />
Forum, The Hague, The<br />
Netherlands, 2000<br />
International Conference<br />
on Freshwater, Bonn,<br />
Germany, 2001<br />
World Summit on<br />
Sustainable Development,<br />
Johannesburg, South<br />
Africa, 2002<br />
3rd World Water Forum,<br />
Kyoto, Japan, 2003<br />
G-8 Evian Summit,<br />
Evian, France, 2003<br />
Water for Life<br />
Decade, 2005-15<br />
The World Conference on<br />
Disaster Reduction, Kobe<br />
(Hyogo), Japan, 2005<br />
Agreed goals and objectives<br />
The Ministerial Declaration identified the following main challenges:<br />
• Meeting basic needs – access to safe and sufficient water and sanitation.<br />
• Securing the food supply, particularly of the poor and vulnerable.<br />
• Protecting ecosystems – ensure the integrity of ecosystems through sustainable water resources<br />
management.ASharing water resources, by peaceful cooperation between water users at all levels.<br />
• Managing risks from floods, droughts, pollution and other water hazards.<br />
• Valuing water – managing water to reflect its economic, social, environmental and cultural values.<br />
• Governing water wisely, including involving the public and the interests of all stakeholders.<br />
• The main issues were governance, finance mobilization, capacity building and knowledge sharing.<br />
• Identified water as key to sustainable development.<br />
• The outcome was the Ministerial Declaration Recommendations for Action: ‘Combating poverty is<br />
the main challenge for achieving equitable and sustainable development, and water plays a vital<br />
role in relation to human health, livelihood, economic growth as well as sustaining ecosystems. . . .<br />
The conference recommends priority actions under the following three headings: governance,<br />
mobilising financial resources, capacity building and sharing knowledge.’ (Ministerial Declaration<br />
Recommendations for Action)<br />
The summit dealt with the following freshwater-related issues:<br />
• Decentralization of governance.<br />
• Community empowerment.<br />
• Service provision: rural and urban challenges.<br />
• Information management.<br />
• Integrated water resources management.<br />
• Education and awareness.<br />
• Financial and economic mechanisms.<br />
• Regional challenges were particularly recognized and identified.<br />
The outcomes included:<br />
• A water and climate dialogue, including agreed action points.<br />
• A water and poverty dialogue, including agreed action points.<br />
• A final report on financing water infrastructure.<br />
• Outcomes from the Dialogue on Food, Water and Environment.<br />
• A detailed document on Water Actions.<br />
One outcome was a G-8 Action Plan on Water:<br />
• Promoting good governance.<br />
• Using all financial resources.<br />
• Building infrastructure by empowering local authorities and communities.<br />
• Strengthening monitoring, assessment and research.<br />
• Reinforcing engagement of international organizations.<br />
Launched by the United Nations System, the aim is to promote efforts to fulfil international commitments<br />
made on water and water-related issues by 2015, with special emphasis on the involvement and<br />
participation of women.<br />
Adopted the ‘Hyogo Framework for Action 2005-2015: Building the Resilience of Nations and<br />
Communities to Disasters’, recognizing the importance of water-related disaster risk reduction.<br />
(continued)<br />
304 World Water Development Report 3
PART<br />
Water-related goals and objectives of major conferences and forums, 1972-present<br />
Table A2.1<br />
Water-related goals and objectives of major conferences and forums, 1972-present (continued)<br />
International forum<br />
4th World Water Forum,<br />
Mexico City, Mexico, 2006<br />
5th World Water Forum,<br />
Istanbul, Turkey, 2009<br />
Agreed goals and objectives<br />
The ministers at the forum reaffirmed commitments made at the UN Conference on Environment<br />
and Development, World Summit on Sustainable Development, and the Commission on Sustainable<br />
Development during 2005, emphasizing:<br />
• Expediting implementation in water, sanitation and human settlements.<br />
• Enhancing the sustainability of ecosystems.<br />
• Applying innovative practices such as rainwater management and development of hydropower<br />
projects in some regions.<br />
• Involving relevant stakeholders, particularly women and youth, in planning and management.<br />
• They also expressed support for relevant UN water-related activities, including the coordinating role<br />
of UN-Water.<br />
The theme is Bridging Divides for Water.<br />
Source: www.un.org/esa/sustdev and www.worldwatercouncil.org.<br />
Water in a changing world 305
Abbreviations,<br />
data notes and<br />
units of measure<br />
Abbreviations<br />
ANA<br />
AQUAREC<br />
AQUASTAT<br />
BAPE<br />
BOD<br />
CALM<br />
CNA<br />
DOC<br />
EAAB<br />
EIONET<br />
FAO<br />
FRIEND<br />
GAP<br />
GCM<br />
GDP<br />
GEO<br />
GLAAS<br />
GNI<br />
GOCE<br />
GRACE<br />
GRAPHIC<br />
GW-MATE<br />
IFAD<br />
IPCC<br />
MDG<br />
NAFTA<br />
NEWS<br />
National Water Agency (of Brazil)<br />
Integrated Concepts for Reuse of Upgraded Wastewater<br />
FAO database on water and agriculture<br />
Bureau d’audiences publiques sur l’environnment (Office for Public Hearings<br />
on the Environment, Québec, Canada)<br />
Biochemical oxygen demand<br />
Circumpolar Active Layer Monitoring observational network<br />
National Water Commission of Mexico (Comisión Nacional del Agua)<br />
Dissolved organic carbon<br />
Water and Sewerage of Bogotá (Empresa de Acueducto y Alcantarillado de<br />
Bogotá)<br />
European Environment Information and Observation Network<br />
Food and Agriculture Organization of the United Nations<br />
Flow Regime from International Experimental Data<br />
Southeastern Anatolia Project (Güneydoğu Anadolu Projesi)<br />
General circulation model<br />
Gross domestic product<br />
Global Environment Outlook<br />
Global Annual Assessment of Sanitation and Drinking-Water<br />
Gross national income<br />
Gravity Field and Steady-State Ocean Circulation Explorer<br />
Gravity Recovery and Climate Experiment satellites<br />
Groundwater Resources Assessment under the Pressures of Humanity and<br />
Climate Change programme<br />
World Bank Groundwater Management Advisory Team<br />
International Fund for Agricultural Development<br />
Intergovernmental Panel on Climate Change<br />
Millennium Development Goal<br />
North American Free Trade Agreement<br />
Global Nutrient Export from Watersheds models<br />
306 World Water Development Report 3
PART<br />
Abbreviations, data notes and units of measure<br />
NGO<br />
NWSC<br />
OAS<br />
OECD<br />
OMVS<br />
PDSI<br />
PLUARG<br />
POC<br />
R&D<br />
RADWQ<br />
SAGUAPAC<br />
TVA<br />
UN<br />
UNEP<br />
UNESCO<br />
UNFCCC<br />
Non-governmental organization<br />
National Water and Sewerage Corporation of Uganda<br />
Organization of American States<br />
Organisation for Economic Co-operation and Development<br />
Organization for Development of the Senegal River (Organisation pour la<br />
mise en valeur du fleuve Sénégal)<br />
Palmer Drought Severity Index<br />
International Reference Group on Great Lakes Pollution from Land Use<br />
Activities<br />
Particulate organic carbon<br />
Research and development<br />
Rapid Assessment of Drinking Water Quality survey method<br />
Cooperative for Urban Water and Sanitation Services in Santa Cruz<br />
Tennessee Valley Authority<br />
United Nations<br />
United Nations Environment Programme<br />
United Nations Educational, Scientific and Cultural Organization<br />
United Nations Framework Convention on Climate Change<br />
UN-HABITAT United Nations Human Settlements Programme<br />
UNICEF<br />
UNSGAB<br />
WBCSD<br />
WHO<br />
United Nations Children’s Fund<br />
UN Secretary-General’s Advisory Board<br />
World Business Council for Sustainable Development<br />
World Health Organization<br />
Data notes and units of measure<br />
$ All dollars are current US dollars unless otherwise indicated<br />
Billion Billion is 1,000 million<br />
Water Refers to freshwater unless otherwise indicated<br />
Btu<br />
British thermal unit (1,054.35 joules)<br />
exajoule Unit of energy equal to 10 18 joules<br />
Gt<br />
Gigatonne<br />
kcal<br />
Kilocalorie<br />
kg<br />
Kilogram<br />
km 2<br />
Square kilometre<br />
km 3<br />
Cubic kilometre<br />
m 2<br />
m 3<br />
mm<br />
Square metre<br />
Cubic metre<br />
Millimetre<br />
terawatt Unit of energy equal to 1 trillion watts (10 12 )<br />
Water in a changing world 307
List of boxes,<br />
figures, maps<br />
and tables<br />
Boxes<br />
1 Objectives and targeted audience of The United Nations World Water Development Report vii<br />
1.1 Commitment of African heads of state to water as a key to sustainable development 7<br />
1.2 Economic impacts of lack of adequate sanitation facilities in South-East Asia 8<br />
1.3 Estimated costs of restoring essential ecosystems in the United States 9<br />
1.4 Progress in meeting the Millennium Development Goal target on water supply and sanitation 12<br />
1.5 High-Level Event on the Millennium Development Goals, United Nations, New York, 25 September 2008:<br />
Extract from compilation of partnership events and commitments 13<br />
1.6 Malnutrition attributable to environmental risks 14<br />
1.7 Water as capital 14<br />
1.8 International Monetary Fund updated economic forecast for 2009 17<br />
1.9 Extracts from Declaration of Leaders Meeting of Major Economies on Energy Security and Climate<br />
Change at the G-8 Hokkaido, Toyako, summit, 9 July 2008 18<br />
1.10 Intergovernmental Panel on Climate Change Technical Report on Water and Climate Change 19<br />
1.11 UN Secretary General Ban Ki-moon warns that water shortages are increasingly driving conflicts 20<br />
2.1 Virtual water 35<br />
2.2 Water: a brake on economic growth and corporate prospects 36<br />
2.3 The role of women within the water sector and the importance of gender mainstreaming 38<br />
4.1 The EU Water Framework Directive – uneven implementation 50<br />
4.2 Australian water law reform 52<br />
4.3 Experience with irrigation management transfer 55<br />
4.4 Dalian water supply project in China – successful expansion of services 61<br />
4.5 Subsidizing water supply and sanitation in the Republic of Korea 64<br />
5.1 The cost of adapting to climate change 71<br />
5.2 Micro-hydro plants in Nepal are expected to provide electricity access to 142,000 households and to<br />
reduce greenhouse gas emissions 72<br />
5.3 Health and climate change 73<br />
6.1 Water services are a crucial element of nation-building in fragile states 81<br />
6.2 Storing water for development 81<br />
6.3 Land tenure and access to water and sanitation 85<br />
6.4 Four water dimensions of rural livelihoods 86<br />
6.5 Defining water services: single or multiple uses? 87<br />
6.6 Agro-ecosystems and sustainability: an example from Peru 93<br />
7.1 How much do we know about water uses? 97<br />
7.2 Water withdrawal, demand and consumption 98<br />
7.3 Rapid assessment of drinking water quality 103<br />
7.4 How much water is needed to produce food for a single day? 107<br />
7.5 Coping with water scarcity and climate change in agriculture in the Near East 112<br />
7.6 Impacts of water shortage on rice production in Indonesia 114<br />
7.7 Tourism water demand in the Mediterranean coastal area 117<br />
8.1 Asian ‘Tigers’ and the hidden tip of the pollution iceberg 136<br />
8.2 Addressing eutrophication and its effects in the Baltic Sea 138<br />
308 World Water Development Report 3
PART<br />
List of boxes, figures, maps and tables<br />
8.3 The arsenic crisis: as yet no solution 139<br />
8.4 Long-term impacts of mining on ecosystems in transition economies 140<br />
8.5 Impact of economic recession on pollution in Eastern Europe 141<br />
8.6 A wastewater river 141<br />
8.7 Setting target for pollution mitigation and limits for reuse – the example of Europe 142<br />
8.8 Environmental flow assessment in Asia – from concept to reality 145<br />
9.1 The closure of the lower Jordan River basin 151<br />
9.2 Conflict between agriculture and industry over water in Orissa, India 152<br />
9.3 Competition for water and downstream impacts in the Indus River basin 153<br />
9.4 Fisheries and hydropower competing in the Mekong River basin 153<br />
9.5 The untapped potential of marginal-quality water 155<br />
9.6 Signs of progress in urban areas: examples in Asia and Australia 157<br />
11.1 Changes in discharge of major global rivers 189<br />
12.1 A global perspective on regional vegetation and hydrologic sensitivities to climate change 213<br />
12.2 Managing urban stormwater in association with land use and land-cover planning can convert a<br />
nuisance into a resource 214<br />
12.3 Drought in Australia, 1996-2007 216<br />
12.4 Controlled exploitation and artificial recharge as effective measures against<br />
detrimental subsidence 217<br />
12.5 Towards transboundary management of the Guaraní aquifer 221<br />
12.6 Lake Sarez, Tajikistan – turning a hazard into an opportunity 223<br />
14.1 UN-Water survey on progress towards 2005 targets for integrated water resources management and water<br />
efficiency plans 243<br />
14.2 Responses to impacts of non-integrated approaches to water resources management 243<br />
14.3 Water resources management in Tunisia 244<br />
14.4 Integrated water planning in the Netherlands 245<br />
14.5 Participatory approaches in decentralized provision of water supply and sanitation services 246<br />
14.6 Integrated management of land-based activities in São Francisco basin, Brazil 247<br />
14.7 The right to water 248<br />
14.8 Public-private partnership for reducing non-revenue water losses in Malaysia 249<br />
14.9 Examples of legal frameworks for managing water 250<br />
14.10 Recognizing customary practices in drafting laws 250<br />
14.11 Water-related responses to climate change 251<br />
14.12 Public participation panels in the North American Great Lakes basin review of water quality 252<br />
14.13 Grass-roots water federations in Ecuador 253<br />
14.14 Participatory irrigation management and the role of water user associations 253<br />
14.14 Participatory irrigation management and the role of water user associations (continued) 254<br />
14.15 Public participation in water resources management 254<br />
14.16 Responding to corruption and mismanagement in the water sector – examples from Colombia, India and<br />
Lesotho 255<br />
14.17 Networking to share water resources management experiences 257<br />
14.18 Incorporating local knowledge in networks – the Integrated Watershed Management Network of Eastern<br />
Africa 258<br />
14.19 Using water management to preserve biodiversity and economic livelihoods – Kafue Flats, Zambia 259<br />
14.20 Using irrigation technology to increase water use efficiency 260<br />
14.21 Research links in developing countries 260<br />
14.22 Using monitoring information in water resources management 261<br />
14.23 Addressing water supply and sanitation challenges in Uganda 263<br />
14.24 Paying for environmental services – green water credits in Kenya 265<br />
15.1 Combating corruption 270<br />
15.2 Decentralization in Uganda – making room for better environmental governance at the local level 271<br />
15.3 Economic diversification in Mauritius helps promote access to water 272<br />
15.4 More relevant schools lead to benefits for water 272<br />
15.5 The ecohealth approach: combating malaria through agricultural practices in Kenya 273<br />
15.6 Measuring the water limits to growth in Ethiopia 274<br />
15.7 The Coca-Cola controversy in Kala Dera, India – learning from mistakes 275<br />
15.8 Mondi South Africa achieves sustainable expansion 275<br />
15.9 Examples of clean production processes 276<br />
15.10 Québec’s Bureau d’audiences publiques sur l’environnement consultation on water resources<br />
management 277<br />
15.11 Collaborative learning processes – adopting an adaptive management framework 277<br />
Water in a changing world 309
PART<br />
List of boxes, figures, maps and tables<br />
15.12 The Integrated Watershed Development Programme in Jhabua District, Madhya Pradesh, India 278<br />
15.13 Experience with multiple-use water services in Nepal 278<br />
15.14 The drive for competitive advantage leads to water benefits 279<br />
15.15 Sustainable tourism, Çıralı, Turkey 280<br />
15.16 Integrating multiple sectors in Southeast Anatolia, Turkey 281<br />
15.17 The Tennessee Valley Authority: economic and social transformation in a river basin and beyond 281<br />
15.18 Nepal: a community-led initiative to mitigate water-induced disasters 282<br />
15.19 Resettlement in Rwanda 282<br />
15.20 Rehabilitating the Iraqi Mesopotamian Marshlands for integration and stability 283<br />
15.21 Sustainable water institutions promote regional cooperation and stability – the case of the Senegal<br />
River 284<br />
15.22 Allocation of water from the Rio Grande/Rio Bravo River between Mexico and the United States 284<br />
15.23 Rainfall-related index insurance for farmers 285<br />
15.24 Getting a complete picture of water resources through user contributions – a new role for Australia’s<br />
Bureau of Meteorology 286<br />
15.25 Zambia’s experiences linking integrated water resources management with national development<br />
plans 287<br />
15.26 Payments for ecosystem services help curb climate change and conserve biodiversity while protecting<br />
water resources 288<br />
15.27 A water services concession with public funding in Guayaquil, Ecuador 288<br />
16.1 Timescales for long-term planning 294<br />
Figures<br />
1.1 Decision-making affecting water 5<br />
1.2 The costs of disasters as a share of GDP are much higher in poor countries than rich countries 8<br />
1.3 US government investments in water infrastructure during 1930-96 yielded $6 in damages averted for<br />
each $1 invested 8<br />
1.4 Water investment requires a holistic approach – links between pricing, financing and stakeholders 9<br />
1.5 Access to water and sanitation rises with income 11<br />
1.6 Poverty remains high in sub-Saharan Africa 11<br />
1.7 Cause-effect chains and links between water and the Millennium Development Goals 13<br />
1.8 Historical and projected energy demand and oil prices show steadily rising demand and rapidly rising<br />
prices 15<br />
1.9 Wheat and rice prices have risen sharply in recent years 16<br />
2.1 By 2030 about 60% of the world’s population is expected to live in urban areas 31<br />
2.2 The cost of energy to consumers has been rising since the 1970s 34<br />
2.3 The fertility rate declines with rising female literacy, 1990 37<br />
3.1 Many developed countries have increased their investment in environmental research and<br />
development 42<br />
3.2 The use of renewable energy sources rose worldwide between 1990 and 2004 43<br />
3.3 The absorption of older and more recent technologies depends on more than income 46<br />
4.1 Formal and informal legal framework of water rights 52<br />
4.2 If the vicious cycle of low funding is reversed, the benefits to society will be enormous 57<br />
4.3 New infrastructure seems to dominate donor investments in drinking water and sanitation 58<br />
4.4 In the few countries surveyed financial system constraints weighed heavily on achieving the Millennium<br />
Development Goals sanitation target 59<br />
4.5 Household expenditure and private sector investments in drinking water supply are generally<br />
unknown 60<br />
4.6 Private water operators have a substantial role in developing and developed countries 63<br />
4.7 External private investment in the water sector, though variable, has been significant since the early<br />
1990s 63<br />
4.8 Official development assistance to the water supply and sanitation sector is rising again after a decline<br />
during the 1990s 63<br />
5.1 Climate change: processes, characteristics and threats 69<br />
5.2 GDP growth tracks rainfall variability in Ethiopia (1983-2000) and Tanzania (1989-99) 70<br />
6.1 The shift of economies from agriculture-based to industrialized, 1965-2001 82<br />
6.2 The relation between freshwater use and level of development is inconclusive 83<br />
6.3 The ratio of water use to GDP has been declining in many countries 83<br />
6.4 Different categories of rural inhabitants in Africa 86<br />
6.5 Benefits of a multiple-use approach to water 87<br />
310 World Water Development Report 3
PART<br />
List of boxes, figures, maps and tables<br />
6.6 Agricultural systems can be managed to produce one ecosystem function or a range of<br />
ecosystem services 91<br />
7.1 Sources of water use globally and for major sectors, 2000 100<br />
7.2 Future water demands in Mediterranean region countries for 2025 in Blue Plan business as usual scenario<br />
(trend scenario) 101<br />
7.3 Regional and global water supply coverage, by urban and rural areas, 1990 and 2006 103<br />
7.4 Regional and global sanitation coverage, by urban and rural areas, 1990 and 2006 103<br />
7.5 Gaps are large between farmer’s actual yields and achievable yields for major rainfed cereal crops 108<br />
7.6 As irrigation area expanded, food price fell for 30 years before starting to rise again 109<br />
7.7 Feed demand drives future demand for grains 109<br />
7.8 Industrial water productivity varies greatly across countries 116<br />
7.9 Interlinkages between energy and water 117<br />
7.10 Water consumption for various power generation technologies in the United States, 2006 118<br />
7.11 Renewable energy sources are expected to meet only a small part of total energy demand to 2030 119<br />
7.12 Global freshwater fish production has grown rapidly in recent decades 122<br />
7.13 Inland capture fisheries vary greatly by region, 2006 122<br />
8.1 Biodiversity in freshwater species has declined by half since 1970 129<br />
8.2 Effects of river fragmentation and flow regulation vary by region and biome type, 2005 130<br />
8.3 Groundwater use has grown rapidly in some countries 131<br />
8.4 Increasing frequency of harmful algal blooms in East China Sea associated with increasing<br />
fertilizer use 138<br />
8.5 Levels and types of wastewater treatment in OECD countries and selected European countries, 2006 142<br />
8.6 High level of wastewater reuse in water-stressed countries, various years 142<br />
8.7 The number of companies with a certified system of environmental management varied considerably by<br />
country in 2006 144<br />
9.1 Examples of hydrologic interactions in river basins – upstream-downstream impacts 152<br />
9.2 Three types of response to water scarcity and competition 154<br />
9.3 Importance of non-conventional sources of water for selected Middle East and Mediterranean region<br />
countries, 2000-06 155<br />
10.1 Distribution of global runoff to the oceans (exorheic) or internal receiving waters (endorheic) and the<br />
corresponding distribution of contemporary population served 170<br />
10.2 Impact of the Davis Dam on the Colorado River hydrograph 172<br />
10.3 Human activities are sources for dissolved inorganic nitrogen, organic nitrogen, inorganic phosphorus<br />
and organic phosphorus in coastal zones 174<br />
10.4 The spatial distribution of surface area and nitrogen inputs and removal by types of water bodies differ<br />
by latitude, most recent year available 176<br />
13.1 Data delivery rate from runoff gauging stations to the Global Runoff Data Centre (number of stations<br />
from which data have been received, 2001-07) 233<br />
14.1 Ecosystems and some of the services they provide 264<br />
Maps<br />
1.1 Fragile states as defined by the International Development Association 20<br />
2.1 Expected areas of population growth and decline, 2000-2080 30<br />
6.1 Diarrhoea deaths in 2004 89<br />
6.2 Geographical pattern of stunting in children under age five on a country basis 90<br />
6.3 Water stress level of major river basins, around 2002 92<br />
7.1 Water withdrawals highlight discrepancies between regions and between the largest and smallest<br />
consumers, around 2001 98<br />
7.2 Annual water withdrawals per person by country, world view, 2000 99<br />
7.3 Average national water footprint per capita, 1997-2001 102<br />
7.4 Relative importance of rainfed and irrigated agriculture 108<br />
7.5 Percentage of cultivated areas equipped for irrigation, around 2003 109<br />
7.6 World potential and current hydropower production, 2004 119<br />
7.7 Important waterways in the world, 2007 120<br />
8.1 Increasing water scarcity 128<br />
8.2 Restoration of the Mesopotamian Marshlands in Iraq, March 2003-December 2005 129<br />
8.3 Annual withdrawals of renewable groundwater sources and non-renewable fossil aquifers, most recent<br />
year available, 1995-2004 132<br />
8.4 Groundwater use for irrigation on a country basis, most recent year available, 1995-2005 133<br />
8.5 Groundwater use for drinking water on a country basis, most recent year available, 1995-2005 134<br />
Water in a changing world 311
PART<br />
List of boxes, figures, maps and tables<br />
8.6 Ecological footprints and biocapacity, 2000 137<br />
9.1 Difference between water withdrawn and water effectively used in Mediterranean region countries, all<br />
uses, 2000-05 157<br />
10.1 Contrasts between geophysical and human-dimension perspectives on water, most recent<br />
year available 169<br />
10.2 Global variations in the relationship between low flows and mean flows (percentage deviation of 1 in 10<br />
year low flows relative to mean flows measured over 1961-90) 171<br />
10.3 Impact of flood losses (comparative losses based on national GDP) 172<br />
10.4 Patterns of long-term average diffuse groundwater recharge, 1961-90 173<br />
10.5 Global groundwater recharge, most recent year available 174<br />
11.1 Trend in annual precipitation rate, 1901-2005 and 1979-2005 182<br />
11.2 Geographic distribution of the trend in the Palmer Drought Severity Index (PDSI) and annual variations<br />
in the globally averaged PDSI, 1900-2000 183<br />
11.3 Example of decline in lake abundance and total lake area in the discontinuous permafrost zone of<br />
western Siberia, 1973-97 191<br />
11.4 Circumpolar permafrost extent, 2000 192<br />
11.5 Changes in the duration of spring snowcover, 1978-2006 194<br />
11.6 Tien Shan, Akshiirak glacier massif 197<br />
11.7 Interplay of climate factors and net primary productivity 198<br />
13.1 Distribution of Global Runoff Data Centre streamflow gauges 232<br />
Tables<br />
1.1 Summary of scaling-up opportunities related to achieving the Millennium Development Goals in Africa 12<br />
1.2 Types of ecosystem services 14<br />
3.1 Return on investments in agricultural research and extension 47<br />
4.1 Laws addressing water rights and water management 53<br />
4.2 Laws addressing provision of water services 54<br />
4.3 Annual capital requirements for water supply and wastewater services and water financing gaps, by<br />
region, 2006-25 59<br />
4.4 Commitments of official development assistance from bilateral and multilateral agencies, 2004-06 64<br />
5.1 Economic impacts of flood and drought in Kenya, 1997-2000 71<br />
5.2 The three water scenarios of the World Business Council for Sustainable Development, to 2025 75<br />
6.1 Water and the characteristics of rural livelihoods 85<br />
6.2 Benefit-cost ratio by water and sanitation intervention in developing regions and Eurasia 88<br />
6.3 Major diseases attributable to environmental factors 89<br />
7.1 Water resources and withdrawals, 2000 99<br />
7.2 Different types of biofuel and quantity of water needed to produce them in rainfed or irrigated<br />
conditions 112<br />
7.3 Typology of climate change impacts on major agricultural systems 113<br />
7.3 Typology of climate change impacts on major agricultural systems (continued) 114<br />
7.4 Water use per tonne of product produced, selected industries 116<br />
7.5 Contribution of inland and marine fisheries to exports, daily animal protein supply and employment in<br />
major fish-harvesting economies, latest year available 121<br />
8.1 Comparison of point and non-point sources of water pollution 137<br />
10.1 Estimates of renewable water supplies, access to renewable supplies and population served by freshwater,<br />
2000 167<br />
10.2 Definitions of key components of the land-based hydrologic cycle and examples of their reconfiguration<br />
by humans 168<br />
10.2 Definitions of key components of the land-based hydrologic cycle and examples of their reconfiguration<br />
by humans (continued) 169<br />
10.3 Indicative range of uncertainty in recent assessments of renewable water supply, most recent year<br />
available 171<br />
10.4 Estimated mean residence times (storage to throughput) and stored water volumes of the main<br />
components of the Earth’s hydrosphere 173<br />
10.5 Principal symptoms of human-river system interactions and human pressures on water use 177<br />
11.1 Trends in annual maximum streamflow, by continent, for 195 stream gauging stations worldwide,<br />
various years 188<br />
11.2 Summary of key findings relative to trends in land surface water cycle components 203<br />
12.1 Examples of major floods and flooding worldwide, 1860-2008 215<br />
A1.1 List of United Nations World Water Development Report indicators and location of detailed data 299<br />
A2.1 Water-related goals and objectives of major conferences and forums, 1972-present 302<br />
312 World Water Development Report 3
Index<br />
A<br />
abiotic factors 219, 220<br />
absorptive capacity 46‐47<br />
access to water<br />
climate change 222<br />
corruption 55<br />
economic 80, 270<br />
education 38<br />
electricity 72<br />
finance 262<br />
groundwater 134<br />
health 88, 88‐89, 90, 271, 296<br />
income 84, 86, 87<br />
inequitable 296<br />
monitoring 103‐104<br />
poverty reduction 10‐11, 83, 84‐85<br />
renewable water 167, 170<br />
rights to 248<br />
sanitation 84, 85, 88, 96, 102‐103, 104<br />
solar energy 279<br />
accountability 241, 251‐255, 270, 292<br />
adaptation<br />
climate change 18‐19, 68, 69, 71, 73‐74,<br />
113‐114, 222, 251<br />
collaborative learning processes 277<br />
innovative 259<br />
integrated 295<br />
investments 72<br />
technology 46‐47<br />
uncertainty 282<br />
aerosols 184<br />
Africa<br />
climate change 19, 73<br />
hydrologic data 229<br />
investment 11<br />
knowledge networks 258<br />
poverty 10, 11, 86<br />
sanitation 60, 104<br />
sustainable development 7<br />
age distribution 29, 30, 31, 32<br />
agriculture<br />
biogeochemical cycles 175<br />
charging for water 62<br />
conflicts 152<br />
economic development 80, 81‐82<br />
ecosystems 91, 92‐93, 129<br />
education 272‐273<br />
food prices 34<br />
green revolution 44, 217<br />
groundwater 132‐133, 135‐136<br />
pollution 144<br />
poverty reduction 85<br />
research and development 47<br />
sediment 220<br />
soil erosion 218<br />
subsidized energy 117<br />
technological innovation 41<br />
trade 35<br />
wastewater 142<br />
water use 16, 21, 96, 97, 98, 99, 106‐115,<br />
232‐233<br />
win‐win scenarios 276‐278<br />
see also rural areas<br />
aid 17, 64, 260, 282, 296<br />
Alaska 193<br />
algal blooms 138, 211, 219<br />
allocation of water 52, 92, 115, 150, 154, 157,<br />
244‐245, 284<br />
see also reallocation<br />
alluvial aquifers 223<br />
Altai glaciers 196‐197<br />
Anatolia, Turkey 281<br />
Andes 196<br />
animal feed 109, 110<br />
aquaculture 121‐123, 143<br />
aquatic systems 91, 176, 177, 227<br />
aquifers 131‐132, 134, 135, 136, 188, 189‐190,<br />
221‐222, 223<br />
see also groundwater<br />
arctic regions 212<br />
arid tropics 113<br />
arsenic 139, 177<br />
Arwari River, India 251‐254<br />
Asia 82, 84, 136, 145, 157, 245<br />
Asian Water Development Outlook 2007 7<br />
atmospheric links 166, 173‐174<br />
augmentation, supply 154<br />
Australia 51, 52, 157, 216, 285, 286<br />
awareness 35‐36, 105, 222, 251, 258‐259, 285, 286<br />
B<br />
Balkans 140<br />
Baltic Sea 138<br />
Ban Ki‐moon 19, 20, 275<br />
behavioural changes 286<br />
benefits of water 80‐95<br />
bilateral aid 17, 64<br />
biocapacity 136, 137<br />
biodiversity 129, 219‐220, 259, 288<br />
bioenergy 16, 34, 44‐45, 47, 72, 96, 106,<br />
110‐112<br />
biogas 244<br />
biogeochemical cycles 173‐178<br />
biotechnology 43‐44<br />
biotic factors 220<br />
Blue Plan, Mediterranean 101<br />
blue water 107, 168<br />
Bolivia 246<br />
Brazil 247, 248‐249<br />
C<br />
Cambodia 259<br />
Canada 187, 193, 195, 276, 277<br />
capacity<br />
bio‐ 136, 137<br />
development 241, 255‐259, 291, 292<br />
environmental sustainability 127<br />
observation systems 229<br />
technology adsorption 46‐47<br />
water management investment 57‐60<br />
capital 14, 57, 65<br />
Cap‐Net 257<br />
carbon cycle 181, 197‐201<br />
carbon dioxide 44, 45<br />
CEO Water Mandate 274‐275<br />
certification 144<br />
charging strategies 61‐62, 127‐128, 145<br />
see also pricing strategies<br />
chemical waste 211<br />
chief executives 274‐275, 293<br />
children 88<br />
China 7‐8, 10, 36, 39, 61, 218, 272‐273<br />
Çıralı, Turkey 280<br />
circumpolar permafrost 192, 194<br />
civil society 4, 248, 256, 270-271<br />
climate change<br />
agriculture 106, 112<br />
bioenergy 111‐112<br />
diversification 272<br />
energy 117<br />
future 68‐76<br />
glaciers 196<br />
governance reform 250‐251<br />
groundwater 171, 189<br />
hazards 211‐223<br />
human security 280<br />
hydrological cycle 201, 202‐203<br />
migration 32<br />
payments for ecosystem services 288<br />
permafrost 193<br />
risk and uncertainty 284‐285, 295‐296<br />
runoff 82, 113‐114, 213<br />
sustainable development 14, 18‐19<br />
water use 96, 101<br />
cloud cover 184, 185<br />
coalitions 6<br />
coastal areas 30, 117, 120, 175, 176<br />
Coca‐Cola 274, 275<br />
collaboration 276, 277, 285, 292<br />
Colombia 255<br />
Colorado River, US 172<br />
commercialization 249<br />
communication 235, 254, 256‐257, 258<br />
communities of practice 257<br />
community level 55, 105‐106, 248, 279‐280,<br />
282, 293<br />
see also local level<br />
competition 21, 51, 134‐135, 150‐159<br />
conflicts 19‐20, 32, 51, 127, 151‐152, 190<br />
conservation 154, 218<br />
consultation 275‐276, 277, 292<br />
consumption<br />
climate change 71‐72<br />
ecological footprints 136, 137<br />
energy 118<br />
fertilizer 144<br />
fish 121‐122<br />
social drivers 39<br />
water footprints 101<br />
water use 98<br />
conversation arenas 75<br />
cooling processes 16, 98, 118<br />
cooperation 220‐222, 234, 235, 269, 271,<br />
275‐285, 295<br />
coordination 247‐248, 271<br />
corporate water footprints 35‐36<br />
corruption 55‐56, 251, 254‐255, 280<br />
costs<br />
access to water 88‐89<br />
adaptation 71, 73<br />
charging for water 61‐62<br />
disasters 8<br />
energy 33‐35<br />
environmental 9<br />
extreme events 214, 215, 216<br />
infrastructure 57‐58, 58‐60<br />
lack of investment 82<br />
nanotechnology 45<br />
pollution 140<br />
recovery 61, 65, 66<br />
service provision 3<br />
supply augmentation 154‐155<br />
water management 56‐57<br />
crises 3, 13, 14‐20<br />
Water in a changing world 313
Index<br />
crisis prevention 280‐288<br />
crop production 106‐107, 111‐113<br />
cross‐subsidization 62<br />
cultivated areas 109<br />
culture 38‐39<br />
customary aspects 50, 54, 56, 250<br />
see also traditional aspects<br />
cyanobacteria 138, 211, 219<br />
Czech Republic 216<br />
D<br />
dairy products 39, 109, 110<br />
Dalian water supply project, China 61<br />
damage costs 8‐9<br />
dams 59, 129‐130, 151, 152‐153, 171, 172, 190,<br />
219<br />
see also reservoirs; storage<br />
Danube 286<br />
data 226‐236, 260‐262, 294<br />
Davis Dam, US 172<br />
decentralization 51, 65, 104‐105, 246, 270‐271,<br />
285, 293<br />
decision‐making<br />
climate change 74, 75, 203<br />
decentralization 269, 270‐271<br />
environmental impacts 273‐274<br />
informed 258<br />
institutional 246<br />
integrated 292‐293<br />
participation 275‐276, 277<br />
risk and uncertainty 295‐296<br />
sustainable development 3‐23<br />
trade‐offs 291, 294<br />
decommissioning costs 59<br />
deltas 113, 153<br />
demand<br />
agriculture 108‐110, 111‐112<br />
competition management 154‐158<br />
energy 15, 43<br />
finance 60<br />
groundwater 131‐134<br />
industrial 116<br />
population 29<br />
sanitation 105, 106<br />
technological innovation 42<br />
water use 98<br />
demographic level 14‐15, 29‐32, 37, 69‐70<br />
desalinization 16, 41‐42, 45, 155<br />
desertification 218<br />
deserts 211<br />
developed countries<br />
charging for water 61<br />
extreme events 211, 214<br />
pollution 177‐178<br />
priorities 295<br />
private water operators 63<br />
research and development 42<br />
sewage treatment 141<br />
technological innovation 45, 46, 72<br />
water use 101<br />
developing countries<br />
access to water 88<br />
adaptation 18<br />
charging for water 61‐62<br />
climate change 70, 73, 284<br />
consumption patterns 39<br />
diseases 13<br />
economy 70<br />
ecosystem services 92<br />
energy use 119<br />
extreme events 211, 214<br />
finance 17, 73<br />
fisheries 122, 123<br />
food prices 110<br />
hydrologic data 227<br />
investment 9‐10<br />
national frameworks 51<br />
networks 203‐204, 228, 285<br />
pollution 177<br />
population 30‐31<br />
priorities 295<br />
private water operators 62, 63<br />
public utilities 105<br />
research and development 42, 260<br />
sewage treatment 141<br />
streamflow 186<br />
technological innovation 41, 45, 46, 47, 72<br />
wastewater 143<br />
development<br />
economic 21, 74, 80‐83, 80‐84, 96, 136, 291,<br />
295‐296<br />
global crises 14<br />
institutional 241, 245‐250, 255‐256, 259, 292<br />
planning 286‐287, 293<br />
rural 282<br />
sustainable 3‐23, 36, 68, 288<br />
dialogue 136, 295<br />
diarrhoeal diseases 89‐90<br />
diet 14, 36, 39, 121, 122<br />
diffuse groundwater recharge 173<br />
diffusion of technology 41, 45‐47<br />
disasters 8, 70‐71, 280‐282, 284<br />
see also extreme events<br />
disbursement delays 60‐61<br />
diseases 13, 37, 70, 88, 89‐90, 104, 140, 143, 273<br />
displaced people 32, 283<br />
dissolved materials 173‐174, 200, 201<br />
distributional aspects 21, 166, 170<br />
diversification 271‐272<br />
domestic level 63, 96, 102‐106<br />
see also household level<br />
Dominican Republic 279<br />
donor community 291<br />
downscaling 203<br />
downstream impacts 153<br />
drafting laws 54, 250<br />
drinking water<br />
access to 84<br />
education 38<br />
groundwater 134<br />
health 88<br />
infrastructure costs 59<br />
investment 8<br />
MDGs 11, 102<br />
pollution 139<br />
safe 104, 259<br />
drivers 21<br />
droughts 71, 183‐184, 188, 211, 214‐217<br />
E<br />
earthquakes 219<br />
East China Sea 138<br />
Eastern Europe 141<br />
ecohealth approach 273<br />
ecological footprints 136, 137<br />
economic level<br />
demand management 156<br />
development 21, 74, 80‐84, 96, 136, 291, 295<br />
drivers 32‐36<br />
environmental goods and services 262‐263<br />
extreme events 214, 215<br />
fisheries 121<br />
groundwater 131‐134, 134‐135, 217<br />
growth 6‐7, 10, 14, 70‐71, 273‐274<br />
investment 7‐9<br />
livelihoods 259<br />
macro‐ policies 271‐272<br />
pollution 141<br />
regional development 280, 281<br />
technological innovation 41<br />
water use 101<br />
ecosystems<br />
pressures on 150‐159<br />
protection 21<br />
restoration costs 9<br />
services 14, 91‐93, 127‐129, 130, 177, 288<br />
temperature and productivity 219<br />
ecotourism 279‐280<br />
Ecuador 253, 288<br />
education 32, 37‐38, 88, 258‐259, 272‐273, 286<br />
efficiency<br />
agriculture 106, 115<br />
charging for water 62<br />
competition management 154, 157<br />
education 37<br />
finance 61<br />
integrated water resources management 243<br />
technological innovation 41, 260<br />
water saving 274<br />
water use 116, 118, 212<br />
Ethiopia 261<br />
electricity 43, 72, 117, 118, 119, 279<br />
electrification 127, 279<br />
emerging market economies<br />
economic growth 32, 36, 58<br />
finance 63, 64‐65<br />
pollution 136, 143<br />
social change 71‐72<br />
water use 96, 101<br />
Emilia‐Romagna Region, Italy 254, 258‐259<br />
employment 121, 272‐273<br />
empowerment 38, 53‐54, 274<br />
end‐of‐pipe technologies 143‐144<br />
endorheic zones 170<br />
energy 15‐16, 18, 33‐35, 42‐43, 96, 115‐120, 279<br />
see also bioenergy; hydropower<br />
enforcement 49, 50, 56, 142<br />
engineered systems 171, 214<br />
environmental level<br />
allocation systems 52<br />
bioenergy 45<br />
certification 144<br />
degradation costs 9<br />
diseases 89<br />
economic decisions 273‐274<br />
ecosystem services 91‐93<br />
footprints 39<br />
governance 271<br />
green revolution impacts 44<br />
impact assessments 284‐285<br />
migration 32<br />
monitoring 43<br />
payment for goods and services 65‐66,<br />
262‐263, 292<br />
research and development 42<br />
services 120<br />
sustainability 12‐14, 37, 127, 134‐135, 145‐146<br />
technological innovation 41, 47<br />
urbanization 31<br />
water use 127‐149<br />
equity 157, 292<br />
erosion 175, 218<br />
ethanol 111, 112<br />
eThekwini Declaration 2008 60, 104<br />
Ethiopia 70, 274<br />
Eurasia 88, 195<br />
Europe 141, 142, 146, 187, 194, 216<br />
European Union Water Framework Directive<br />
50, 132, 247<br />
eutrophication 138, 144, 175‐176, 220<br />
evaporation 97, 116‐117, 167, 175, 184‐185, 190,<br />
202, 204<br />
evapotranspiration 106, 107, 112, 152, 156, 167,<br />
184‐185, 189, 197, 202, 204, 222<br />
evolution of water use 96‐126<br />
exorheic zones 170<br />
exports 35, 46, 102, 121, 271<br />
external aid 64<br />
external drivers 21, 269‐270, 296<br />
external water footprints 101‐102<br />
extreme events 21, 70, 71, 184, 211, 213‐217<br />
see also disasters<br />
F<br />
female literacy 37<br />
fertility 32, 37<br />
fertilizers 138, 144<br />
filtration 45<br />
finance<br />
climate change 72‐73<br />
crises 17<br />
economic development 295<br />
hydrologic networks 235<br />
investment 292<br />
the missing link 56‐66<br />
observation networks 228<br />
options 49<br />
pollution and mitigation 145<br />
poverty reduction 85<br />
response options 262‐263<br />
sustainable 57, 66, 286‐287, 291, 292<br />
see also investment<br />
fires 200<br />
fisheries 121‐123, 143, 153<br />
floods 70, 71, 171, 172, 186, 187, 211, 213‐214<br />
flows<br />
environmental 145‐146<br />
rivers 130, 170‐171, 214‐217<br />
fluvial system filters 174, 176<br />
food<br />
bioenergy 44‐45, 72<br />
diet 14, 36, 39, 121, 122<br />
global crisis 14, 33‐35<br />
population 108, 109<br />
prices 16, 21, 33, 34, 47, 106, 108, 109, 110<br />
security 16‐17, 33, 110, 123<br />
water use 107<br />
forecasts 74, 227, 231, 233, 234<br />
formal water rights 52<br />
forums 254<br />
fossil fuels 43, 120<br />
fragile states 19‐20, 81<br />
see also vulnerability<br />
314 World Water Development Report 3
Index<br />
fragmentation 247‐248<br />
France 97<br />
freshwater<br />
agriculture 16, 111, 112, 114, 115<br />
biodiversity 129<br />
development 83<br />
drivers 29‐39<br />
ecosystems 92, 120<br />
fisheries 123<br />
glaciers 196<br />
lakes 190<br />
quality 138, 139, 230<br />
trends 100‐102<br />
water cycle 166‐177<br />
withdrawals 96, 97, 98, 100, 106<br />
see also aquifers; groundwater<br />
front‐end tools 235<br />
fuel costs 33‐35<br />
future aspects 68‐76, 135‐136, 202‐203<br />
G<br />
G‐8 Evian Water Action Plan 2009 296<br />
Ganges River 39<br />
GDP see gross domestic product<br />
gender 38, 292<br />
general circulation models 203<br />
genetically modified organisms 44<br />
GEO4 see Global Environment Outlook 2007<br />
Germany 187<br />
glaciers 196‐197, 198, 204, 213, 216<br />
Global Environment Outlook 2007 (GEO4) 75<br />
globalization 33, 36, 96, 102<br />
global level<br />
bioenergy 111<br />
biogeochemical cycles 173‐178<br />
climate change 212<br />
crises 3, 14‐20<br />
ecological footprints 137<br />
economic growth 32<br />
ecosystem degradation 130<br />
energy 43<br />
extreme events 214, 215<br />
fisheries 122<br />
food crises 33‐35<br />
freshwater 230<br />
groundwater 132, 134, 174<br />
river flow 171<br />
runoff 170, 233<br />
sanitation 103<br />
sharing data 226, 227<br />
soil erosion 218<br />
water cycle 166‐167, 181‐210<br />
water scarcity 128<br />
water use 97‐102, 232‐233, 235<br />
waterways 120<br />
Global Monitoring Report 2005 10‐11<br />
global warming 21, 70, 181, 211, 216, 295<br />
GNP see gross national product<br />
governance 51, 55, 72‐73, 241, 242‐251, 270‐271<br />
government level 4, 6, 21, 47, 63<br />
grasslands 211‐212<br />
grass‐roots water federations 253<br />
gravimetric measurements 185, 186, 234<br />
Great Lakes, North America 251, 252<br />
greenhouse gases 72, 112, 117<br />
green revolution 44, 217<br />
green water 106‐107, 168, 263, 287<br />
gross domestic product (GDP)<br />
climate change 70, 71<br />
disaster costs 8<br />
diversification 271<br />
energy security 34<br />
flooding 172<br />
groundwater 134<br />
investment 82‐83<br />
technological innovation 46<br />
variability 171<br />
water management 296<br />
gross national product (GNP) 82<br />
groundwater<br />
buffer functions 211, 217, 223<br />
cross‐impacts 151<br />
energy 16, 279<br />
global resources 174<br />
hydrologic data 227<br />
observation 229‐230<br />
pollution 139, 177<br />
recharge 135, 173, 189‐190, 217, 223<br />
sustainable management 131‐136<br />
terrestrial carbon 201<br />
transboundary 221‐222<br />
trends 188‐190, 204<br />
variability 171‐172<br />
water use 99‐100<br />
see also aquifers<br />
groundwater‐dependent economies 127, 131<br />
growing seasons 200, 220, 222<br />
Guaraní aquifer 221<br />
Guayaquil, Ecuador 288<br />
H<br />
hand‐washing 90<br />
hazards 211‐225<br />
health<br />
climate change 73<br />
microbial pollution 138<br />
policy 272‐273<br />
pollution 139, 140, 177<br />
poverty reduction 87, 296<br />
wastewater 143<br />
water relationships 88‐90<br />
heat waves 184, 216<br />
heavy metals 45, 139, 143<br />
High‐Level Conference on World Food Security<br />
2008 16, 34<br />
High‐Level Event on the Millennium<br />
Development Goals 2008 13, 14<br />
Himalayan region 213<br />
Hinduism 39<br />
HIV/AIDS 273<br />
holistic approaches 9, 74, 244<br />
Honduras 249<br />
household level<br />
fisheries 121<br />
investment 60, 277‐278<br />
micro‐hydro plants 72<br />
poverty reduction 84, 86‐87<br />
sanitation 104, 105<br />
water‐saving technologies 41<br />
see also domestic level<br />
Human Development Report 2006 10, 83‐84, 104<br />
human level<br />
biogeochemical cycles 174‐176<br />
capacities 255‐256, 292<br />
development 84<br />
dimension perspectives 169<br />
security 280‐282<br />
technological innovation 41, 42<br />
humid tropics 113<br />
hydrologic cycle 21, 166‐172, 181‐210<br />
hydrologic data 226‐236<br />
hydropower<br />
conflicts 152‐153<br />
cross‐subsidization 62<br />
energy 16, 34, 72, 118‐119, 119‐120<br />
future development 43<br />
water use 98<br />
hygiene 90, 105, 143<br />
I<br />
ice 193, 220<br />
ICT see information and communications<br />
technology<br />
IMF see International Monetary Fund<br />
imports 35<br />
income<br />
access to water 84, 86, 87<br />
charging for water 61<br />
education 272‐273<br />
energy use 119<br />
food prices 33, 110<br />
global crises 14<br />
human development 84<br />
investment 277‐278<br />
pollution 140‐143<br />
priorities 295<br />
rural and urban 85<br />
technology 46<br />
see also poverty<br />
India 10, 152, 213, 251‐254, 255, 257‐258, 275, 278<br />
indicators 88, 90, 98, 104, 167<br />
individual level 98, 99, 293<br />
Indonesia 115<br />
Indus River basin 153<br />
industrialized countries 57, 82<br />
see also developed countries<br />
industry<br />
agriculture conflicts 152<br />
demand management 157<br />
pollution control 143‐144<br />
water use 41, 96, 97, 98, 99, 115‐120<br />
inequality 33, 84, 98<br />
inequity 61‐62, 296<br />
informal sector 31, 37, 52, 63, 84‐85, 103‐104,<br />
105, 249<br />
information<br />
climate change 73, 203<br />
decision‐making 296<br />
groundwater 132, 135, 229‐230<br />
needs 15, 17‐18, 260‐262<br />
networks 231, 256‐258<br />
observational gap 226‐236<br />
pollution 127, 136<br />
sharing 256‐258, 292, 293‐294<br />
wastewater 233<br />
information and communications technology<br />
(ICT) 43<br />
informed decisions 296<br />
infrastructure<br />
corruption 254<br />
costs 57‐58, 58‐60<br />
development 81<br />
government finance 63<br />
international support 296<br />
investment 7, 8, 9, 17, 82‐83, 242, 259, 291,<br />
292<br />
post‐conflict 20<br />
technological innovation 46<br />
inland water resources 91, 121, 122, 176<br />
innovation 41‐48, 241, 259‐260, 292<br />
in‐situ observations 186, 203, 230, 233, 235<br />
institutional level<br />
allocation 284<br />
collaborative initiatives 276<br />
development 241, 245‐250, 255‐256, 259,<br />
292<br />
international waters 283, 284<br />
macroeconomic policies 271<br />
in‐stream water uses 120‐123<br />
insurance 284, 285<br />
integrated approaches<br />
climate change 74, 295<br />
crisis recovery 283<br />
decision‐making 269<br />
hydrologic information 233, 235<br />
institutions 247‐248<br />
multiple‐use initiatives 278<br />
observation networks 228, 231<br />
planning 242‐245, 286‐287, 292‐293, 295<br />
risk and adaptation 295<br />
rural development 277, 278<br />
waste management 143<br />
water resources management 4, 53, 242, 243<br />
water saving strategies 274<br />
watersheds 51<br />
Integrated Watershed Management Network<br />
(IWMNET) 258<br />
intensification 107, 201‐202<br />
interconnectedness 150‐151<br />
Intergovernmental Panel on Climate Change<br />
(IPCC) 19, 70, 131, 182, 184, 201, 202, 212‐213<br />
internal water footprints 101‐102<br />
International Joint Commission 251, 252<br />
international level<br />
conflicts 154<br />
cooperation 220‐222<br />
environmental sustainability 146<br />
finance 287<br />
institutions 283<br />
policy and laws 50‐51<br />
support 269, 293, 296<br />
trade 32, 35‐36<br />
International Monetary Fund (IMF) 17<br />
International Organization for Standardization<br />
(ISO) 144<br />
Internet‐based resources 256, 258<br />
invasive species 33<br />
investment<br />
adaptation 72<br />
capacity 57‐60<br />
climate change 70, 71<br />
corruption 254<br />
data‐gathering 294<br />
decision‐making 292‐293<br />
development 20<br />
groundwater 131, 136<br />
hydrologic observations 229, 230<br />
hydropower 119<br />
infrastructure 7, 8, 9, 17, 82‐83, 242, 259,<br />
291, 292<br />
monitoring 226<br />
need for 296<br />
pollution 140, 144<br />
Water in a changing world 315
Index<br />
poverty 37, 277‐278<br />
research and development 42, 47<br />
sanitation 84<br />
technological innovation 259<br />
wastewater 143<br />
water 7‐9, 9‐14, 17, 82‐83<br />
see also finance<br />
IPCC see Intergovernmental Panel on Climate<br />
Change<br />
Iraq 129<br />
irrigation<br />
agriculture 114, 115<br />
agro‐ecosystems 92‐93<br />
bioenergy 111, 112<br />
charging for water 62<br />
customary rights 250<br />
groundwater 132‐133, 189, 217<br />
losses 156‐157<br />
management transfer 55<br />
multiple‐use initiatives 278<br />
participatory 251, 253‐254<br />
poverty reduction 85<br />
technological innovation 260<br />
wastewater 143<br />
water use 107, 108, 109<br />
ISO see International Organization for<br />
Standardization<br />
Italy 254, 258‐259<br />
IWMNET see Integrated Watershed<br />
Management Network<br />
J<br />
Japan 219<br />
Jhabua District, Madhya Pradesh, India 278<br />
Joint Monitoring Programme 2000 103, 104<br />
Jordan River basin 151<br />
K<br />
Kafue Flats, Zambia 259<br />
Kala Dera, India 274, 275<br />
Kenya 71, 249‐250, 261, 263, 273<br />
Ki‐moon, Ban see Ban Ki‐moon<br />
knowledge 256‐258, 262, 275‐285, 292<br />
see also information<br />
L<br />
lakes 138, 190‐191, 200, 204, 220, 223, 251,<br />
252, 261<br />
land<br />
links 173‐174<br />
redistribution policies 283<br />
surface water cycle 181‐210<br />
tenure 85<br />
use planning 214<br />
zoning 134, 145<br />
land‐based hydrologic cycle 166‐172<br />
landslides 219<br />
latimetry observations 234<br />
leadership 21, 291, 293, 296<br />
leakage 58, 156<br />
learning processes 256, 257‐258, 281<br />
legal level 49‐56, 72‐73, 146, 156, 222, 249‐250,<br />
262, 292<br />
legitimacy 49, 56<br />
Lesotho 255<br />
lifestyle changes 14, 36‐37, 39, 71‐72<br />
literacy 37<br />
Living Plant Index 129<br />
local level<br />
action 293<br />
conflicts 151<br />
data‐gathering 294<br />
finance 57, 65<br />
governance 105, 271<br />
investment 9<br />
rights 52<br />
sediment 219<br />
trade 35<br />
see also community level<br />
longitudinal linkages 220<br />
long‐term aspects 74, 140, 174, 183, 195, 294‐295<br />
M<br />
macroeconomic policies 271‐272<br />
mainstreaming 38, 234‐235<br />
malaria 90, 273<br />
Malaysia 249<br />
malnutrition 14, 90<br />
management<br />
accountability 251‐255<br />
competition 154‐158<br />
cooperative 275‐276<br />
delivery contrast 51<br />
groundwater 135‐136<br />
integrated 292‐293<br />
land‐based hydrologic cycle 168‐169<br />
subsectoral level 4<br />
marginal‐quality water 155<br />
marshlands 283<br />
Mauritius 272<br />
MDGs see Millennium Development Goals<br />
meat production 109<br />
Mediterranean region 101, 113, 116‐117, 155,<br />
156, 157, 212<br />
Mekong River basin 153<br />
melt‐water 193<br />
Mesopotamian marshlands, Iraq 129, 283<br />
meta‐information systems 235<br />
methane 200<br />
Mexico 243, 284<br />
microbial pollution 138<br />
microfinance 65<br />
micro‐hydro plants 72<br />
micro‐irrigation 156‐157<br />
micro‐organisms 44<br />
microwave technology 234<br />
Middle East 154, 155<br />
middle‐income countries 33<br />
migration 30, 31‐32, 70, 282<br />
Millennium Development Goals (MDGs)<br />
achieving 3<br />
corruption 55, 56<br />
domestic water 96<br />
drinking water 102<br />
health 88<br />
investment 11‐12, 13<br />
partnerships 6<br />
poverty reduction 10, 11<br />
sanitation 59, 244<br />
mining activities 139, 140<br />
mismanagement 254‐255<br />
see also corruption<br />
mitigation<br />
climate change 19, 68, 69, 111‐112<br />
disasters 282<br />
hazards 220‐221, 222<br />
policy 295<br />
pollution 127, 139‐145<br />
technological innovation 72‐73<br />
modelling<br />
groundwater recharge 190<br />
hydrologic data 203, 226‐227, 235<br />
monitoring networks 261<br />
soil moisture 185, 186<br />
water quality 176<br />
Mondi South Africa 274, 275<br />
monitoring<br />
groundwater 135<br />
information 43, 261‐262<br />
nanotechnology 45<br />
networks 21, 226‐236, 285<br />
performance 256<br />
pollution 136, 146<br />
supply and sanitation 103‐104<br />
water quality 127, 174<br />
mortality 13, 87, 88, 89, 90, 215<br />
mountains 170, 212<br />
multipurpose water schemes 291<br />
multidecadal variability 182‐183, 187<br />
multilateral aid 17, 64<br />
multilateral treaties 154<br />
multinational agreements 228<br />
multiplatform information 228, 234, 235<br />
multiple objectives 280, 281<br />
multiple‐use approaches 86‐87, 115, 278, 294<br />
multisectoral approaches 7<br />
multistakeholder processes 12, 53<br />
N<br />
nanotechnology 45<br />
national level<br />
capacity assessment 256<br />
climate change 251<br />
conflicts 151<br />
development plans 293<br />
environmental sustainability 145‐146<br />
finance 57, 65<br />
fisheries 121<br />
hydrologic information 230, 233<br />
industrial water productivity 116<br />
integrated approaches 242, 286‐287<br />
law 50<br />
observation networks 231, 235<br />
policy 51‐52, 111<br />
poverty reduction 10<br />
security 280<br />
sharing data 226<br />
wastewater treatment 142<br />
water footprints 102<br />
water saving strategies 274<br />
water use 98, 99<br />
nation‐building 81<br />
navigation 120‐121<br />
Near East 112<br />
negative population growth 30<br />
Nepal 72, 278, 282<br />
The Netherlands 245<br />
net primary productivity 199‐200<br />
networks 21, 203‐204, 226‐236, 257‐258, 261,<br />
285<br />
New York City, US 128, 263<br />
NGOs see non‐governmental organizations<br />
nitrates 139, 144<br />
nitrogen 175, 176<br />
non‐conventional sources 154, 155<br />
non‐governmental organizations (NGOs)<br />
54‐55, 158<br />
non‐integrated approaches 243<br />
non‐point source pollution 136, 137, 139,<br />
144‐145, 178<br />
non‐water sectoral interventions 269‐270<br />
no‐regrets 296<br />
North America 194, 195, 251, 252<br />
Northern Hemisphere 192, 193, 194, 195, 213<br />
nuclear energy 43<br />
nutrients 138‐139, 144, 173, 175‐176, 219, 220<br />
O<br />
observation networks 21, 226‐236<br />
see also monitoring<br />
ocean links 173‐174<br />
off‐farm employment 272‐273<br />
official development assistance 64, 65, 262, 296<br />
off‐stream uses 96, 97‐98, 99<br />
oil prices 15‐16, 65, 119‐120<br />
online information systems 235, 257<br />
on‐stream uses 96, 98<br />
operational data 228‐234<br />
operation and maintenance 57‐58, 235<br />
organic materials 138<br />
Orissa, India 152<br />
oxygenation 220<br />
P<br />
Pakistan 90, 141, 142<br />
Palmer Drought Severity Index (PDSI) 183‐184,<br />
186, 216<br />
Pamir glaciers 196‐197<br />
pan evaporation 184, 185, 202<br />
participation<br />
consultation 275‐276, 277<br />
decision‐making 6, 270, 292<br />
demand management 274<br />
institutional 246<br />
policy 49<br />
water management 53‐54, 251‐255, 256<br />
particulate materials 173‐174, 200‐201<br />
partnerships 4, 6, 12, 248‐249, 257, 293<br />
pastoralists 31‐32<br />
payments for goods and services 65‐66,<br />
262‐263, 288, 292<br />
PDSI see Palmer Drought Severity Index<br />
peace and security 19<br />
perceptions 36, 38, 106<br />
performance monitoring 256<br />
permafrost 190‐191, 192‐194, 200, 201, 204<br />
Peru 93<br />
pesticides 144<br />
philanthropic assistance 64, 296<br />
phosphorous 175, 220<br />
planning<br />
accountability 251‐255<br />
incremental changes 241<br />
integrated 242‐245, 286‐287, 292‐293, 294<br />
land use 214<br />
316 World Water Development Report 3
Index<br />
river basin 53<br />
strategic financial 61<br />
point source pollution 136, 137, 139<br />
policy<br />
bioenergy 34<br />
climate change 72‐73, 251<br />
data‐sharing 231<br />
decision‐making 296<br />
external 269<br />
governance reform 242‐251<br />
groundwater 136<br />
health 272‐273<br />
incremental changes 241<br />
land redistribution 283<br />
law 249‐250<br />
macroeconomic 271‐272<br />
mitigation and adaptation 295<br />
technology adsorption 47<br />
water use 49‐56<br />
‘polluter pays’ principle 62, 128, 140, 145<br />
pollution<br />
charges 62<br />
corruption 56<br />
laws 53<br />
micro‐organisms 44<br />
mitigation 127, 139‐145, 146<br />
prints 36<br />
water quality 136‐139<br />
water supply constraints 177‐178<br />
see also quality, water; wastewater<br />
population<br />
biogeochemical cycles 175<br />
education 38<br />
food production 108, 109<br />
global runoff 170<br />
pressures 14, 29, 30‐31<br />
renewable water 167<br />
snowmelt 194‐195<br />
soil erosion 218<br />
water use 98, 101<br />
Potters for Peace, Cambodia 259<br />
poverty<br />
access to water 3, 10‐11, 83‐87<br />
charging for water 61‐62<br />
corruption 55<br />
disaster costs 8<br />
food prices 110<br />
globalization 33<br />
health 87, 296<br />
investment 277‐278<br />
priorities 295<br />
rural electrification 279<br />
social drivers 37<br />
sub‐Saharan Africa 11<br />
see also income<br />
power generation technologies 118<br />
precipitation<br />
climate change 112, 213<br />
extreme events 216<br />
freshwater 166‐167<br />
glaciers 196, 197<br />
groundwater 190<br />
landslides 219<br />
net primary productivity 199, 200<br />
satellite data 234<br />
sediment 220<br />
temperature 213‐214<br />
trends 181‐184, 201, 202, 204<br />
precision agriculture 133, 135‐136<br />
prices<br />
allocation of water 157<br />
demand management 157<br />
electricity 279<br />
energy 15‐16, 117‐118<br />
food 16, 21, 33, 44‐45, 47, 106, 108, 109, 110<br />
fuel 15‐16, 33‐35, 65, 119‐120<br />
poverty 37<br />
pricing strategies 9, 61‐62, 262, 274<br />
see also charging strategies<br />
private sector 60, 62‐63, 105, 133‐134, 248, 249,<br />
274‐275<br />
productivity 116, 199‐200, 219<br />
professional knowledge 256‐258<br />
public level 10, 63, 105, 249, 251‐255,<br />
258‐259, 288<br />
public‐private partnerships 6, 248, 249<br />
pumps 127, 131, 133, 217, 279<br />
Q<br />
quality, water<br />
basin closure 151<br />
biogeochemical cycles 173, 174, 177<br />
climate change 219<br />
demographic drivers 29<br />
drinking water 103<br />
industry 116<br />
marginal 155<br />
monitoring 127, 230, 261<br />
observation networks 227<br />
public participation 252<br />
rights 53<br />
risks 136‐139<br />
Québec, Canada 276, 277<br />
R<br />
radiation 184‐185<br />
rainfall 70, 284, 285<br />
see also precipitation<br />
rainfed agriculture 106, 107, 108, 112<br />
reallocation 154, 155, 157, 242, 243‐244<br />
see also allocation of water<br />
recession, economic 141<br />
recession, glaciers 196‐197, 198<br />
recurrent costs 57<br />
recycling 211<br />
reference crop evaporation 185<br />
refugees 31, 283<br />
regional level<br />
cooperation 284<br />
economic development 280, 281<br />
evaporation 185<br />
fisheries 122<br />
hazards 211‐213<br />
hydrologic data 232, 235<br />
networks 257<br />
policy and laws 50‐51<br />
public awareness 258‐259<br />
radiation 184‐185<br />
river effects 130<br />
sanitation 103<br />
service costs 59<br />
sharing data 226<br />
snow cover 195<br />
streamflow 216<br />
trade 35<br />
water crises 13<br />
water use 99<br />
water withdrawals 98<br />
regulations<br />
demand management 156, 157<br />
environmental technology 42<br />
groundwater 135<br />
policy and law 52‐53, 56<br />
pollution mitigation 146<br />
river flow 130, 171<br />
technology adsorption 46, 47<br />
trade‐offs 294<br />
rehabilitation 20, 59, 283<br />
religious belief 38‐39<br />
remote sensing 18, 185, 186, 230, 235<br />
see also satellite data<br />
renewable energy 42‐43, 119, 279, 280<br />
see also hydropower<br />
renewable water 167‐172, 223<br />
Republic of Korea 64<br />
reputation 274, 275<br />
research 42, 47, 241, 257, 259‐260<br />
reservoirs<br />
ecosystem degradation 129, 130<br />
evaporation 116‐117, 175<br />
sediment 72, 218, 220<br />
trends 190, 204<br />
see also dams; storage<br />
resettlement 282, 283<br />
residence times 138, 171‐172, 173<br />
resilience 129‐130, 282, 295<br />
respiration 199, 200<br />
response options 21, 241‐268<br />
reuse of wastewater 142‐143<br />
revenues 60‐64<br />
RhineNet project 254<br />
Rhine River, Europe 121<br />
rice production 115<br />
rights 52‐53, 248, 250, 285<br />
Rio Grande/Bravo 243, 284<br />
risk<br />
climate change 19<br />
dealing with 269<br />
decision‐making 292, 295‐296<br />
integrated approaches 277<br />
malnutrition 14<br />
nanotechnology 45<br />
pollution 145<br />
sharing instruments 65<br />
wastewater 143<br />
water quality 136‐139<br />
win‐win scenarios 283‐285<br />
river basins<br />
closure and interconnectedness 150‐151<br />
competition 155<br />
interregional cooperation 283<br />
organizations 6<br />
river management 247<br />
transboundary 146<br />
upstream‐downstream impacts 152<br />
water quality 176<br />
rivers<br />
discharge 151, 175, 197, 201, 202, 219<br />
environmental flows 145‐146<br />
flows 130, 170‐171, 214‐217<br />
parliaments 251‐254<br />
sediment 218‐222<br />
wastewater 141<br />
see also streamflow<br />
rules 50‐51<br />
runoff<br />
climate change 82, 113‐114, 213<br />
glaciers 197, 213<br />
global 170, 232, 233<br />
hydrologic cycle 167<br />
pollution 139<br />
trends 186‐188, 202, 203, 204<br />
rural areas<br />
development 282<br />
electrification 127, 133, 279<br />
environmental services payments 263<br />
groundwater 134‐135, 217<br />
infrastructure 58<br />
investments 82<br />
population 31<br />
sanitation 103<br />
urban water needs contrast 84‐86<br />
see also agriculture<br />
Russian Federation 186, 188, 193, 194, 195<br />
Rwanda 282, 283<br />
S<br />
safe drinking water see drinking water<br />
salinization 130, 131, 220, 230<br />
sanitation<br />
access to 84, 85, 88, 96, 102‐103, 104<br />
domestic 102‐106<br />
economic impacts 8‐9<br />
education 38, 272<br />
finance 49<br />
infrastructure costs 59‐60<br />
integrated approaches 244<br />
law 51<br />
MDGs 11‐12<br />
participation 246<br />
poverty 11, 37<br />
subsidies 64<br />
São Francisco basin, Brazil 247<br />
satellite data 43, 185, 186, 195, 204, 226, 228,<br />
233‐234<br />
see also remote sensing<br />
scaling‐up 12, 106<br />
scarcity, water 17, 18, 33, 112, 128, 154, 294<br />
scenarios 74‐75, 101, 212‐213, 244, 269‐273,<br />
296<br />
schools 88, 104, 272<br />
science and education centres 258<br />
science and technology 42‐45<br />
see also research<br />
sea level rise 70<br />
second‐generation bioenergy technology 44<br />
sectoral level 15, 98, 151‐152, 276‐280<br />
security<br />
climate change 19‐20<br />
energy 18, 34<br />
food 16‐17, 33, 110, 123<br />
water 11, 153<br />
win‐win scenarios 280‐282<br />
sediment 130, 175, 190, 201, 218‐222<br />
seismic activities 219<br />
self‐regulation 135<br />
self‐sufficiency 34<br />
self‐supply groundwater 97, 100<br />
semi‐arid tropics 113<br />
Senegal River 284<br />
sensitivity 189, 190, 203<br />
service provision/delivery<br />
corruption 55<br />
Water in a changing world 317
PART<br />
Index<br />
costs 3, 292<br />
decentralization 246<br />
efficiency 249<br />
finance 61, 63<br />
national 51‐52, 81<br />
partnerships 6<br />
small‐scale 89, 105‐106<br />
sewage treatment 140‐143<br />
see also wastewater<br />
shared resources 51, 146, 220, 283<br />
sharing data and information 226, 228, 229,<br />
231‐232, 235, 236, 256‐258, 293‐294<br />
Siberia 190‐191, 193<br />
siltation 130<br />
single‐use systems 87<br />
skin disease 143<br />
sludge 142<br />
slums 30, 84, 103‐104, 105, 282<br />
small islands 113<br />
small‐scale water provision 63, 65, 249, 262<br />
small towns 103<br />
snow 113, 194‐196, 201, 204, 213, 216<br />
social level<br />
climate change 71‐72<br />
decision‐making 4<br />
development 291<br />
drivers 36‐39<br />
groundwater sustainability 134‐135<br />
marketing 286<br />
policy 272‐273<br />
responsibility 274<br />
sanitation 105‐106<br />
water management 150<br />
soft infrastructure 57, 82‐83<br />
soil 185‐186, 200, 204, 218<br />
solar energy 279<br />
solar radiation 184<br />
South Africa 222, 275<br />
South Asia 106, 133<br />
South‐East Asia 8<br />
space hydrologic observations 233‐234<br />
Spain 222<br />
spatial level 118, 167‐172, 174, 175, 176,<br />
294‐295<br />
sphere of decision‐making 4, 5<br />
spring melt 194, 195<br />
stakeholders 9, 246, 251‐255<br />
standards of living 39, 71<br />
stationarity 181<br />
statistical downscaling 203<br />
The Stern Review 2006 71<br />
storage<br />
Africa 11<br />
economic development 81, 82<br />
groundwater 171‐172, 173, 223, 230<br />
need for increases 153<br />
terrestrial carbon cycles 197, 199<br />
trends 190‐192<br />
see also groundwater; reservoirs<br />
storms 70, 214<br />
streamflow 186‐188, 201, 202, 204, 213, 220,<br />
229, 232<br />
see also river flows<br />
stunting in children 90<br />
subsectoral management 4<br />
subsidence 217<br />
subsidies 62, 64, 66, 117, 133, 158, 279<br />
supply 64, 68, 102‐106, 154‐158, 167, 246<br />
support 293<br />
surface fluxes 181<br />
sustainable development 3‐23, 36, 68, 288<br />
sustainable level<br />
change 286<br />
cost recovery 65<br />
environmental 12‐14, 37, 127, 134‐135,<br />
145‐146<br />
finance 57, 66, 284‐288, 291, 292<br />
groundwater 131‐136<br />
institutions 284<br />
sanitation 244<br />
technological innovation 47<br />
tourism 279‐280<br />
water management 36<br />
Sustainable Water Management Improves<br />
Tomorrow’s Cities Health (SWITCH) 257<br />
Sweden 187<br />
SWITCH see Sustainable Water Management<br />
Improves Tomorrow’s Cities Health<br />
Switzerland 187<br />
synergies 6, 269, 291, 294<br />
T<br />
Tajikistan 223<br />
Tanzania 70<br />
tariffs 60, 61‐62, 65<br />
technological innovation 41‐48, 72‐73, 105,<br />
115, 156, 259‐260, 285<br />
temperature<br />
extreme events 216<br />
glaciers 196‐197<br />
growing seasons 222<br />
hydrological cycle 201, 202<br />
permafrost 193<br />
precipitation 213‐214<br />
productivity 199‐200, 219<br />
sediment 220<br />
snow cover 195<br />
temporal level 167‐172, 294‐295<br />
Tennessee Valley Authority 280, 281<br />
terrestrial systems 197‐201, 228, 229‐230<br />
thaw lakes 200<br />
thermal stratification 138, 220<br />
thermocline 220<br />
Tien Shan, Akshiirak glacier massif 197, 198<br />
tourism 116, 117, 279‐280<br />
toxic chemicals 273<br />
trade 32, 35‐36, 62, 145, 158<br />
trade‐offs 6, 49, 66, 269, 277, 291, 294<br />
traditional aspects 52, 256, 262<br />
see also customary aspects<br />
transboundary 18, 146, 153‐154, 221‐222, 230,<br />
231‐232, 243, 286<br />
transition economies 140<br />
transparency 49, 56, 150, 270, 292<br />
transpiration 106<br />
transport 111, 120‐121, 201<br />
treaties 50, 154<br />
tundra 212<br />
Tunisia 156, 244, 274<br />
Turkey 187, 280, 281<br />
U<br />
Uganda 91, 271<br />
Ukraine 186<br />
UN see United Nations<br />
uncertainty<br />
climate change 68, 69, 71, 73, 74, 112‐114<br />
data and information 292<br />
dealing with 269<br />
decision‐making 295‐296<br />
economic 17<br />
future water use 101<br />
hydrological cycle 202‐203, 227<br />
precipitation 181, 182<br />
reducing 291<br />
renewable water supply 170, 171<br />
variability 211<br />
water quality 174<br />
water use 97<br />
win‐win scenarios 283‐285<br />
under‐five mortality 88<br />
UN Secretary‐General’s Advisory Board on<br />
Water and Sanitation (UNSGAB) 64<br />
UNFCCC see United Nations Framework<br />
Convention on Climate Change<br />
United Kingdom 187<br />
United Nations Framework Convention on<br />
Climate Change (UNFCCC) 18, 19<br />
United Nations (UN) 20, 269, 291, 293<br />
United States of America (US) 243<br />
allocation institutions 284<br />
dams 172<br />
ecosystem restoration costs 9<br />
infrastructure 8, 57<br />
power generation technologies 118<br />
regional development 280, 281<br />
snow cover 195‐196<br />
soil conservation 218<br />
streamflow 187<br />
water charging 263<br />
upstream‐downstream relationships 151, 152,<br />
262‐263<br />
upstream irrigation 157<br />
urban areas<br />
agriculture conflicts 152<br />
groundwater 133‐134, 134‐135<br />
infrastructure 57‐58<br />
knowledge networks 257‐258<br />
migration 282<br />
pollution 140‐143<br />
population 29‐30, 31<br />
rural contrast 84‐86<br />
sanitation 103<br />
stormwater 214<br />
wastewater 287<br />
water loss 156<br />
urbanization 29, 31, 101, 136, 138<br />
user finance 57, 60, 61‐62, 286<br />
use of water 16, 21, 41, 82‐83, 96‐149, 212,<br />
232‐233, 294<br />
V<br />
value 92, 145, 157, 228, 231<br />
values 38‐39<br />
variability<br />
adaptation 222<br />
climate change 68, 73, 74<br />
glaciers 196<br />
precipitation 181, 182‐183<br />
rainfall 70<br />
soil moisture 186<br />
spatial and temporal 167‐172<br />
uncertainty 211<br />
vegetation 212, 218, 220<br />
Viet Nam, poverty reduction and growth 10<br />
virtual water 14, 15, 32, 33, 35‐36, 101, 102, 168<br />
vulnerability<br />
aquifers 223<br />
climate change 19‐20, 73, 113‐114<br />
economic development 70<br />
ecosystem services 92<br />
groundwater pollution 134<br />
poverty 37<br />
urban and coastal areas 30<br />
W<br />
wastewater<br />
agriculture 287<br />
energy 117<br />
environmental impacts 142‐143<br />
information 233<br />
infrastructure costs 58, 59<br />
micro‐organisms 44<br />
nanotechnology 45<br />
perceptions 106<br />
pollution 138<br />
technological innovation 41<br />
see also pollution; sewage treatment<br />
water box dilemma 3, 4‐6<br />
water footprints 15, 33, 35‐36, 96, 101‐102, 117<br />
water as human right 54, 248<br />
water‐logging 130‐131<br />
water stress 92, 142<br />
water user associations 6, 246, 248, 253‐254<br />
WBCSD see World Business Council for<br />
Sustainable Development<br />
wealth 84<br />
wetlands 91, 151, 191‐192, 204, 212<br />
wildfire 200<br />
willingness to pay 9, 57, 61<br />
wind speed 185, 220<br />
win‐win scenarios 269‐285<br />
withdrawals<br />
agriculture 106<br />
groundwater 132<br />
increases 96<br />
industrial water 116<br />
Mediterranean 157<br />
water use 97, 98, 99, 100<br />
women 38<br />
World Business Council for Sustainable<br />
Development (WBCSD) 75<br />
World Economic Forum 2008 296<br />
World Panel on Financing Water Infrastructure<br />
9, 64, 262<br />
World Water Assessment Programme 291, 296<br />
World Water Monitoring Day 285<br />
World Water Vision 2000 53‐54, 75<br />
Y<br />
yields 107‐108, 112‐113, 222<br />
Z<br />
Zambia 259, 287<br />
zooplankton 219<br />
318 World Water Development Report 3
WMO<br />
UNITED NATIONS<br />
<strong>WORLD</strong> BANK<br />
UN-Water is a mechanism with 25<br />
member agencies to strengthen coordination<br />
and coherence among all United Nations bodies<br />
that deal with freshwater issues: from water<br />
supply, sanitation and health to climate, food, energy,<br />
environment, disasters and sustainable water resources<br />
management for socioeconomic development. Established<br />
in 2003 by the High-Level Committee on Programmes of<br />
the United Nations, it evolved from many years of close<br />
collaboration among UN agencies. UN-Water is not<br />
another agency; through task forces and programmes<br />
led and hosted by various members, it adds value to<br />
existing activities and fosters cooperation and<br />
information sharing among UN agencies<br />
and stakeholder representatives.<br />
Including UNDESA, UNECE, UNESCAP, UNECA, UNECLAC, UNESCWA, UNCTAD<br />
The news media are full of talk of crises – in climate change, energy and food and<br />
troubled financial markets. These crises are linked to each other and to water resources<br />
management. Unresolved, they may lead to increasing political insecurity and conflict.<br />
Water is required to meet our fundamental needs and rising living standards and<br />
to sustain our planet’s fragile ecosystems. Pressures on the resource come from a<br />
growing and mobile population, social and cultural change, economic development<br />
and technological change. Adding complexity and risk is climate change, with<br />
impacts on the resource as well as on the sources of pressure on water.<br />
The challenges, though substantial, are not insurmountable. The Report shows how some<br />
countries have responded. Progress in providing drinking water is heartening, with the<br />
Millennium Development Goal target on track in most regions. But other areas remain<br />
unaddressed, and after decades of inaction, the problems in water systems are enormous<br />
and will worsen if left unattended.<br />
Leaders in the water sector can inform decisions outside their domain and manage<br />
water resources to achieve agreed socioeconomic objectives and environmental<br />
integrity. Leaders in government, the private sector and civil society determine these<br />
objectives and allocate human and financial resources to meet them. Recognizing<br />
this responsibility, they must act now!<br />
UNESCO ISBN:<br />
978-9-23104-095-5<br />
Earthscan ISBN:<br />
978-1-84407-840-0