Pioneer Independence Fund - Pioneer Investments
Pioneer Independence Fund - Pioneer Investments
Pioneer Independence Fund - Pioneer Investments

Create successful ePaper yourself
Turn your PDF publications into a flip-book with our unique Google optimized e-Paper software.
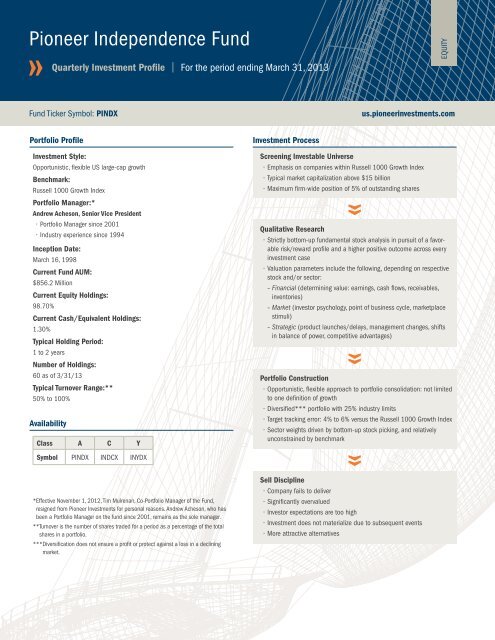
<strong>Pioneer</strong> <strong>Independence</strong> <strong>Fund</strong><br />
Quarterly Investment Profile | For the period ending March 31, 2013<br />
EQUITY<br />
<strong>Fund</strong> Ticker Symbol: PINDX<br />
us.pioneerinvestments.com<br />
Portfolio Profile<br />
Investment Style:<br />
Opportunistic, flexible US large-cap growth<br />
Benchmark:<br />
Russell 1000 Growth Index<br />
Portfolio Manager:*<br />
Andrew Acheson, Senior Vice President<br />
• Portfolio Manager since 2001<br />
• Industry experience since 1994<br />
Inception Date:<br />
March 16, 1998<br />
Current <strong>Fund</strong> AUM:<br />
$856.2 Million<br />
Current Equity Holdings:<br />
98.70%<br />
Current Cash/Equivalent Holdings:<br />
1.30%<br />
Typical Holding Period:<br />
1 to 2 years<br />
Number of Holdings:<br />
60 as of 3/31/13<br />
Typical Turnover Range:**<br />
50% to 100%<br />
Availability<br />
Class A C Y<br />
Investment Process<br />
Screening Investable Universe<br />
• Emphasis on companies within Russell 1000 Growth Index<br />
• Typical market capitalization above $15 billion<br />
• Maximum firm-wide position of 5% of outstanding shares<br />
Qualitative Research<br />
• Strictly bottom-up fundamental stock analysis in pursuit of a favorable<br />
risk/reward profile and a higher positive outcome across every<br />
investment case<br />
• Valuation parameters include the following, depending on respective<br />
stock and/or sector:<br />
– Financial (determining value: earnings, cash flows, receivables,<br />
inventories)<br />
– Market (investor psychology, point of business cycle, marketplace<br />
stimuli)<br />
– Strategic (product launches/delays, management changes, shifts<br />
in balance of power, competitive advantages)<br />
Portfolio Construction<br />
• Opportunistic, flexible approach to portfolio consolidation: not limited<br />
to one definition of growth<br />
• Diversified*** portfolio with 25% industry limits<br />
• Target tracking error: 4% to 6% versus the Russell 1000 Growth Index<br />
• Sector weights driven by bottom-up stock picking, and relatively<br />
unconstrained by benchmark<br />
Symbol PINDX INDCX INYDX<br />
*Effective November 1, 2012, Tim Mulrenan, Co-Portfolio Manager of the <strong>Fund</strong>,<br />
resigned from <strong>Pioneer</strong> <strong>Investments</strong> for personal reasons. Andrew Acheson, who has<br />
been a Portfolio Manager on the fund since 2001, remains as the sole manager.<br />
**Turnover is the number of shares traded for a period as a percentage of the total<br />
shares in a portfolio.<br />
***Diversification does not ensure a profit or protect against a loss in a declining<br />
market.<br />
Sell Discipline<br />
• Company fails to deliver<br />
• Significantly overvalued<br />
• Investor expectations are too high<br />
• Investment does not materialize due to subsequent events<br />
• More attractive alternatives
<strong>Pioneer</strong> <strong>Independence</strong> <strong>Fund</strong> (PINDX)<br />
For the period ending March 31, 2013<br />
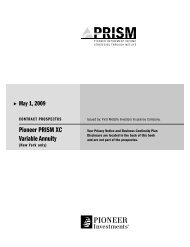
Sector Weighting<br />
Information Technology<br />
27.29%<br />
28.95%<br />
Health Care<br />
Consumer Staples<br />
Consumer Discretionary<br />
13.16%<br />
12.85%<br />
13.04%<br />
12.92%<br />
12.08%<br />
16.87%<br />
Energy<br />
Industrials<br />
Financial<br />
Materials<br />
4.22%<br />
5.46%<br />
4.86%<br />
3.82%<br />
3.89%<br />
<strong>Pioneer</strong> <strong>Independence</strong> <strong>Fund</strong> A<br />
11.95%<br />
11.91%<br />
12.94%<br />
Russell 1000 Growth Index<br />
Source: <strong>Pioneer</strong> <strong>Investments</strong> Market Research<br />
Characteristics<br />
Top Ten Holdings<br />
Portfolio<br />
Index<br />
Sector<br />
Portfolio<br />
Asset (MM) $856 -<br />
Median Market Cap. (MM) $30,845 $7,113<br />
Weighted Market Cap. (MM) $77,532 $93,857<br />
Average Price/Earnings Ratio (Trailing) 26 25<br />
Average Price/Earnings Ratio (Forecast) 21 20<br />
Price/Book Ratio 6 11<br />
Number of Holdings 60 574<br />
Price/Earnings refer to the price of a stock divided by its earnings per share. It reflects<br />
weighted average of trailing 12-month price-to-earnings ratios of portfolio holdings.<br />
Average Price/Earnings ratio (Forecast) reflects the current price of a stock divided by<br />
the estimated one year projection of its earnings per share. Price/Book Ratio is the<br />
ratio of a stock’s price to its book value per share.<br />
The portfolio is actively managed and current holdings and characteristics may be<br />
different. The holdings listed should not be considered recommendations to buy or sell<br />
any particular security listed.<br />
Apple Information Technology 6.16%<br />
CVS Caremark Consumer Staples 3.33%<br />
Precision Castparts Industrials 3.00%<br />
Celgene Health Care 2.90%<br />
Qualcomm Information Technology 2.84%<br />
Mastercard Information Technology 2.81%<br />
Vertex Pharmaceutical Health Care 2.77%<br />
Anadarko Petroleum Energy 2.63%<br />
United Technologies Industrials 2.52%<br />
EMC Information Technology 2.50%<br />
Total Percentage of Portfolio 31.46%<br />
Source: <strong>Pioneer</strong> <strong>Investments</strong> Market Research
EQUITY<br />
<strong>Fund</strong> Performance as of March 31, 2013<br />
Call 1-800-225-6292 or visit us.pioneerinvestments.com for the most recent month-end performance results. Current performance may be lower or higher than the performance<br />
data quoted. The performance data quoted represents past performance, which is no guarantee of future results. Investment return and principal value will fluctuate, and shares,<br />
when redeemed, may be worth more or less than their original cost. NAV results represent the percent change in net asset value per share. POP returns reflect deduction of maximum<br />
5.75% sales charge. All results are historical and assume the reinvestment of dividends and capital gains. Other share classes are available for which performance and expenses will<br />
differ. Performance results reflect any applicable expense waivers in effect during the periods shown. Without such waivers fund performance would be lower. Waivers may not be in effect for<br />
all funds. Certain fee waivers are contractual through a specified period. Otherwise, fee waivers can be rescinded at any time. See the prospectus and financial statements for more information.<br />
This material is intended for use with registered investment advisors who sell shares at net asset value.<br />
Calendar Year Returns (%) Class A Shares Average Annual Returns (%)<br />
Life<br />
YTD 2012 2011 2010 2009 2008 1-Year 3-Year 5-Year 10-Year<br />
3/16/98<br />
<strong>Pioneer</strong> <strong>Independence</strong> <strong>Fund</strong> A at NAV 8.75 13.29 -2.14 14.36 43.06 -48.76 6.45 10.12 4.31 7.29 4.21<br />
<strong>Fund</strong> at POP 2.50 6.77 -7.80 7.77 34.63 -51.76 0.30 7.96 3.08 6.65 3.80<br />
Russell 1000 Growth Index 9.54 15.26 2.64 16.71 37.21 -38.44 10.09 13.06 7.30 8.62 3.25<br />
MSTAR Large Growth Average 8.79 15.34 -2.46 15.53 35.68 -40.90 8.43 10.82 5.42 8.23 3.40<br />
Gross Expense Ratio: 1.27% Net Expense Ratio: 1.25%<br />
The Net Expense ratio reflects contractual expense limitations currently in effect through 5/1/2013 for Class A Shares. There can be no assurance that <strong>Pioneer</strong> will extend the expense<br />
limitations beyond such time. Please see the prospectus and financial statements for more information.<br />
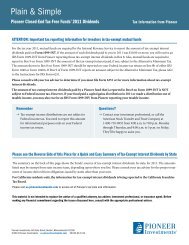
Volatility/Return Comparison<br />
5-Year Period Ended March 31, 2013<br />
9%<br />
Return<br />
Standard<br />
Deviation<br />
6%<br />
3%<br />
0%<br />
0% 10% 20% 30% 40%<br />
Standard Deviation %<br />
5-Year Upside/Downside<br />
Return %<br />
◆<br />
Class A Shares at NAV as of March 31, 2013<br />
130%<br />
120%<br />
H <strong>Pioneer</strong> <strong>Independence</strong> <strong>Fund</strong> A 4.31% 23.30%<br />
u Russell 1000 Growth Index 7.30% 19.03%<br />
n MSTAR Large Growth Average 5.42% 19.71%<br />
Source: Morningstar<br />
Russell 1000 Growth Index measures the performance of large-cap U.S. growth stocks.<br />
Morningstar (MSTAR) Large Growth Average measures the performance of funds in the<br />
large-cap universe. The Morningstar Large Growth category represents the performance<br />
of large growth funds tracked by Morningstar.<br />
Indices are unmanaged and their returns assume reinvestment of dividends and,<br />
unlike mutual fund returns, do not reflect any fees or expenses associated with<br />
a mutual fund. It is not possible to invest directly in an index.<br />
Standard Deviation–a measure of return variability (risk), above and below an average<br />
rate of return. A higher standard deviation suggests more variability in returns from<br />
quarter to quarter.<br />
Up Capture<br />
vs. Market<br />
Down Capture<br />
vs. Market<br />
H <strong>Pioneer</strong> <strong>Independence</strong> <strong>Fund</strong> A 115.49% 131.34%<br />
u Russell 1000 Growth Index 100.00% 100.00%<br />
n MSTAR Large Growth Average 99.33% 108.56%<br />
Upside %<br />
110%<br />
100%<br />
◆<br />
90%<br />
90% 100% 110% 120% 130%<br />
Downside %<br />
140%<br />
Source: Morningstar<br />
Up Market/Down Market – a measure of relative performance versus an index during<br />
either those quarters when the index had only positive returns or those periods where the<br />
index had only negative returns. An up market ratio of 110% suggests outperformance of<br />
the index by 10% during quarters with positive returns. Contrarily, a down market ratio of<br />
90% suggests outperformance of the index by 10% during quarters with negative returns.<br />
The performance data quoted represents past performance, which is no guarantee<br />
of future results. Investment return and principal value will fluctuate, and shares,<br />
when redeemed, may be worth more or less than their original cost. NAV results<br />
represent the percent change in net asset value per share. Returns would have been<br />
lower had sales charges been reflected.
Risk Measures (5 Years)<br />
Alpha<br />
Tracking<br />
Error<br />
Information<br />
Ratio<br />
Beta<br />
R-Squared<br />
Sharpe<br />
Ratio<br />
Sortino<br />
Ratio<br />
Standard<br />
Deviation<br />
<strong>Pioneer</strong> <strong>Independence</strong> <strong>Fund</strong> A -3.49 7.13 -0.42 1.18 92.81 0.29 0.40 23.30<br />
Russell 1000 Growth Index - - - 1.00 100.00 0.45 0.63 19.03<br />
Source: Morningstar<br />
Alpha–incremental return generated versus an index after accounting for volatility in the form<br />
of beta. A positive alpha suggests risk-adjusted value added by the money manager versus<br />
the index.<br />
Beta–a measure of volatility (risk) compared to that of an appropriate index. For example,<br />
a beta of 1.2 suggests 20% more volatility in returns than the benchmark index, which is<br />
assigned a beta of 1.0.<br />
Information Ratio–a measure of portfolio management’s performance against risk and<br />
return relative to a benchmark or alternative measure.<br />
Tracking Error–reported as a “standard deviation percentage” difference – the difference<br />
between the return received on an investment and that of the investment’s benchmark.<br />
R-Squared–a measure of the reliability of beta and alpha, indicates whether the comparison<br />
benchmark is appropriate. An R-Squared rating above 70 is desirable.<br />
Sharpe Ratio–a measure of excess return per unit of risk, as defined by standard deviation.<br />
A higher Sharpe ratio suggests better risk-adjusted performance.<br />
Sortino Ratio –measure of excess return per unit of risk based on downside semi-variance,<br />
instead of total risk (standard deviation) used by the Sharpe Ratio. Since the Sortino Ratio<br />
takes into account only the downside size and frequency of returns, it measures the reward to<br />
negative volatility trade-off.<br />
Standard Deviation–a measure of return variability (risk), above and below an average rate of<br />
return. A higher standard deviation suggests more variability in returns from quarter to quarter.<br />
Lipper Rankings<br />
as of 3/31/13<br />
1-Year 3-Year 5-Year 10-Year<br />
Rank/Total Percentile Rank/Total Percentile Rank/Total Percentile Rank/Total Percentile<br />
<strong>Pioneer</strong> <strong>Independence</strong> <strong>Fund</strong> A 429<br />
386<br />
388<br />
233<br />
62%<br />
63%<br />
71%<br />
Large Cap Growth <strong>Fund</strong>s 702 621 553 377<br />
62%<br />
Lipper rankings do not take into account sales charges. Rankings are based on past performance, which is no guarantee of future results. Rankings are based on average annual total returns<br />
for the 1, 3, 5, 10 year/life periods in the Lipper Categories listed above. Keep in mind, a high relative ranking does not always mean the fund achieved a positive return during the period.<br />
Lipper performance rankings above apply to Class A shares. Other share classes are available for which performance and expenses will differ.<br />
Morningstar Ratings<br />
Large Growth <strong>Fund</strong>s<br />
Overall Rating<br />
3-Year 5-Year 10-Year<br />
Rank/Total Rating Rank/Total Rating Rank/Total Rating<br />
Load Waived HH 953 HH 899 HH 609 HH<br />
Load Reflected H 1482 HH 1278 H 856 H<br />
Please see a prospectus for complete information pertaining to load waived eligibility (such as large purchases or certain types of group plan participants). Morningstar load waived ratings<br />
are based on the standard Morningstar rating methodology with the exception that they are recalculated without the effects of the front load sales charge. Morningstar proprietary ratings<br />
reflect risk-adjusted performance as of 3/31/13. For each fund with at least a three-year history, Morningstar calculates a Morningstar Rating based on a Morningstar Risk-Adjusted Return<br />
measure that accounts for variation in a fund’s monthly performance (including the effects of sales charges, loads, and redemption fees), placing more emphasis on downward variations and<br />
rewarding consistent performance. The top 10% of funds in each category receive 5 stars, the next 22.5% receive 4 stars, the next 35% receive 3 stars, the next 22.5% receive 2 stars and<br />
the bottom 10% receive 1 star. (Each share class is counted as a fraction of one fund within this scale and rated separately, which may cause slight variations in the distribution percentages.)<br />
The Overall Morningstar Rating for a fund is derived from a weighted-average of the performance figures associated with its three-, five- and ten-year (if applicable) Morningstar Rating<br />
metrics. <strong>Pioneer</strong> <strong>Fund</strong>s listed were rated exclusively against the specific fund category listed. The Morningstar Rating is for Class A shares only; other classes may have different performance<br />
characteristics. The Morningstar information contained herein: (1) is proprietary to Morningstar; (2) may not be copied; and (3) is not warranted to be accurate, complete or timely. Neither<br />
Morningstar nor its content providers are responsible for any damages or losses arising from any use of this information. Morningstar Load Waived ratings do not take into account class A<br />
sales charges. ©2013 Morningstar, Inc. All Rights Reserved.<br />
The performance data quoted represents past performance, which is no guarantee of future results.<br />
A Word About Risk: Investing in foreign and/or emerging markets securities involves risks relating to interest rates, currency exchange rates, economic, and political conditions. At times, the<br />
<strong>Fund</strong>’s investments may represent industries or industry sectors that are interrelated or have common risks, making it more susceptible to any economic, political, or regulatory developments<br />
or other risks affecting those industries and sectors. Investing in a concentrated, narrowly focused fund may entail greater risks than is normally associated with more widely diversified funds.<br />
The Russell 1000 Growth Index measures the performance of large-cap U.S. growth stocks. Indices are unmanaged and their returns assume reinvestment of dividends and, unlike mutual<br />
fund returns, do not reflect any fees or expenses associated with a mutual fund. It is not possible to invest directly in an index.<br />
Contact your financial advisor or visit us.pioneerinvestments.com for more information about the <strong>Pioneer</strong> investment products and programs that may be best<br />
for your needs.<br />
Before investing, consider the product’s investment objectives, risks, charges and expenses. Contact your advisor or <strong>Pioneer</strong> <strong>Investments</strong> for a prospectus or<br />
summary prospectus containing this information. Read it carefully.<br />
Neither <strong>Pioneer</strong>, nor its representatives are legal or tax advisors. In addition, <strong>Pioneer</strong> does not provide advice or recommendations. The investments you choose should<br />
correspond to your financial needs, goals, and risk tolerance. For assistance in determining your financial situation, please consult an investment professional.<br />
Not FDIC insured May lose value No bank guarantee<br />
Securities offered through <strong>Pioneer</strong> <strong>Fund</strong>s Distributor, Inc., 60 State Street, Boston, Massachusetts 02109<br />
Underwriter of <strong>Pioneer</strong> mutual funds, Member SIPC<br />
©2013 <strong>Pioneer</strong> <strong>Investments</strong> • us.pioneerinvestments.com • 23704-12-0413