

MARKET MOVER - BNP PARIBAS - Investment Services India
MARKET MOVER - BNP PARIBAS - Investment Services India
MARKET MOVER - BNP PARIBAS - Investment Services India

You also want an ePaper? Increase the reach of your titles
YUMPU automatically turns print PDFs into web optimized ePapers that Google loves.
Next we compare Ireland and Portugal and try to<br />
identify the potential threats and opportunities in the<br />
coming months. Starting with the funding needs and<br />
issuance calendar in these countries, Ireland has<br />
already reached 2010’s funding needs and has<br />
actually started pre-funding for 2011. Despite that,<br />
NTMA officials have stated that there is no plan to<br />
skip an auction and thus we could have some more<br />
prefunding in the remainder of the year, most likely<br />
two more auctions (depending on market conditions).<br />
On the other hand, Portugal has completed 90% of<br />
its issuance target (EUR 19bn of EUR 21bn) and we<br />
expect another EUR 2bn before year-end. Hence,<br />
funding pressures will be limited in the remainder of<br />
the year while the main focus will be on the budget<br />
reports and the projections for 2011 funding needs.<br />
In terms of fiscal consolidation, Portugal appears to<br />
be on a weaker path. Chart 4 shows the Portuguese<br />
cash-basis budget balance, where the development<br />
has been disappointing so far according to our<br />
economists. Over the first eight months of this year,<br />
the deficit was EUR 0.5bn larger than over the same<br />
period last year. On the contrary, in Ireland, there<br />
have been many concerns lately with respect to the<br />
massive amount of government guaranteed bonds<br />
that mature in September. This has led to an<br />
acceleration of the widening of Irish spreads in<br />
combination with the developments on ANGIRI. We<br />
don’t think that these redemptions will cause any<br />
significant problem for the Irish banks and we expect<br />
some risk to be priced out of Irish Gilts once<br />
September has passed. The key statistic to watch in<br />
the near term will be the ECB liquidity absorbed by<br />
Irish banks, where we could see a spike in<br />
September’s data. This spike has already taken<br />
place in Portugal: as Chart 5 shows, the dependence<br />
of Portuguese banks on the ECB has exploded since<br />
April. This is a very worrying trend that could create<br />
more pressure on PGBs as the ECB’s exit strategy<br />
has already become a hot topic in the market.<br />
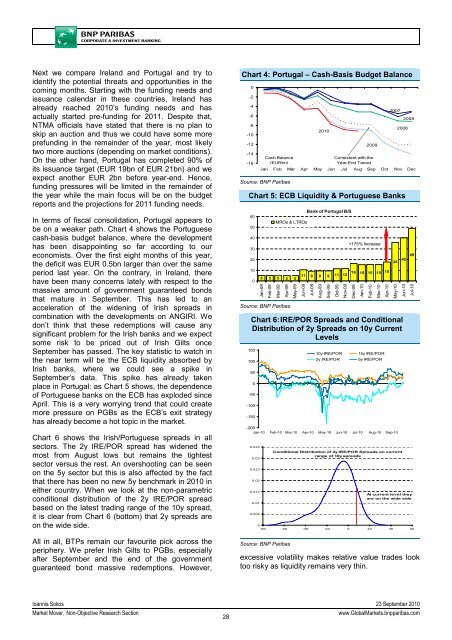
Chart 6 shows the Irish/Portuguese spreads in all<br />
sectors. The 2y IRE/POR spread has widened the<br />
most from August lows but remains the tightest<br />
sector versus the rest. An overshooting can be seen<br />
on the 5y sector but this is also affected by the fact<br />
that there has been no new 5y benchmark in 2010 in<br />
either country. When we look at the non-parametric<br />
conditional distribution of the 2y IRE/POR spread<br />
based on the latest trading range of the 10y spread,<br />
it is clear from Chart 6 (bottom) that 2y spreads are<br />
on the wide side.<br />
All in all, BTPs remain our favourite pick across the<br />
periphery. We prefer Irish Gilts to PGBs, especially<br />
after September and the end of the government<br />
guaranteed bond massive redemptions. However,<br />
Chart 4: Portugal – Cash-Basis Budget Balance<br />
0<br />
-2<br />
-4<br />
-6<br />
-8<br />
-10<br />
-12<br />
-14<br />
-16<br />
Cash Balance<br />
(EURbn)<br />
2010<br />
2009<br />
Consistent with the<br />
Year-End Target<br />
2007<br />
2006<br />
2008<br />
Jan Feb Mar Apr May Jun Jul Aug Sep Oct Nov Dec<br />
Source: <strong>BNP</strong> Paribas<br />
Chart 5: ECB Liquidity & Portuguese Banks<br />
60<br />
50<br />
40<br />
30<br />
20<br />
10<br />
0<br />
5 5 5 5 5<br />
Jan-09<br />
Feb-09<br />
Mar-09<br />
Apr-09<br />
Source: <strong>BNP</strong> Paribas<br />
MROs & LTROs<br />
May-09<br />
Bank of Portugal B/S<br />
11 9 9 9 11 12 16 15 15 15 18 36 40 49<br />
Jun-09<br />
Jul-09<br />
Aug-09<br />
Sep-09<br />
excessive volatility makes relative value trades look<br />
too risky as liquidity remains very thin.<br />
Oct-09<br />
Nov-09<br />
+175% Increase<br />
Chart 6: IRE/POR Spreads and Conditional<br />
Distribution of 2y Spreads on 10y Current<br />
Levels<br />
150<br />
100<br />
50<br />
0<br />
-50<br />
-100<br />
-150<br />
-200<br />
Jan-10 Feb-10 Mar-10 Apr-10 May-10 Jun-10 Jul-10 Aug-10 Sep-10<br />
0.035<br />
0.03<br />
0.025<br />
0.02<br />
0.015<br />
0.01<br />
0.005<br />
0<br />
10y IRE/POR<br />
2y IRE/POR<br />
Dec-09<br />
Jan-10<br />
Feb-10<br />
Mar-10<br />
15y IRE/POR<br />
5y IRE/POR<br />
-80 -60 -40 -20 0 20 40 60<br />
Source: <strong>BNP</strong> Paribas<br />
Conditional Distribution of 2y IRE/POR Spreads on current<br />
range of 10y spreads<br />
Apr-10<br />
May-10<br />
Jun-10<br />
Jul-10<br />
At current level they<br />
are on the wide side<br />
Ioannis Sokos 23 September 2010<br />
Market Mover, Non-Objective Research Section<br />
28<br />
www.GlobalMarkets.bnpparibas.com


