

MARKET MOVER - BNP PARIBAS - Investment Services India
MARKET MOVER - BNP PARIBAS - Investment Services India
MARKET MOVER - BNP PARIBAS - Investment Services India

You also want an ePaper? Increase the reach of your titles
YUMPU automatically turns print PDFs into web optimized ePapers that Google loves.
Global: The Debt/Equity Macro Trade<br />
• Analysis of speculative positioning does not<br />
support a long equity / short bonds trade.<br />
• STRATEGY: Equity and debt performance is<br />
likely with rates frozen and unconventional<br />
policy in place.<br />
Chart 1: Speculative US Equity Positioning<br />
100000<br />
50000<br />
0<br />
-50000<br />
-100000<br />
Anecdotal evidence suggests that the "long equity /<br />
short bonds" trade is one of so-called smart money's<br />
big macro trades into year-end. Let's dig into the data<br />
to see what the facts are.<br />
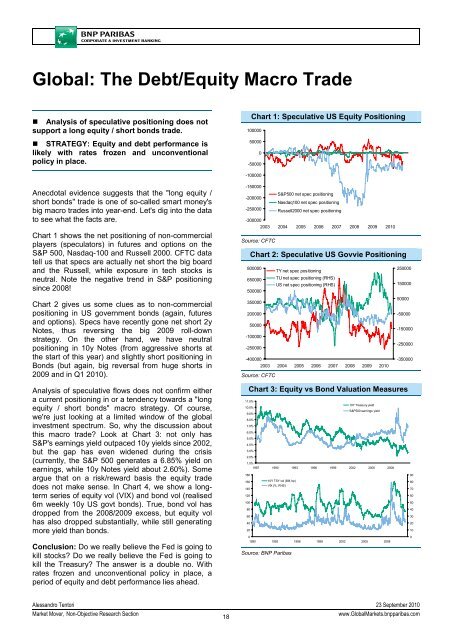
Chart 1 shows the net positioning of non-commercial<br />
players (speculators) in futures and options on the<br />
S&P 500, Nasdaq-100 and Russell 2000. CFTC data<br />
tell us that specs are actually net short the big board<br />
and the Russell, while exposure in tech stocks is<br />
neutral. Note the negative trend in S&P positioning<br />
since 2008!<br />
Chart 2 gives us some clues as to non-commercial<br />
positioning in US government bonds (again, futures<br />
and options). Specs have recently gone net short 2y<br />
Notes, thus reversing the big 2009 roll-down<br />
strategy. On the other hand, we have neutral<br />
positioning in 10y Notes (from aggressive shorts at<br />
the start of this year) and slightly short positioning in<br />
Bonds (but again, big reversal from huge shorts in<br />
2009 and in Q1 2010).<br />
Analysis of speculative flows does not confirm either<br />
a current positioning in or a tendency towards a "long<br />
equity / short bonds" macro strategy. Of course,<br />
we're just looking at a limited window of the global<br />
investment spectrum. So, why the discussion about<br />
this macro trade? Look at Chart 3: not only has<br />
S&P's earnings yield outpaced 10y yields since 2002,<br />
but the gap has even widened during the crisis<br />
(currently, the S&P 500 generates a 6.85% yield on<br />
earnings, while 10y Notes yield about 2.60%). Some<br />
argue that on a risk/reward basis the equity trade<br />
does not make sense. In Chart 4, we show a longterm<br />
series of equity vol (VIX) and bond vol (realised<br />
6m weekly 10y US govt bonds). True, bond vol has<br />
dropped from the 2008/2009 excess, but equity vol<br />
has also dropped substantially, while still generating<br />
more yield than bonds.<br />
Conclusion: Do we really believe the Fed is going to<br />
kill stocks? Do we really believe the Fed is going to<br />
kill the Treasury? The answer is a double no. With<br />
rates frozen and unconventional policy in place, a<br />
period of equity and debt performance lies ahead.<br />
-150000<br />
S&P500 net spec positioning<br />
-200000<br />
Nasdaq100 net spec positioning<br />
-250000 Russell2000 net spec positioning<br />
-300000<br />
2003 2004 2005 2006 2007 2008 2009 2010<br />
Source: CFTC<br />
Chart 2: Speculative US Govvie Positioning<br />
800000<br />
650000<br />
TY net spec positioning<br />
TU net spec positioning (RHS)<br />
US net spec positioning (RHS)<br />
250000<br />
150000<br />
500000<br />
50000<br />
350000<br />
200000<br />
-50000<br />
50000<br />
-150000<br />
-100000<br />
-250000<br />
-250000<br />
-400000<br />
-350000<br />
2003 2004 2005 2006 2007 2008 2009 2010<br />
Source: CFTC<br />
Chart 3: Equity vs Bond Valuation Measures<br />
11.0%<br />
10Y Treasury yield<br />
10.0%<br />
S&P500 earnings yield<br />
9.0%<br />
8.0%<br />
7.0%<br />
6.0%<br />
5.0%<br />
4.0%<br />
3.0%<br />
2.0%<br />
1.0%<br />
1987 1990 1993 1996 1999 2002 2005 2008<br />
180<br />
90<br />
160<br />
10Y TSY vol (6M, bp)<br />
VIX (%, RHS)<br />
80<br />
140<br />
70<br />
120<br />
60<br />
100<br />
50<br />
80<br />
40<br />
60<br />
30<br />
40<br />
20<br />
20<br />
10<br />
0<br />
0<br />
1990 1993 1996 1999 2002 2005 2008<br />
Source: <strong>BNP</strong> Paribas<br />
Alessandro Tentori 23 September 2010<br />
Market Mover, Non-Objective Research Section<br />
18<br />
www.GlobalMarkets.bnpparibas.com


