

Market Mover - BNP PARIBAS - Investment Services India
Market Mover - BNP PARIBAS - Investment Services India
Market Mover - BNP PARIBAS - Investment Services India

You also want an ePaper? Increase the reach of your titles
YUMPU automatically turns print PDFs into web optimized ePapers that Google loves.
<strong>Market</strong> Economics | Interest Rate Strategy | Forex Strategy 12 March 2010<br />
<strong>Market</strong> <strong>Mover</strong><br />
<strong>Market</strong> Outlook 2-3<br />
Fundamentals 4-21<br />
• FOMC Preview: Striving for Clarity 4-5<br />
• US Labour <strong>Market</strong>: A Slow 6-8<br />
Turning<br />
• US: Sell Short 9-10<br />
• US: Productivity Growth is 11-12<br />
Soaring<br />
• Germany: The Big Chill 13-14<br />
• UK: Election Update 15<br />
• SNB: Keeping the Ball Rolling 16<br />
• Japan: The Target of Fiscal 17-19<br />
Restructuring<br />
• Japan: Jobless Rate Slips Below 20-21<br />
5%<br />
Interest Rate Strategy 22-42<br />
• US: 3y Agency Sector Still Good 22-23<br />
for Carry<br />
• US: Playing for Wider Spreads in 24<br />
a Sell-Off<br />
• EUR: Further Flattening Ahead 25<br />
• EUR: OAT60 Launched! 26<br />
• EUR: Normalisation in the EGB 27-28<br />
Universe<br />
• EUR Vega: Rolldown<br />
29<br />
Opportunities on 10y Swap<br />
• JGBs: June - A Devil-Plagued 30<br />
Period<br />
• Global Inflation Watch 31-34<br />
• Inflation: Spring Break for 35-36<br />
Breakevens?<br />
• Europe iTraxx Credit Indices 37-39<br />
• Technical Analysis 40-41<br />
• Trade Reviews 42<br />
FX Strategy 43-49<br />
• Strategy: The Way of Wen 41-46<br />
• Technical Strategy: Commodity 47-48<br />
Currency Exhaustion<br />
• Trading Positions 49<br />
Forecasts & Calendars 50-63<br />
• 1 Week Economic Calendar 50-51<br />
• Key Data Preview 52-58<br />
• 4 Week Calendar 59<br />
• Treasury & SAS Issuance 60-61<br />
• Central Bank Watch 62<br />
• FX Forecasts 63<br />
Contacts 64<br />
www.Global<strong>Market</strong>s.bnpparibas.com<br />
• The FOMC meets next week and its ‘big picture’<br />
assessment should be similar to the last as conditions<br />
have not changed much since January’s meeting.<br />
• The Fed is likely to maintain its assertion that<br />
conditions will ‘likely warrant exceptionally low levels of<br />
the federal funds rate for an extended period’.<br />
• The conditions justifying this – including subdued<br />
inflation and stable expectations – remain in place.<br />
• Much of the recent Fed communication has centred on<br />
exit strategies. More information on reserve-draining<br />
operations could be included in the statement.<br />
• Treasury yields have risen with heavy supply and firm<br />
stock markets. The near-term strategy call is neutral. US<br />
data will be plentiful in coming days, including what we<br />
expect will be a weak, weather-affected retail sales report.<br />
• Core eurozone bond markets remain solid but a<br />
positive tone on Treasuries and/or a setback in equities will<br />
be needed for a decisive break below the 3.10-3.20% range<br />
on 10-year Bund yields.<br />
• We continue to favour 2/10s flatteners and expect<br />
further outperformance of peripheral markets.<br />
• Eurozone core HICP inflation should fall to a record low<br />
in February, with the downward pressure to continue as<br />
compensation growth decelerates.<br />
• For JGBs, a growing trend towards extension trades is<br />
likely within the short- to medium-term sector. The 5-yr<br />
sector is likely to be particularly attractive.<br />
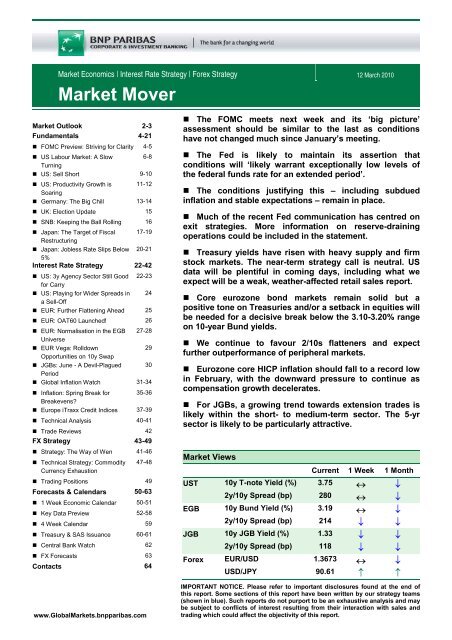
<strong>Market</strong> Views<br />
Current 1 Week 1 Month<br />
UST 10y T-note Yield (%) 3.75 ↔ ↓<br />
2y/10y Spread (bp) 280 ↔ ↓<br />
EGB 10y Bund Yield (%) 3.19 ↔ ↓<br />
2y/10y Spread (bp) 214 ↓ ↓<br />
JGB 10y JGB Yield (%) 1.33 ↓ ↓<br />
2y/10y Spread (bp) 118 ↓ ↓<br />
Forex EUR/USD 1.3673 ↔ ↓<br />
USD/JPY 90.61 ↑ ↑<br />
IMPORTANT NOTICE. Please refer to important disclosures found at the end of<br />
this report. Some sections of this report have been written by our strategy teams<br />
(shown in blue). Such reports do not purport to be an exhaustive analysis and may<br />
be subject to conflicts of interest resulting from their interaction with sales and<br />
trading which could affect the objectivity of this report.
<strong>Market</strong> Outlook<br />
Upward pressure on yields<br />
as equities do well…<br />
Bond yields have been climbing in recent days against a backdrop of heavy<br />
supply and upward moves in the major equity indices and oil prices, which<br />
are now approaching January’s highs. Having taken a bearish stance on<br />
Treasuries ahead of the supply, the strategy call is neutral for the week<br />
ahead. The market ought to regain at least some of its lost ground, however,<br />
if our forecast of a disappointing February US retail sales report is borne out.<br />
As mentioned in these pages before, getting a firm handle on the underlying<br />
state of the US and European economies is being complicated by various<br />
crosswinds at present. The ‘cold snap’ at the start of the year is one such<br />
complication. We expect it to have dampened non-essential retail sales in<br />
the US last month, contributing to our forecast of m/m declines on both a<br />
headline and ex-auto basis (consensus is for positives on both).<br />
…but near-term data flow<br />
ought to be favourable<br />
Another complication is the difference in the performance of large and small<br />
businesses. US data illustrate the contrast. The ISM is elevated, indicative of<br />
the boost for larger companies from their exposure to robust markets outside<br />
the US. Smaller businesses, in contrast, are more dependent on internal<br />
economic conditions and the supply of credit from banks.<br />
The difficulties regarding the latter continue to be reflected in the survey of<br />
independent businesses. The NFIB data also show both capex and hiring<br />
intentions at low levels (Chart 1). As small businesses are a key source of<br />
job creation, this will be an important influence on the Fed’s reaction function<br />
if, as we expect, census effects flatter payroll data in the spring.<br />
Chart 1: Size Matters<br />
15<br />
National Federation of Independent Businesses Survey<br />
10<br />
Hiring Intentions<br />
5<br />
0<br />
-5<br />
-10<br />
-15<br />
Capex Intentions<br />
-20<br />
-25<br />
R elative to M ean<br />
86 87 88 89 90 91 92 93 94 95 96 97 98 99 00 01 02 03 04 05 06 07 08 09<br />
Source : Reuters EcoWin Pro<br />
FOMC to reiterate the<br />
commitment to<br />
exceptionally low rates for<br />
an extended period…<br />
The event calendar gets busier in the coming days, including the meeting of<br />
the FOMC (with the accompanying announcement on Tuesday). Economic<br />
and financial conditions have changed little since the January meeting,<br />
suggesting the ‘big picture’ themes in the statement will not be subject to<br />
radical change. There is scope for a little tweaking though, with the outlook<br />
for business investment a candidate for an upgrade.<br />
The Fed should continue with the assertion that conditions will “likely warrant<br />
exceptionally low levels of the federal funds rate for an extended period.”<br />
The conditions which justify this – “low rates of resource utilization, subdued<br />
inflation trends, and stable inflation expectations” – still prevail. We expect<br />
the February CPI next week to show core inflation falling to 1.4%, matching<br />
the cycle low from August last year.<br />
Ken Wattret 12 March 2010<br />
<strong>Market</strong> <strong>Mover</strong><br />
2<br />
www.Global<strong>Market</strong>s.bnpparibas.com
…and to elaborate on the<br />
exit strategy<br />
Much of the communication from the Fed during the inter-meeting period has<br />
revolved around exit strategies. A number of Fed speakers have described a<br />
possible roadmap to Fed tightening, with reserve-draining operations as the<br />
starting point. The latter issue is likely to become a regular feature of FOMC<br />
statements, probably starting with this one.<br />
Amid a busy week, a range of business surveys for March will be released;<br />
we expect them to remain generally elevated. It will be interesting to see<br />
how NAHB sentiment, i.e. confidence among homebuilders, fares. While up<br />
by about ten percentage points from its lows sentiment is still below the level<br />
seen last autumn – indicative of a faltering housing market recovery despite<br />
the stimulus measures introduced.<br />
EGB curve flatteners and<br />
peripheral outperformance<br />
favoured<br />
Switching to Europe, core eurozone bond markets remain solid but a more<br />
constructive tone on Treasuries and/or a setback in equities will be needed<br />
for a decisive break below the 3.10-3.20% range on 10-year Bund yields.<br />
We continue to favour 2/10s flatteners and expect further outperformance of<br />
peripheral markets.<br />
The imminent release on eurozone industrial production data for January is<br />
set to be strong, highlighting the continued outperformance of externallysensitive<br />
manufacturing sector data. The y/y rate of change in output will fly.<br />
This is base effect driven, however, and central banks should focus on levels<br />
rather than rates of change. Despite the rebound since spring last year,<br />
industrial output in the eurozone is still down by almost 20% from 2008’s<br />
peak.<br />
This is crucial for the recovery and policy. In other words, as output has<br />
fallen by much more than employment even as activity picks up, firms will<br />
not have to raise headcount in response. So the virtuous circle of job gains<br />
and confidence needed to get the economy really motoring will be absent.<br />
The employment data for Q4 next week will show the sixth consecutive q/q<br />
decline, albeit a less pronounced one than in prior quarters.<br />
Core inflation headed<br />
south in the eurozone and<br />
not just this month<br />
5-yr sector preferred in<br />
JGB market<br />
We forecast that core HICP inflation in the eurozone will fall to a record low<br />
of 0.8% in February’s release. An even lower rate was on the cards prior to<br />
the revisions to German data earlier this week but this is merely a matter of<br />
time. As wage growth will continue to moderate as a lagged response to the<br />
increase in unemployment and low headline inflation, unit labour cost growth<br />
will decelerate markedly (and we think, go negative), pushing further down<br />
on core inflation. The ECB is confident that inflation expectations will remain<br />
well anchored. We are much less so.<br />
The JGB market remains in a state of deadlock, but banks' bond investment<br />
plans for the coming fiscal year should require them to take on somewhat<br />
greater risk in search of carry. Hence we anticipate a growing trend towards<br />
extension trades within the short- to medium-term sector (such as a shift out<br />
of 2s into 5s). The 5-yr sector is likely to be particularly attractive in view of<br />
its low volatility. In the near term, JGBs may benefit from tailwinds relating to<br />
the possibility of additional QE and favourable supply-demand conditions.<br />
The 5-yr JGB auction on the 11th attracted solid demand from the domestic<br />
investor base. The JGB market outstanding is projected to increase by some<br />
JPY 27.6 trillion over the course of FY 2010 but maturities up to the 10yr<br />
sector will account for just JPY 11.1 trillion of this total, with the super-long<br />
sector set to account for the lion's share. Super-long yields are therefore<br />
most vulnerable to upward pressure.<br />
Ken Wattret 12 March 2010<br />
<strong>Market</strong> <strong>Mover</strong><br />
3<br />
www.Global<strong>Market</strong>s.bnpparibas.com
FOMC Preview: Striving for Clarity<br />
• Economic and financial conditions have<br />
changed little since the January FOMC meeting,<br />
so we expect little change in the Fed’s<br />
cautiously optimistic tone.<br />
Chart 1: Financial Conditions are Little<br />
Changed on Balance<br />
• With high unemployment and decelerating<br />
core inflation, we think the Fed will continue to<br />
use “extended period” to describe its rate<br />
stance.<br />
• The Fed has indicated decisions about<br />
draining excess reserves will be monetary<br />
policy decisions and we think it may begin to<br />
describe the status of its exit strategies within<br />
the FOMC statement.<br />
Source: Reuters EcoWin Pro<br />
Chart 2: The Fed is Focused on Developing<br />
Reserve Draining Tools<br />
When the FOMC meets next week, it is unlikely its<br />
economic and inflation outlook will have changed<br />
very much since the January meeting. Incoming<br />
economic data have been consistent with its<br />
expectations for a gradual economic recovery and<br />
financial market conditions have not changed much<br />
in recent months. Thus while it may upgrade the<br />
discussion of business spending on equipment and<br />
software, the economic paragraph of their policy<br />
statement is likely to express the same cautiously<br />
optimistic tone which “anticipates a gradual return to<br />
higher levels of resource utilization in a context of<br />
price stability.”<br />
Much of the communication from the Fed during the<br />
inter-meeting period has revolved around exit<br />
strategies. Chairman Bernanke produced a<br />
congressional testimony on the exit strategies under<br />
development in early February, although he didn’t<br />
actually give the testimony in person owing to snow<br />
storms that closed the federal government. While he<br />
discussed the tools they were working on at some<br />
length, he was careful to distinguish the creation and<br />
testing of reserve draining tools from decisions on<br />
monetary policy. He reiterated that economic<br />
conditions will “likely warrant exceptionally low levels<br />
of the federal funds rate for an extended period.”<br />
We expect that language to remain in the statement<br />
released next week. All of the conditions that justify<br />
such a policy, namely “low rates of resource<br />
utilization, subdued inflation trends, and stable<br />
inflation expectations” still prevail. While the<br />
unemployment rate has dipped from 10.0% to 9.7%<br />
since the Fed met last, it is still quite elevated –<br />
Source: Reuters EcoWin Pro<br />
suggesting a considerable amount of unused<br />
resources. Meanwhile, core CPI inflation<br />
unexpectedly dipped to 1.55% y/y in January from<br />
1.82% in December. In this environment, the Fed is<br />
unlikely to see the need to prepare markets for a rate<br />
hike six months down the road. Indeed, in his semiannual<br />
monetary policy testimony, Chairman<br />
Bernanke reiterated that low rates were still needed<br />
to spur the “nascent economic recovery.”<br />
A number of Fed speakers have described a possible<br />
roadmap to Fed tightening as starting with reserve<br />
draining operations that reduce excess reserves from<br />
the current USD 1.1trn to several hundred billion. It is<br />
at this point the Fed feels it will regain control of the<br />
effective fed funds rate (see Chart 2). Brian Sack, the<br />
New York Fed’s head of market operations, said in<br />
recent days that “Removing a portion of the excess<br />
reserves from the system ahead of increasing the<br />
rate paid on reserves is a cautious approach, as it<br />
should improve the Fed's control of short-term<br />
Julia Coronado 12 March 2010<br />
<strong>Market</strong> <strong>Mover</strong><br />
4<br />
www.Global<strong>Market</strong>s.bnpparibas.com
interest rates when it comes time to tighten monetary<br />
policy.” He cited Chairman Bernanke as having<br />
suggested in his testimony that “operations to drain<br />
reserves could be run on a limited basis well ahead<br />
of policy tightening, in order to give market<br />
participants time to become familiar with them, and<br />
then could be scaled up to more significant volume<br />
as we approach the time for policy tightening.” He<br />
also indicated that the Fed feels it will have its<br />
primary tools fully developed by the end of Q2.<br />
Therefore we could see the Fed beginning regular<br />
reverse repo operations in H2.<br />
Recent communication has also indicated that “the<br />
ultimate size and timing of reverse repo operations<br />
will depend on the directive from the Federal Open<br />
<strong>Market</strong>s Committee to conduct such operations.”<br />
This suggests that the status of reserve draining<br />
operations will become a regular feature of FOMC<br />
statements. Indeed, we think the Fed may begin<br />
describing the state of development of its toolkit in<br />
the March FOMC statement. In the January<br />
statement the last paragraph described the status of<br />
the liquidity operations, laying out the schedule for<br />
their phase out. We think that the March statement<br />
may indicate that these liquidity operations have<br />
been successfully completed. It may then include a<br />
brief description of the state of the reserve-draining<br />
tools, much as recent communication has. Going<br />
forward, it would seem likely that the Fed could first<br />
indicate a regular low level of operations to ready the<br />
tools in June or August. It would then likely announce<br />
an acceleration of these operations at the same time<br />
it is ready to step away from the “extended period”<br />
phrasing.<br />
Sack discussed at some length the potential for<br />
reserve draining operations to confuse markets and<br />
lead to increased market volatility. “The burden is on<br />
the Fed to mitigate this risk by communicating clearly<br />
about its policy intentions and the purpose of any<br />
operational moves it might take. In this regard, the<br />
forward-looking policy language that the FOMC is<br />
currently using in its statement is important. I would<br />
argue that this language contains much more direct<br />
and valuable information about the likely path of the<br />
short-term interest rate target than does any decision<br />
about draining reserves. Indeed, it will be difficult for<br />
market participants to make precise inferences about<br />
the timing of increases in the target interest rate from<br />
the patterns of reserve draining alone, in part<br />
because the FOMC has not specified the path of<br />
reserves it intends to achieve before raising interest<br />
rates.” Thus if we are right that these operations will<br />
be included in the March FOMC statement, it should<br />
in no way be construed as a policy signal.<br />
It should<br />
reiterate<br />
their<br />
expectation<br />
for subdued<br />
inflation.<br />
It is likely to<br />
note that that<br />
liquidity<br />
operations have<br />
been<br />
successfully<br />
completed<br />
FOMC Statement January 27, 2010<br />
Information received since the Federal Open <strong>Market</strong> Committee met in December suggests that<br />
economic activity has continued to strengthen and that the deterioration in the labor market is abating.<br />
Household spending is expanding at a moderate rate but remains constrained by a weak labor<br />
market, modest income growth, lower housing wealth, and tight credit. Business spending on<br />
equipment and software appears to be picking up, but investment in structures is still contracting and<br />
employers remain reluctant to add to payrolls. Firms have brought inventory stocks into better<br />
alignment with sales. While bank lending continues to contract, financial market conditions remain<br />
supportive of economic growth. Although the pace of economic recovery is likely to be moderate for a<br />
time, the Committee anticipates a gradual return to higher levels of resource utilization in a context of<br />
price stability.<br />
With substantial resource slack continuing to restrain cost pressures and with longer-term inflation<br />
expectations stable, inflation is likely to be subdued for some time.<br />
The Committee will maintain the target range for the federal funds rate at 0 to 1/4 percent and<br />
continues to anticipate that economic conditions, including low rates of resource utilization, subdued<br />
inflation trends, and stable inflation expectations, are likely to warrant exceptionally low levels of the<br />
federal funds rate for an extended period. To provide support to mortgage lending and housing<br />
markets and to improve overall conditions in private credit markets, the Federal Reserve is in the<br />
process of purchasing $1.25 trillion of agency mortgage-backed securities and about $175 billion of<br />
agency debt. In order to promote a smooth transition in markets, the Committee is gradually slowing<br />
the pace of these purchases, and it anticipates that these transactions will be executed by the end of<br />
the first quarter. The Committee will continue to evaluate its purchases of securities in light of the<br />
evolving economic outlook and conditions in financial markets.<br />
In light of improved functioning of financial markets, the Federal Reserve will be closing the Asset-<br />
Backed Commercial Paper Money <strong>Market</strong> Mutual Fund Liquidity Facility, the Commercial Paper<br />
Funding Facility, the Primary Dealer Credit Facility, and the Term Securities Lending Facility on<br />
February 1, as previously announced. In addition, the temporary liquidity swap arrangements<br />
between the Federal Reserve and other central banks will expire on February 1. The Federal Reserve<br />
is in the process of winding down its Term Auction Facility: $50 billion in 28-day credit will be offered<br />
on February 8 and $25 billion in 28-day credit will be offered at the final auction on March 8. The<br />
anticipated expiration dates for the Term Asset-Backed Securities Loan Facility remain set at June 30<br />
for loans backed by new-issue commercial mortgage-backed securities and March 31 for loans<br />
backed by all other types of collateral. The Federal Reserve is prepared to modify these plans if<br />
necessary to support financial stability and economic growth.<br />
It may upgrade<br />
the assessment<br />
of business<br />
spending on<br />
equipment and<br />
software but the<br />
overall tone is<br />
likely to still be<br />
cautiously<br />
optimistic<br />
The use of<br />
“extended<br />
period” will<br />
remain intact<br />
This paragraph<br />
may be replaced<br />
with a discussion<br />
about the tools<br />
under<br />
development for<br />
reserve draining<br />
operations, with<br />
emphasis that<br />
testing of these<br />
tools should not<br />
be interpreted as<br />
monetary policy<br />
tightening<br />
Julia Coronado 12 March 2010<br />
<strong>Market</strong> <strong>Mover</strong><br />
5<br />
www.Global<strong>Market</strong>s.bnpparibas.com
US Labour <strong>Market</strong>: A Slow Turning<br />
• The February employment report was a<br />
positive surprise in that it confirmed the<br />
ongoing gradual trend toward improvement with<br />
little derailment from winter weather<br />
Chart 1: The Household Survey Has Outpaced<br />
Payrolls of Late<br />
• Stimulus driven growth appears to be giving<br />
way to organic improvement in the private<br />
sector, although troubled sectors continue to<br />
impede progress<br />
• While the February employment report was<br />
a welcome indication that the labour market<br />
continues to improve, the pace of improvement<br />
is gradual and consistent with an extended<br />
period of economic slack that will keep the Fed<br />
on hold.<br />
Source: Reuters EcoWin Pro<br />
Chart 2: Manufacturing Job Losses are Done<br />
The February employment report suggests the<br />
hand-over from stimulus-driven growth to<br />
organic growth is underway, although troubled<br />
sectors mean slow progress<br />
The February employment report on balance had a<br />
more positive tone than markets had expected.<br />
There was only a modest apparent impact from<br />
February snowstorms and private sector job losses<br />
continued to moderate. Temporary hiring remained<br />
strong despite the weather signalling that permanent<br />
hiring in the private service sector is close at hand.<br />
Meanwhile job losses in the construction sector and<br />
among state and local governments show little sign<br />
of slowing. The Census only added 15k workers after<br />
a 9k gain in January. Given its plans to hire 1mn<br />
workers this spring, we should see overall gains in<br />
nonfarm payrolls in the hundreds of thousands<br />
between March and May.<br />
Overall the slowing in job losses in recent months<br />
and a pick up in aggregate hours worked indicate<br />
that households are once again seeing modest gains<br />
in wage and salary income that will help fund further<br />
subdued gains in consumer spending. Thus the<br />
handoff from stimulus driven growth to private sector<br />
driven gains seems to be underway, albeit with<br />
continued headwinds from troubled sectors. The<br />
unemployment rate may have peaked and a slow<br />
and bumpy decline appears to be underway,<br />
although broader measures of labour utilisation still<br />
indicate a huge surplus of willing workers who will<br />
likely continue to put downward pressure on wage<br />
growth.<br />
Source: Reuters EcoWin Pro<br />
Chart 3: Temporary Hiring Continues to Point to<br />
Service Sector Gains<br />
Source: Reuters EcoWin Pro<br />
Julia Coronado 12 March 2010<br />
<strong>Market</strong> <strong>Mover</strong><br />
6<br />
www.Global<strong>Market</strong>s.bnpparibas.com
The stronger household survey numbers may<br />
point to improvement among small businesses;<br />
the impact of weather was less than expected<br />
Nonfarm payrolls fell 36k after a 26k decline, above<br />
consensus expectations for a larger decline. Census<br />
hiring only added 15k, while private sector job losses<br />
eased to 18k from 33k in January. The<br />
unemployment rate held steady at 9.7% (9.687%<br />
unrounded) in contrast to expectations for an uptick.<br />
This is even more impressive as the labour force<br />
participation rate rose to 64.8% from 64.7%.<br />
However, the household survey showed a gain in<br />
jobs of 308k after a 541k increase in January. The<br />
household survey captures small businesses<br />
whereas the payroll survey only captures firms with<br />
more than 1000 workers, so the fact that hiring in the<br />
household survey has been greater than non-farm<br />
payrolls in the first two months of the year may be an<br />
indication that small businesses are hiring.<br />
Weather proved to be less of a factor than many had<br />
anticipated. We had been above the consensus<br />
forecast as we did not think the storms would have<br />
the kind of sizable impact on payrolls that the<br />
January blizzard of 1996 did. For weather to lead to a<br />
job loss in nonfarm payrolls a worker must be on a<br />
weekly pay cycle (mainly manufacturing, temporary<br />
and construction workers), they must have missed<br />
work for an entire week due to weather and didn't get<br />
paid as a result. The January 1996 blizzard was a<br />
single huge storm that wiped out the entire eastern<br />
seaboard, while the February storms during the<br />
survey period for the employment report this year<br />
were two smaller events that affected different<br />
regions over different time frames.<br />
For example, the Northeast Snowfall Impact Scale<br />
from the National Oceanic and Atmospheric<br />
Administration ranks the January 1996 blizzard an<br />
11.78, or extreme, and the 4-7 February storm this<br />
year a 4.3, or major, and the 9-11 February storm a<br />
3.93, also major. Only one, the 9-11 February storm<br />
that hit DC, Baltimore and Philly, really seemed to<br />
shut things down for an entire week. Consequently<br />
the manufacturing sector added 1k jobs after a 20k<br />
gain in January, construction job losses actually<br />
moderated slightly to -64k after -77k a month prior,<br />
and temporary hiring barely skipped a beat with a<br />
gain of 48k after a 50k increase. These areas all saw<br />
a noticeable deviation from trend in January 1996 so<br />
we conclude the impact of weather was modest.<br />
Manufacturing and the private service sector are<br />
where improvements are most noticeable, while<br />
construction and state and local governments<br />
are still firing workers at a rapid clip<br />
Manufacturing is the sector of the economy that has<br />
seen the most robust recovery to date. As shown in<br />
Chart 2, manufacturing activity has rebounded much<br />
Chart 4: Two Sectors in Trouble: Construction<br />
and State & Local Govts<br />
Source: Reuters EcoWin Pro<br />
Chart 5: Wage & Salary Income Picking Up<br />
Source: Reuters EcoWin Pro<br />
Chart 6: The Army of Unemployed is Still<br />
Sizable<br />
Source: Reuters EcoWin Pro<br />
faster than in the prior cycle owing to a combination<br />
of the inventory cycle, the rebound in global trade<br />
and the fact that it probably overcorrected to the<br />
downside at the height of the financial crisis. The<br />
employment index in the ISM survey has been<br />
signalling a strong move into hiring, although it has<br />
not proven to be a reliable indicator of job gains in<br />
recent years. The manufacturing sector has been in<br />
longstanding decline as US firms seek to maintain<br />
margins by moving operations to lower-cost<br />
countries. This trend is likely to continue and we<br />
Julia Coronado 12 March 2010<br />
<strong>Market</strong> <strong>Mover</strong><br />
7<br />
www.Global<strong>Market</strong>s.bnpparibas.com
expect only modest gains in manufacturing<br />
employment.<br />
The private service sector does seem to be moving<br />
gradually but decisively toward job growth Chart 3).<br />
Temporary hiring has been strong, averaging 46k per<br />
month in job creation over the past six months. This is<br />
an indication that many companies have seen activity<br />
recover to the point that they need additional labour but<br />
are not yet willing to commit to permanent employees.<br />
Nonetheless, the relationship between temporary<br />
hiring and permanent private service sector job gains<br />
looks to be intact and suggests a move into positive<br />
territory in the near future. Job losses in the<br />
professional and technical sector, which includes<br />
legal and accounting services among other areas,<br />
appear to be near an end while education and health<br />
care continue to steadily add 30k jobs per month. We<br />
expect the private service sector will carry the burden<br />
of leading the recovery in jobs, but the sector<br />
appears to be at a turning point.<br />
The news is not as good in the construction and state<br />
and local government sectors where job losses show<br />
few signs of slowing. The construction sector has<br />
been affected by the cold and snowy winter that<br />
began in December with the average 3-month job<br />
loss through February at 59k after slowing a little.<br />
However, the hiring numbers are not particularly out<br />
of synch with incoming data on the commercial and<br />
residential real estate sectors where demand<br />
remains weak and supply overhang is still an issue<br />
holding down activity.<br />
State and local governments continue to reel from<br />
the worst budget crisis since the 1930s and they are<br />
shrinking their workforce at an unprecedented rate.<br />
While construction job losses are likely to slow<br />
somewhat in the spring, the prospects for state and<br />
local governments are less clear and these two<br />
sectors will slow the overall recovery in the labour<br />
market through much of the year.<br />
The gains in hours worked in recent months are<br />
starting to produce income gains for consumers,<br />
although the huge surplus of unemployed<br />
workers continues to suggest the Fed will remain<br />
on hold<br />
Aggregate hours worked gave up some of their<br />
recent gains in February, falling 0.6% after rising<br />
1.0% over the prior three months. This is likely where<br />
weather had the biggest impact. For example<br />
manufacturing hours worked fell 0.9% even though<br />
the ISM signalled continued expansion in orders and<br />
activity. We therefore expect to see a significant<br />
rebound in the March report. However, even with the<br />
backtracking in February, hours worked are rising<br />
over the past several months indicating a modest<br />
pick up in wage and salary income for households<br />
(see Chart 5). This makes it likely that we will see<br />
continued modest gains in consumer spending in the<br />
months ahead even as actual job gains pick up only<br />
gradually.<br />
While the unemployment rate held steady, the<br />
expanded U6 unemployment rate rose to 16.8% from<br />
16.5% an indication there is still a considerable<br />
amount of entrenched unemployment. Average<br />
hourly earnings rose a meager 0.1%, and are rising<br />
just 1.9% y/y as the weak labour market keeps<br />
downward pressure on wage growth. These<br />
measures are an indication of how far the labour<br />
market has to go to make up lost ground and<br />
highlight that the Fed is unlikely to raise rates any<br />
time soon despite the improving trend.<br />
The February employment report was a welcome<br />
indication that the labour market continues to<br />
improve and suggests further easing in the risk of a<br />
double dip recession. However the pace of<br />
improvement is gradual and suggestive of healthy<br />
but subdued economic growth relative to prior<br />
recoveries, which means an extended period of<br />
economic slack that will keep the Fed on hold.<br />
Julia Coronado 12 March 2010<br />
<strong>Market</strong> <strong>Mover</strong><br />
8<br />
www.Global<strong>Market</strong>s.bnpparibas.com
US: Sell Short<br />
• The extended and expanded home buyers’<br />
tax credit programme has not yielded the<br />
hoped-for boost to home sales.<br />
Chart 1: Housing Demand Remains Depressed<br />
• Even accounting for negative weather<br />
effects, the underlying trend of housing demand<br />
remains disappointingly weak.<br />
• Existing homeowners must first sell their<br />
current primary residence before purchasing a<br />
new one.<br />
• Almost one-quarter of all residential<br />
properties with mortgages were ‘under water’ in<br />
the last quarter of 2009.<br />
• Homeowners with negative equity are<br />
concentrated in five states: Nevada, Arizona,<br />
Florida, Michigan and California.<br />
• Once a mortgaged property is underwater<br />
by more than 25%, the probability that a<br />
homeowner will default is the same as that for<br />
an investor.<br />
• A new government plan scheduled to take<br />
effect in early April would encourage delinquent<br />
borrowers to get rid of their properties by<br />
means of a short sale.<br />
• This plan should set the stage for a quicker<br />
recovery but lead to a more painful adjustment<br />
in the short-term.<br />
No bang for your buck<br />
Last year, the first-time home buyers’ tax credit (in<br />
effect from January to November 2009) contributed<br />
to successfully lift demand for existing homes.<br />
Indeed, the National Association of Realtors<br />
estimates that 2 million resale properties benefited<br />
from the tax credit in 2009. Given this success, the<br />
tax credit program was extended until the end of April<br />
2010 for mortgages that close in June and expanded<br />
to include more affluent and repeat home buyers. So<br />
far, the second instalment of the programme has not<br />
yielded the hoped-for boost to home sales.<br />
Existing home sales declined by 7.2% m/m in<br />
January, following a 16.2% m/m decline in the<br />
previous month, leaving resale volumes at 5.05mn<br />
annualised units, the lowest level in seven months. In<br />
addition, new home sales plunged by 11.2% m/m in<br />
January to 309k annualised units, falling well below a<br />
previous historical low of 329k reached at the<br />
Source: Reuters EcoWin Pro<br />
beginning of 2009. Adverse winter conditions likely<br />
played a role, suggesting weakness is likely to<br />
intensify in February. Indeed, pending home sales,<br />
which lead developments in resale volumes by one<br />
to two months, declined by 7.6% m/m in January,<br />
suggesting existing home sales are likely to remain<br />
depressed over the next few months.<br />
However, even accounting for negative weather<br />
effects, the underlying trend of housing demand<br />
remains disappointingly weak, as declines in home<br />
sales appear widespread across regions and predate<br />
the heavy snow storms that pummelled the country in<br />
February.<br />
The apparent ineffectiveness of the expanded home<br />
buyers’ tax credit is likely the result of several<br />
reasons. First, because the January to November<br />
2009 tax credit probably borrowed strength from the<br />
future, demand from prospective first-time home<br />
buyers is now lower than it would have otherwise<br />
been. Second, while the tax credit was extended to<br />
existing home owners, this additional pool of<br />
prospective buyers is probably rather shallow as<br />
most homeowners must first sell their current primary<br />
residence before purchasing a new one.<br />
Under water<br />
Given that house prices have declined by around<br />
30% from their peak in mid-2006, a significant share<br />
of homeowners owe more on their mortgage than<br />
their homes are currently worth. According to<br />
FirstAmerican CoreLogic, 24% of all residential<br />
properties with mortgages were in negative equity in<br />
the last quarter of 2009, equivalent to 11.3 million<br />
Anna Piretti 12 March 2010<br />
<strong>Market</strong> <strong>Mover</strong><br />
9<br />
www.Global<strong>Market</strong>s.bnpparibas.com
properties. Worse still, an additional 2.3 million<br />
mortgages were approaching negative equity,<br />
meaning they had less than 5% equity in the home.<br />
Chart 2: Boom and Bust<br />
Homeowners with negative equity are concentrated<br />
in five states: Nevada (with 70% of mortgages<br />
underwater at the end of last year), Arizona (51%),<br />
Florida (48%), Michigan (39%) and California (35%).<br />
Together, these five states had an average negative<br />
equity share of 42% compared to “only” 15% in the<br />
remaining 45 states.<br />
As negative equity increases (because of declining<br />
home values or increasing mortgage debt),<br />
homeowners have a smaller and smaller incentive to<br />
remain current on their mortgage payments, leading<br />
to higher foreclosures rates. In particular,<br />
FirstAmerican CoreLogic found that once a<br />
mortgaged property is underwater by more than<br />
25%, the probability that a homeowners will default is<br />
the same as that for an investor.<br />
Paying you to get out<br />
In the current climate of rising foreclosures, the<br />
administration has so far focused its efforts on<br />
keeping struggling homeowners in their homes by<br />
working with lenders to renegotiate mortgage terms.<br />
This approach has shown disappointing results<br />
especially for deeply underwater loans and for<br />
homeowners who lost their job and might therefore<br />
be unable to remain current on their mortgage<br />
payments even if these are lowered. In contrast, a<br />
new plan scheduled to take effect in early April would<br />
actually encourage delinquent borrowers to get rid of<br />
their properties by means of a short sale, whereby a<br />
property is sold for less than the value of the<br />
mortgage. Participating lenders would have to forgive<br />
the difference between the lower market value of the<br />
home and the higher value of the loan. The aim of<br />
the plan is to streamline and standardise the short<br />
sale process and to facilitate an agreement between<br />
borrowers and lenders. In order to do this, the<br />
government would pay USD 1,500 to homeowners<br />
for “relocation assistance”, while banks would receive<br />
USD 1,000. The plan has a number of advantages<br />
for all interested parties. In addition to receiving a<br />
government cheque, homeowners are likely to see a<br />
much smaller deterioration in their credit score than if<br />
they embarked on a foreclosure process. Lenders<br />
and investors in mortgage pools have the prospect of<br />
receiving a higher payment than they would if the<br />
Source: Reuters EcoWin Pro<br />
Chart 3: Owners’ Equity Rose and Fell with<br />
House Prices<br />
Source: Reuters EcoWin Pro<br />
bank were to repossess the home. Communities<br />
would benefit because homes would be sold rather<br />
than languish empty for months as a target for<br />
vandals waiting for the lender to sell the property.<br />
Details of this plan still have to be finalized and a<br />
number of outstanding issues remain. For example,<br />
many distressed properties have second or even<br />
third mortgages, often with different banks,<br />
suggesting the short-sale process is unlikely to be<br />
straightforward as all parties have to be in<br />
agreement. Nevertheless, by speeding up the<br />
correction, this plan should set the stage for a<br />
quicker recovery. An increase in short sales would<br />
also exert additional downward pressure on prices as<br />
“bad loans” would be worked off quicker than through<br />
the regular foreclosure process. While positive in the<br />
long term, this would lead to a more painful<br />
adjustment in the short term.<br />
Anna Piretti 12 March 2010<br />
<strong>Market</strong> <strong>Mover</strong><br />
10<br />
www.Global<strong>Market</strong>s.bnpparibas.com
US: Productivity Growth Climbing<br />
• Non-farm productivity soared in 2009 well<br />
above trend and is expected to continue rising<br />
in 2010, albeit at a slower pace.<br />
Chart 1: Productivity Growth Picking Up<br />
• Higher productivity and lower unit labour<br />
costs boost profit margins and raise overall<br />
profitability.<br />
• Businesses have turned to capital investment<br />
rather than employment early in the recovery,<br />
which could keep productivity growth strong.<br />
• Another result is that corporate free cash<br />
flow is unusually high, implying a possible<br />
corporate buying spree.<br />
Productivity is booming<br />
Non-farm businesses are enjoying a boom in<br />
productivity growth. In 2009, productivity soared<br />
5.8%, hitting a peak in Q4 when non-farm<br />
productivity was up 6.9%. Businesses continued<br />
slashing payrolls and cutting hours worked through<br />
the end of last year despite significant growth in<br />
output. In Q4 2009, non-farm business output<br />
jumped 7.6%. Some of this surge in productivity is a<br />
normal cyclical phenomenon; however, the recent<br />
pick-up in equipment and software investment<br />
suggests some capital deepening that could keep<br />
productivity rising.<br />
Plunging labour costs boost profitability<br />
The major benefit from above-trend growth in<br />
productivity is significantly lower unit labour costs.<br />
Lower labour costs raise domestic competitiveness in<br />
global markets and make a substantial boost to<br />
corporate profitability. In the fourth quarter of 2009,<br />
unit labour costs were down 4.7% y/y, creating a very<br />
positive environment for corporate profitability.<br />
Margins, estimated as the non-farm price per unit<br />
less the estimated total unit costs, jumped by 1.3%<br />
y/y in Q4, one of the largest annual increases in the<br />
past 60 years. In addition to lower labour costs,<br />
which are the largest cost component of business,<br />
and greater profitability, the boom in productivity will<br />
enable companies to absorb any other input price<br />
increases. For example, increases in commodity<br />
prices (or other import prices) can be absorbed<br />
without having to pass along these cost increases<br />
into final prices in a very competitive domestic<br />
market place.<br />
Domestic profits up in 2009<br />
In the previous expansion, the growth in corporate<br />
profits had come mainly from the external sector. In<br />
contrast, in the first few quarters of the current<br />
Source: Reuters EcoWin Pro, <strong>BNP</strong> Paribas<br />
Chart 2: <strong>Investment</strong> in Equipment Forecast to<br />
Grow<br />
Source: Reuters EcoWin Pro, <strong>BNP</strong> Paribas<br />
Chart 3: Rising <strong>Investment</strong> Can Lead to Greater<br />
Productivity<br />
Source: Reuters EcoWin Pro, <strong>BNP</strong> Paribas<br />
expansion, profits from international operations were<br />
still declining with all of the profit growth in the past<br />
three quarters coming from domestic sources. In<br />
2009, profits from domestic operations increased in<br />
every quarter and now account for 76% of the total<br />
(having dropped to a low of 70% in 2008). Financial<br />
Brian Fabbri 12 March 2010<br />
<strong>Market</strong> <strong>Mover</strong><br />
11<br />
www.Global<strong>Market</strong>s.bnpparibas.com
profits soared in 2009, growing by an estimated<br />
215%, albeit from the exceptionally low level reached<br />
in 2008 when banks were under siege. Domestic<br />
non-financial profits also grew in 2009, but much<br />
more slowly; they only started to rise in Q2. For the<br />
full year, they rose by an estimated 7.7%. The restof-world<br />
profits at US non-farm corporations fell in<br />
the first half and began rising in Q3. For the year,<br />
profits from rest-of-world operations are estimated to<br />
have been roughly flat y/y, as a return to world trade<br />
growth in H2 2009 helped make US affiliates abroad<br />
profitable again.<br />
Profits’ share going higher<br />
The boost to corporate profits came at the expense<br />
of labour. Profits’ share of national income jumped to<br />
an estimated share of 11.1% in Q3 of 2009, while<br />
labour compensation’s share sank to 63.2%. The<br />
profits outlook for this year is also promising. Growth<br />
in private payrolls will probably strengthen throughout<br />
the year, but at a relatively slow pace compared with<br />
output growth. Businesses usually take a significant<br />
amount of time before they run out of opportunities to<br />
produce incremental productivity. When they<br />
eventually do, they shift to accelerated hiring to<br />
maintain output growth. Business cycle history<br />
suggests that this time lag fluctuates between one<br />
and two years. Thus, profits’ share of national<br />
income probably will rise further and challenge the<br />
peak proportion (13.7%) reached in Q3 2006.<br />
<strong>Investment</strong> begins first<br />
Non-farm businesses have turned first to investment<br />
in new capital early in the recovery to garner further<br />
productivity-boosted profits rather than to<br />
employment. In contrast, new investment in<br />
commercial real estate is unlikely to begin for at least<br />
another year given the significant supply overhang<br />
and difficult financing conditions in this sector.. In<br />
past expansions, once business began increasing<br />
investing in equipment, growth has been many times<br />
larger than overall GDP growth. For example, in the<br />
expansion of the 1980s, capital investment jumped to<br />
nearly 20% in the 12 months after the start of the<br />
new expansion and then decelerated thereafter. In<br />
the 1990s, accelerated expansion of capital<br />
investment in equipment started about 18 months<br />
after the end of the 1991 recession, but remained<br />
well above trend growth for several years. In the last<br />
expansion, business took longer before committing to<br />
faster-than-trend growth in equipment investment<br />
partly because of the Sarbanes Oxley law of 2002<br />
and the overhang from the previous investment<br />
boom. Above-trend investment growth finally started<br />
in 2005, three years into the expansion.<br />
Record corporate free cash flow<br />
Chart 4: Domestic Profits Surging<br />
Source: Reuters EcoWin Pro, <strong>BNP</strong> Paribas<br />
Chart 5: Profits Share is Rising<br />
Source: Reuters EcoWin Pro, <strong>BNP</strong> Paribas<br />
Chart 6: Corporate Free Cash Flow is Soaring<br />
Source: Reuters EcoWin Pro, <strong>BNP</strong> Paribas<br />
enjoying an unprecedented free cash flow position.<br />
Chart 6 highlights the extraordinarily flush position<br />
US corporations are enjoying relative to their free<br />
cash position over the past 60 years. Free cash flow<br />
is defined as retained earnings less capital<br />
investment and in Chart 6 is shown as a ratio to<br />
GDP. Clearly, non-farm businesses are in a rare<br />
position to use this free cash flow to increase<br />
investment in productivity-enhancing IT, and to<br />
engage in strategic acquisitions. Consequently, we<br />
estimate that business investment in equipment and<br />
software will surge over the next two years, rising by<br />
an annual rate of double its long-term average<br />
growth (7.1%) in 2010 and 2011 before easing to<br />
In this cycle, non-financial corporations are not<br />
burdened with new legislation, or recovering from the<br />
aftermath of an investment boom, as they were at the<br />
beginning of the last decade. Moreover, they are above-average growth in 2012.<br />
Brian Fabbri 12 March 2010<br />
<strong>Market</strong> <strong>Mover</strong><br />
12<br />
www.Global<strong>Market</strong>s.bnpparibas.com
Germany: The Big Chill<br />
• Construction activity has been hit very hard<br />
by exceptionally cold weather early in Q1.<br />
• This increases the risk of a q/q contraction<br />
in GDP in Q1, though other indicators have been<br />
more positive for growth.<br />
• The manufacturing sector is doing well, with<br />
survey strength now starting to pass through to<br />
‘hard’ data such as new orders.<br />
25<br />
20<br />
15<br />
10<br />
5<br />
0<br />
-5<br />
-10<br />
Chart 1: Construction Output (% q/q)<br />
-15<br />
Data distortions<br />
The economic activity data in the eurozone can be<br />
noisy at the best of times and, in the period since the<br />
global financial crisis, it has been deafening. It is not<br />
likely to quieten down any time soon given the<br />
combination of: distortions related to the introduction<br />
and expiry of various growth stimuli; divergence of<br />
national and sectoral activity trends; and the time of<br />
year. Aspirin, please!<br />
Shaded Area = GDP Contractions<br />
-20<br />
91 92 93 94 95 96 97 98 99 00 01 02 03 04 05 06 07 08 09<br />
Source: Reuters EcoWin Pro<br />
Chart 2: Construction Output & Expenditure<br />
25<br />
12.5<br />
20<br />
Construction Output (% q/q)<br />
10.0<br />
15<br />
7.5<br />
10<br />
5.0<br />
The turn of the year is particularly problematic for the<br />
activity data in Germany given the disruption caused<br />
by the weather. Data watchers in Germany will be all<br />
too familiar with the confusion caused by periods of<br />
weather-induced volatility in the past.<br />
5<br />
0<br />
-5<br />
-10<br />
-15<br />
Construction Expenditure (% q/q RHS)<br />
2.5<br />
0.0<br />
-2.5<br />
-5.0<br />
-7.5<br />
A particularly painful example occurred in early 2008<br />
when unusually mild winter weather early in the year<br />
prompted a bringing forward of construction sector<br />
activity in Germany, contributing to a misleadingly<br />
robust expansion in GDP. The strong GDP figures for<br />
Q1 were released in mid-Q2 and were a contributory<br />
factor to the ECB’s decision to increase its<br />
refinancing rate just as the global financial crisis was<br />
intensifying.<br />
Cold snap hits construction<br />
The opposite effect is now happening, with the<br />
exceptionally cold weather in Germany at the start of<br />
the year now starting to make its presence felt in the<br />
construction-related data. Output in the sector fell by<br />
a massive 14% m/m in January, the second biggest<br />
m/m fall in the series' history.<br />
A q/q contraction in double digits looks very likely for<br />
construction output in Q1. By way of illustration, if<br />
output in the sector was flat in both February and<br />
March, the q/q decline in Q1 would be in the region<br />
of 15%. As we know that the weather was also<br />
unfavourable in February, another fall is possible in a<br />
month’s time.<br />
-20<br />
91 92 93 94 95 96 97 98 99 00 01 02 03 04 05 06 07 08 09<br />
Source: Reuters EcoWin Pro<br />
On the three occasions in the past two decades that<br />
a double-digit q/q decline in construction output has<br />
occurred, in Q1 1996, Q1 1997 and Q2 2008, GDP<br />
registered a q/q contraction (Chart 1).<br />
In its latest press conference, the ECB explicitly cited<br />
adverse weather in some parts of the eurozone as a<br />
downside risk to growth in Q1.<br />
Measuring the impact<br />
Based on the national accounts data for Germany,<br />
construction spending currently accounts for just<br />
under half of total gross fixed capital formation on a<br />
constant price basis. Its share of GDP on the same<br />
basis is roughly 10%.<br />
A complication is that large changes in construction<br />
output have not passed fully into the changes in<br />
construction expenditure (Chart 2). The pass-through<br />
from output to expenditure data in the past has<br />
typically been about half.<br />
-10.0<br />
Ken Wattret 12 March 2010<br />
<strong>Market</strong> <strong>Mover</strong><br />
13<br />
www.Global<strong>Market</strong>s.bnpparibas.com
Assuming this relationship holds, a 10% q/q decline<br />
in construction output in Q1 would translate into a 5%<br />
q/q fall in expenditure. Given the latter’s share in<br />
GDP, this would imply a drag on GDP of around half<br />
a percentage point. It could be bigger still, of course,<br />
if construction output fails to rebound in the next<br />
couple of months.<br />
Sliding surplus<br />
German trade data for January also augur poorly for<br />
Q1 GDP, with the monthly surplus almost halving. It<br />
fell from EUR 16.6bn in December to EUR 8.7bn, the<br />
lowest surplus in almost a year.<br />
65<br />
60<br />
55<br />
50<br />
45<br />
40<br />
35<br />
30<br />
Chart 3: Divergent PMIs<br />
Manufacturing<br />
<strong>Services</strong><br />
98 99 00 01 02 03 04 05 06 07 08 09 10<br />
Exports unexpectedly collapsed by 6.3% m/m in<br />
January following a series of robust gains since last<br />
spring. The fall was one of the biggest on record and<br />
goes against the positive indicators of global trade<br />
dynamics recently: e.g. a surge in world trade<br />
volumes as reported by the CPB in the Netherlands<br />
and much improved manufacturing surveys including<br />
the PMI in Germany. Given this, the drop in January<br />
looks like a blip and could well be another weatherrelated<br />
distortion.<br />
Positive pointers<br />
The recent bad news from the construction and trade<br />
data does not guarantee a negative q/q outcome for<br />
German Q1 GDP as other factors are more positive.<br />
One is the likelihood of at least a partial reversal of<br />
the unusually large drag on Q4’s q/q growth rate from<br />
inventories (in excess of a percentage point).<br />
Recent strength in domestic capital goods orders<br />
also suggests that capex might bounce back in Q1,<br />
having fallen unexpectedly sharply in Q4.<br />
Source: Reuters EcoWin Pro<br />
125<br />
119<br />
113<br />
107<br />
101<br />
95<br />
89<br />
83<br />
77<br />
Chart 4: Level of Orders & Output<br />
Source: Reuters EcoWin Pro<br />
Manufacturing Orders<br />
(Index 2000 = 100, 3Mth Lag, RHS)<br />
Industrial Production<br />
(Index 2000 = 100)<br />
133<br />
123<br />
113<br />
103<br />
93<br />
83<br />
73<br />
63<br />
Amid the various crosswinds, it is going to be more<br />
difficult than usual to get a handle on the underlying<br />
trend in activity. In short, we see it like this: the more<br />
externally-sensitive manufacturing sector data will do<br />
comparatively well but the consumer-driven data will<br />
struggle and, in the absence of a pick up in the latter,<br />
the expansion will remain subdued.<br />
The contrast between the two is illustrated in the<br />
recent divergence of the manufacturing and services<br />
PMIs in Germany (Chart 3). The improvement in the<br />
manufacturing data has not been confined to the<br />
surveys alone.<br />
The m/m rise in manufacturing orders in Germany in<br />
January was a whopping 4.3%, well above market<br />
consensus expectations and the strongest increase<br />
of the expansion to date. The orders data got Q1 off<br />
to a very strong start. Even given flat m/m outcomes<br />
in February and March, the q/q increase in orders in<br />
Q1 would be around 4%.<br />
Domestic orders surged by a remarkable 7.1% m/m<br />
in January, the second biggest increase on record.<br />
Domestic orders for capital goods specifically were<br />
even stronger still, rising by a mammoth 10% m/m –<br />
hence the prior mention of the possibility of a Q1<br />
rebound in capex.<br />
In perspective<br />
A note of caution, however. The y/y rate of increase<br />
in German manufacturing orders is now running at<br />
almost 20% but this rate of increase is being flattered<br />
by base effects related to the collapse in activity in<br />
the corresponding period of last year during the<br />
intensification of the financial crisis.<br />
Note also that the level of orders and output in<br />
Germany remains well down on the pre-crisis peaks<br />
(Chart 4). Despite the rebound in industrial output<br />
since last spring, it is still down by almost 20% in net<br />
terms from its 2008 high.<br />
Ken Wattret 12 March 2010<br />
<strong>Market</strong> <strong>Mover</strong><br />
14<br />
www.Global<strong>Market</strong>s.bnpparibas.com
UK: Election Update<br />
• The Budget will be delivered on 24 March.<br />
Chart 1: UK Political Opinion Polls<br />
• We expect the latest net borrowing estimate<br />
to be revised down, though the government is<br />
likely to spend at least some of this ‘windfall’.<br />
• Recent opinion polls continue to highlight<br />
the significant risk of a hung parliament.<br />
Under starter’s orders…<br />
Gordon Brown moved closer to announcing the date<br />
of the general election this week by confirming the<br />
Budget will be delivered on 24 March. That is likely to<br />
be one of the final key set pieces ahead of firing the<br />
starting pistol for the election campaign by dissolving<br />
parliament. As such, and with very little leeway on<br />
the public finances, we expect the Budget to be<br />
heavy on politics and light on substance. Our full<br />
Budget preview will be published next week. Having<br />
seen the Conservatives’ rating in the opinion polls<br />
slip in recent months, we think the Chancellor will not<br />
deviate from the strategy set out so far. Part of the<br />
erosion in the Conservatives’ lead has probably<br />
resulted from its promise to tackle the budget deficit<br />
more aggressively, thus delivering more pain.<br />
When announcing the date of the Budget, Brown<br />
highlighted that the pay of senior civil servants (and<br />
senior military personnel) will be frozen. Moreover<br />
the prime minister said that the Budget would give<br />
more details on how the deficit will be cut – i.e.<br />
attempting to add some substance to the<br />
government’s claim that it would halve the deficit in<br />
the next four years. There may also be some token<br />
giveaways. If the Chancellor announces even<br />
tougher fiscal tightening, it will blur the dividing lines<br />
between the two main parties and undermine the<br />
Labour Party’s criticism of the Tories’ tougher stance.<br />
The greater than expected windfall from the raid on<br />
bankers’ bonuses (around GBP 2bn) is likely to be<br />
channelled towards ‘deserving causes’. Furthermore,<br />
although the latest month’s public finances data were<br />
awful, the prior months’ outcomes were surprisingly<br />
robust. In fact, we suspect that the Chancellor could<br />
revise down the estimate of Public Sector Net<br />
Borrowing (PSNB) for the 2009/10 fiscal year of GBP<br />
178bn by as much as GBP 10bn. However, it seems<br />
likely that at least part of the ‘windfall’ is spent<br />
supporting the recovery and thereby increasing<br />
Labour’s chances at the election.<br />
Opinion poll update<br />
If the election date is 6 May as most expect, the<br />
latest the election can be called is 12 April. More<br />
Source: UKpollingreport.co.uk<br />
Chart 2: Opinion Polls – Recent Evolution<br />
Source: UKpollingreport.co.uk<br />
likely, the announcement will come a few days<br />
earlier.<br />
Recent opinion polls have shown that the<br />
Conservatives’ lead continues to narrow. For March<br />
so far, the average lead is down to 6pp from 8pp in<br />
February and 10.5pp in January (Chart 1). Two polls<br />
have shown the lead down to just 2pp, with the<br />
biggest margin of any poll at just 9pp. Translating the<br />
latest polls into seats in the House of Commons<br />
gives the Conservatives roughly 298 seats – 28 short<br />
of an overall majority. Labour are on 276 seats with<br />
the Liberal Democrats on 46.<br />
These polls reinforce our view that the most likely<br />
outcome is a hung parliament. We suspect that the<br />
Conservatives will opt to govern as a minority<br />
government with tacit support from the Liberal<br />
Democrats. However, if the Conservatives’ lead in<br />
the polls continues to narrow, there is a significant<br />
risk of a Labour-Lib Dem coalition. After all, in the<br />
first instance, it is the incumbent prime minister that<br />
gets the first choice to set up a government.<br />
Alan Clarke 12 March 2010<br />
<strong>Market</strong> <strong>Mover</strong><br />
15<br />
www.Global<strong>Market</strong>s.bnpparibas.com
SNB: Outlook Firming<br />
• The SNB left rates on hold as expected.<br />
Chart 1: SNB Policy Rates<br />
• The growth outlook was revised higher, with<br />
the back end of the inflation projection rising by<br />
virtue of the forecast moving forward a quarter.<br />
• We continue to expect the first hike in Q3,<br />
but its timing remains sensitive to<br />
developments in the franc.<br />
‘Expansionary’ monetary policy maintained<br />
As widely expected, the SNB left rates on hold in<br />
March, maintaining its target for 3m Libor towards the<br />
bottom of the 0-0.75% range. An apparent softening<br />
of the language on FX intervention appears to have<br />
been a translation error but there was an upward<br />
revision to the growth outlook. The furthest point of<br />
the inflation projection also moved higher, by virtue of<br />
the forecast kicking on by one quarter.<br />
The key points of the press release accompanying<br />
March’s decision are as follows:<br />
1. An apparent adjustment in the language on FX<br />
intervention appears to have been a translation<br />
error.<br />
The statement said the SNB will act decisively to<br />
prevent “an excessive appreciation” rather than “any<br />
excessive appreciation” of the Swiss franc against<br />
the euro. However, the German press release carried<br />
an identical statement on intervention to the<br />
December press release.<br />
2. The central bank upgraded its assessment of<br />
the economic recovery…<br />
First, the signs of an economic recovery are now<br />
“becoming more tangible” rather than just “gathering<br />
strength”. Second, and more importantly, the SNB<br />
revised its forecast for growth this year to “about<br />
1.5%” – in line with our forecast. This had looked<br />
inevitable; after Q4’s 0.7% q/q GDP print, the SNB’s<br />
previous forecast for 2009 growth of 0.5-1.0% could<br />
have been achieved even with zero growth each<br />
quarter through 2010.<br />
3. ...but maintained a cautious tone<br />
Despite this more positive assessment of the<br />
recovery, the SNB maintained its cautious language<br />
about the outlook. The revival in the economy<br />
“remains fragile” and “is associated with<br />
uncertainties”. The central bank sees the global<br />
economy as on “a moderate upward trend”, and<br />
differentiated between “surprisingly positive” growth<br />
Source: Reuters EcoWin Pro<br />
in the US and the “disappointing” performance in<br />
Europe.<br />
4. The inflationary risk posed by strong money<br />
growth was explicitly addressed<br />
One of the key elements of our argument that the<br />
SNB will hike well before the ECB is that, with no<br />
signs of a credit crunch in the economy, the slug of<br />
narrow money created over the past year represents<br />
a more significant risk to medium-term price stability<br />
than elsewhere. This was acknowledged in the press<br />
release: “Although the monetary base has declined, it<br />
is still very high…[and] needs to be reduced in good<br />
time”. So too was the fact that mortgage lending has<br />
actually been accelerating, with the SNB requesting<br />
banks and borrowers “to be extremely cautious, in<br />
view of the growth in mortgage loans and the<br />
continuing increase in residential real estate prices”.<br />
5. The inflation forecast was changed only<br />
marginally<br />
The inflation forecast was revised up marginally near<br />
term (reflecting the surprise to GDP) but was revised<br />
down marginally in the medium term. The back end<br />
is now higher at 2.75% (2.55% in December), purely<br />
by virtue of the forecast kicking on by one quarter.<br />
As we wrote last week, we expect the SNB to hike<br />
only when it is confident that the economy will be<br />
resilient to the additional currency appreciation the<br />
first hike will likely bring. Comments on the fragility of<br />
the recovery in the press release suggest the SNB<br />
does indeed want further confirmation of the vibrancy<br />
of the rebound. We expect it to get such<br />
confirmation. Our forecast for the first hike remains<br />
Q3, but the timing remains sensitive to developments<br />
in the franc.<br />
Eoin O’Callaghan 12 March 2010<br />
<strong>Market</strong> <strong>Mover</strong><br />
16<br />
www.Global<strong>Market</strong>s.bnpparibas.com
Japan: The Target of Fiscal Restructuring<br />
• When drawing up plans for fiscal<br />
rehabilitation, assumptions about the nominal<br />
growth rate and the nominal interest rate are<br />
very important: assuming the interest rate will<br />
stay below the growth rate creates the condition<br />
of dynamic inefficiency, wherein bubble<br />
formation is common; assuming that the<br />
interest rate will stay above the growth rate is<br />
the conservative way of not exposing state<br />
finances to such unnecessary risk.<br />
• If the public debt is not that great, the goal<br />
of fiscal restructuring could be merely achieving<br />
a primary balance surplus, as that would stop<br />
the debt-to-GDP ratio from climbing.<br />
• But Japan’s public debt is so huge that the<br />
target should be to steadily lower the debt-to-<br />
GDP ratio, something that requires a primary<br />
balance surplus of 1-2% of GDP.<br />
• That said, the debt-to-GDP ratio (stock<br />
indicator) will continue to creep higher until the<br />
primary balance (flow indicator) turns positive.<br />
In the meantime, the market, if its attention is<br />
directed to the debt-to-GDP ratio, could judge<br />
that fiscal discipline is lacking, leading to<br />
upward pressure on yields.<br />
• Thus, while it is appropriate to set the debtto-GDP<br />
ratio as the ultimate target of fiscal<br />
restructuring, it is important that the primary<br />
balance be concurrently made a medium-term<br />
target and to encourage the market to focus<br />
more on the latter.<br />
Hatoyama government mulls plans for fiscal<br />
restructuring<br />
In Japan: Recommendations for Fiscal Reform in last<br />
week’s <strong>Market</strong> <strong>Mover</strong>, we indicated that the<br />
Hatoyama government is considering a framework<br />
for medium-term fiscal spending and a strategy for<br />
long-term fiscal management. With respect to the<br />
framework for spending, I argued that “pay-as-yougo”<br />
must be the guiding principle to ensure that only<br />
new spending programmes that are fully-financed are<br />
included in the budget for FY 2011 through 2013 (if<br />
the programmes cannot be fully financed, they<br />
should be subject to micro-level vetting just like other<br />
spending requests). As for the fiscal management<br />
strategy, we stated that the long-term goal should be<br />
to achieve a sufficiently large primary surplus (say 1-<br />
Chart 1: Public Debt and Primary Fiscal Balance<br />
(Central + Local governments, % of Nominal GDP)<br />
4<br />
2<br />
0<br />
-2<br />
-4<br />
-6<br />
-8<br />
-10<br />
primary fiscal balance<br />
1981<br />
19922002<br />
20022007<br />
2009<br />
2010<br />
40 60 80 100 120 140 160 180<br />
long-term national debt, end of previous fiscal year<br />
Source: MOF, Cabinet office, <strong>BNP</strong> Paribas<br />
Note(1) National debt trough FY2008: end-of-year statements; FY 2009:<br />
supplementary budget basis. (2) Primary balance: Cabinet Office estimates.<br />
4<br />
2<br />
0<br />
-2<br />
-4<br />
-6<br />
-8<br />
-10<br />
Chart 2: GDP and Nomura-BPI (JGB) (%)<br />
NOMURA-BPI(JGB)<br />
00 01 02 03 04 05 06 07 08 09<br />
Source: Bloomberg, <strong>BNP</strong> Paribas<br />
Nom inal GDP (% y/y)<br />
2%) to ensure that the public debt (as a share of<br />
GDP) is steadily falling.<br />
According to government estimates, the deficit in the<br />
primary balance of the central and local governments<br />
combined in FY 2010 should be 7.1% of GDP, and<br />
the timeframe for achieving a primary surplus of<br />
1~2% seems to be around the turn of the current<br />
decade. The reason for the large deficit in 2010 is not<br />
only declining tax revenue but also the Hatoyama<br />
government’s plans to introduce new permanent<br />
spending programmes to be financed by tapping into<br />
“hidden” reserves as well as the issuance of deficitfinancing<br />
bonds. In this report, I intend to clarify the<br />
relationship between such key concepts as “primary<br />
balance,” “fiscal balance,” “balance of public debt”<br />
and “debt-to-GDP ratio.” The first two are flow<br />
indicators, and the latter two are stock indicators.<br />
Ryutaro Kono 12 March 2010<br />
<strong>Market</strong> <strong>Mover</strong><br />
17<br />
www.Global<strong>Market</strong>s.bnpparibas.com
Primary balance equilibrium means benefitsburdens<br />
balanced that year<br />
Beginning with a basic definition, a deficit in the fiscal<br />
balance usually equals the volume of new JGB<br />
issuance. The primary balance is the fiscal balance<br />
that is reached after subtracting “expenditures<br />
excluding interest payment and debt redemption” (i.e.<br />
primary expenditures) from “tax and other revenues<br />
excluding bond revenue” (i.e. primary revenue). In<br />
other words, the primary balance indicates whether<br />
“expenditures for the year” are covered by the “tax<br />
revenue for the same year.” If equilibrium is achieved,<br />
benefits and burdens in that specific year are<br />
balanced (and there is no “bill” for future generations<br />
to pay).<br />
Assumption must be that “interest rate growth<br />
rate”<br />
When drawing up plans for fiscal rehabilitation,<br />
assumptions about the nominal growth rate and the<br />
nominal interest rate are very important. In this report,<br />
we will assume that “interest rate growth rate”,<br />
although history shows that the relationship between<br />
the two is not necessarily fixed. Fiscal restructuring<br />
tends to lose urgency when the nominal growth rate is<br />
constantly higher than the nominal interest rate. The<br />
reason is that the expanding nominal GDP enlarges<br />
the tax base, thereby increasing tax revenue and<br />
making it easier to deal with the public debt in the<br />
future, rather than now. In this way, the fortunate<br />
scenario of “nominal growth nominal interest rate”<br />
could justify delaying fiscal reform, including the<br />
overhaul of the spending/revenue structure.<br />
“Interest rate < growth rate” creates situation<br />
conducive to bubbles<br />
But since the turn of the century, the yield on JGBs<br />
has usually been much greater than the nominal<br />
growth rate, as shown in Chart 2, in which JGB yields<br />
are not the 10-year debt but the Nomura-BPI (JGB),<br />
an index that measures the movement of the<br />
average duration of government bonds in the<br />
secondary market. Meanwhile, as indicated in other<br />
reports, when the interest rate falls below the growth<br />
rate, you have a condition of dynamic inefficiency,<br />
wherein economic resources are not utilised most<br />
efficiently, creating an environment conducive to<br />
bubble formation. Plans for fiscal restructuring should<br />
not be based on assumptions of such abnormal<br />
economic/financial conditions. When drawing up<br />
plans for fiscal rehabilitation, the assumptions must<br />
be conservative so as to never expose state finances<br />
to unnecessary risk.<br />
Equilibrium in the primary balance is not the<br />
ultimate objective<br />
Chart 3 gives the relationship between “primary<br />
balance,” “fiscal balance,” “outstanding public debt”<br />
and “debt-to-GDP ratio.” Situation 1 is Japan’s<br />
Chart 3: Relationship between Four Key Fiscal<br />
Indicators<br />
(Current<br />
situation)<br />
<br />
<br />
primary balance<br />
PB0<br />
PB0<br />
(equilibrium)<br />
PB(nominal interest<br />
rate - nominal GDP)<br />
×debt outstanding<br />
fiscal balance<br />
Current fiscal deficit<br />
Debt service<br />
Debt serviceA<br />
trn. Yen<br />
debt-to-GDP ratio<br />
increase<br />
increase<br />
PBDebt service ± 0 fall<br />
Outstanding debt<br />
expand<br />
(faster than nominal<br />
interest rates)<br />
expand<br />
(at nominal interest rate)<br />
expand<br />
(at nominal GDP rate)<br />
PBInterest payments Debt redemption costs<br />
fall flat<br />
decline<br />
(Debt redemption costs)<br />
Source: MOF, “Decide now, Japan’s fiscal crisis won’t wait!” (p.56), <strong>BNP</strong><br />
Paribas<br />
Chart 4: Level of Primary Balance<br />
in Situations 1-5<br />
Fiscal balance=0 <br />
Rate of increase in outstanding<br />
debt=0 <br />
Debt-to-GDP ratio=0 <br />
PB=0 <br />
Current situation <br />
Revenues<br />
Bond revenues<br />
Tax revenue<br />
current condition: the primary balance is in deficit, the<br />
fiscal balance is greatly in deficit, and both the<br />
balance of public debt and debt-to-GDP ratio are<br />
rapidly rising. Situation 2 is where the deficit has<br />
been erased in the primary balance (i.e. equilibrium).<br />
Now the fiscal balance is still in deficit, but the level<br />
has been reduced to that of debt servicing costs<br />
(interest payments and debt redemption).<br />
Consequently, the public debt is only increasing by<br />
an amount equal to interest payments. In other words,<br />
the debt is increasing at the speed of the nominal<br />
interest rate, which (given our assumption that<br />
interest rate nominal growth) means the debt-to-<br />
GDP ratio continues to steadily rise. Some might feel<br />
that equilibrium in the primary balance should the<br />
aim of fiscal rehabilitation, but the fact that the public<br />
debt is still growing in this situation 2 makes it clear<br />
that equilibrium cannot be the final goal.<br />
Situation 3 is where the primary balance registers a<br />
surplus, allowing the debt-to-GDP ratio to stabilise.<br />
Here, the public debt is still rising, but the rate of<br />
growth matches that of nominal growth, enabling the<br />
debt-to-GDP ratio to stop climbing. Situation 4 is<br />
where the surplus in the primary balance has risen to<br />
flat<br />
Expenditures<br />
Debt redemption<br />
Interest payment<br />
General<br />
expenditures<br />
Debt<br />
service<br />
Source: “Decide now, Japan’s fiscal crisis won’t wait!” (p.57), <strong>BNP</strong> Paribas<br />
Ryutaro Kono 12 March 2010<br />
<strong>Market</strong> <strong>Mover</strong><br />
18<br />
www.Global<strong>Market</strong>s.bnpparibas.com
the level of bond interest payments. Since the fiscal<br />
deficit is now equal to debt redemptions, the public<br />
debt is no longer swelling, meaning the debt-to-GDP<br />
ratio will steadily fall. Situation 5 is where the surplus<br />
in the primary balance has risen to the level of debt<br />
servicing costs (interest payments and debt<br />
redemption), meaning the fiscal balance is now in<br />
equilibrium. Now, not only is the debt-to-GDP ratio<br />
steadily falling, but the public debt is also declining.<br />
Aim is primary balance surplus that causes debtto-GDP<br />
ratio to fall<br />
Now, if the public debt is not that great to begin with,<br />
the goal could be achieving situation 3, where the<br />
primary balance maintains a surplus that allows the<br />
debt-to-GDP ratio to stop climbing (the public debt<br />
does not have to be cut to zero, it is only important<br />
that the debt-to-GDP ratio stop rising). But Japan’s<br />
public debt is so huge that the objective should be<br />
situation 4, achieving such a surplus in the primary<br />
balance that the debt-to-GDP ratio will steadily fall. It<br />
is important to avoid succumbing to a vicious cycle of<br />
“rising interest rates widening fiscal deficit rising<br />
interest rates.” To that end, the government need to<br />
secure a primary surplus of 1-2% of GDP (i.e., the<br />
surplus must equal more than just the margin<br />
between the interest rate and the growth rate).<br />
Shouldn’t the target be debt-to-GDP ratio?<br />
There are some that contend the objective should<br />
instead be to target the debt-to-GDP ratio. The<br />
argument here is that equilibrium in the primary<br />
balance alone is not sufficient but that some set<br />
surplus must be achieved to steadily lower the debtto-GDP<br />
ratio. As indicated above, we basically agree<br />
with this view. But it is our position that the target<br />
should not be the debt-to-GDP ratio per se but the<br />
primary balance (or a combination of the two).<br />
Stock indicator like debt-to-GDP ratio should not<br />
be market’s focal point<br />
The reason is that the debt-to-GDP ratio is a stock<br />
indicator, and as such requires more time than flow<br />
indicators such as the primary balance to start<br />
registering a decline. In other words, improvements<br />
could be under way in flow indicators like the primary<br />
balance, but the debt-to-GDP ratio will continue<br />
climbing until the primary balance achieves a surplus.<br />
Such being the case, if the target is a debt-to-GDP<br />
ratio, even with steady improvements in the primary<br />
balance, the market might misconstrue continued<br />
increases in this stock indicator as indicating<br />
inadequate fiscal discipline, something that could<br />
trigger a rise in the interest rate. Although the primary<br />
balance itself might not be affected by a rising<br />
interest rate, the greater cost of debt servicing would<br />
acerbate the fiscal deficit and the surplus needed in<br />
the primary balance to stabilise the debt-to-GDP ratio<br />
would rise, making it harder to achieve the objective.<br />
Thus, the debt-to-GDP ratio should not be the<br />
market’s focal point.<br />
People are influenced by the interpretation of<br />
facts<br />
If the focal point is the primary balance, the market’s<br />
perception of steady improvement in this flow<br />
indicator would likely cause the interest rate to fall (or<br />
at least not rise). That, in itself, would help facilitate<br />
fiscal restructuring. In a world governed by the laws<br />
of natural science, either objective (primary balance,<br />
debt-to-GDP ratio) would make little difference, but in<br />
economics, where the laws are that of social science,<br />
people are not affected by facts alone but are often<br />
influenced by the spin put on those facts. This is<br />
especially true of the financial markets, where<br />
reflexivity is very strong. Thus, even if the debt-to-<br />
GDP ratio is made the ultimate target of fiscal<br />
restructuring, it is important that the primary balance<br />
be concurrently made a medium-term target and to<br />
encourage the market to focus more on the<br />
latter. Effective expectations management is<br />
crucial in debt management strategy, and that<br />
requires setting indicators that would most directly<br />
reflect the government’s efforts at fiscal reform as<br />
policy targets.<br />
Ryutaro Kono 12 March 2010<br />
<strong>Market</strong> <strong>Mover</strong><br />
19<br />
www.Global<strong>Market</strong>s.bnpparibas.com
Japan: Jobless Rate Slips Below 5%<br />
• The jobless rate in January fell 0.3pp from<br />
December to 4.9%, slipping below the 5% line<br />
for the first time in ten months.<br />
• Since hitting an all-time high of 5.6% in July<br />
2009, the jobless rate has steadily edged lower<br />
due largely to the declining number of<br />
unemployed and the shrinking work force.<br />
6.0<br />
5.5<br />
5.0<br />
4.5<br />
Chart 1: Unemployment Rate (sa, %)<br />
• However, a significant increase in<br />
employment (0.9% m/m) in January is likely to<br />
be a monthly aberration.<br />
• Employment is unlikely to pick up much in<br />
the near term: the “Japanese-style work<br />
sharing” that, together with flexible wages,<br />
allowed Japan’s job losses to be relatively low<br />
when the economy was contracting, will<br />
probably now act to hamper job growth.<br />
• That said, even without big increases in<br />
employment, if the economy maintains growth<br />
in the mid-1% range (i.e. above the potential<br />
growth rate), the jobless rate should continue to<br />
decline on the steadily thinning jobless ranks.<br />
Jobless rate falls below 5%, job-offer ratio<br />
improves<br />
According to the Labour Force Survey for January (in<br />
which seasonal adjustment was revised retroactively),<br />
the unemployment rate in January fell 0.3pp from<br />
December to 4.9%, slipping below the 5% line for the<br />
first time in ten months. The jobless ranks shrank by<br />
4.7% m/m (the second decline following December’s<br />
1.4% drop) and the employed total rose 0.9% (0.1%<br />
in December). Since hitting an all-time high of 5.6%<br />
in July 2009 (revised down from 5.7%), the jobless<br />
rate has steadily edged lower.<br />
Meanwhile, separate statistics show the job-offer<br />
ratio, an indicator of marginal demand, rose for the<br />
first time in four months, climbing 0.03 points from<br />
December to 0.46, as job offers rose 2.3% m/m but<br />
job seekers declined 3.8%. The new job-offer ratio –<br />
a forward indicator of the job-offer ratio – also<br />
improved, by 0.04 point to 0.85. However, with new<br />
job offers declining for the first time in five months<br />
(-1.1% m/m), this improvement largely reflects a<br />
sharp drop in new job seekers (–6.0% m/m). While it<br />
is good news that job offers are steadily picking up,<br />
the level remains low and the pace of improvement is<br />
anaemic.<br />
4.0<br />
3.5<br />
05 06 07 08 09 10<br />
Source: MIC, <strong>BNP</strong> Paribas<br />
6,450<br />
6,400<br />
6,350<br />
6,300<br />
6,250<br />
6,200<br />
Chart 2: Employed (sa, 10k)<br />
05 06 07 08 09 10<br />
Source: MIC, <strong>BNP</strong> Paribas<br />
Factors causing the jobless rate to decline<br />
What are we to make of the latest upbeat labour<br />
statistics? Until now, we have pointed out two<br />
primary reasons for the steady downturn in the<br />
jobless rate, namely the declining number of<br />
unemployed and the shrinking work force. Increases<br />
in employment in January seem finally to be also<br />
causing the unemployment rate to fall. If this can<br />
continue, it would no longer be a “jobless recovery.”<br />
Japanese-style work sharing<br />
With the economy having bottomed in Q1 2009 and<br />
growing at an annualised rate of 3.3% in the<br />
following three quarters, the unemployed ranks have<br />
steadily declined since August. Nonetheless, job<br />
growth has been lacklustre; the decline in<br />
employment came to an end in August, to be<br />
followed by job growth generally drifting sideways<br />
through the end of 2009. The reason for this lies in<br />
what has come to be called “Japanese-style work<br />
sharing.” When the economy was down, a big reason<br />
why job losses in Japan were small compared to the<br />
severity of the economy’s contraction (Japan’s<br />
Ryutaro Kono/ Azusa Kato 12 March 2010<br />
<strong>Market</strong> <strong>Mover</strong><br />
20<br />
www.Global<strong>Market</strong>s.bnpparibas.com
jobless rate never approached the 10% seen<br />
overseas) is because of Japanese-style work sharing.<br />
This includes the adjustment of working hours,<br />
temporary transfers and other measures to maintain<br />
employment, coupled with flexible wages, as the<br />
downturn in labour productivity per worker was<br />
matched by a decline in average wages via cuts in<br />
base pay, overtime pay and bonuses. (In December<br />
total cash earning fell 5.9% y/y, led by a 9.9% drop in<br />
bonuses and other special earnings). Now that the<br />
economy has recovered, though, the fact that<br />
Japanese-style work sharing kept payrolls largely<br />
intact means companies need not quickly take on<br />
new employees, as increased business needs can<br />
be met by merely increasing the hours of the existing<br />
staff.<br />
6,700<br />
6,680<br />
6,660<br />
6,640<br />
6,620<br />
6,600<br />
6,580<br />
6,560<br />
Chart 3: Labour Force<br />
(sa, 10k)<br />
05 06 07 08 09 10<br />
Source: MIC, <strong>BNP</strong> Paribas<br />
Male (RHS)<br />
total<br />
3940<br />
3920<br />
3900<br />
3880<br />
3860<br />
3840<br />
3820<br />
3800<br />
Ageing and the shrinking work force<br />
The nation’s shrinking work force has been a big<br />
reason why Japan’s jobless rate has steadily fallen<br />
without employment picking up, something pointed<br />
out in previous reports. This involves more than just<br />
the rapid greying of society, which has been going on<br />
since the late 1990s. The problem of a shrinking<br />
work force has been acerbated by the escalating<br />
pool of discouraged workers, as people gave up on<br />
looking for work (i.e exit the work force) because<br />
deteriorating business conditions prompted<br />
companies to cut back on new hiring as well as reemploying<br />
willing senior citizens. With the economy<br />
having revived, we expect many of these<br />
discouraged workers will start looking for jobs again<br />
(in other words, return to the work force). But, that is<br />
probably not true for many seniors, as has been the<br />
case since the 1990s. Thus, the labour participation<br />
rate, which fell sharply during the recent recession,<br />
will probably again show only limited improvement<br />
even if the recovery continues.<br />
Employment situation not strong, but jobless rate<br />
will continue falling<br />
This brings us to the sizeable upturn in both<br />
employment and the work force shown in January’s<br />
Labour Force Survey. As indicated above, if<br />
increases in employment continue to cause the<br />
unemployment rate to fall, the job scene could prove<br />
stronger than expected.<br />
1.1<br />
1.0<br />
0.9<br />
0.8<br />
0.7<br />
0.6<br />
0.5<br />
0.4<br />
Chart 4: Job-Offer Ratio<br />
(sa)<br />
05 06 07 08 09 10<br />
Source: MHLW, <strong>BNP</strong> Paribas<br />
But given that the job-offer ratio is picking up only<br />
weakly, it seems safe to say that employment is<br />
probably not as robust as the Labour Force Survey<br />
suggests. The upbeat January survey may be just a<br />
monthly aberration. That said, given the fact that<br />
Japan’s work force is sure to continue trending lower,<br />
if the economy can maintain growth in the mid-1%<br />
range (that is, above the potential growth rate), the<br />
jobless rate will continue falling, even without any big<br />
increases in employment, as the jobless ranks will<br />
steadily thin (there will be replacements for retirees<br />
but little net job growth).<br />
Ryutaro Kono/ Azusa Kato 12 March 2010<br />
<strong>Market</strong> <strong>Mover</strong><br />
21<br />
www.Global<strong>Market</strong>s.bnpparibas.com
US: 3y Agency Sector Still Good for Carry<br />
• Agencies have cheapened recently vs OIS<br />
and Libor, making entry levels attractive.<br />
• We particularly like the 3y from a strong<br />
carry and rolldown perspective. Meanwhile, the<br />
first three years of the curve should enjoy<br />
“protection” from the US government’s<br />
commitment to unlimited funding for GSEs<br />
over the next three years.<br />
• STRATEGY: (1) Buy agencies in 3y sector<br />
against a 3m forward starting matched maturity<br />
OIS swap with 3m time horizon for the trade<br />
(29bp of C&R if rates stay at current levels), or<br />
(2) buy agencies in 3y sector against a<br />
matched maturity OIS swap for up to 29bp of<br />
carry and rolldown over 1y.<br />
The agency market has enjoyed ample liquidity and a<br />
partial return of foreign demand for some time now.<br />
The US government’s commitment to unlimited<br />
funding for GSEs over the next three years certainly<br />
helped investors regain confidence. In fact, agencies<br />
reached pre-crisis tight levels versus OIS around the<br />
turn of the year (Chart 3). Meanwhile, recent agency<br />
issuance of bullet supply has been relatively<br />
conservative. However, several events have<br />
conspired to cheapen agencies recently (imminent<br />
end of Fed purchases and lack of the promised<br />
permanent solution for GSE are the main culprits),<br />
making current levels attractive (see Chart 1).<br />
Although carry trades are still popular in the rates<br />
market, investors are starting to worry as we inch<br />
closer to the exit from the zero-rate policy. We<br />
propose that carry trades should be good for another<br />
three months or so, based on a view that rate hikes<br />
are at least nine months away (see “Stressing Over<br />
Carry Trades”, <strong>Market</strong> <strong>Mover</strong>, 26 February 2010). In<br />
fact, our economists place the first rate hike in Q2 of<br />
2011, or at least a year away.<br />
We particularly like the 3y sector from a carry and<br />
rolldown perspective, and especially with the talk of<br />
the new FNMA 3y issue being as large as USD 6bn –<br />
helping to cheapen this sector nicely. We also think<br />
that the Fed’s imminent agency purchase<br />
programme exit should be mostly priced in. History<br />
tells us that rates in the 3y sector start to sell off in<br />
earnest around 5.5 months prior to the first rate hike.<br />
Chart 2 shows 3-month changes versus a breakeven<br />
on a long FH 3y position, which offers 29bp of carry<br />
and rolldown over 3m if rates stay around current<br />
levels. It clearly shows that in both previous on-hold<br />
Chart 1: Agencies in 3y Sector Have Cheapened<br />
25<br />
BP<br />
20<br />
15<br />
10<br />
5<br />
FH 3y OIS ASW<br />
0<br />
1/1 1/8 1/15 1/22 1/29 2/5 2/12 2/19 2/26 3/5<br />
Source: <strong>BNP</strong> Paribas<br />
FH 3y Libor ASW (RHS)<br />
Chart 2: 3m Changes in 3y Sector During Fedon-Hold<br />
Periods<br />
200<br />
BP<br />
150<br />
100<br />
50<br />
0<br />
-50<br />
'93-94<br />
'03-04<br />
Breakeven (Long 3y Agy After 3m)<br />
Rates in 3y Sector<br />
Break-Out Around 6m<br />
Before the First Hike<br />
-100<br />
-11m -10m -9m -8m -7m -6m -5m -4m -3m -2m -1m Hike<br />
Source: <strong>BNP</strong> Paribas<br />
Chart 3: 1y Forward OIS/Agy Spread Attractive<br />
180<br />
BP<br />
140<br />
100<br />
60<br />
20<br />
FH 2y OIS ASW<br />
-20<br />
Mar-07 Aug-07 Jan-08 Jun-08 Nov-08 Apr-09 Sep-09 Feb-10<br />
Source: <strong>BNP</strong> Paribas<br />
Breakeven (Long 3y<br />
Agy vs OIS after 1y)<br />
2<br />
BP<br />
-2<br />
-6<br />
-10<br />
-14<br />
-18<br />
Sergey Bondarchuk / Suvrat Prakash / Bulent Baygun / Anish Lohokare 12 March 2010<br />
<strong>Market</strong> <strong>Mover</strong>, Non-Objective Research Section<br />
22<br />
www.Global<strong>Market</strong>s.bnpparibas.com
periods the position would have been profitable so<br />
long as the rate hike was at least 5.5 months away.<br />
We also recommend hedging the tail risk by paying<br />
fixed on a 3m forward starting OIS swap. Because<br />
the 3y sector is about 15bp cheap to matched<br />
maturity OIS swap, a 3m fwd starting OIS swap rate<br />
a few bp below the spot yield of agency bullets in 3y<br />
sector. For those worried that rate hikes are less than<br />
nine months away and that the front end will start to<br />
sell off sooner, we recommend pushing the forward<br />
starting OIS hedge closer to spot, essentially<br />
shortening the carry trade.<br />
Alternatively, for those that do not want exposure to a<br />
possibility of a near term sell-off, we recommend<br />
being long agencies in the 3y sector versus paying<br />
fixed in a matched maturity OIS swap. Not only are<br />
current levels attractive, but also the position carries<br />
positive and benefits from a rolldown (agencies in 2y<br />
sector are richer vs OIS). This trade has potential to<br />
make 29bp of carry and rolldown if agencies tighten<br />
to turn-of-the-year levels. Meanwhile, Chart 3 shows<br />
that over the 1y horizon, the position offers a decent<br />
cushion against losses – 2y OIS/Agy spreads have<br />
not breached our 1 year breakeven level since June<br />
2009.<br />
Sergey Bondarchuk / Suvrat Prakash / Bulent Baygun / Anish Lohokare 12 March 2010<br />
<strong>Market</strong> <strong>Mover</strong>, Non-Objective Research Section<br />
23<br />
www.Global<strong>Market</strong>s.bnpparibas.com
US: Playing for Wider Spreads in a Sell-Off<br />
• With long-end rates approaching the upper<br />
end of their range while swap spreads hover at<br />
historical lows, we like playing for wider<br />
spreads if yields go at least 20bp higher in the<br />
coming months.<br />
250<br />
200<br />
Chart 1: Low Vol/Credit Spread Environment<br />
10y Swap Spread<br />
Mtge/Tsy Spread<br />
3M10Y Vol (RHS)<br />
240<br />
200<br />
• The conditional entry level is on a par with<br />
the current invoice spread or forward ASW of<br />
the CTD, so there is no extra cost for the<br />
conditional implementation.<br />
150<br />
100<br />
160<br />
120<br />
• There are structural reasons for the current<br />
tight spreads, although many of these factors<br />
ease or reverse in a higher-rate scenario.<br />
• STRATEGY: Buy 2m payers versus selling<br />
FVM0 puts in a costless trade (see Table).<br />
50<br />
80<br />
0<br />
40<br />
Jan-90 Jan-93 Jan-96 Jan-99 Jan-02 Jan-05 Jan-08 Jan-11<br />
Source: <strong>BNP</strong> Paribas<br />
The latest move to cycle lows in 10y spreads was<br />
largely a result of capitulation in long positions, and<br />
much of the unwinding may already have been done<br />
given the stabilisation at these levels.<br />
The trade is to sell FVM0 115 puts, which are around<br />
23bp out of the money compared to the expected<br />
futures settle price at expiry. The fwd yield of the<br />
Aug-14s CTD at this strike is 2.42%. Using the funds<br />
toward the purchase of matched-maturity swaption<br />
payers expiring at the same time as the puts (21<br />
May), we can strike the payers at 2.68%, achieving a<br />
conditional entry spread of 26bp which kicks in only<br />
after a sell-off. The entry level has typically been<br />
above the current invoice spread or fwd ASW of the<br />
CTD, although not in this case as these outright<br />
spreads trade at 26bp.<br />
In order to benefit from the expected mortgage<br />
community paying in a sell-off, we suggest using the<br />
5-10y sector. However the switch risk in TYM0 (our<br />
models suggest a 57% chance of a switch) poses a<br />
problem since a switch would mean the futures<br />
cheapen at a faster rate than expected, hurting the<br />
spread-widening trade. We thus choose FVM0, with<br />
close to 0% switch risk.<br />
To be sure, there are some structural reasons for<br />
persistently tight spreads:<br />
• Increasing debt/GDP ratio;<br />
• Heavy corporate issuance;<br />
• Low levels of implied vol;<br />
• Low credit spreads in Agy/MBS; and<br />
• Lack of balance sheet room.<br />
However, many of these factors ease or reverse in a<br />
higher-rate scenario, since that suggests improving<br />
growth prospects which should reduce projections for<br />
debt/GDP ratios. Balance sheet room should be<br />
expected to pick up in a recovery. Higher rate hike<br />
prospects would lead to higher vol. Further, the Fed’s<br />
exit from MBS purchases is likely to widen the<br />
mortgage basis from historic lows (our MBS<br />
strategists expect 20bp in the coming weeks, based<br />
also on the GSE buyouts).<br />
Thus, by isolating the long spread position to only<br />
this scenario, we like the chance of avoiding a loss in<br />
a sell-off, which would require more spread<br />
tightening.<br />
Table: Trade Details for FVM0 115 Puts-Payers Structure<br />
Structure Strike Option Exp Delivery Notional ($) PV ($)<br />
Buy 2m5y Payer 2.68% 21-May-10 6-Jul-10 114,000,000 590,000<br />
Sell FVM0 115P 2.42% 21-May-10 6-Jul-10 (100,000,000) (590,000)<br />
Source: <strong>BNP</strong> Paribas<br />
Suvrat Prakash 12 March 2010<br />
<strong>Market</strong> <strong>Mover</strong>, Non-Objective Research Section<br />
24<br />
www.Global<strong>Market</strong>s.bnpparibas.com
EUR: Further Flattening Ahead<br />
• The long end will need some help from US<br />
Treasuries and risky assets to push higher.<br />
Further near-term consolidation looks likely.<br />
• The bid at the front end should give up<br />
further ground following the positive news on<br />
Greece/EMU and the ECB’s phasing out of<br />
unconventional measures.<br />
• STRATEGY: We retain our call to receive the<br />
2-10y segment with an initial target in the<br />
175/170bp area.<br />
Despite the outperformance of peripherals following<br />
stronger verbal support for Greece, core EGBs have<br />
remain solid so far. But the normalisation process on<br />
Greece has weighed on the front end of the core<br />
markets, allowing our 2-10s flattener trade<br />
recommendation to perform well over the past week.<br />
At this stage, such a call remains a tactical trade with<br />
a first target in the 175/170bp area on the 2-10s<br />
swap spread. We entered the trade going into the<br />
last ECB meeting as we thought there was an<br />
asymmetric risk regarding the announcement about<br />
the exit from unconventional policy measures.<br />
The ECB’s targets are to reduce the level of excess<br />
liquidity and to shorten the maturity of the<br />
Eurosystem’s funding. The Bank is also aiming to<br />
limit the pressure caused by the return to variable<br />
rate tenders for 3mth LTROs as well as by the gap<br />
created when LTROs mature. The ECB will smooth<br />
the expiry of the first 1y tender by a 6-day tender on<br />
1 July (the day the 1y tender expires), which will<br />
provide liquidity up to the following MRO (allotted 7<br />
July).<br />
We expect demand at this 6-day tender to be muted,<br />
as ECB liquidity looks expensive for such a shortterm<br />
maturity. As a result, the process will help to<br />
prevent strong jumps in Eonias but not a rise closer<br />
to the ECB’s refi rate. Demand at the final 6mth<br />
tender at the end of this month will have implications.<br />
The firmer the demand, the smoother the rise in<br />
Eonias will be at the start of July.<br />
We still believe that flatteners will become more<br />
structural trades going into H2, with the gradual<br />
phasing out from the ECB and the markets pricing an<br />
unrealistic Eonia convergence scenario. With further<br />
normalisation ahead in peripheral markets, the bid at<br />
the front end should also ease further. Last but not<br />
least, the latest inflation reports underline the<br />
deflationary pressures within the eurozone; these<br />
Chart 1: Recent Steepening Did Not Come from<br />
a Higher 10y Yield<br />
4.1<br />
4.0<br />
3.9<br />
3.8<br />
3.7<br />
3.6<br />
3.5<br />
3.4<br />
3.3<br />
3.2<br />
May<br />
Source: <strong>BNP</strong> Paribas<br />
0.0<br />
0.5<br />
1.0<br />
1.5<br />
2.0<br />
2.5<br />
3.0<br />
Jan<br />
2/10yr Swap (RHS)<br />
10yr Swap<br />
Jun Jul Aug Sep Oct Nov Dec Jan Feb<br />
09<br />
10<br />
Chart 2: Return towards the Bottom of the<br />
170/190bp Range<br />
Apr Jul Oct Jan<br />
08<br />
Source: <strong>BNP</strong> Paribas<br />
2/10yr Swap Spread (RHS)<br />
2yr E U R R e a l R a te (Inv. L .H .S )<br />
Apr Jul Oct Jan<br />
09<br />
10<br />
could become a key driving force for flatteners in the<br />
medium term – a Japanese curve style scenario.<br />
Flattening pressures could spread to the longer end<br />
of the curve, with pension funds analysis suggesting<br />
an increased sensitivity to gyrations of 10/30s.<br />
Near term, this week’s US supply and the positive<br />
tone on risky assets (major equity indices and oil<br />
prices approaching their January highs) have<br />
prevented the 10y benchmark yield from breaking<br />
below the 3.10% area. A more constructive tone on<br />
Treasuries and/or a setback in equities are needed<br />
for a decisive break of the 3.10/3.20% range.<br />
The technical picture is also supportive of our<br />
flattening call – a break below the medium-term<br />
rising wedge support (180bp) would strengthen the<br />
flattening scenario for a move towards 173.4bp (MT<br />
61.8%) initially and then 162.8/163.0bp (December<br />
low, theoretical target and LT 50%)<br />
205<br />
200<br />
195<br />
190<br />
185<br />
180<br />
175<br />
170<br />
165<br />
160<br />
250<br />
200<br />
150<br />
100<br />
50<br />
0<br />
-50<br />
-100<br />
Cyril Beuzit 12 March 2010<br />
<strong>Market</strong> <strong>Mover</strong>, Non-Objective Research Section<br />
25<br />
www.Global<strong>Market</strong>s.bnpparibas.com
EUR: OAT60 Launched!<br />
• We review the allocation of the new 50Y OAT<br />
in the context of demand trends and relative<br />
value opportunities.<br />
The AFT has successfully launched EUR 5bn (order<br />
book EUR 8.3bn) of its new OAT Apr-2060 at a 2bp<br />
spread to OAT Apr-2055. The deal was distributed<br />
primarily amongst long-term oriented value investors<br />
with liability hedgers (pension funds and insurance<br />
companies) taking almost 40% of the allocation. In<br />
terms of regional distribution, there was strong<br />
demand from “pension-managing” countries such as<br />
the Netherlands (28%) as well as Northern Europe<br />
(16%, presumably strong demand from Denmark).<br />
Demand and allocation facts are summarised in<br />
Table 1.<br />
OAT60’s allocation matches our analysis of pension<br />
fund trends and risks. Here, we again stress the<br />
rebalancing of pension fund asset allocations<br />
towards risky assets in the context of 2009’s equity<br />
market rally. Furthermore, the relatively low level of<br />
liability funding despite 7 out of 8 years of bullish<br />
equity markets since the dot.com bottom (2002)<br />
suggests that duration gaps are still a main long-term<br />
risk for the pension industry as a whole. In this<br />
context, we note a persistently wide duration gap for<br />
aggregate Dutch pension funds (we estimate a gap<br />
of about EUR 325bn of 30Y risk at the end of 2009).<br />
Table 1: OAT60 Demand Analysis<br />
Investor Type<br />
Investor Location<br />
Asset Managers 37% Netherlands 28%<br />
Pension Funds 30% UK 21%<br />
Banks 19% US 18%<br />
Insurers 9% Northern Europe 16%<br />
Hedge Funds 3% France 10%<br />
Other 2% Other 7%<br />
Source: AFT<br />
70%<br />
60%<br />
50%<br />
40%<br />
30%<br />
20%<br />
10%<br />
0%<br />
120%<br />
110%<br />
100%<br />
90%<br />
80%<br />
70%<br />
60%<br />
Chart 1: Global Pension Funds at a Glance<br />
Global pension system asset allocation<br />
61%<br />
Equity Bond<br />
51% Cash Other<br />
41% 40%<br />
54%<br />
36%<br />
30%<br />
27%<br />
16%<br />
17%<br />
12%<br />
6%<br />
3%<br />
1%<br />
2%<br />
1%<br />
1999 2003 2008 2009<br />
Global pension system funding<br />
A/L ratio<br />
S&P500 (RHS)<br />
1500<br />
1400<br />
1300<br />
1200<br />
1100<br />
1000<br />
900<br />
800<br />
1999 2000 2001 2002 2003 2004 2005 2006 2007 2008 2009<br />
Source: <strong>BNP</strong> Paribas<br />
Chart 2: OAT60 Relative Value<br />
In terms of relative value, there are several aspects<br />
that investors should consider (please read our<br />
desknote “France (Aaa/AAA/AAA): New 50Y OAT<br />
April 2060”, 10 March 2010 for more colour):<br />
120<br />
100<br />
80<br />
60<br />
OAT35 z-spread<br />
OAT55 z-spread<br />
OAT35/55 z-spread box (RHS)<br />
40<br />
35<br />
30<br />
25<br />
1) Convexity premium: OAT60 offers a relatively<br />
cheap exposure to volatility.<br />
40<br />
20<br />
20<br />
15<br />
2) Yield curve: There is value in the term premium<br />
implied by the shape of 10/30s swaps.<br />
0<br />
-20<br />
10<br />
5<br />
3) ASW: OAT35/55 z-spread differential is at the top<br />
of the 2009 range (Chart 2).<br />
4) Inflation: Real yield of long-end (OATei-40) looks<br />
low relative to comparable nominal yield.<br />
Overall, we think that OAT60 offers value at current<br />
levels given the set of relative value parameters<br />
described above. Moreover, we stress that the issue<br />
must be evaluated in the context of global pension<br />
fund trends.<br />
-40<br />
2007 2008 2009 2010<br />
Source: <strong>BNP</strong> Paribas<br />
0<br />
Alessandro Tentori 12 March 2010<br />
<strong>Market</strong> <strong>Mover</strong>, Non-Objective Research Section<br />
26<br />
www.Global<strong>Market</strong>s.bnpparibas.com
EUR: Normalisation in the EGB Universe<br />
• GGBs tightened after the announcement of<br />
the new austerity measures and the successful<br />
10y GGB launch. This was more evident in the<br />
2/10s ASW steepening of the Greek curve, rather<br />
than in the 10y GGB/Bund spread, whose<br />
compression has decelerated lately.<br />
• Spain has been outperforming after the depricing<br />
of contagion risks from Greece started in<br />
mid-February. Portugal has lagged relative to<br />
Spain, although its 2/10s ASW have fully resteepened<br />
back to Q4 2009 levels.<br />
• STRATEGY: We like 5/10s steepeners on the<br />
Greek ASW curve as this part of the curve has<br />
lagged the normalisation process. We also like<br />
either long 10y Portugal versus short 10y Italy, or<br />
the long Portugal versus short Italy and Spain fly.<br />
GGBs after the new austerity measures<br />
Last week, we focused on the effect of the new<br />
austerity measures on GGBs, targeting a 10y<br />
GGB/Bund spread of 250bp and a dis-inversion of<br />
the Greek 2/10s ASW curve over the coming weeks.<br />
While on the one hand the re-steepening happened<br />
very quickly as the 2/10s GGBs is currently 50bp<br />
steeper than last week (at -32bp) and 115bp away<br />
from its bottom (Chart 1), it seems that it will take<br />
some time for the 10y spread to approach the 250bp<br />
level. This 2-speed normalisation between the curve<br />
and the spread level is due to the successful<br />
EUR 5bn launch of the new 10y GGB. On the one<br />
hand, this issuance led to a de-pricing of the funding<br />
risk embedded in the front end of the curve. On the<br />
other hand, it took place with a significant premium<br />
over GGB Jul-19, which stopped the positive<br />
momentum of the 10y spread’s compression.<br />
The GGB/Bund 2019s is at 293bp and the 2020s at<br />
307bp, only 18bp tighter compared with the levels at<br />
its launch. Greece proved last week that it still has<br />
easy access to the primary market and it has also<br />
been praised by the ECB for its convincing austerity<br />
measures. However, several factors are keeping the<br />
10y spreads on a very slow tightening trend at the<br />
moment: 1) the ongoing dialogue for a more detailed<br />
EU support mechanism, 2) the IMF card used by the<br />
Greek government as a last resort to put pressure on<br />
the EU and 3) the significant upcoming supply in<br />
April and May.<br />
Commissioner Rehn said that the EU is ready to<br />
support Greece when necessary, and if asked to do<br />
so. The Greek PM and FM reiterated that Greece<br />
Chart 1: Greek Curve Normalisation: 2/10s Dis-<br />
Inverting and GGB/Bund Spreads Tightening<br />
-200<br />
-150<br />
-100<br />
-50<br />
0<br />
50<br />
100<br />
150<br />
Nov-09 Dec-09 Jan-10 Feb-10 Mar-10<br />
Source: <strong>BNP</strong> Paribas<br />
150<br />
100<br />
50<br />
0<br />
-50<br />
-100<br />
GGBs 2/10s ASW (inverted LHS axis)<br />
2y GGB/Bund ASW<br />
10y GGB/Bund ASW<br />
Source: <strong>BNP</strong> Paribas<br />
Targets: 2y Spread at 300bp<br />
10y Spread at 250bp<br />
Chart 2: GGB 5/10s Lagging in the<br />
Normalisation Process<br />
GGBs 5/10s lagging the normalisation process<br />
-150<br />
Oct-09 Nov-09 Dec-09 Jan-10 Feb-10 Mar-10<br />
can’t tolerate issuing paper at such high spreads,<br />
and sooner or later it will need a more detailed<br />
description of the EU’s mechanism, which they<br />
believe could bring spreads much lower and allow<br />
Greece to borrow with much better terms. On these<br />
grounds, the EcoFin meeting scheduled for 16 March<br />
could shed more light.<br />
We have a first target of 300bp over Schatz for the<br />
2y GGB from current levels of 375bp (yield spread),<br />
since this part of the curve can move very quickly, as<br />
we saw last week. Chart 2 shows that as an<br />
alternative trade on the GGBs ASW curve, 5/10s<br />
seem to be lagging the normalisation process and<br />
2/5/10s is close to its highs. We like steepeners on<br />
GGBs 5/10s. We do not expect Greece to issue more<br />
paper before the end of March as the EUR 18.6bn<br />
500<br />
450<br />
400<br />
350<br />
300<br />
250<br />
200<br />
150<br />
100<br />
2/5s GGBs ASW 5/10s GGBs ASW 2/5/10s GGBs ASW<br />
Ioannis Sokos 12 March 2010<br />
<strong>Market</strong> <strong>Mover</strong>, Non-Objective Research Section<br />
27<br />
www.Global<strong>Market</strong>s.bnpparibas.com
that Greece has raised so far is enough until mid-<br />
April, given that the two major redemptions<br />
(EUR 8.5bn each) take place in mid-April and mid-<br />
May.<br />
EGBs beyond greece<br />
Beyond Greece, we’ve seen some interesting<br />
developments on both core and peripheral bonds. A<br />
principal component analysis (PCA) on 10y spreads<br />
versus Bunds shows that Spain and Finland look rich<br />
at current levels, while France and Italy look<br />
relatively cheap (Chart 3). Indeed, Spain has been<br />
richening a lot lately, especially compared with Italy,<br />
as the de-pricing of contagion risk from Greece has<br />
benefited mostly Spain and Portugal, both of which<br />
have been more correlated to GGBs. Portugal still<br />
has a long way to go as is shown in Chart 4, while its<br />
2/10s has fully re-steepened back to Q4 2009 levels.<br />
SPGBs have pared back 78% of their widening since<br />
January while this percentage is only 55% for PGBs.<br />
As part of a further normalisation in the EGB<br />
universe we like the long 10y PGB versus short 10y<br />
BTP and SPGB fly, although more than 50% of the<br />
correction has already taken place. A compression<br />
on 10y PGB/BTP is also attractive for those who<br />
believe in the continuation of the current momentum.<br />
On core paper, we’ve seen OATs underperforming<br />
lately versus both Dutch and Finnish paper (Chart 5).<br />
The advanced liquidity of the French paper seems to<br />
have become less important lately as the large net<br />
supply and the condition of the public finances of<br />
each country are attracting the market’s attention for<br />
the time being. OATs are at their cheapest in recent<br />
months compared with DSLs and RFGBs, but as<br />
long as the market’s focus remains on a potential EU<br />
support mechanism where France and Germany will<br />
be in the drivers’ seat, we stay cautious on these<br />
spreads and continue to monitor them, waiting for<br />
even better entry levels.<br />
In summary, we believe that the details of the EU<br />
support mechanism for Greece will remain in the<br />
headlines in the coming days, with the next EcoFin<br />
on 16 March likely to shed some more light on this<br />
issue. Greek 10y spreads to Bund, although on a<br />
compression trend, seem to need something more to<br />
start tightening aggressively, and this can only come<br />
from the EU. The Greek PDMA will be reluctant to<br />
come out and keep borrowing with such high<br />
spreads, thus we expect pressures from the Greek<br />
government for a more detailed form of this support<br />
mechanism to mount as we approach the next GGB<br />
issuance, probably at the end of March or beginning<br />
of April. Beyond 16 March, the next key dates to<br />
watch will be: 31 March (look for Greek banks’<br />
participation in the ECB’s 6m LTRO); end of March<br />
or beginning of April (the next GGB issuance – the<br />
1.5<br />
1.0<br />
0.5<br />
0.0<br />
-0.5<br />
-1.0<br />
-1.5<br />
-2.0<br />
Chart 3: PCA on 10y Spreads Vs Bunds<br />
OAT/Bund<br />
NETH/Bund<br />
FIN/Bund<br />
Source: <strong>BNP</strong> Paribas<br />
160<br />
140<br />
120<br />
100<br />
80<br />
60<br />
BEL/Bund<br />
PCA Residuals<br />
AUS/Bund<br />
ITA/Bund<br />
IRE/Bund<br />
SPA/Bund<br />
POR/Bund<br />
GRE/Bund<br />
Chart 4: Peripheral 10y Spreads Tightening<br />
BTP/Bund PGB/Bund SPGB/Bund<br />
40<br />
Nov-09 Dec-09 Jan-10 Feb-10 Mar-10<br />
Source: <strong>BNP</strong> Paribas<br />
35<br />
33<br />
31<br />
29<br />
27<br />
25<br />
23<br />
21<br />
19<br />
17<br />
Chart 5: Dislocations on 10y Core Spreads<br />
15<br />
Nov-09 Dec-09 Jan-10 Feb-10 Mar-10<br />
Source: <strong>BNP</strong> Paribas<br />
OAT/Bund Nether/Bund RFGB/Bund<br />
precise date will depend on spread movements);<br />
mid-April and mid-May (GGB redemptions); and<br />
16 May (EcoFin, when Greece will be asked for more<br />
details about the SGP beyond 2010).<br />
Ioannis Sokos 12 March 2010<br />
<strong>Market</strong> <strong>Mover</strong>, Non-Objective Research Section<br />
28<br />
www.Global<strong>Market</strong>s.bnpparibas.com
EUR Vega: Rolldown Opportunities on 10y Swap<br />
• The ECB’s macroeconomic projections<br />
confirm the high risk of a weak recovery<br />
plagued by deflation pressures and a weak<br />
labour market. Against this backdrop, forwards<br />
look too high and EUR vega too rich<br />
• STRATEGY: Buy 1X3 ATMF/ATMF -100bp<br />
2y10y Swaption Receiver Spread<br />
Chart 1: M3 Growth Rate vs. Money Multiplier<br />
13.0<br />
11.0<br />
9.0<br />
7.0<br />
5.0<br />
M3 growth rate (y/y)<br />
Money multiplier (RHS)<br />
2.50<br />
2.40<br />
2.30<br />
2.20<br />
3.0<br />
Inflation in the eurozone is disturbingly low, with<br />
January HICP at 1% y/y (-0.8% m/m). Monetary<br />
conditions as reflected by the sharp decline in broad<br />
money growth as well as the actual money multiplier<br />
(Chart 1) do not look accommodative. Clearly,<br />
alongside the unconventional measures operated by<br />
the ECB, the fall in the EUR has helped ease<br />
monetary conditions. However, <strong>BNP</strong>P projects HICP<br />
at 1.1% and 0.8% for 2010 and 2011 respectively. At<br />
the same time, unemployment is expected to stay<br />
above 10%.<br />
In this context, the slope of the path of the 10y swap<br />
forward rates looks too steep (Chart 2, upper panel).<br />
Alternatively, the middle panel of Chart 2 makes the<br />
point that 10-year nominal rates are too high versus<br />
real yields ahead of low inflation over the next two<br />
years. From yet another angle, the lower panel of<br />
Chart 2 suggests that the the unemployment rate<br />
should prevent the 10y swap rate to move<br />
appreciably higher in the medium term.<br />
Investors that agree with the above can easily trade<br />
such view in vanilla space. For instance,<br />
1) Receive 2y10y swap rate ATMF. The position<br />
benefits from 30bp/annum positive carry.<br />
1.0<br />
-1.0<br />
2000 2001 2002 2003 2004 2005 2006 2007 2008 2009 2010<br />
6.5<br />
6.0<br />
5.5<br />
5.0<br />
4.5<br />
4.0<br />
3.5<br />
Chart 2: a) Evolution of 10y Swap b) 10y<br />
Nominal vs. Real c) 10y Swap vs<br />
Unemployment Rate<br />
EUR 10y swap<br />
Forwards<br />
3.0<br />
2000 2001 2002 2003 2004 2005 2006 2007 2008 2009 2010 2011 2012<br />
5.0<br />
4.5<br />
4.0<br />
3.5<br />
3.0<br />
2.5<br />
2.0<br />
1.5<br />
1.0<br />
10y OATei Real Yield<br />
Nominal yield - Core<br />
Forwards &<br />
CPI Forecasts<br />
2.10<br />
2.00<br />
2) However, with the 10-year swap currently trading<br />
at 3.35%, we like the following rolldown strategy via<br />
options better:<br />
Weight Strike Premium<br />
Rec 2y10y 1 4.016% 340<br />
Rec 2y10y -3 3.016% 103<br />
31<br />
One year rolldown translates to more than 500% of<br />
the premium (!). The lower BE rate is 2.53% with the<br />
lowest value ever attained by the 10-year swap being<br />
3.13% at the end of Q3/2005 over its 20y+ history. In<br />
addition, the trade is conveniently vega negative<br />
against still-rich valuation given an overall cautious<br />
ECB and signals provided by PCA regression<br />
residuals.<br />
0.5<br />
0.0<br />
Feb-97 Feb-99 Feb-01 Feb-03 Feb-05 Feb-07 Feb-09 Feb-11<br />
11.0<br />
Unemplyoment rate (Eurostat)<br />
10.5<br />
EUR 10Y swap rate (RHS, INV)<br />
10.0<br />
9.5<br />
9.0<br />
8.5<br />
8.0<br />
7.5<br />
7.0<br />
6.5<br />
6.0<br />
2001 2002 2003 2004 2005 2006 2007 2008 2009 2010<br />
Source: <strong>BNP</strong> Paribas<br />
0<br />
1<br />
2<br />
3<br />
4<br />
5<br />
6<br />
7<br />
8<br />
Matteo Regesta 12 March 2010<br />
<strong>Market</strong> <strong>Mover</strong>, Non-Objective Research Section<br />
29<br />
www.Global<strong>Market</strong>s.bnpparibas.com
JGBs: June - A Devil-Plagued Period<br />
• Strong external demand, mainly from Asian<br />
countries, is driving the upturn in Japanese<br />
exports. The boost to output from rising<br />
exports leads to higher incomes. The<br />
momentum of this cyclical economic recovery<br />
will likely persist for some time.<br />
• Over the near term, JGBs face tailwinds<br />
from the possibility of additional quantitative<br />
easing and the current favourable<br />
supply/demand conditions.<br />
• However, we do not expect any upward<br />
movement to last. The economy is recovering,<br />
and supply-demand conditions will loosen<br />
through the middle of the year. The macro<br />
fundamentals will be headwinds for the JGB<br />
market in late Q2.<br />
Recovery momentum to persist for some time<br />
The Japanese economy is performing surprisingly<br />
well. Teikoku Databank announced that its economic<br />
diffusion index hit 26.7 in February, a 1.6 point rise<br />
from January and the second consecutive monthly<br />
improvement. The manufacturing DI continues to<br />
improve, driven by growing demand in emerging<br />
economies including China, as do diffusion indices<br />
for domestic demand related industries such as<br />
retailing and services that had lost steam from last<br />
autumn. These results show that strong external<br />
demand is driving the upturn.<br />
January trade data revealed that the nominal value of<br />
exports rose by 8.6% m/m, their 11th consecutive<br />
increase. In real terms (a measure excluding price<br />
and exchange rate moves), January exports were<br />
also up a strong 9.6% m/m (our estimate). Emerging<br />
Asian economies, such as China, that enjoy steady<br />
demand growth are leading this recovery in exports.<br />
Chinese firms brought production and imports<br />
forward, ahead of the February Chinese New Year;<br />
this in particular spurred Japanese export gains in<br />
January.<br />
Corporate hiring of new graduates and mid-career<br />
recruiting remain limited. It will be quite some time<br />
before employment experiences a full-scale<br />
recovery. But decline in the unemployment rate and<br />
the recovery in working hours again show that the<br />
employment situation is steadily improving, as<br />
increased output from rising exports leads to higher<br />
incomes. The momentum of this cyclical economic<br />
recovery will likely persist for some time.<br />
32<br />
30<br />
28<br />
26<br />
24<br />
22<br />
20<br />
18<br />
Chart 1: Industry DIs of Teikoku Databank<br />
16<br />
08/10 09/1 09/4 09/7 09/10 10/1<br />
Source: <strong>BNP</strong> Paribas<br />
Manufacturing<br />
<strong>Services</strong><br />
Retail<br />
Construction<br />
June will be devil-plagued time for JGBs<br />
The report that the BoJ is considering additional<br />
quantitative easing measures will also act to support<br />
the market over the near term, centring on the short<br />
and medium sectors. If the BoJ extends the maturity<br />
of its new fund-supplying operations, this will<br />
strengthen the duration effect further. However, we<br />
should take note of the market setback that occurred<br />
in December when positive factors came to an end<br />
with the introduction of additional quantitative easing.<br />
The same might occur this time; the current<br />
economic situation does not necessarily require<br />
additional easing.<br />
The JGB market could test its upside if US economic<br />
data disappoint. The current supply-demand<br />
conditions and the situation surrounding monetary<br />
policy have become tailwinds for JGBs. However, we<br />
do not expect any upward movement to last. As we<br />
noted previously, the economy is recovering, and<br />
supply-demand conditions will loosen through the<br />
middle of the year. The macro fundamentals are<br />
headwinds for the JGB market.<br />
We expect a full-scale loosening of supply-demand<br />
conditions at the end of Q2 for three reasons: 1) DPJ<br />
policies will become strongly coloured by elements of<br />
reckless spending as the Upper House elections<br />
approach; 2) it will become clear that FY09 income<br />
tax revenues undershot when the revised estimates<br />
are announced on 1 June; and 3) we expect a supply<br />
glut of municipal bonds to emerge during Q2.<br />
Pension financing is also a concern. These effects<br />
will likely emerge during late May extensions. June<br />
will probably prove to be a devil-plagued time for the<br />
2010 JGB market.<br />
Koji Shimamoto 12 March 2010<br />
<strong>Market</strong> <strong>Mover</strong>, Non-Objective Research Section<br />
30<br />
www.Global<strong>Market</strong>s.bnpparibas.com
Global Inflation Watch<br />
More muted inflation data in the US & EZ<br />
Chart 1: EZ Core Goods & Core <strong>Services</strong> HICP<br />
The final Eurozone HICP release for February, out<br />
on Tuesday, should confirm the flash estimate of<br />
0.9% y/y for headline inflation, down 0.1pp from<br />
January’s 11-month high. More interesting, however,<br />
will be the breakdown. This should show an<br />
additional fall in core inflation over the month to a<br />
new all-time low of 0.8% y/y.<br />
In January, core inflation fell to 0.9%, matching the<br />
record low recorded in 2000. Deep January<br />
discounting in countries such as Germany was an<br />
important factor, but the decline has broadened<br />
across components. As a result, while we may see a<br />
February rebound in categories that experienced<br />
deep discounting in January, such as clothing, we<br />
still expect core inflation to fall over the month as<br />
other components like hotels & restaurant, leisure<br />
and non-energy housing inflation continue their<br />
descent. These dynamics were evident in Germany’s<br />
release for the month, even after the significant 0.2pp<br />
upward revision to the preliminary release this week.<br />
In France, we are expecting inflation to be pushed<br />
marginally higher in February, although rounded it<br />
should remain at 1.1%. As seasonal sales ended<br />
earlier this year than in 2009, this should push up<br />
prices, temporarily boosting headline inflation despite<br />
a base effect driven moderation in energy. Core<br />
inflation is trending down, however, and should revert<br />
to that trend in March.<br />
In the US, after January’s exceptional -0.1% m/m<br />
print on core inflation, we expect some muted<br />
numbers for both headline and core inflation in<br />
February. We are forecasting 0.1% m/m for both.<br />
For core inflation, after such a large fall in non-shelter<br />
core services prices in January, we are expecting a<br />
small rebound in February. In contrast, shelter prices<br />
should remain depressed, reflecting disappointing<br />
developments in the housing market and the stillelevated<br />
level of vacancy rates. Plummeting unit<br />
labour costs suggest underlying price pressures will<br />
remain contained in the coming months.<br />
Food and energy should add little to this story in<br />
February. Gasoline prices should ease moderately,<br />
but will be offset by a 5% m/m rise in natural gas<br />
prices and a 0.2% m/m increase in food prices over<br />
the month.<br />
Source: Reuters EcoWin Pro & <strong>BNP</strong> Paribas<br />
Chart 2: French Headline and Core CPI (% y/y)<br />
4.0<br />
3.5<br />
3.0<br />
<strong>Services</strong><br />
2.5<br />
2.0<br />
1.5<br />
1.0<br />
Headline inflation<br />
0.5<br />
0.0<br />
-0.5<br />
Manufactured goods<br />
-1.0<br />
03 04 05 06 07 08 09<br />
Source: Reuters EcoWin Pro, <strong>BNP</strong> Paribas<br />
Chart 3: US Unit Labour Costs<br />
15.0<br />
12.5<br />
10.0<br />
7.5<br />
5.0<br />
2.5<br />
0.0<br />
-2.5<br />
Unit Labour Cost (% y/y)<br />
-5.0<br />
50 55 60 65 70 75 80 85 90 95 00 05 10<br />
Source: Reuters EcoWin Pro, <strong>BNP</strong> Paribas<br />
Luigi Speranza/Eoin O’Callaghan 12 March 2010<br />
<strong>Market</strong> <strong>Mover</strong><br />
31<br />
www.Global<strong>Market</strong>s.bnpparibas.com
Table 1: <strong>BNP</strong> Paribas' Inflation Forecasts<br />
Eurozone<br />
France<br />
US<br />
Headline HICP Ex-tobacco HICP<br />
Headline CPI<br />
Ex-tobacco CPI<br />
CPI Urban SA CPI Urban NSA<br />
Index % m/m % y/y Index % m/m % y/y Index % m/m % y/y index % m/m % y/y Index % m/m % y/y Index % m/m % y/y<br />
2009 108.1 - 0.3 107.9 - 0.2 119.3 - 0.1 118.0 - 0.1 214.5 - -0.3 214.5 - -0.4<br />
2010 (1) 109.3 - 1.2 109.0 - 1.0 120.9 - 1.3 119.5 - 1.3 219.1 - 2.1 219.1 - 2.1<br />
2011 (1) 110.2 - 0.8 109.7 - 0.6 122.1 - 1.0 120.7 - 0.9 222.0 - 1.3 222.0 - 1.3<br />
Q3 2009 108.0 - -0.4 107.8 - -0.5 119.4 - -0.4 118.1 - -0.4 215.4 - -1.6 215.7 - -1.6<br />
Q4 2009 108.6 - 0.4 108.4 - 0.3 119.7 - 0.4 118.4 - 0.3 216.8 - 1.5 216.2 - 1.4<br />
Q1 2010 (1) 108.5 - 1.0 108.2 - 0.9 120.1 - 1.2 118.8 - 1.1 217.8 - 2.5 217.3 - 2.5<br />
Q2 2010 (1) 109.4 - 1.0 109.1 - 0.9 120.8 - 1.2 119.4 - 1.1 218.3 - 2.3 219.3 - 2.3<br />
Q3 2010 (1) 109.3 - 1.2 108.9 - 1.0 121.2 - 1.5 119.8 - 1.4 219.6 - 1.9 219.8 - 1.9<br />
Q4 2010 (1) 110.2 - 1.5 109.8 - 1.3 121.5 - 1.5 120.1 - 1.5 220.8 - 1.9 220.2 - 1.9<br />
Q1 2011 (1) 109.7 - 1.1 109.2 - 0.9 121.7 - 1.3 120.2 - 1.2 221.5 - 1.7 221.0 - 1.7<br />
Q2 2011 (1) 110.4 - 0.9 109.9 - 0.8 122.3 - 1.3 120.9 - 1.2 221.9 - 1.6 222.8 - 1.6<br />
Jul 09 107.8 -0.7 -0.7 107.51 -0.7 -0.8 119.1 -0.4 -0.7 117.80 -0.4 -0.7 214.8 0.1 -2.0 215.35 -0.2 -2.1<br />
Aug 09 108.1 0.3 -0.2 107.89 0.4 -0.3 119.7 0.5 -0.2 118.41 0.5 -0.2 215.6 0.4 -1.5 215.83 0.2 -1.5<br />
Sep 09 108.2 0.0 -0.3 107.91 0.0 -0.5 119.4 -0.2 -0.4 118.12 -0.2 -0.4 215.9 0.2 -1.3 215.97 0.1 -1.3<br />
Oct 09 108.4 0.2 -0.1 108.16 0.2 -0.3 119.5 0.1 -0.2 118.23 0.1 -0.2 216.4 0.2 -0.2 216.18 0.1 -0.2<br />
Nov 09 108.5 0.1 0.5 108.28 0.1 0.4 119.6 0.1 0.4 118.31 0.1 0.3 216.9 0.2 1.8 216.33 0.1 1.8<br />
Dec 09 108.9 0.3 0.9 108.61 0.3 0.8 120.0 0.3 0.9 118.60 0.2 0.8 217.2 0.2 2.8 215.95 -0.2 2.7<br />
Jan 10 108.1 -0.8 1.0 107.75 -0.8 0.9 119.7 -0.2 1.1 118.32 -0.2 1.0 217.6 0.2 2.7 216.69 0.3 2.6<br />
Feb 10 (1) 108.4 0.3 0.9 108.08 0.3 0.8 120.2 0.4 1.1 118.83 0.4 1.1 217.8 0.1 2.3 217.06 0.2 2.3<br />
Mar 10 (1) 109.1 0.6 1.2 108.77 0.6 1.0 120.6 0.3 1.3 119.19 0.3 1.2 217.9 0.1 2.5 218.09 0.5 2.5<br />
Apr 10 (1) 109.4 0.3 1.1 109.06 0.3 0.9 120.7 0.1 1.2 119.35 0.1 1.1 218.1 0.1 2.5 218.88 0.4 2.6<br />
May 10 (1) 109.4 0.0 1.1 109.10 0.0 0.9 120.8 0.1 1.2 119.48 0.1 1.1 218.3 0.1 2.5 219.29 0.2 2.5<br />
Jun 10 (1) 109.4 0.0 0.8 109.01 -0.1 0.7 120.9 0.0 1.1 119.49 0.0 1.0 218.6 0.1 1.9 219.61 0.1 1.8<br />
Jul 10 (1) 108.9 -0.4 1.1 108.55 -0.4 1.0 120.9 0.0 1.5 119.52 0.0 1.5 219.1 0.2 2.0 219.60 0.0 2.0<br />
Aug 10 (1) 109.2 0.3 1.0 108.84 0.3 0.9 121.3 0.4 1.4 119.97 0.4 1.3 219.6 0.2 1.9 219.80 0.1 1.8<br />
Sep 10 (1) 109.6 0.3 1.3 109.23 0.4 1.2 121.3 0.0 1.7 119.98 0.0 1.6 220.1 0.2 1.9 220.09 0.1 1.9<br />
Oct 10 (1) 110.0 0.3 1.5 109.62 0.4 1.3 121.4 0.1 1.6 120.09 0.1 1.6 220.5 0.2 1.9 220.46 0.2 2.0<br />
Nov 10 (1) 110.1 0.1 1.5 109.72 0.1 1.3 121.4 0.0 1.5 120.07 0.0 1.5 220.9 0.2 1.8 220.29 -0.1 1.8<br />
Dec 10 (1) 110.5 0.3 1.5 110.05 0.3 1.3 121.6 0.1 1.3 120.20 0.1 1.3 221.2 0.1 1.8 219.76 -0.2 1.8<br />
Updated<br />
Next<br />
Release<br />
Mar 10<br />
Feb HICP (Mar 16)<br />
Mar 04<br />
Feb CPI (Mar 16)<br />
Mar 11<br />
Feb CPI (Mar 18)<br />
Source: <strong>BNP</strong> Paribas, (1) Forecasts<br />
Chart 4: Eurozone HICP (% y/y)<br />
Chart 5: US Shelter Prices Drive Core CPI Lower<br />
Source: Reuters EcoWin Pro<br />
Core inflation is forecast to continue grinding lower, as excess<br />
capacity and ongoing structural adjustment in a number of<br />
economies limit firms’ pricing power.<br />
Source: Reuters EcoWin Pro<br />
The plunge in shelter inflation remains the driver of the underlying<br />
trend in the CPI. Inflation in core goods has eased, however,<br />
following a temporary boost from a series of tobacco tax hikes and<br />
a sharp contraction in vehicle inventories.<br />
Luigi Speranza/Eoin O’Callaghan 12 March 2010<br />
<strong>Market</strong> <strong>Mover</strong><br />
32<br />
www.Global<strong>Market</strong>s.bnpparibas.com
Table 2: <strong>BNP</strong> Paribas' Inflation Forecasts<br />
Japan<br />
UK<br />
Sweden<br />
Core CPI SA<br />
Core CPI NSA<br />
Headline CPI RPI<br />
CPI CPIF<br />
Index % m/m % y/y Index % m/m % y/y Index % m/m % y/y Index % m/m % y/y Index % m/m % y/y Index % m/m % y/y<br />
2009 100.3 - -1.3 100.3 - -1.3 110.8 - 2.1 213.7 - -0.5 299.7 - -0.3 191.2 - 1.9<br />
2010 (1) 99.0 - -1.3 99.0 - -1.3 113.5 - 2.5 222.0 - 3.9 304.4 - 1.6 195.6 - 2.3<br />
2011 (1) 98.6 - -0.4 98.6 - -0.4 114.8 - 1.1 228.2 - 2.8 313.4 - 3.0 198.3 - 1.4<br />
Q3 2009 99.9 - -2.3 100.1 - -2.3 111.3 - 1.5 214.4 - -1.4 299.5 - -1.2 191.6 - 1.6<br />
Q4 2009 99.7 - -1.8 99.9 - -1.8 112.1 - 2.1 216.9 - 0.6 301.3 - -0.4 193.2 - 2.3<br />
Q1 2010 (1) 99.7 - -1.3 99.3 - -1.2 112.6 - 2.9 219.1 - 3.9 301.3 - 1.0 194.1 - 2.7<br />
Q2 2010 (1) 98.8 - -1.7 98.8 - -1.7 113.3 - 2.5 221.5 - 4.2 303.9 - 1.4 195.6 - 2.4<br />
Q3 2010 (1) 98.4 - -1.5 98.7 - -1.4 113.7 - 2.2 222.6 - 3.8 304.6 - 1.7 195.5 - 2.0<br />
Q4 2010 (1) 99.0 - -0.7 99.2 - -0.7 114.4 - 2.1 224.7 - 3.6 307.9 - 2.2 197.3 - 2.1<br />
Q1 2011 (1) 99.0 - -0.7 98.6 - -0.7 114.3 - 1.5 225.7 - 3.0 308.1 - 2.3 196.4 - 1.1<br />
Q2 2011 (1) 98.7 - -0.1 98.7 - -0.1 115.0 - 1.5 228.0 - 2.9 312.3 - 2.8 197.9 - 1.2<br />
Jul 09 100.0 -0.2 -2.2 100.1 -0.2 -2.2 110.9 -0.1 1.8 213.40 0.0 -1.4 298.8 -0.5 -0.9 191.1 -0.2 1.8<br />
Aug 09 99.8 -0.2 -2.4 100.1 0.0 -2.4 111.4 0.5 1.6 214.40 0.5 -1.3 299.4 0.2 -0.8 191.5 0.2 1.9<br />
Sep 09 99.8 0.0 -2.3 100.2 0.1 -2.3 111.5 0.1 1.1 215.30 0.4 -1.4 300.4 0.3 -1.6 192.3 0.4 1.4<br />
Oct 09 99.7 -0.1 -2.3 100.1 -0.1 -2.2 111.7 0.2 1.5 216.00 0.3 -0.8 301.1 0.3 -1.5 193.0 0.3 1.9<br />
Nov 09 99.8 0.1 -1.7 99.9 -0.2 -1.7 112.0 0.3 1.9 216.60 0.3 0.3 301.0 0.0 -0.7 193.0 0.0 2.3<br />
Dec 09 99.7 -0.1 -1.3 99.8 -0.1 -1.3 112.6 0.6 2.9 218.00 0.6 2.4 301.7 0.2 0.9 193.5 0.2 2.7<br />
Jan 10 99.6 -0.1 -1.3 99.2 -0.6 -1.3 112.4 -0.2 3.4 217.96 0.0 3.7 299.8 -0.6 0.6 193.0 -0.2 2.6<br />
Feb 10 (1) 99.9 0.3 -1.1 99.3 0.1 -1.1 112.7 0.2 2.8 219.25 0.6 3.7 301.6 0.6 1.2 194.2 0.6 2.7<br />
Mar 10 (1) 99.7 -0.2 -1.3 99.4 0.1 -1.3 112.7 0.1 2.7 220.06 0.4 4.1 302.6 0.3 1.3 195.1 0.5 2.7<br />
Apr 10 (1) 98.9 -0.8 -1.9 98.8 -0.6 -1.9 113.0 0.3 2.7 220.96 0.4 4.5 303.7 0.4 1.5 195.7 0.3 2.7<br />
May 10 (1) 98.9 0.0 -1.6 98.9 0.1 -1.6 113.4 0.3 2.4 221.52 0.3 4.1 303.7 0.0 1.4 195.5 -0.1 2.4<br />
Jun 10 (1) 98.7 -0.2 -1.5 98.8 -0.1 -1.5 113.5 0.1 2.3 222.15 0.3 4.1 304.3 0.2 1.4 195.6 0.0 2.2<br />
Jul 10 (1) 98.5 -0.2 -1.5 98.6 -0.2 -1.5 113.1 -0.4 1.9 221.67 -0.2 3.9 304.0 -0.1 1.7 194.7 -0.4 1.9<br />
Aug 10 (1) 98.4 -0.1 -1.4 98.7 0.1 -1.4 114.1 0.9 2.4 222.90 0.6 4.0 304.0 0.0 1.5 195.2 0.2 1.9<br />
Sep 10 (1) 98.4 0.0 -1.4 98.8 0.1 -1.4 114.0 -0.1 2.2 223.27 0.2 3.7 305.9 0.6 1.8 196.6 0.7 2.2<br />
Oct 10 (1) 98.9 0.5 -0.8 99.3 0.5 -0.8 114.3 0.3 2.4 224.28 0.5 3.8 307.5 0.5 2.1 197.2 0.3 2.2<br />
Nov 10 (1) 99.1 0.2 -0.7 99.2 -0.1 -0.7 114.4 0.0 2.1 224.46 0.1 3.6 307.5 0.0 2.1 197.3 0.1 2.2<br />
Dec 10 (1) 99.1 0.0 -0.6 99.2 0.0 -0.6 114.6 0.3 1.8 225.28 0.4 3.3 308.8 0.4 2.3 197.2 -0.1 1.9<br />
Updated<br />
Next<br />
Release<br />
Feb 26<br />
Feb CPI (Mar 25)<br />
Mar 05<br />
Feb CPI (Mar 23)<br />
Mar 11<br />
Mar CPI (Apr 13)<br />
Source: <strong>BNP</strong> Paribas, (1) Forecasts<br />
Chart 6: Japanese CPI (% y/y)<br />
Chart 7: UK CPI (% y/y)<br />
Source: Reuters EcoWin Pro<br />
Inflation is likely to remain heavily in negative territory for the<br />
foreseeable future.<br />
Source: Reuters EcoWin Pro, <strong>BNP</strong> Paribas<br />
Inflation was in line with expectations in January, accelerating to<br />
3.5% y/y. We believe this is the peak and that headline inflation will<br />
be back in line with target around the middle of the year.<br />
Luigi Speranza/Eoin O’Callaghan 12 March 2010<br />
<strong>Market</strong> <strong>Mover</strong><br />
33<br />
www.Global<strong>Market</strong>s.bnpparibas.com
Table 3: <strong>BNP</strong> Paribas' Inflation Forecasts<br />
Canada Norway Australia<br />
CPI Core CPI Headline CPI Core<br />
CPI<br />
Core<br />
Index % q/q % y/y Index % q/q % y/y Index % q/q % y/y Index % q/q % y/y Index % q/q % y/y Index % q/q % y/y<br />
2009 114.4 0.3 113.6 1.8 125.7 2.2 118.4 2.6 167.8 - 1.8 - - 3.7<br />
2010 (1) 116.2 1.5 115.2 1.4 128.9 2.5 120.4 1.7 172.8 - 3.0 - - 2.8<br />
2011 (1) 117.8 1.4 116.6 1.2 131.7 2.2 122.8 2.0 178.5 - 3.3 - - 2.9<br />
Q3 2009 114.7 0.5 -0.9 113.9 1.2 1.6 125.8 0.0 1.8 118.5 0.0 2.4 168.6 1.0 1.3 - - 3.5<br />
Q4 2009 114.9 0.6 0.8 114.4 1.9 1.6 126.6 0.6 1.4 119.3 0.7 2.3 169.5 0.5 2.1 - - 3.4<br />
Q1 2010 (1) 115.3 1.4 1.5 114.6 0.7 1.7 128.4 1.4 2.9 119.5 0.1 2.1 170.5 0.6 2.6 - - 3.1<br />
Q2 2010 (1) 115.9 2.2 1.2 115.0 1.6 1.3 129.3 0.7 2.7 120.6 0.9 1.7 171.9 0.8 2.9 - - 2.7<br />
Q3 2010 (1) 116.5 2.2 1.6 115.4 1.4 1.4 128.6 -0.5 2.2 120.4 -0.1 1.6 173.7 1.0 3.0 - - 2.5<br />
Q4 2010 (1) 117.0 1.6 1.9 115.8 1.2 1.2 129.4 0.6 2.3 121.0 0.4 1.4 175.0 0.8 3.3 - - 2.8<br />
Q1 2011 (1) 117.4 1.2 1.8 116.1 1.2 1.3 130.0 0.4 1.3 121.3 0.3 1.5 176.2 0.7 3.4 - - 2.9<br />
Q2 2011 (1) 117.6 0.9 1.5 116.4 1.0 1.2 131.5 1.2 1.8 122.8 1.2 1.8 177.8 0.9 3.4 - - 2.9<br />
Updated<br />
Feb 18<br />
Mar 10 Jan 27<br />
Next<br />
Release<br />
Feb CPI (Mar 19)<br />
Mar CPI (Apr 9) Q1 CPI (Apr 28)<br />
Source: <strong>BNP</strong> Paribas, (1) Forecasts<br />
Chart 8: Canadian Total vs. Core CPI<br />
Chart 9: Australian CPI (% y/y)<br />
Source: Reuters EcoWin Pro, <strong>BNP</strong> Paribas<br />
Recent gains in house prices point to higher CPI shelter, but the still<br />
strong CAD is expected to depress the prices of goods. In addition,<br />
wage pressures continue to ease rapidly, pointing to subdued<br />
inflation overall.<br />
Source: Reuters EcoWin Pro, <strong>BNP</strong> Paribas<br />
Underlying inflation is slowing, but remains above the RBA's target<br />
range. While it will continue to moderate, the relatively limited and<br />
diminishing degree of slack in the economy mean underlying<br />
inflation will settle at the top end of the range, presenting upside<br />
risks further ahead.<br />
CPI Data Calendar for the Coming Week<br />
Day GMT Economy Indicator Previous<br />
<strong>BNP</strong>P<br />
F’cast<br />
Consensus<br />
Fri 12/03 09:00 Spain CPI y/y : Feb 1.0% 0.9% 0.9%<br />
09:00 HICP y/y : Feb 0.9% 0.9% 0.9%<br />
Comment<br />
Tue 16/03 10:00 Eurozone HICP m/m : Feb -0.8% 0.3% 0.3% New all-time low<br />
10:00 HICP y/y : Feb 1.0% 0.9% 0.9% for core<br />
10:00 HICP Core m/m : Feb -1.5% 0.4% n/a<br />
10:00 HICP Core y/y : Feb 0.9% 0.8% 0.8%<br />
10:00 Ex-Tobacco Index : Feb 107.75 108.08 n/a<br />
07:45 France CPI m/m : Feb -0.2% 0.4% 0.4% Marginally<br />
07:45 CPI y/y : Feb 1.1% 1.1% 1.1% higher<br />
07:45 HICP m/m : Feb -0.2% 0.4% n/a<br />
07:45 HICP y/y : Feb 1.2% 1.2% n/a<br />
07:45 Ex-Tobacco CPI (Final, nsa) : Feb 118.32 118.83 n/a<br />
Thu 18/03 12:30 US CPI m/m : Feb 0.2% 0.1% 0.1% More muted<br />
12:30 CPI y/y : Feb 2.6% 2.3% 2.3% core<br />
12:30 Core CPI m/m : Feb -0.1% 0.1% 0.1%<br />
12:30 Core CPI y/y : Feb 1.6% 1.4% 1.0%<br />
12:30 Canada CPI m/m : Feb 0.3% 0.2% 0.2%<br />
12:30 CPI y/y : Feb 1.9% 1.3% 1.3%<br />
12:30 BoC Core CPI m/m : Feb 0.1% 0.3% 0.3%<br />
12:30 BoC Core CPI y/y : Feb 2.0% 1.7% n/a<br />
Release dates and forecasts as at c.o.b. prior to the date of publication: See Daily Economic Spotlight for any revision<br />
Source: <strong>BNP</strong> Paribas<br />
Luigi Speranza/Eoin O’Callaghan 12 March 2010<br />
<strong>Market</strong> <strong>Mover</strong><br />
34<br />
www.Global<strong>Market</strong>s.bnpparibas.com
Inflation: Spring Break for Breakevens?<br />
• GLOBAL: Supportive seasonals / asset mkts<br />
1: 10y EUR Cash BE Still Too Low vs. BE Curve<br />
• EUR: Renewed opportunity for long 10y BE<br />
• USD: More constructive BEs. 1y or 10y BE<br />
120<br />
110<br />
100<br />
OATEI12 / OATEI20 Breakeven<br />
OATEI20 Breakeven Rhs<br />
150<br />
160<br />
170<br />
180<br />
190<br />
• GBP: Keep long UKTi-13 BE position.<br />
90<br />
80<br />
GLOBAL: Risk appetite returns after a strong US<br />
labour market report. Equities up 2-3% on the week.<br />
Oil is around USD 82/bbl supported by bullish<br />
inventory data. US Treasuries are bull-steepening<br />
whilst EGBs remain more robust (and exhibit<br />
flattening), especially peripherals with further<br />
tightening in CDS/EGB spreads. Accordingly, US<br />
breakevens have outperformed EUR ones although<br />
inflation curves have flattened across regions. The<br />
positive seasonal effect from March seems to be<br />
having some impact. Given our economists’<br />
deflationary expectations from late 2010 and<br />
throughout 2011, the current environment (positive<br />
asset markets and inflation seasonals) may<br />
represent one of the final opportunities to enter long<br />
breakeven exposure. Consequently, we are more<br />
constructive on breakevens everywhere but remain<br />
selective. Supply has been received smoothly –<br />
particularly encouragingly for Europe given the<br />
difficulties in the first two months of 2010. Next week<br />
will see the usual AFT linker auction on Thursday<br />
and a focus on February inflation data.<br />
EUR: Mixed moves in Europe with tighter nominal<br />
core/peripheral spreads not linearly reflected in real<br />
space (as usual). Nonetheless, front-end breakevens<br />
performed strongly, assisted by the 0.2pp upward<br />
surprise in the final German HICP release. It came in<br />
at +0.4% m/m vs. 0.2% for the initial states' release<br />
due to ‘miscellaneous prices’. On the supply front,<br />
the EUR 1bn BUNDei-20 offering was quite strong,<br />
as expected, coming with a premium of 1bp and<br />
Bid/Cover of 2.1. We expect AFT to tap OATi-19 and<br />
OATei-40 next week. The 10y area has<br />
underperformed a little in the cash inflation curve and<br />
remains rather attractive vs. wings, allowing entry<br />
into our favoured trades at good levels. We favour<br />
long 10y cash breakeven, long 5y5y breakeven fwd<br />
and long 2y8y breakeven fwd. For bearish inflation<br />
investors, selling 1y1y inflation fwd above 1.80%<br />
remains attractive especially vs. our economists’<br />
forecasts. OATi breakevens are still outperforming<br />
EUR ones and a continuation of the move may allow<br />
attractive entry levels for long EUR/FRF BE plays<br />
once the carry differential improves. Next week, FRF<br />
CPI Ex-tob is expected at 118.83, +0.43% m/m whilst<br />
EUR HICP Ex-tob is forecast at 108.08, +0.31%<br />
m/m. In terms of relative value, OATeis still look<br />
expensive at the front end with OBLei-13 and<br />
70<br />
60<br />
50<br />
40<br />
30<br />
20<br />
Feb-09 May-09 Aug-09 Nov-09 Feb-10 May-10<br />
Chart 2: EUR Seasonal RV at 1-Apr Fwd<br />
20 bp 17.1<br />
13.4 11.8<br />
10<br />
0<br />
-10<br />
OBLei-13<br />
-1.5<br />
BTPei-19<br />
10.7<br />
5.9<br />
BUNDei-20<br />
13.6<br />
Rich / Cheap vs OATei Curve<br />
Credit Ref = Nom spread<br />
BTPeis<br />
-20<br />
-15.5<br />
-16.2<br />
BUNDei-16<br />
-25.8<br />
-30<br />
2010 2015 2020 2025 2030 2035 2040 2045<br />
All Charts Source: <strong>BNP</strong> Paribas<br />
especially BTPei-14 looking cheap – although the<br />
BUNDei-16 remains rich. At the 10-15y point, both<br />
BTPei-19 and -23 look attractive.<br />
USD: Strong week for breakevens, with 1-5y BEs<br />
leading the charge to a higher and flatter inflation<br />
curve. Despite the move, the TIPS market has been<br />
relatively quiet with the exception of significant longend<br />
activity/interest on Wednesday. Amidst strong<br />
positive seasonals/carry and higher Treasury yields /<br />
oil, we turn constructive on TIPS breakevens. We<br />
favour the very front end (Jan-11) and the 10y area<br />
to intermediate sector or long end. We reiterate the<br />
general attractiveness of July maturities relative to<br />
January and especially to richer April maturities.<br />
February US CPI NSA is expected at 217.06,<br />
+0.17% m/m and core at 0.1% m/m.<br />
GBP: Lower but flatter inflation curve. So far in<br />
March, long-end cash BEs have not benefited hugely<br />
from typical LDI demand although swaps have –<br />
sending real/nominal ASW materially wider (+15bp<br />
on the week). Beyond some anxiety over UKTi<br />
issuance plans into the 24 March Budget (and DMO<br />
Remit FY 10/11), we expect long-end cash BEs to<br />
recover. We still favour the front end – UKTi-13 BE<br />
remains our favourite bond and looks 2.4% (or 65bp)<br />
cheap vs. <strong>BNP</strong>P RPI forecasts. UK RPI is expected<br />
at 219.25, +0.59% m/m.<br />
-3.6<br />
200<br />
210<br />
220<br />
230<br />
240<br />
250<br />
Shahid Ladha / Herve Cros 12 March 2010<br />
<strong>Market</strong> <strong>Mover</strong>, Non-Objective Research Section<br />
35<br />
www.Global<strong>Market</strong>s.bnpparibas.com
Table 1: <strong>BNP</strong> Paribas Carry Analysis<br />
EUR<br />
Pricing Date<br />
11-Mar-10<br />
Term 1<br />
Term 2<br />
3m<br />
6m<br />
12m<br />
Repo Rate<br />
0.40%<br />
0.41%<br />
0.39% 0.49%<br />
0.69%<br />
EUR DRI<br />
108.19387<br />
107.75000<br />
108.08317 108.91286<br />
108.78084<br />
109.44985<br />
FRF DRI<br />
118.46452<br />
118.32000 118.82544<br />
119.26739<br />
119.50554<br />
120.02025<br />
Sett. Date<br />
16-Mar-10<br />
01-Apr-10<br />
01-May-10<br />
16-Jun-10<br />
16-Sep-10<br />
16-Mar-11<br />
Real BE Real BE Real BE Real BE Real BE Real BE<br />
BTANEI Jul-10 -2.01% 2.30% -159.6 -157.4 -170.7 -162.1 47.7 95.9 -<br />
BTPEI Sep-10 -1.25% 1.88% -105.5 -107.3 -83.1 -88.7 100.6 86.5 - - - -<br />
OATEI Jul-12 -0.53% 1.64% -20.1 -21.7 -10.2 -14.9 21.1 11.3 2.0 -18.1 -4.5 -46.4<br />
BTPEI Sep-12 0.11% 1.62% -17.5 -20.0 -6.0 -13.2 26.9 11.8 17.8 -14.0 39.0 -32.8<br />
BOBLEI Apr-13 0.10% 1.30% -14.6 -16.2 -5.1 -10.0 21.0 10.8 13.2 -7.7 27.1 -15.9<br />
BTPEI Sep-14 0.87% 1.64% -9.2 -11.6 -1.1 -8.0 19.4 5.2 19.2 -9.9 40.1 -20.1<br />
OATEI Jul-15 0.66% 1.75% -7.9 -9.8 -1.4 -7.1 15.0 3.7 13.6 -9.4 27.0 -19.8<br />
BUNDEI Apr-16 0.78% 1.67% -6.9 -8.6 -1.1 -6.0 13.5 3.4 12.8 -7.9 25.5 -15.8<br />
BTPEI Sep-17 1.56% 1.72% -5.3 -7.4 0.6 -5.5 14.3 2.0 16.6 -8.1 33.8 -15.7<br />
BTPEI Sep-19 1.97% 1.81% -4.1 -6.0 1.1 -4.4 12.9 1.7 16.0 -6.6 32.2 -13.1<br />
BUNDEI Apr-20 1.36% 1.82% -4.1 -5.6 0.1 -4.1 10.0 1.4 11.1 -6.2 21.9 -12.0<br />
OATEI Jul-20 1.45% 2.02% -4.0 -5.6 0.3 -4.4 10.4 1.0 11.8 -6.9 23.1 -14.0<br />
BTPEI Sep-23 2.36% 1.96% -2.9 -4.7 1.2 -3.8 10.4 0.1 13.6 -7.0 27.1 -13.3<br />
GGBEI Jul-25 4.37% 1.84% -2.1 -4.7 3.4 -4.1 14.6 -0.5 22.1 -8.4 44.1 -17.9<br />
GGBEI Jul-30 4.39% 2.01% -1.6 -4.2 2.7 -4.6 11.4 -3.2 17.3 -12.4 34.2 -26.2<br />
OATEI Jul-32 1.78% 2.29% -2.1 -3.3 0.4 -3.0 6.2 -0.7 7.4 -6.3 14.2 -12.3<br />
BTPEI Sep-35 2.33% 2.48% -1.7 -3.1 0.7 -3.3 6.1 -1.9 7.8 -8.1 15.3 -15.7<br />
OATEI Jul-40 1.77% 2.38% -1.5 -2.5 0.3 -2.5 4.4 -1.1 5.2 -5.7 10.0 -11.4<br />
BTPEI Sep-41 2.55% 2.35% -1.5 -2.7 0.8 -2.8 5.7 -1.6 7.5 -7.0 14.6 -13.9<br />
FRF<br />
OATI Jul-11 -0.95% 1.59% -13.9 -15.0 10.3 7.2 30.5 23.8 17.5 4.9 -93.2 -71.0<br />
OATI Jul-13 -0.21% 1.79% -4.7 -6.6 7.0 1.8 17.5 6.7 19.0 -3.2 17.6 -28.4<br />
OATI Jul-17 0.93% 2.01% -1.5 -3.3 5.3 0.0 11.9 1.4 16.7 -4.6 25.3 -17.4<br />
OATI Jul-19 1.23% 2.07% -1.0 -2.7 4.7 -0.3 10.5 0.6 15.1 -4.7 23.6 -15.7<br />
OATI Jul-23 1.55% 2.22% -0.6 -2.1 3.9 -0.3 8.6 0.2 12.7 -4.1 20.2 -12.5<br />
OATI Jul-29 1.70% 2.33% -0.5 -1.8 3.2 -0.6 7.0 -0.5 10.4 -4.3 16.6 -12.3<br />
USD<br />
Pricing Date<br />
11-Mar-10<br />
Term 1<br />
Term 2<br />
3m<br />
6m<br />
12m<br />
Repo Rate<br />
0.14%<br />
0.15%<br />
0.17% 0.21%<br />
0.40%<br />
USD DRI<br />
216.21087<br />
216.68700<br />
217.05721<br />
218.43290<br />
219.60343<br />
220.06342<br />
Sett. Date<br />
12-Mar-10<br />
01-Apr-10<br />
01-May-10<br />
14-Jun-10 13-Sep-10 14-Mar-11<br />
Yield BE Real BE Real BE Real BE Real BE Real BE<br />
TIPS Apr-10 -2.95% 3.03% 131.6 139.1 - - - - - - - -<br />
TIPS Jan-11 -1.28% 1.62% 17.9 16.5 27.4 23.6 111.5 103.7 239.4 220.6 - -<br />
TIPS Apr-11 -0.86% 1.36% 16.1 14.2 26.5 21.6 91.1 81.2 173.7 150.9 573.4 499.6<br />
TIPS Jan-12 -0.67% 1.55% 10.0 7.7 16.6 10.7 52.2 40.6 85.3 60.2 86.4 31.5<br />
TIPS Apr-12 -0.45% 1.44% 9.4 7.0 16.0 10.0 47.8 36.1 78.2 53.4 85.5 31.4<br />
TIPS Jul-12 -0.50% 1.60% 8.3 6.0 14.0 8.0 42.0 30.3 67.2 42.4 67.3 15.2<br />
TIPS Apr-13 -0.21% 1.72% 6.7 4.1 11.7 5.0 32.9 20.2 52.3 26.2 55.7 0.6<br />
TIPS Jul-13 -0.05% 1.69% 6.5 3.9 11.6 4.9 32.2 19.3 51.7 25.0 58.0 2.9<br />
TIPS Jan-14 0.21% 1.65% 6.1 3.5 11.2 4.5 30.0 17.0 48.5 22.0 58.1 3.7<br />
TIPS Apr-14 0.21% 1.84% 5.7 3.0 10.4 3.5 27.7 14.6 44.5 17.9 52.7 -2.7<br />
TIPS Jul-14 0.35% 1.72% 5.6 3.0 10.4 3.6 27.4 14.4 44.3 17.9 53.9 0.2<br />
TIPS Jan-15 0.56% 1.77% 5.3 2.6 9.9 3.0 25.5 12.3 41.6 14.8 52.4 -2.0<br />
TIPS Jul-15 0.64% 1.91% 4.9 2.2 9.2 2.3 23.7 10.3 38.6 11.6 48.9 -5.8<br />
TIPS Jan-16 0.82% 1.92% 4.7 2.0 9.0 2.0 22.7 9.3 37.2 10.2 48.3 -6.1<br />
TIPS Jul-16 0.90% 2.01% 4.5 1.7 8.6 1.6 21.5 8.2 35.3 8.4 46.1 -7.8<br />
TIPS Jan-17 1.07% 2.01% 4.3 1.6 8.4 1.5 20.7 7.5 34.1 7.6 45.5 -7.6<br />
TIPS Jul-17 1.12% 2.11% 4.1 1.4 8.0 1.1 19.7 6.6 32.4 6.2 43.3 -9.0<br />
TIPS Jan-18 1.23% 2.15% 3.8 1.2 7.5 0.9 18.3 5.8 30.2 5.2 40.8 -9.2<br />
TIPS Jul-18 1.28% 2.22% 3.6 1.0 7.1 0.5 17.3 4.8 28.5 3.5 38.6 -11.3<br />
TIPS Jan-19 1.37% 2.24% 3.6 1.1 7.1 0.9 17.1 5.3 28.3 4.8 38.7 -8.0<br />
TIPS Jul-19 1.42% 2.28% 3.4 0.9 6.7 0.5 16.2 4.4 26.9 3.2 36.7 -10.2<br />
TIPS Jan-20 1.48% 2.25% 3.2 0.8 6.4 0.2 15.3 3.7 25.4 2.4 34.8 -11.0<br />
TIPS Jan-25 2.02% 2.29% 2.6 0.3 5.2 -0.6 12.3 1.1 20.6 -1.6 29.4 -14.2<br />
TIPS Jan-26 2.06% 2.35% 2.4 0.2 4.9 -0.6 11.5 1.0 19.2 -1.6 27.4 -13.2<br />
TIPS Jan-27 2.11% 2.33% 2.4 0.2 4.8 -0.6 11.2 0.9 18.8 -1.6 26.9 -13.1<br />
TIPS Jan-28 2.13% 2.35% 2.2 0.1 4.4 -0.9 10.3 0.3 17.3 -2.3 24.7 -14.0<br />
TIPS Apr-28 2.18% 2.35% 2.4 0.4 4.9 -0.2 11.4 1.8 19.2 0.2 27.7 -9.5<br />
TIPS Jan-29 2.16% 2.39% 2.2 0.2 4.5 -0.5 10.4 1.0 17.5 -1.2 25.0 -11.4<br />
TIPS Apr-29 2.19% 2.37% 2.4 0.4 4.8 -0.2 11.1 1.6 18.7 0.0 26.9 -9.5<br />
TIPS Apr-32 2.19% 2.40% 2.1 0.2 4.2 -0.6 9.7 0.7 16.3 -1.5 23.3 -11.3<br />
TIPS Feb-40 2.19% 2.52% 1.5 -0.1 3.1 -0.9 7.1 -0.3 11.9 -2.7 16.9 -11.5<br />
GBP<br />
Pricing Date<br />
11-Mar-10 Term 1<br />
Term 2<br />
3m<br />
6m<br />
12m<br />
Repo Rate<br />
0.51%<br />
0.52%<br />
0.56%<br />
0.62%<br />
0.76%<br />
Sett. Date<br />
12-Mar-10<br />
01-Apr-10<br />
01-May-10<br />
14-Jun-10<br />
13-Sep-10<br />
14-Mar-11<br />
Yield BE Real BE Real BE Real BE Real BE Real BE<br />
UKTi Aug-11 -1.26% 1.91% 29.2 28.4 47.8 45.8 77.3 74.4 81.3 79.1 - -<br />
UKTi Aug-13 -0.71% 2.77% 13.3 10.6 22.0 15.0 34.5 21.4 36.8 9.9 67.8 9.1<br />
UKTi Jul-16 0.43% 2.90% 8.5 5.8 14.8 8.0 23.8 11.0 29.7 3.8 54.9 1.1<br />
UKTi Nov-17 0.71% 3.04% 0.0 -2.7 8.4 1.8 16.4 3.8 27.0 1.7 49.2 -2.9<br />
UKTi Apr-20 0.98% 3.12% 5.9 3.5 10.5 4.4 17.0 5.4 22.1 -1.0 40.7 -6.4<br />
UKTi Nov-22 1.08% 3.43% 0.2 -1.9 5.9 0.8 11.4 1.7 18.8 -0.4 33.7 -4.7<br />
UKTi Jul-24 1.15% 3.36% 4.4 2.4 7.9 2.8 12.9 3.2 16.8 -2.3 30.5 -7.9<br />
UKTi Nov-27 1.11% 3.44% 0.1 -1.7 4.2 -0.4 8.1 -0.4 13.4 -3.4 23.7 -9.5<br />
UKTi Jul-30 1.09% 3.49% 3.5 1.9 6.3 2.3 10.2 2.7 13.2 -1.4 23.7 -5.1<br />
UKTi Nov-32 1.00% 3.58% 0.1 -1.5 3.3 -0.7 6.3 -1.2 10.3 -4.3 18.2 -10.7<br />
UKTi Jan-35 0.98% 3.63% 2.6 1.2 4.7 1.1 7.5 0.7 9.6 -3.8 17.1 -9.5<br />
UKTi Nov-37 0.91% 3.68% 0.0 -1.4 2.7 -0.9 5.1 -1.6 8.3 -4.7 14.5 -11.1<br />
UKTi Mar-40 0.89% 3.71% 0.0 -1.3 2.3 -1.1 4.5 -1.9 7.3 -5.2 12.6 -12.1<br />
UKTi Nov-42 0.81% 3.76% 0.0 -1.3 2.1 -1.2 4.1 -2.1 6.6 -5.5 11.4 -12.2<br />
UKTi Nov-47 0.74% 3.80% 0.0 -1.2 1.9 -1.2 3.6 -2.2 5.8 -5.4 9.9 -12.0<br />
UKTi Mar-50 0.73% 3.81% 0.0 -1.2 1.7 -1.3 3.3 -2.3 5.2 -5.7 9.0 -12.3<br />
UKTi Nov-55 0.71% 3.80% 0.0 -1.1 1.7 -1.1 3.3 -2.0 5.2 -5.1 8.9 -11.1<br />
JPY<br />
Pricing Date<br />
11-Mar-10<br />
Term 1 Term 2<br />
3m<br />
6m<br />
12m<br />
Repo Rate<br />
0.12%<br />
0.12%<br />
0.12%<br />
0.13% 0.14%<br />
JPY DRI<br />
99.684<br />
99.200<br />
99.300<br />
99.280<br />
98.760 99.103<br />
Sett. Date<br />
16-Mar-10<br />
10-Apr-10<br />
10-May-10<br />
16-Jun-10<br />
16-Sep-10<br />
16-Mar-11<br />
Yield BE Yield BE Yield BE Real BE Real BE Real BE<br />
JGBI-1 Mar-14 1.47% -1.10% -10.7 -11.1 -5.2 -6.2 -1.6 -3.3 -6.9 -10.4 25.1 17.3<br />
JGBI-2 Jun-14 1.53% -1.12% -10.0 -10.5 -4.7 -5.8 -1.2 -3.0 -5.6 -9.4 25.0 16.6<br />
JGBI-3 Dec-14 1.42% -0.95% -9.0 -9.6 -4.6 -5.7 -1.7 -3.7 -6.3 -10.4 18.4 9.3<br />
JGBI-4 Jun-15 1.52% -0.98% -8.0 -8.5 -3.8 -5.0 -1.0 -3.1 -4.4 -8.8 18.7 9.1<br />
JGBI-5 Sep-15 1.39% -0.82% -7.8 -8.4 -4.0 -5.3 -1.5 -3.8 -5.6 -10.2 14.8 4.9<br />
JGBI-6 Dec-15 1.46% -0.85% -7.5 -8.1 -3.7 -5.1 -1.2 -3.6 -4.8 -9.5 15.5 5.2<br />
JGBI-7 Mar-16 1.45% -0.80% -7.1 -7.7 -3.5 -4.9 -1.2 -3.6 -4.6 -9.5 14.6 4.0<br />
JGBI-8 Jun-16 1.60% -0.92% -6.7 -7.4 -3.0 -4.5 -0.5 -3.0 -3.1 -8.1 17.0 6.1<br />
JGBI-9 Sep-16 1.51% -0.79% -6.6 -7.2 -3.1 -4.6 -0.8 -3.3 -3.7 -8.9 14.6 3.5<br />
JGBI-10 Dec-16 1.53% -0.77% -6.4 -7.1 -3.0 -4.6 -0.8 -3.4 -3.5 -8.8 14.2 2.8<br />
JGBI-11 Mar-17 1.59% -0.78% -6.1 -6.7 -2.7 -4.3 -0.5 -3.1 -2.9 -8.3 14.8 3.1<br />
JGBI-12 Jun-17 1.66% -0.82% -5.8 -6.5 -2.5 -4.1 -0.2 -3.0 -2.1 -7.8 15.5 3.5<br />
JGBI-13 Sep-17 1.63% -0.74% -5.6 -6.4 -2.4 -4.1 -0.3 -3.1 -2.3 -8.1 14.5 2.2<br />
JGBI-14 Dec-17 1.65% -0.72% -5.5 -6.3 -2.4 -4.1 -0.3 -3.2 -2.2 -8.1 14.1 1.6<br />
JGBI-15 Mar-18 1.69% -0.72% -5.3 -6.1 -2.2 -3.9 -0.1 -3.0 -1.8 -7.8 14.4 1.8<br />
JGBI-16 June-18 1.78% -0.76% -5.1 -6.0 -2.0 -3.9 0.2 -2.9 -1.2 -7.4 15.1 2.0<br />
Source: <strong>BNP</strong> Paribas<br />
Shahid Ladha / Herve Cros 12 March 2010<br />
<strong>Market</strong> <strong>Mover</strong>, Non-Objective Research Section<br />
36<br />
www.Global<strong>Market</strong>s.bnpparibas.com
Europe ITraxx Credit Indices<br />
• Outright: we were bullish last week with a<br />
target of 75. The strength of the market<br />
surprised us and enabled us to take our profit at<br />
74 after two days. Direction will now be given by<br />
equities, which are back to January’s highs and<br />
await a strong catalyst. At 75 on MAIN, we are<br />
neutral.<br />
• Update on 5/10y curves: what happened this<br />
week in indices is bang in line with what we<br />
predicted last week. Continuation of the<br />
steepening momentum in MAIN 5/10y. No value<br />
in HVL 5/10y. Catch-up of 5/10y curves for FIN<br />
SEN and SUB.<br />
• MAIN 5/10y: We keep our steepener for<br />
MAIN 5/10y with a Target of 19bp.<br />
MAIN<br />
Chart 1: MAIN vs. EUROSTOXX 600<br />
100<br />
last 3M<br />
95<br />
last<br />
90<br />
85<br />
80<br />
75<br />
70<br />
R 2 = 0.7827<br />
65<br />
60<br />
230 235 240 245 250 255 260 265<br />
EUROSTOXX 600<br />
Source: <strong>BNP</strong> Paribas<br />
Chart 2: MAIN vs. VIX<br />
• FIN SEN and SUB curves should be<br />
supported by too flat single-names’ curves and<br />
and the perspective of the roll. Target for both:<br />
13bp.<br />
100<br />
95<br />
90<br />
85<br />
R 2 = 0.4891<br />
• MAIN/XO trade: could supply trigger<br />
decompression?<br />
MAIN<br />
80<br />
75<br />
70<br />
last 3M<br />
last<br />
65<br />
Outright<br />
Last week, in the context of the global increase in<br />
risk appetite and the underperformance of credit<br />
indices relative to equity, volatility and commodity<br />
markets, we turned bullish on MAIN at 81 with the<br />
view that the index could reach 75 in the coming<br />
days. In about 2 days, the catch-up has been made<br />
and we closed our outright long on Monday with<br />
MAIN at 73.5/74. Since then, the market has been<br />
oscillating between 73.5 and 75.5.<br />
What’s next?<br />
The market has clearly found a resistance at the 74<br />
level, where it settled at the end of December. MAIN<br />
now trades almost in line with the levels suggested<br />
by the VIX and EUROSTOXX 600 indices; based on<br />
these 2 markets, the fair-value level probably stands<br />
at 72. The main obstacle to further tightening is the<br />
reluctance of the S&P to break the January’s highs in<br />
the absence of a fresh catalyst. It is also important to<br />
realize that the yield given by equity indices (3.27%<br />
for EUROSTOXX 600) is actually in line with the yield<br />
provided by investment grade credit indices;<br />
compounding the extremely low level of volatility in<br />
equities, equities look like a better play from a pure<br />
risk/reward perspective.<br />
60<br />
15 17 19 21 23 25 27 29<br />
Source: <strong>BNP</strong> Paribas<br />
All things considered, we are neutral at 75 as (1)<br />
there is no great value in being long at current levels<br />
and (2) a real correction is relatively unlikely 10 days<br />
before the roll in the absence of a strong catalyst. We<br />
do not see it.<br />
VIX<br />
Table 1: Curves’ levels and changes<br />
5y 5/10y 1W Chg 1M Chg<br />
MAIN 75 17 +1 +5<br />
SEN 80 11 +3 +8<br />
SUB 135 11 +3 +7<br />
HVL 111 25 - -<br />
XO 415 20 +10 +5<br />
Source: <strong>BNP</strong> Paribas<br />
Pierre Yves Bretonniere 12 March 2010<br />
<strong>Market</strong> <strong>Mover</strong>, Non-Objective Research Section<br />
37<br />
www.Global<strong>Market</strong>s.bnpparibas.com
Continuation of the steepening momentum in<br />
MAIN 5/10y:<br />
What happened this week in indices’ curves is bang<br />
in line with what we predicted last week:<br />
Our 5/10y steepener (recommended at +12 the 12-<br />
Feb), is now 5bp in the money. We see little catalyst<br />
for the flattening and expect the trade to stay immune<br />
to a retracement in 5y provided that it is limited; there<br />
is no incentive to cut the steepener ahead of the roll.<br />
Note that MAIN 3/5y trades at 24, which induces<br />
about 1b of curve per month.<br />
MAIN 5/10y is now 1bp steeper than theoretical.<br />
No upside in HVL 5/10y:<br />
Catch-up of 5/10y curves for FIN SEN and SUB.<br />
Last week, we pointed out these 2 steepeners as the<br />
best opportunities in curves. In particular, we<br />
highlighted that SEN and SUB 5/10y were trading<br />
much too flat compared to the outright 5y levels. The<br />
two curves steepened by 3bp this week.<br />
Taking into account the skews of these two curves<br />
(SEN 5/10y in line with intrinsic and SUB 5/10y 1.5bp<br />
steeper than intrinsic), we have no preferences<br />
between the two steepeners. The steepening<br />
potential on single-names curves is about 4-5bp,<br />
which means about 2-3bp of further steepening in the<br />
2 indices curves.<br />
5/10y<br />
Chart 3: 5/10y MAIN vs. outright 5y MAIN<br />
23<br />
21<br />
5/10Y MAIN (lhs)<br />
5Y MAIN (rhs inverted)<br />
60<br />
65<br />
19<br />
70<br />
17<br />
75<br />
15<br />
80<br />
13<br />
85<br />
11<br />
90<br />
9<br />
95<br />
7<br />
100<br />
09/09 10/09 11/09 12/09 01/10 02/10<br />
Source: <strong>BNP</strong> Paribas<br />
5/10y<br />
Chart 4: 5/10y HVL vs. outright 5y HVL<br />
40<br />
35<br />
5/10Y HVL (lhs)<br />
5Y HVL (rhs inverted)<br />
75<br />
95<br />
30<br />
25<br />
115<br />
20<br />
135<br />
15<br />
10<br />
155<br />
5<br />
175<br />
0<br />
09/09 10/09 11/09 12/09 01/10 02/10<br />
Source: <strong>BNP</strong> Paribas<br />
Chart 5: 5/10y FIN SEN vs. outright 5y FIN SEN<br />
18<br />
60<br />
16<br />
70<br />
14<br />
5y<br />
5y<br />
What’s the call?<br />
Keep MAIN 5/10y steepener. It should perform<br />
further in the roll. Target: 19bp.<br />
Keep FIN SEN 5/10y steepeners. Perspective of the<br />
roll and steepening potential in single-names CDS<br />
curves should make them steepen by 2-3bp. Target:<br />
13bp.<br />
5/10y<br />
12<br />
10<br />
8<br />
6<br />
5/10Y FIN SEN (lhs)<br />
4<br />
5Y FIN SEN (rhs inverted)<br />
2<br />
-<br />
9/09 10/09 11/09 12/09 1/10 2/10<br />
Source: <strong>BNP</strong> Paribas<br />
80<br />
90<br />
5y<br />
100<br />
110<br />
120<br />
Pierre Yves Bretonniere 12 March 2010<br />
<strong>Market</strong> <strong>Mover</strong> Non-Objective Research Section<br />
38<br />
www.Global<strong>Market</strong>s.bnpparibas.com
Update on “MAIN vs. XO”:<br />
We have seen this week again strong compression<br />
between XO and MAIN, with respective<br />
performances of -5.5bp and -28bp. The pace of the<br />
compression stands at x5, similar to last week. XO<br />
has been trading this week close to January’s<br />
tightest level (384 on 11-Jan) as did the US S&P 500<br />
and EUROSTOXX 600. The picture is quite different<br />
for MAIN which is trading around 10bp wider than<br />
January’s tights (65 on 11-Jan).<br />
The High-Yield cash market, which has been lagging<br />
in previous weeks, is now catching up and has<br />
tightened by 41bp this week; its High-Grade peer<br />
only tightened 5bp this week. The Merrill Lynch High-<br />
Yield index is now 25bp wider from the tights (11-<br />
Jan) to compare to about 3bp for the iBoxx High-<br />
Grade Non-Financials.<br />
What’s the call?<br />
There is absolutely no momentum in the carryneutral<br />
and beta-adjusted compression trades; the<br />
spread ratio XO/MAIN is steady at x5.5.<br />
There should be more volatility in this trade with the<br />
re-opening of the primary market. Our expectations<br />
are that new issuance in High-Yield should at one<br />
stage impact the level of the XO index; what we have<br />
seen this week (STENA and RENAULT in EUR and<br />
CEVA in USD) is clearly insufficient to trigger<br />
something.<br />
We keep our trade “Long risk 4 x MAIN / Short risk<br />
XO”.<br />
XO<br />
Chart 6: Chart1: XO vs. MAIN<br />
625<br />
XO MAIN<br />
103<br />
98<br />
575<br />
93<br />
525<br />
88<br />
83<br />
475<br />
78<br />
73<br />
425<br />
68<br />
375<br />
63<br />
09/09 10/09 11/09 12/09 01/10 02/10<br />
Source: <strong>BNP</strong> Paribas<br />
HY Cash<br />
Chart 7: HY Cash vs. HG Cash<br />
1000<br />
950<br />
EUR ML HY Aggregate (OAS)<br />
EUR iBoxx Non-Fins (OAS)<br />
145<br />
140<br />
135<br />
900<br />
130<br />
850<br />
125<br />
800<br />
120<br />
750<br />
115<br />
110<br />
700<br />
105<br />
650<br />
100<br />
600<br />
95<br />
9/09 10/09 11/09 12/09 1/10 2/10<br />
Source: <strong>BNP</strong> Paribas<br />
-100<br />
-120<br />
Chart 8: 4 x MAIN – 1 x XO trade history<br />
MAIN<br />
HG Cash (Non-Fin)<br />
-140<br />
-160<br />
-180<br />
-200<br />
-220<br />
-240<br />
-260<br />
-280<br />
09/09 10/09 10/09 11/09 11/09 11/09 12/09 12/09 01/10 01/10 02/10 02/10 03/10<br />
Source: <strong>BNP</strong> Paribas<br />
Pierre Yves Bretonniere 12 March 2010<br />
<strong>Market</strong> <strong>Mover</strong> Non-Objective Research Section<br />
39<br />
www.Global<strong>Market</strong>s.bnpparibas.com
Technical Analysis – Interest Rates & Commodities<br />
Bond & Short-Term Contracts<br />
• Europe: ST pullback seen again on key 3.093 area but failure to break it keeps MT tone bottoming/up<br />
• US: <strong>Market</strong> is trying to resume MT rising bias towards 4% initially but must still break above key 3.775/793 area<br />
• Short-term contracts m0: Expensive conditions now & a ST toppish tone developing.<br />
Equities & Commodities<br />
• WTI (Cl1): Supportive back within MT rising channel but needs to break above last top to rekindle MT rising bias<br />
• Equity markets: Supportive MT given pullback around their tops (US) or 61.8% (Europe). Watch them closely<br />
US 10y: Up for 4.35 target but still needs to break above 3.77/79 initially MT Trend: Up Range: 3.65/3.80<br />
The break above the MT falling channel 3.412 169.0<br />
However, current attempt to break above ST<br />
falling channel resistance (137.6) could<br />
allow a ST technical pullback on MT channel<br />
support (150.2). That is ST risk but won’t<br />
cancel current MT falling scenario.<br />
Tech Snapshot<br />
- MT rising channel & 2-dip neckline break.<br />
- Trying to break above ST falling channel<br />
STRATEGY: Cautious will use a pullback on<br />
146//150 to sell for 115/120 S/L 155<br />
Christian Sené 12 March 2010<br />
<strong>Market</strong> <strong>Mover</strong>, Non-Objective Research Section<br />
40<br />
www.Global<strong>Market</strong>s.bnpparibas.com
Germany 10y: Rebound again from key 3.093 low. Watch now 3.328 MT Trend: Neutral/Up Range: 3.10/3.30<br />
Last fall extended below key 3.193 (old MT<br />
61.8%) to again reach key 3.093 (October<br />
low & last range trading low boundary) from<br />
which it is rebounding once more.<br />
This area should be the basis to resume<br />
previous MT weak bias (theoretical target is<br />
3.70) but decisive break above 3.307/3.328<br />
(61.8% & MT falling resistance) is needed.<br />
If not, main risk remains a break below<br />
3.093 to open way towards 2.849 (2009 low)<br />
2.849 3.411/433<br />
Tech Snapshot<br />
- Rebound from key 3.093 (October low)<br />
- Back around key MT 61.8% (3.193)<br />
Strategy: Still short within 3.15/20 for<br />
3.45/70 S/L below 3.09 now<br />
UK 10y: Still up MT for 4.50 but watch ST rising wedge support (4.076) MT Trend: Up Range: 4.02/4.25<br />
Break above MT falling channel & above<br />
4.084 (June 09 top & wave “A” top)<br />
strengthened the MT rising scenario towards<br />
4.30/4.50 theoretical target area. Trading<br />
back around key 4.076/4.84 (ST weekly<br />
rising wedge support +June 09 top)<br />
A break below it is still ST risk as it would<br />
3.836
Trade Reviews<br />
Options, Money <strong>Market</strong> and Bond Trades – Tactical & Strategic Trades<br />
This page summarises our main tactical (T) and strategic (S) trades. The former focus on short-term horizons (a few weeks)<br />
allowing one to play any near-term corrections within a defined trend, while the latter rely on a medium-term assumed trend.<br />
For each trade we provide the expected target and the recommended stop loss.<br />
Current* Targets Stop Entry<br />
Existing Strategies<br />
Yield Curves<br />
EUR Flattener Receive EUR 1M-fwd 2s10s<br />
Asymmetric near-term response to "gradual" phasing out of unconventional<br />
policy/liquidity measures.<br />
GBP Steepener Pay GBP 1Y-fwd 2s10s<br />
A dovish BoE and a toxic sovereign debt/deficit combination should keep the spot<br />
swap curve at steep levels in the medium term.<br />
USD Butterfly Pay USD 2M-fwd 2y3y5y<br />
Near low end of historical range. We are positioned for a Fed on hold and this is an<br />
ideal hedge. Negative carry/roll is less in forward than spot.<br />
Money <strong>Market</strong>s<br />
Euribor Basis Buy ERM0 Basis<br />
OIS/Bor spreads are at very interesting entry levels compared to the evolution of<br />
CDS and other risk indicators. Moreover, ECB liquidity volatility should be<br />
supportive of this strategy.<br />
Eurodollar Spread Buy EDZ0Z1<br />
Hawkish FOMC statement should lead to higher rate hike expectations, and the<br />
recent flattening in whites/reds on flight-to-quality concerns provides a decent entry<br />
point. Spread rolls up from Dec/Dec to Sep/Sep.<br />
183.0<br />
(T)<br />
148.0<br />
(S)<br />
-31.0<br />
(S)<br />
24.0<br />
(S)<br />
138.0<br />
(T)<br />
170.0 190.0 184.8<br />
(04-Mar)<br />
200.0 139.0 147.0<br />
(12-Feb)<br />
-5.0 -38.0 -27.75<br />
(15-Jan)<br />
40.0 20.0 24.0<br />
(29-Jan)<br />
180.0 130.0 146.0<br />
(27-Jan)<br />
Options<br />
Sterling Fly Buy L H0 9912/25/37 P<br />
3.0<br />
Suspension of QE appears to have generated moderated funding pressures: 3M (T)<br />
Libor has been creeping higher since the beginning of Feb.<br />
Euribor Fly Buy ERU0 9862/75/87 P<br />
1.5<br />
Cheap downside strategy, playing the normalisation of Eonia. The position<br />
(S)<br />
complements with the upside fly (no-normalisation strategy).<br />
Euribor Fly Buy ERU0 9912/25/37 C<br />
2.0<br />
Upside protection in case of liquidity spillover post June. Rolldown trade.<br />
(S)<br />
Eurodollar Call Buy EDU0 99.25 C<br />
32.0<br />
View for a Fed on hold makes rolldown strategies attractive. In this case, the theta (T)<br />
loss over 3m or 6m is more than compensated by the rolldown in an unchanged<br />
scenario.<br />
Sterling Fly Buy L Z0 9900/25/50 C<br />
7.0<br />
Rolldown strategy for unchanged MPC through 2010.<br />
(S)<br />
*Tactical (T) and strategic (S) trades. **Risk: vega, gamma for options, or ΔDV01 for futures, bonds and swaps.<br />
12.5 0.0 3.0<br />
(18-Feb)<br />
12.5 0.0 1.5<br />
(13-Jan)<br />
12.5 0.0 1.5<br />
(12-Jan)<br />
50.0 0.0 23.5<br />
(08-Jan)<br />
25.0 0.0 3.5<br />
(05-Jan)<br />
Carry<br />
/ mth<br />
Risk**<br />
P/L<br />
(ccy/Bp)<br />
-3bp 10k/01 EUR +18k<br />
+1.8bp<br />
5k/01 GBP +5k<br />
+1bp<br />
15k/01 USD -49k<br />
-3bp<br />
5k/01 EUR +0k<br />
+0bp<br />
10k/01 USD -90k<br />
-9bp<br />
7k/01 GBP 0k<br />
0bp<br />
10k/01 EUR 0k<br />
0bp<br />
10k/01 EUR +5k<br />
+0.5bp<br />
5k/01 USD +43k<br />
+9c<br />
5k/01 GBP +18k<br />
+3.5c<br />
Interest Rate Strategy 12 March 2010<br />
<strong>Market</strong> <strong>Mover</strong>, Non-Objective Research Section<br />
42<br />
www.Global<strong>Market</strong>s.bnpparibas.com
FX: The Way of Wen<br />
• Wen has set a course for China to<br />
encourage domestic growth by developing<br />
social policies. Under this benign thesis…<br />
• …global demand should rise, but G10<br />
financing will be more expensive and labour will<br />
tend to inflate more easily.<br />
• We repeat our call since December for lower<br />
FX vols and particularly EURMXN and USDCAD.<br />
We note that the lower bound for these vols is<br />
much higher than in previous cycles.<br />
• Spot wise, we remain positive on USDJPY<br />
and CADJPY and especially once Japanese<br />
year-end effects fade in a week or two.<br />
• The next downtrend in EURUSD may be<br />
triggered by an eventual shift of the market out<br />
of sovereign into corporate bonds.<br />
The way of Wen<br />
Last weekend, Premier Wen Jiabao stated the goal<br />
of Chinese economic policy. Simply put, it will be to<br />
replace an externally driven model by a more<br />
internally driven one through the use of social policy.<br />
The experiences of post-war US/Europe offer some<br />
guidance.<br />
Chart 1: Secular Rise in US Consumption<br />
Source: Ecowin Reuters, <strong>BNP</strong> Paribas. Note: Social policy in the right<br />
proportions can be the trigger for an acceleration of consumption much as<br />
the development of securities markets was for the development of<br />
Western companies in the past centuries. The triggers were the<br />
development of limited personal responsibility and enforceable laws. Since<br />
the 1950s, we have seen a rise in government expenditure partly on the<br />
back of rising social spending. These programmes accelerated in the 60’s<br />
and started kicking later (e.g. Medicare) as the ability to leverage rose in<br />
the 1980s. A corollary was a switch out of manufacturing into services and<br />
rising demand for foreign goods as wealth increased.<br />
8%<br />
7%<br />
Chart 2: Precautionary Savings Fall<br />
14<br />
12<br />
Post-war, government spending rose trend-wise on<br />
the back of social programmes, allowing<br />
consumption to sharply accelerate as a proportion of<br />
GDP. The following generation, of baby boomers,<br />
consumed even more. Boomers started leveraging,<br />
helped by de-regulation and Asia keeping its<br />
currencies undervalued – offering cheap funding<br />
conditions. This trend accelerated exponentially<br />
following the Asian crisis as a reaction to USD<br />
shortages in that period.<br />
6%<br />
Volatility of growth<br />
5%<br />
4%<br />
Personal savings rate<br />
3%<br />
2%<br />
1%<br />
0%<br />
Mar-50 Mar-56 Mar-62 Mar-68 Mar-74 Mar-80 Mar-86 Mar-92 Mar-98 Mar-04<br />
10<br />
8<br />
6<br />
4<br />
2<br />
0<br />
While G10 economies may have reached limits in the<br />
ability to transfer risk from current generations to<br />
future generations via the state and securities<br />
markets, China and parts of Asia stand at the other<br />
extreme of this spectrum with less-developed<br />
securities and social markets. A credible shift in the<br />
many years to come would reduce Asian savings<br />
significantly as well as help to develop the local<br />
financial markets.<br />
Source: Bloomberg, <strong>BNP</strong> Paribas. Note: Precautionary savings are<br />
savings linked to uncertainty in the volatility of instantaneous future income<br />
as well as its expected path. In finance and insurance parlance, they<br />
correspond to the development of a risk transfer market between the<br />
individual agents and the state. Here, we are referring to a combination of<br />
social policy and aggressive counter-cyclical policy (inflation targeting &<br />
Greenspan put). Starting in 1983, we see a regime shift linked to a<br />
combination of an ability for consumers to leverage, a shift in monetary<br />
policy target and social programmes still kicking in from the 1970s and<br />
1960s. The impact of the shift in policy target and higher leverage reduces<br />
the volatility or risks linked to growth. This seems to be the cause of a<br />
rather brutal drop in the personal savings rate.<br />
Lower Asian savings boosts global consumption<br />
As Asian consumption increases as a percentage of<br />
GDP, demand for non-tradable goods will rise,<br />
particularly as services gain ground relative to<br />
Sebastien Galy 12 March 2010<br />
<strong>Market</strong> <strong>Mover</strong>, Non-Objective Research Section<br />
43<br />
www.Global<strong>Market</strong>s.bnpparibas.com
manufacturing. Demand for services should feed into<br />
increased demand for skilled labour.<br />
The combined impact should be inflation in the nontraded<br />
sector, especially as services are less<br />
productive. Should the CNY remain stable, the<br />
external sector will overheat, leading to wider<br />
inflationary pressure in the country. Indeed, on a<br />
purely qualitative basis, there have already been<br />
reports in the past weeks of firms specialising in<br />
recruitment for coastal factories significantly<br />
increasing compensation to attract new workers in<br />
some regional areas.<br />
Eventually, China and the broader Asia will no longer<br />
export deflation and excess supply to the rest of the<br />
world but inflation and rising demand (in relative<br />
rather than absolute terms). Such a boost in demand<br />
at a time when technology is likely to pick up in G10<br />
to compensate for less leveraged internal demand is<br />
likely to be a positive for risk, assuming the process<br />
of rebalancing goes well – especially on the political<br />
front. We would warn that, to get such a boost in<br />
productivity, parts of Europe are poorly placed<br />
relative to the US as they did not adjust their labour<br />
costs to generate the income for such investments.<br />
Indeed, given that credit/equity has performed<br />
similarly in the US and Europe, a reassessment of<br />
this seems likely as the sovereign thematic abates.<br />
Chart 3: OECD Growth and FX Reserves<br />
25<br />
20<br />
15<br />
10<br />
5<br />
0<br />
-5<br />
Global FX Reserves (% y/y lhs)<br />
-10<br />
OECD Growth (% y/y) (rhs)<br />
-15<br />
82 86 88 90 92 94 96 98 00 02 04 06 08<br />
Source: Reuters Ecowin Pro/<strong>BNP</strong> Paribas<br />
Chart 4: Asian Share of Global Imports<br />
7<br />
6<br />
5<br />
4<br />
3<br />
2<br />
1<br />
0<br />
-1<br />
-2<br />
-3<br />
-4<br />
-5<br />
Lower savings means higher financing costs for<br />
G10<br />
As savings fall as a percentage in GDP in Asia so will<br />
global savings, as rising income and savings in the<br />
US and UK will probably not compensate. Hence,<br />
G10 countries which require external financing such<br />
as the UK will find it increasingly costly to attract<br />
Asian demand in this new equilibrium. As the trend in<br />
Asia/USD starts again, foreign reserve recycling into<br />
the USD and especially the EUR will fall so that their<br />
yield curves will be steeper than would otherwise be<br />
the case.<br />
The good news for the US is that there is natural<br />
demand for savings coming from Japan, replacing<br />
official buying by Chinese state authorities. China,<br />
which is reorienting its economic growth from supply<br />
towards demand, will ultimately see its current<br />
account surplus shrink. The declining current account<br />
surplus will reduce the need for the Chinese<br />
authorities to buy foreign debt assets.<br />
In 2005, Japanese life insurers were buying even as<br />
the Fed tightened, attracted by rising bond US yields.<br />
Note, US bond yields received a boost after China<br />
converted its currency peg into a free float as<br />
markets assumed that China’s new currency regime<br />
would reduce China’s demand for USD-denominated<br />
debt assets. The US yield curve developed into a<br />
Source: Reuters EcoWin Pro, <strong>BNP</strong> Paribas<br />
bearish flattening regime, with private investors<br />
increasingly attracted by rising bond yields buying<br />
into the market on a currency un-hedged basis.<br />
USDJPY, which initially declined from 113 to 109<br />
following China’s decision to de-peg, then rallied<br />
strongly. Please note, Japan has been the biggest<br />
private foreign buyer of US bonds over the past five<br />
years, with yield differentials attracting these flows.<br />
What we foresee is that China’s official accounts will<br />
be replaced by Japanese private accounts in funding<br />
Western sovereign deficits. Initially, most of these<br />
flows will be directed into the US bond market as the<br />
US is one of the most advanced of the G7<br />
economies in terms of its recovery process. Once the<br />
Fed starts hiking rates, JPY-based investors will<br />
reduce their currency hedges on existent bond<br />
positions, which could then spark a major rally of<br />
USDJPY. We therefore regard China de-pegging as<br />
a long-term bullish USDJPY signal.<br />
Sebastien Galy 12 March 2010<br />
<strong>Market</strong> <strong>Mover</strong>, Non-Objective Research Section<br />
44<br />
www.Global<strong>Market</strong>s.bnpparibas.com
Leaders have more control on tradables<br />
Finally, in a world where EMKs are more prominent<br />
as the G10 countries clean up bank and government<br />
balance sheets, emerging-market economies are<br />
more likely to provide the incremental source of<br />
demand or capital which will tip the global business<br />
cycle and consequently cause spikes in<br />
commodities. This suggests that G10 economies<br />
such as Canada are less likely to be the drivers of<br />
tradable goods than they were in the past. This<br />
would again argue that G10 central banks will find if<br />
more onerous to control inflation.<br />
An example – BoC will turn more hawkish<br />
The case for the Bank of Canada to tighten faster<br />
than the Fed is strengthening. Strong internal<br />
demand, evidence of existing excesses in credit and<br />
reduced risks of outsourcing in the coming cycle are<br />
all factors underpinning that argument.<br />
While non-Canadians widely see the country as an<br />
economic extension of the US, their business cycles<br />
can differ quite significantly depending on monetary<br />
and fiscal policy. Q4 GDP growth accelerated to 5%,<br />
not far from the US’s 5.9%, but was supported by<br />
consumption, residential investment and net exports<br />
– adding to bullish CAD sentiment.<br />
Chart 5: Leading Indicator Suggests Tightening<br />
and a Flattening of the Yield Curve<br />
-2<br />
-1<br />
0<br />
1<br />
2<br />
3<br />
4<br />
OECD leading indicator (RHS)<br />
10s2s (LHS inv)<br />
5<br />
Oct-89 Oct-92 Oct-95 Oct-98 Oct-01 Oct-04 Oct-07<br />
Source: <strong>BNP</strong> Paribas, Bloomberg. Note: The leading indicator is pushed four months<br />
into the future, which represents its forecasting ability at publication time. The carry<br />
between 2s and 10s is roughly 2% or the exact premium required by Japanese lifers.<br />
Chart 6: CAD and Monetary Velocity<br />
108<br />
106<br />
104<br />
102<br />
100<br />
98<br />
96<br />
94<br />
92<br />
90<br />
The mix of cheap liquidity from foreign central banks<br />
investing in Canada and the BoC are already<br />
showing signs of creating some localised excesses in<br />
the housing market.<br />
Foreign central banks’ move away from deposits in<br />
commercial banks, likely joined by Japanese lifers,<br />
will further flatten the steepness in the 2s10s curve,<br />
boosting liquidity. The costs of financing a house or<br />
other long-term liabilities will be reduced. Hence,<br />
central banks and large scale asset managers – by<br />
increasing their duration as the economy improves<br />
and in light of the clean Canadian balance sheet –<br />
will accelerate the supply of cheap liquidity.<br />
The first stage at the beginning of a very difficult<br />
economic period is extreme cautiousness against a<br />
tightening bias. Reports from the BoC do not see<br />
signs of housing bubbles and lending is indeed not<br />
accelerating. Nonetheless, policy today is relevant for<br />
what will happen 6-18 months down the road.<br />
Risk - Link between liquidity and commodities<br />
A key risk for the CAD is that it would suffer two<br />
types of shocks. The first is linked to fiscal<br />
contraction globally, which is typically of such a slow<br />
and prolonged nature that it is unlikely to be a source<br />
of shock. The second is a brutal correction in<br />
commodities. As USD-based liquidity is reduced by<br />
policy tightening in Asia and Asian countries buying<br />
fewer US Bills and Treasuries, two impacts are<br />
Source: Reuters EcoWin, <strong>BNP</strong> Paribas. Note: Playing the devil’s advocate, monetary<br />
velocity in Canada has simply not accelerated. Given that the banks have clean<br />
balance sheets, this is a sign of weak demand. While there are signs that capex has<br />
started to pick up again in the US as cost cutting is no longer the easy way out, it is<br />
also worth considering that the M&A cycle is centred around vertical integration, which<br />
is consistent with a view of weak expected growth in the coming years.<br />
starting to make themselves felt: 1) the USD is<br />
strengthening relative to non-EM currencies and may<br />
have a negative impact on commodity prices; and 2)<br />
falling demand for commodities out of China (used<br />
partly as a hedge against QE). Another risk is the<br />
ability to rebalance Canadian exports away from the<br />
weaker US consumer; there, the story is more<br />
encouraging as the main determinant is global<br />
growth (Chart 8).<br />
Spot and vol implication<br />
While we are constructive on short USDCAD, the<br />
more interesting trade remains in the volatility space<br />
where volatilities even after very sharp drops remain<br />
expensive.<br />
Sebastien Galy 12 March 2010<br />
<strong>Market</strong> <strong>Mover</strong>, Non-Objective Research Section<br />
45<br />
www.Global<strong>Market</strong>s.bnpparibas.com
The question is when to stop selling volatility. The<br />
answer this time round is much sooner than in<br />
previous cycles. The ability to share risks was<br />
significantly reduced as was the ability to leverage<br />
long-term cheap capital. In addition, banks will<br />
penalise much more heavily non-hedgeable or nontradable<br />
risks. As risk compression is a mix of an<br />
ability to reduce idiosyncratic (e.g. via a CDS swap)<br />
and systemic risks (e.g. growth fears), the lower<br />
bound that can be reached will be significantly higher<br />
than in the past.<br />
Similarly in Mexico, FX volatilities remain somewhat<br />
high, yet the economic environment has stabilised,<br />
leverage has dropped like a stone and measures<br />
taken by the central bank to increase its foreign<br />
reserves vastly reduce any risk of another dangerous<br />
funding crisis.<br />
Hence, we continue to recommend short vega<br />
positions in the 3-12M bucket and see the best<br />
opportunity in EURMXN given that the correlation<br />
risk between EURUSD and USDMXN is overpriced,<br />
as are to some extent EURUSD vols.<br />
Chart 7: CAD and Commodity Index<br />
Source: <strong>BNP</strong> Paribas, Ecowin Reuters<br />
2000<br />
1500<br />
1000<br />
500<br />
Chart 8: Canadian Trade Balance<br />
0<br />
-500<br />
Trade Balance NSA<br />
Trade Balance with Asia<br />
Trade Balance with US<br />
Source: <strong>BNP</strong> Paribas, Bloomberg. Note: The main determinant of net exports is not<br />
rebalancing out of the US into Asia but overall global demand. Hence, rebalancing is<br />
only a secondary mechanism. As such it suggests that, in the case of Canada, the<br />
performance of the US surely puts it a disadvantage but the main driver remains global<br />
growth. Nonetheless, one should be wary of where the final consumer resides, that is<br />
Asian exports re-exported to the US or Europe.<br />
Sebastien Galy 12 March 2010<br />
<strong>Market</strong> <strong>Mover</strong>, Non-Objective Research Section<br />
46<br />
www.Global<strong>Market</strong>s.bnpparibas.com
Commodity Currency Exhaustion<br />
• The commodity currencies were among the top performers throughout much of 2009, but at the<br />
end of last year and the beginning of 2010 a far more mixed picture is developing…<br />
• …indeed, the commodity currencies appear to be running out of steam ahead of the highs seen in<br />
early 2008<br />
• AUDUSD gains have been capped since October with major channel support as being challenged<br />
as technical indicators generate negative momentum signals<br />
• NZDUSD is developing the most negative momentum among the commodity currencies<br />
Commodity currencies rebounded strongly<br />
throughout much of 2009, putting them among<br />
the top performers of last year. However, this<br />
strong upward momentum is now running out of<br />
steam, with most of the commodity currencies<br />
stalling ahead of the highs seen in early 2008<br />
and have subsequently been confined to a<br />
narrow trading range over the past four months.<br />
Technical indicators are also starting to suggest<br />
that momentum is turning negative in most cases<br />
suggesting that a bearish breakout from these<br />
trading ranges is now likely.<br />
The AUDUSD uptrend has been capped since<br />
October resulting in a broad consolidation range<br />
developing over recent months. Technical<br />
indicators suggest that momentum is now turning<br />
negative implying that the up trend is set to be<br />
challenged. The most recent attempt to rebound<br />
appears to have run out of steam well ahead of<br />
the top end of the range, leaving down trendline<br />
resistance unchallenged. In fact near-term<br />
channel support in the 0.9100 area is now set to<br />
be tested and a break below here will trigger<br />
Some further nearterm<br />
corrective gains<br />
are still possible in the<br />
coming week, but we<br />
expect the medium<br />
term EURUSD trend<br />
to remain bearish.<br />
Down trendline<br />
resistance currently<br />
intervenes at the<br />
1.3785 level with<br />
further resistance at<br />
1.3835. From 1.3835<br />
we expect the down<br />
trend to be resumed.<br />
Source: <strong>BNP</strong> Paribas<br />
1.52<br />
1.50<br />
1.48<br />
1.46<br />
1.44<br />
1.42<br />
1.40<br />
1.38<br />
1.36<br />
1.34<br />
Chart 1: EUR/USD – rebound to remain limited<br />
1.3835<br />
20-Jul-09<br />
1.4446<br />
another bearish signal opening the way for a decline<br />
towards the lower end of the broad trading range<br />
targeting 0.8800 initially and the 0.8780 February<br />
low. Over the medium term, a break below here will<br />
generate a major negative signal opening the way for<br />
a decline towards the 0.8260/0.8200 support area<br />
which also coincides with the 38.2% retracement<br />
level of the rally seen from February to November<br />
last year.<br />
The most bearish signals among the major<br />
commodity currencies are being generated by the<br />
NZD. The NZDUSD pullback from the 0.7635<br />
recovery peak seen in October last year is starting to<br />
develop negative momentum. Up trendline support<br />
has already been broken and medium term technical<br />
indicators are now triggering outright bearish signals.<br />
A test of the 0.6810 February low is expected with a<br />
break below here opening initial downside potential<br />
towards major channel support at 0.6755 and then<br />
the 0.6585 support which also coincides with the<br />
38.2% retracement of the rally seen in 2009.<br />
1.4842<br />
16-Sep-09<br />
1.4480<br />
1.5060<br />
1.4630<br />
1.5144<br />
13-Nov-09<br />
1.4219<br />
1.4582<br />
12-Jan-10<br />
1.3435<br />
11-Mar-10<br />
Ian Stannard 12 March 2010<br />
<strong>Market</strong> <strong>Mover</strong>, Non-Objective Research Section<br />
47<br />
www.Global<strong>Market</strong>s.bnpparibas.com
The latest AUDUSD<br />
attempt to rebound is<br />
running out of steam<br />
well ahead of the<br />
upper end of the major<br />
trading range.<br />
Technical indicators<br />
are turning lower<br />
giving momentum sell<br />
signals.<br />
A test of the key<br />
support at 0.9100 is<br />
expected. A break<br />
here will target 0.8800<br />
and 0.8780.<br />
Source: <strong>BNP</strong> Paribas<br />
Among the major<br />
commodity currencies<br />
the NZD is developing<br />
the most bearish<br />
signals with technical<br />
indicators now<br />
breaking lower.<br />
Major up trendline<br />
support has already<br />
been broken and we<br />
now expect a test of<br />
the 0.6810 February<br />
low.<br />
A break here targets<br />
0.6585.<br />
Source: <strong>BNP</strong> Paribas<br />
USDCAD has retested<br />
the major support at<br />
the 1.0220/05 levels<br />
which forms the base<br />
of the trading range<br />
that has developed<br />
over the course of the<br />
past six months.<br />
Technical indicators<br />
are now rebounding<br />
suggesting that<br />
USDCAD will also<br />
develop a rebound. A<br />
break of 1.0370<br />
triggers a bullish<br />
signal.<br />
Source: <strong>BNP</strong> Paribas<br />
Chart 2: AUD/USD – rebound is running out of steam<br />
0.9400<br />
0.9330<br />
0.92<br />
0.8910<br />
0.87<br />
0.8735<br />
0.8475<br />
0.8580<br />
0.82<br />
0.8155<br />
0.7705<br />
0.77<br />
20-Jul-09 16-Sep-09 13-Nov-09 12-Jan-10 11-Mar-10<br />
Chart 3: NZD/USD – Developing bearish signals<br />
0.77<br />
0.7635<br />
0.75<br />
0.7440<br />
0.73<br />
0.7150<br />
0.71<br />
0.6975<br />
0.69<br />
0.67<br />
0.6810<br />
0.65<br />
0.63<br />
0.6195<br />
0.61<br />
20-Jul-09 16-Sep-09 13-Nov-09 12-Jan-10 11-Mar-<br />
Chart 4: USD/CAD – major support remains intact<br />
1.10 1.0992<br />
1.09<br />
1.0869<br />
1.08<br />
1.0780<br />
1.0750<br />
1.07<br />
1.0680<br />
1.06<br />
1.05<br />
1.04<br />
1.03<br />
1.0205<br />
1.0225<br />
1.02<br />
16-Sep-09<br />
13-Nov-09<br />
12-Jan-10<br />
11-Mar-1<br />
Ian Stannard 12 March 2010<br />
<strong>Market</strong> <strong>Mover</strong>, Non-Objective Research Section<br />
48<br />
www.Global<strong>Market</strong>s.bnpparibas.com
Currency Spot Trade Recommendations Date<br />
NZD/USD 0.6990 Sell 0.7060, stop 0.7260, target 0.6260 11 Mar 2010<br />
GBP/SEK 10.705 Sell 10.950, stop 11.05, target 10.300 04 Mar 2010<br />
NOK/SEK 1.2130 Sell 1.2210, stop 1.2310, target 1.1910 25 Feb 2010<br />
GBP/USD 1.5040 Sell 1.5300, stop 1.5500, target 1.4480 04 Mar 2010<br />
USD/CHF 1.0690 Long at 1.0560, stop raise to 1.0640, target 1.10 01 Feb 2010<br />
USD/CAD 1.0270 Long at 1.0275, stop 1.0200, target 1.0550 08Mar 2010<br />
EUR/JPY 123.80 Shorts from 121.55 stopped at 123.55 26 Feb 2010<br />
AUD/JPY 82.70 Shorts from 79.85 stopped at 80.85 02 Mar 2010<br />
Source: <strong>BNP</strong> Paribas<br />
Ian Stannard 12 March 2010<br />
<strong>Market</strong> <strong>Mover</strong>, Non-Objective Research Section<br />
49<br />
www.Global<strong>Market</strong>s.bnpparibas.com
Economic Calendar: 12 - 19 March<br />
GMT Local Previous Forecast Consensus<br />
Fri 12/03 07:45 08:45 France Current Account (nsa) : Jan EUR-3.6bn EUR-4.0bn EUR-3.9bn<br />
09:00 10:00 Spain CPI m/m : Feb -1.0% -0.1% -0.1%<br />
09:00 10:00 CPI y/y : Feb 1.0% 0.9% 0.9%<br />
09:00 10:00 HICP m/m : Feb -1.1% -0.1% -0.1%<br />
09:00 10:00 HICP y/y : Feb 0.9% 0.9% 0.9%<br />
10:00 11:00 Eurozone ECB’s Weber Speaks in Bonn<br />
11:00 12:00 Industrial Production (sa) m/m : Jan -1.5% 1.5% 0.7%<br />
11:00 12:00 Industrial Production (wda) y/y : Jan -4.7% -1.2% -1.6%<br />
20:45 21:45 ECB’s Trichet Speaks at Economic Summit of Stanford Institute of Economic Policy Research<br />
11:00 11:00 UK BoE’s Dale Speaks<br />
12:00 07:00 Canada Unemployment Rate : Feb 8.3% 8.4% 8.3%<br />
12:00 07:00 Payroll Jobs (chg) m/m : Feb 43.0k 10.0k 15.5k<br />
13:30 08:30 US Retail Sales m/m : Feb 0.5% -0.7% -0.2%<br />
13:30 08:30 Retail Sales Ex-Autos m/m : Feb 0.6% -0.2% 0.1%<br />
14:55 09:55 Michigan Sentiment (Prel) : Mar 73.6 74.5 74.0<br />
15:00 10:00 Business Inventories : Jan -0.2% 0.1% 0.1%<br />
Sun 14/03 07:00 02:00 US Clocks Go Forward 1 Hour<br />
Mon 15/03 00:01 00:01 UK Rightmove House Price Index : Mar<br />
10:00 11:00 Eurozone Employment q/q : Q4 -0.5% -0.3% n/a<br />
10:00 11:00 Employment y/y : Q4 -2.1% -2.0% n/a<br />
12:00 13:00 ECB’s Gonzalez-Paramo Speaks in Zaragoza<br />
16:00 17:00 Finance Ministers Meet in Brussels<br />
12:30 08:30 US Empire State Survey : Mar 24.9 20.0 22.0<br />
13:00 09:00 TICS Data : Jan USD60.9bn USD40.0bn n/a<br />
13:15 09:15 Industrial Production m/m : Feb 0.9% 0.0% 0.1%<br />
13:15 09:15 Capacity Utilisation Rate : Feb 72.6% 72.6% 72.6%<br />
17:00 13:00 NAHB Housing <strong>Market</strong> Index : Mar 17 17 17<br />
Tue 16/03 00:30 11:30 Australia RBA MPC Minutes<br />
07:00 08:00 Eurozone EU25 New Car Registrations : Feb<br />
10:00 11:00 HICP m/m : Feb -0.8% 0.3% 0.3%<br />
10:00 11:00 HICP y/y : Feb 1.0% 0.9% 0.9%<br />
10:00 11:00 HICP Core m/m : Feb -1.5% 0.4% n/a<br />
10:00 11:00 HICP Core y/y : Feb 0.9% 0.8% 0.8%<br />
10:00 11:00 Ex-Tobacco Index : Feb 107.75 108.08 n/a<br />
07:45 08:45 France CPI m/m : Feb -0.2% 0.4% 0.4%<br />
07:45 08:45 CPI y/y : Feb 1.1% 1.1% 1.1%<br />
07:45 08:45 HICP m/m : Feb -0.2% 0.4% n/a<br />
07:45 08:45 HICP y/y : Feb 1.2% 1.2% n/a<br />
07:45 08:45 Ex-Tobacco CPI (Final, nsa) : Feb 118.32 118.83 n/a<br />
08:30 09:30 EU Finance Ministers Meet in Brussels<br />
08:30 09:30 Neths Industrial Production m/m : Jan -2.2% 1.8% 1.0%<br />
08:30 09:30 Industrial Production y/y : Jan 0.9% 2.2% n/a<br />
08:30 09:30 Retail Sales y/y : Jan 3.2% -4.5% n/a<br />
09:00 10:00 Italy CPI (Final) m/m : Feb 0.1% (p) 0.1% n/a<br />
09:00 10:00 CPI (Final) y/y : Feb 1.2% (p) 1.2% n/a<br />
09:00 10:00 HICP (Final) m/m : Feb 0.0% (p) 0.0% n/a<br />
09:00 10:00 HICP (Final) y/y : Feb 1.1% (p) 1.1% n/a<br />
09:30 09:30 UK DCLG UK House Prices y/y : Jan<br />
10:00 11:00 Germany ZEW Expectations : Mar 45.1 43.0 44.0<br />
10:00 11:00 ZEW Current Assessment : Mar -54.8 -52.0 -51.0<br />
12:30 08:30 US Import Prices m/m : Feb 1.4% -0.3% -0.2%<br />
12:30 08:30 Import Prices Ex-Petroleum m/m : Feb 0.6% 0.5% n/a<br />
12:30 08:30 Housing Starts : Feb 591k 555k 570k<br />
18:15 14:15 FOMC Rate Announcement<br />
<strong>Market</strong> Economics 12 March 2010<br />
<strong>Market</strong> <strong>Mover</strong><br />
50<br />
www.Global<strong>Market</strong>s.bnpparibas.com
Economic Calendar: 12 - 19 March (cont)<br />
GMT Local Previous Forecast Consensus<br />
Wed 17/03 23:50 08:50 Japan Tertiary Index (sa) m/m : Jan -0.9% 0.9% 1.3%<br />
(16/03)<br />
BoJ Rate Announcement<br />
09:30 09:30 UK Unemployment Change : Feb 23.5k -10.0k 6.0k<br />
09:30 09:30 Unemployment Rate (Claimant) : Feb 5.0% 5.0% 5.1%<br />
09:30 09:30 BoE MPC Minutes<br />
10:00 11:00 Eurozone Labour Cost Index (y/y) : Q4 3.2% 2.9% n/a<br />
OPEC 156th OPEC Meeting<br />
12:30 08:30 US PPI (sa) m/m : Feb 1.4% 0.0% -0.2%<br />
12:30 08:30 PPI (sa) y/y : Feb 4.6% 5.2% 4.9%<br />
12:30 08:30 PPI Core (sa) m/m : Feb 0.3% 0.2% 0.1%<br />
12:30 08:30 PPI Core (sa) y/y : Feb 1.0% 1.1% 1.0%<br />
14:30 10:30 EIA Oil Inventories<br />
20:00 16:00 Fed’s Fisher Speaks on ‘Learning from Each Other in Crisis Response’ in Dallas<br />
Thu 18/03 08:30 09:30 Sweden Unemployment Rate : Feb 9.4% 9.2% n/a<br />
08:30 09:30 Neths Unemployment Rate : Feb 5.6% 5.8% n/a<br />
08:30 09:30 Consumer Confidence : Mar -13 -14 n/a<br />
09:00 10:00 Eurozone Current Account : Jan EUR1.9bn EUR-8.0bn n/a<br />
10:00 11:00 Foreign Trade Balance (sa) : Jan EUR7.0bn EUR1.0bn EUR6.0bn<br />
ECB Governing Council Meeting (No Rate Announcement)<br />
09:30 09:30 UK PSNCR : Feb GBP-11.8bn GBP-9.0bn n/a<br />
09:30 09:30 PSNB : Feb GBP4.3bn GBP12.0bn n/a<br />
11:00 11:00 CBI Monthly Industrial Trends : Mar<br />
11:30 07:30 US Fed’s Duke Speaks to Bankers in Washington<br />
12:30 08:30 CPI m/m : Feb 0.2% 0.1% 0.1%<br />
12:30 08:30 CPI y/y : Feb 2.6% 2.3% 2.3%<br />
12:30 08:30 Core CPI m/m : Feb -0.1% 0.1% 0.1%<br />
12:30 08:30 Core CPI y/y : Feb 1.6% 1.4% 1.0%<br />
12:30 08:30 Initial Claims 462k 460k n/a<br />
13:00 09:00 Fed’s Hoenig, Lacker, Pianalto Speak to Bankers in Washington<br />
14:00 10:00 Philadelphia Fed Survey : Mar 17.6 19.0 17.0<br />
14:00 10:00 Leading Indicators m/m : Feb 0.3% 0.2% 0.1%<br />
Fri 19/03 07:00 08:00 Germany PPI m/m : Feb 0.8% 0.1% 0.1%<br />
07:00 08:00 PPI y/y : Feb -3.4% -2.8% -2.8%<br />
07:45 08:45 France Wages (Final) q/q : Q4 0.5% 0.2% n/a<br />
08:30 09:30 Sweden PPI m/m : Jan 2.0% -0.3% n/a<br />
08:30 09:30 PPI y/y Jan 0.3% 0.2% n/a<br />
12:30 08:30 Canada CPI m/m : Feb 0.3% 0.2% 0.2%<br />
12:30 08:30 CPI y/y : Feb 1.9% 1.3% 1.3%<br />
12:30 08:30 BoC Core CPI m/m : Feb 0.1% 0.3% 0.3%<br />
12:30 08:30 BoC Core CPI y/y : Feb 2.0% 1.7% n/a<br />
15:50 11:50 US Ex-Fed’s Greenspan Speaks on the Financial Crisis at Brookings Institute, Washington<br />
Release dates and forecasts as at c.o.b. prior to the date of publication: See Daily Economic Spotlight for any revision<br />
Source: <strong>BNP</strong> Paribas<br />
<strong>Market</strong> Economics 12 March 2010<br />
<strong>Market</strong> <strong>Mover</strong><br />
51<br />
www.Global<strong>Market</strong>s.bnpparibas.com
Key Data Preview<br />
Chart 1: US Retail Sales in Gradual Recovery<br />
Source: Reuters EcoWin Pro<br />
% m/m Feb (f) Jan Dec Nov<br />
Retail sales -0.7 0.5 -0.1 2.0<br />
Ex-autos -0.2 0.6 -0.2 2.0<br />
Key Point:<br />
Retail sales are forecast to decline by 0.7% in<br />
February as weather significantly reduced nonessential<br />
sales. Sales ex-vehicles declined by an<br />
estimated 0.2%.<br />
<strong>BNP</strong> Paribas Forecast: Weather Slows Sales<br />
US: Retail Sales (February)<br />
Release Date: Friday 12 March<br />
Retail sales are forecast to decline in February, largely<br />
because adverse winter weather (primarily on the east<br />
coast) caused consumers to stay at home. Total sales are<br />
forecast to fall by 0.7% following the moderate increase of<br />
0.5% in January. Total unit vehicle sales decreased by<br />
4.3% in February, with larger declines experienced by<br />
foreign manufacturers. The 5.8% drop in foreign unit sales<br />
was mainly due to the troubles Toyota was having rather<br />
than adverse winter weather. Excluding automobile sales<br />
from the total produced a small decline of 0.2%. Most of<br />
that loss was probably weather-related as department<br />
stores initially recorded a moderate increase in sales for<br />
the month. However, building material sales, furniture,<br />
sporting goods and electronics suffered as they are nonessential<br />
items that consumers probably did not venture in<br />
the snow to buy. Sales of gasoline also dropped as<br />
gasoline prices fell 1.5% in February. Food prices<br />
continued to rise in February and therefore food purchases<br />
and health care sales offset some of the losses from autos<br />
and gasoline. After excluding gasoline and vehicle sales,<br />
the forecast for the remainder is for a 0.1% decline.<br />
Chart 2: US Present Conditions Compared<br />
Source: Reuters EcoWin Pro<br />
Mar p (f) Feb 2H Feb p Feb Jan<br />
Michigan<br />
Sentiment 74.5 73.5 73.7 73.6 74.4<br />
Key Point:<br />
The University of Michigan Index of Consumer<br />
Confidence should increase slightly in early March,<br />
to 74.5.<br />
<strong>BNP</strong> Paribas Forecast: Increase<br />
US: Michigan Consumer Sentiment (March, Prel)<br />
Release Date: Friday 12 March<br />
The University of Michigan consumer sentiment index<br />
declined to 73.6 in February from 74.4 in January. Despite<br />
the decline, the Michigan survey paints a much more<br />
optimistic picture than the Conference Board index, which<br />
plunged by 10.5 points in February. The Michigan current<br />
conditions index tends to reflect recent changes in the<br />
economy, while the Conference Board’s present situation<br />
index closely tracks the nation’s unemployment rate. Thus,<br />
the Conference Board’s present situation index tends to lag<br />
the University of Michigan current situation indicator. The<br />
Michigan’s current conditions index generally peaks in the<br />
early stages of economic recovery, when growth is high. By<br />
contrast, the Conference Board’s generally peaks in the<br />
late stages of economic expansion, when unemployment is<br />
low and the level of economic activity is high. Strong GDP<br />
growth in Q4 should support consumer optimism. In<br />
addition, stocks have resumed some upward trend lately<br />
and oil prices have stabilised slightly in recent weeks,<br />
implying gasoline costs are likely to decrease in March.<br />
Overall, we expect the University of Michigan index to<br />
improve in early March to 74.5.<br />
<strong>Market</strong> Economics 12 March 2010<br />
<strong>Market</strong> <strong>Mover</strong><br />
52<br />
www.Global<strong>Market</strong>s.bnpparibas.com
Key Data Preview<br />
Chart 3: Canadian Employment<br />
Source: Reuters EcoWin Pro<br />
Feb (f) Jan Dec Nov<br />
Unemployment rate % 8.4 8.3 8.4 8.4<br />
Payroll jobs (k) 10.0 43.0 -28.3 72.2<br />
<strong>BNP</strong> Paribas Forecast: Upward Momentum<br />
Canada: Labour Report (February)<br />
Release Date: Friday 12 March<br />
We expect Canadian employment to have increased by<br />
10k in February. This would follow a strong 43k gain in the<br />
previous month and would leave employment at +19.1k on<br />
a smoother, six-month moving average. In spite of recent<br />
volatility, Canadian employment appears to be rebounding<br />
at a moderate pace. This view is strengthened by a steady<br />
uptrend in the Survey of Employment Payrolls and Hours,<br />
which lags the Labour Force Survey by two months. Job<br />
gains have also become more widespread. In December,<br />
61% of industries surveyed by the SEPH recorded<br />
employment gains, the highest share since October 2007.<br />
While adverse weather conditions point to a moderation in<br />
the pace of job creation in February, we expect labour<br />
market conditions to strengthen further over the spring.<br />
Despite positive employment growth, an expected up-tick<br />
in the participation rate suggests the unemployment rate<br />
will inch up to 8.4% in February from 8.3% previously.<br />
Key Point:<br />
Canadian employment is forecast to increase by 10k<br />
in February after surging in January.<br />
Chart 4: US Industrial Production<br />
Source: Reuters EcoWin Pro<br />
Feb (f) Jan Dec Nov<br />
Ind. Prod. (% m/m) 0.0 0.9 0.7 0.6<br />
Cap. Util (%) 72.6 72.6 71.9 71.3<br />
<strong>BNP</strong> Paribas Forecast: A Winter Pause<br />
US: Industrial Production (February)<br />
Release Date: Monday 15 March<br />
We look for a flat reading on industrial production in<br />
February after a 0.9% surge in January. Our forecast would<br />
imply capacity utilisation holding steady at 72.6%. Winter<br />
storms disrupted manufacturing activity, as reflected in the<br />
0.9% decline in manufacturing hours worked and the<br />
decline in the ISM production index to 58.4 from 66.2. Data<br />
on motor vehicle production suggest this sector should<br />
weigh on overall activity although we look for a broadbased<br />
interruption after a string of stronger readings.<br />
Meanwhile, the decline in many manufacturing industries<br />
should be offset by an increase in electricity generation on<br />
continued cold temperatures. Given that we are still in the<br />
midst of the upswing of the inventory cycle and global trade<br />
activity is ramping up, the weather disruption in February<br />
should lead to a bounce back in March. We will therefore<br />
not draw too much signal from the February interruption.<br />
Key Point:<br />
We expect a flat reading in February reflecting an<br />
interruption owing to winter storms.<br />
<strong>Market</strong> Economics 12 March 2010<br />
<strong>Market</strong> <strong>Mover</strong><br />
53<br />
www.Global<strong>Market</strong>s.bnpparibas.com
Key Data Preview<br />
Chart 5: Eurozone Core HICP (% y/y)<br />
Source: Reuters EcoWin Pro<br />
Feb (f) Jan Dec Nov<br />
Headline m/m 0.3 -0.8 0.3 0.1<br />
Headline y/y 0.9 1.0 0.9 0.5<br />
Core m/m 0.4 -1.5 0.5 -0.1<br />
Core y/y 0.8 0.9 1.1 1.0<br />
Ex-tobacco 108.08 107.75 108.61 108.28<br />
Key Point:<br />
Headline inflation should tick lower over the month,<br />
with core slipping further to 0.8%.<br />
<strong>BNP</strong> Paribas Forecast: All-Time Low for Core<br />
Eurozone: HICP (February)<br />
Release Date: Tuesday 16 March<br />
With the bulk of the commodity price base effects past,<br />
headline’s ascent in 2010 is proving a slower affair than we<br />
saw in the second half of 2009. After a 0.1pp increase in<br />
January, we expect headline inflation to tick back down to<br />
0.9% in February. A modest decline in energy and further<br />
drop in core inflation should dominate a second<br />
consecutive monthly increase in food inflation.<br />
Energy inflation should have fallen thanks to a falling back<br />
in oil prices from their January USD 80/bbl high. Food<br />
inflation is likely to have risen further, meanwhile, on a<br />
combination of base effects and stronger fresh food prices<br />
linked to the cold weather at the start of the year.<br />
The most important development will be an additional fall in<br />
core inflation over the month. In January, core inflation fell<br />
to 0.9%, matching the record low recorded in 2000. Deep<br />
January discounting in countries such as Germany was an<br />
important factor, but the decline has now broadened across<br />
components. As a result, while we may see a February<br />
rebound in categories that experienced deep discounting in<br />
January, we expect core inflation to fall further over the<br />
month as other components continue down – dynamics we<br />
have already seen in Germany’s preliminary release. We<br />
are forecasting a 0.8% y/y a new record low.<br />
100<br />
75<br />
50<br />
25<br />
0<br />
-25<br />
-50<br />
-75<br />
Mean<br />
Chart 6: German ZEW Indices<br />
ZEW Expectations<br />
Mean<br />
ZEW Current Conditions<br />
-100<br />
91 93 94 95 96 97 98 99 00 01 02 03 04 05 06 07 08 09<br />
Source: Reuters EcoWin Pro<br />
Mar(f) Feb Jan Dec<br />
Expectations 43.0 45.1 47.2 50.4<br />
Current Conditions -52.0 -54.8 -56.6 -60.6<br />
Average -4.5 -4.9 -4.7 -5.1<br />
Key Point:<br />
Expectations have topped out but the current<br />
conditions index has scope to rise further.<br />
<strong>BNP</strong> Paribas Forecast: Mixed Picture<br />
Germany: ZEW Survey (March)<br />
Release Date: Tuesday 16 March<br />
The ZEW survey data reflect the opinions of approximately<br />
300 analysts and fund managers. The expectations index<br />
dropped in each of the five months to February, declining<br />
by around twelve percentage points relative to its peak but<br />
remaining above its long-run average (see chart).<br />
The factors cited for the declines include uncertainty over<br />
the performance of the labour market, developments in the<br />
public finances and the strong exchange rate. Opinion on<br />
the export sector was positive in the prior survey in contrast<br />
to pessimism over the consumer and retail sectors.<br />
Experience of past cycles suggests that, when the index of<br />
expectations turns downwards or upwards, it tends to head<br />
in the same direction for some time. We therefore expect to<br />
see a further deterioration in March’s survey.<br />
The index that measures the assessment of the current<br />
economic situation in Germany typically lags the evolution<br />
of the expectations index. The current assessment rose in<br />
each of the nine months to February and, as it is still a long<br />
way below its historic average (again, see the chart), there<br />
is scope for further improvement in coming months.<br />
Our preferred measure is the average of the two main ZEW<br />
indices; this tracks growth in Germany relatively well. On<br />
the basis of the recent data and our forecast for March, a<br />
moderate improvement in GDP growth is likely.<br />
<strong>Market</strong> Economics 12 March 2010<br />
<strong>Market</strong> <strong>Mover</strong><br />
54<br />
www.Global<strong>Market</strong>s.bnpparibas.com
Key Data Preview<br />
Chart 7: French Headline and Core CPI (% y/y)<br />
4.0<br />
3.5<br />
3.0<br />
2.5<br />
2.0<br />
1.5<br />
1.0<br />
0.5<br />
0.0<br />
-0.5<br />
-1.0<br />
Manufactured goods<br />
Headline inflation<br />
<strong>Services</strong><br />
03 04 05 06 07 08 09<br />
Source: Reuters EcoWin Pro<br />
% Feb (f) Jan Dec Feb 09<br />
Total (nsa) m/m 0.42 -0.23 0.27 0.38<br />
Total (nsa) y/y 1.14 1.10 0.91 0.87<br />
Core (sa) m/m 0.29 -0.03 0.17 0.21<br />
Core (sa) y/y 1.65 1.56 1.76 1.92<br />
Ex-Tob. index 118.83 118.32 118.60 117.59<br />
Key Point:<br />
Although energy inflation should ease marginally in<br />
February, early ending of seasonal sales may push<br />
inflation slightly higher.<br />
<strong>BNP</strong> Paribas Forecast: Marginally Higher<br />
France: Consumer Price Index (February)<br />
Release Date: Tuesday 15 March<br />
Over the last six months, the headline inflation rate has<br />
jumped from -0.7% to +1.1%, entirely due to energy prices.<br />
The decline in core inflation has compensated rising<br />
inflation for food.<br />
We expect energy prices to have increased marginally in<br />
February and, as prices rose a little during the same month<br />
last year, this should allow the contribution of energy to<br />
inflation to ease slightly. Food price inflation should<br />
accelerate further, but the bulk of the adverse weather was<br />
probably captured in the January data.<br />
Manufactured goods prices will jump and, as the seasonal<br />
sales season ended earlier this year than in 2009, this<br />
should temporarily boost headline inflation. The<br />
contribution of services has been declining over the past<br />
few months and this trend should persist in February.<br />
Consequently, core inflation may rise but this should be<br />
transitory; the declining trend should prevail again from<br />
March.<br />
The inflation spread with the eurozone reversed in<br />
December and widened in January. We expect this trend to<br />
continue in February, with a possible temporary correction<br />
in March.<br />
Chart 8: US Housing Starts & Building Permits<br />
Source: Reuters EcoWin Pro<br />
Feb (f) Jan Dec Nov<br />
Housing Starts<br />
(000s, saar) 555 591 575 579<br />
Key Point:<br />
Housing starts are forecast to drop 6.1% to 555k in<br />
February due to weather-related disruptions.<br />
<strong>BNP</strong> Paribas Forecast: Small Decline<br />
US: Housing Starts (February)<br />
Release Date: Tuesday 16 March<br />
Housing starts are expected to decline to 555k in February<br />
after increasing modestly to 591k the previous month.<br />
Severe weather conditions likely disrupted new<br />
construction activity in February, suggesting builders broke<br />
ground on fewer houses. Indeed, aggregate hours worked<br />
in the construction industry plunged by 4% in February, the<br />
second-largest monthly decline since 1995. In addition,<br />
building permits declined by 4.9% m/m, but this followed a<br />
cumulative 17.8% increase over the previous two months.<br />
Anecdotal evidence suggests builders rushed to take out<br />
permits at the end of 2009 as permit costs are expected to<br />
increase this year. Therefore, the decline in permits<br />
recorded in January does not point to a decline in future<br />
building activity but rather reflects a temporary downward<br />
correction. As such, the ramp-up in permits observed at the<br />
end of last year is likely to translate into a strong increase<br />
in March and a modest upward trend over a number of<br />
months after weather-related effects taper off.<br />
Nevertheless, record foreclosures and unemployment near<br />
a 26-year high represent hurdles that may prevent the<br />
industry from strengthening much further.<br />
<strong>Market</strong> Economics 12 March 2010<br />
<strong>Market</strong> <strong>Mover</strong><br />
55<br />
www.Global<strong>Market</strong>s.bnpparibas.com
Key Data Preview<br />
Chart 1: UK Employment vs GDP<br />
Source: Reuters EcoWin Pro<br />
Feb (f) Jan Dec Nov<br />
Claimant Count (k) -10.0 23.5 -9.6 -10.8<br />
ILO Emp 3m/yr (k) 0 -12 -16<br />
ILO Unemp 3m/yr (k) -30 -4 -7<br />
Ave Earns % 3m/yr 2.5 0.8 0.8<br />
Ex Bonus % 3m/yr 1.5 1.2 1.2<br />
Key Point:<br />
We expect better news on unemployment and a<br />
sharp increase in wage inflation due to base effects.<br />
<strong>BNP</strong> Paribas Forecast: Improving<br />
UK : Labour Report (February)<br />
Release Date: Wednesday 17 March<br />
We expect claimant count unemployment to post a<br />
moderate 10k decline in February, following the much<br />
weaker than expected January outcome. We suspect that<br />
the latter was partly related to poor weather, as snow could<br />
have delayed the hiring process. In particular, the<br />
breakdown showed that, although there was a steady<br />
stream of people becoming unemployed, there was a sharp<br />
drop in the number of people leaving the jobless pool. A<br />
firming in the claimant count as well as improvement in the<br />
ILO measures of unemployment and employment are<br />
consistent with the strengthening in activity surveys and<br />
GDP growth.<br />
Perhaps the biggest news in this release will be the<br />
average earnings data. In January-February 2009, there<br />
was a significant drop in wages (around 7 percentage<br />
points over the two months combined). This reflected<br />
sharply lower bonus payments. Our assumption is that<br />
bonus payments were at least stable in early 2010 and<br />
more likely somewhat higher. Hence significant base<br />
effects are likely to propel headline wage inflation sharply<br />
higher. We also expect ex-bonus wage inflation to<br />
accelerate, albeit to a lesser extent. We expect this on the<br />
basis of some financial sector firms shifting emphasis away<br />
from bonus payments into basic pay.<br />
Chart 10: US Pressures on Core PPI Ease<br />
Source: Reuters EcoWin Pro<br />
% m/m Feb (f) Jan Dec Nov<br />
Headline 0.0 1.4 0.4 1.5<br />
Ex-food & energy 0.2 0.3 0.0 0.5<br />
Key Point:<br />
Headline PPI should remain flat as PPI Energy likely<br />
declined and PPI Food continued to increase in<br />
February. Core PPI is expected to increase by 0.2%.<br />
<strong>BNP</strong> Paribas Forecast: Increase<br />
US: PPI (February)<br />
Release Date: Wednesday 17 March<br />
We expect PPI to be unchanged in February. Energy<br />
prices are forecast to drop by 0.5% m/m, as gasoline prices<br />
declined by 2.6% m/m in February. Food prices are<br />
forecast to increase by 0.4% m/m, reflecting mounting<br />
pressures in commodity food costs. Indeed, while sluggish<br />
demand in 2009 likely delayed the pass-through to final<br />
prices last year, higher food prices have now trickled<br />
through the food production pipeline and are expected to<br />
support headline inflation over the next few months. Core<br />
PPI is forecast to increase by 0.2% m/m after rising by<br />
0.3% in the previous month. Ongoing strength in metal<br />
prices points to upside risks in auto prices.<br />
In addition, while tight credit conditions and subdued final<br />
demand have so far constrained investment spending,<br />
recent durable goods orders data suggest firms have<br />
increased spending on equipment and software. Against<br />
this background of firmer industrial demand, higher<br />
commodity prices risk being passed on to final goods<br />
prices, pointing to upside risks for producer prices.<br />
<strong>Market</strong> Economics 12 March 2010<br />
<strong>Market</strong> <strong>Mover</strong><br />
56<br />
www.Global<strong>Market</strong>s.bnpparibas.com
Key Data Preview<br />
Chart 11: US Total vs. Core CPI Inflation<br />
Source: Reuters EcoWin Pro<br />
% m/m Feb (f) Jan Dec Nov<br />
CPI 0.1 0.2 0.2 0.2<br />
Core 0.1 -0.1 0.1 0.0<br />
NSA (index) 217.06 216.69 215.95 216.33<br />
Key Point:<br />
US CPI is expected to increase by 0.1% m/m in<br />
February, reflecting a similar gain in core prices.<br />
Weak energy costs should largely offset an up-tick in<br />
food.<br />
<strong>BNP</strong> Paribas Forecast: Moderate Increase<br />
US: Consumer Price Index (February)<br />
Release Date: Thursday 18 March<br />
Headline CPI is expected to increase 0.1% m/m in<br />
February. Base effects suggest that inflation will ease to<br />
2.3% on a y/y basis from 2.7% in January. Weekly EIA<br />
data indicate that pump prices declined 2.6% m/m in<br />
February. However, an increase in the seasonal<br />
adjustment factor between January and February suggests<br />
seasonally adjusted CPI gasoline prices should ease by a<br />
more moderate 1.2% on the month. Weakness in gasoline<br />
should be partially offset by a gain in natural gas prices,<br />
which are forecast to increase by around 5% m/m. Food<br />
prices are forecast to increase 0.2% m/m in February. The<br />
gain should be driven by food-at-home prices, as pipeline<br />
pressures point to higher prices on supermarket shelves. In<br />
contrast, restaurant prices should remain contained,<br />
reflecting sluggish discretionary spending. Excluding food<br />
and energy, core CPI is expected to increase 0.1% m/m.<br />
Strength should be concentrated in core service prices<br />
excluding shelter which should see a small rebound after<br />
substantial weakness in January. In contrast, shelter prices<br />
should remain depressed, reflecting disappointing<br />
developments in the housing market and still-high vacancy<br />
rates. Going forward, plummeting unit labour costs suggest<br />
underlying price pressures remain contained. In nonseasonally<br />
adjusted terms, total CPI is expected to<br />
increase to 217.06 in February from 216.69 previously.<br />
Chart 12: US Leading Indicators Suggest Growth<br />
Source: Reuters EcoWin Pro<br />
Feb (f) Jan Dec Nov<br />
Lead Index (% m/m) 0.2 0.3 1.2 1.1<br />
6-mo. ann. chg. (%) 9.0 9.8 11.8 10.6<br />
<strong>BNP</strong> Paribas Forecast: A Modest Gain<br />
US: Leading Indicators (February)<br />
Release Date: Thursday 18 March<br />
The index of leading indicators is expected to rise just 0.2%<br />
in February after a 0.3% gain in January. Gains in the<br />
index have slowed in recent months and our forecast would<br />
suggest a further cooling in the 6-month annualised rate to<br />
9.0%, down from 9.8% a month prior. The index will be<br />
influenced by disruptive winter weather that contributed to<br />
a decline in manufacturing hours worked, a dip in the<br />
supplier delivery index, and a rise in jobless claims.<br />
In addition, consumer expectations became more<br />
pessimistic in February. Meanwhile, financial conditions<br />
continued to be favourable with a still-steep yield curve and<br />
a rise in the stock market set to continue to boost the<br />
index. The cooling in the index is in line with the slowing we<br />
anticipate in GDP growth to 2.4% q/q saar in Q1 from 5.9%<br />
in Q4.<br />
Key Point:<br />
We look for a subdued 0.2% gain in February, in part<br />
owing to disruptive winter weather.<br />
<strong>Market</strong> Economics 12 March 2010<br />
<strong>Market</strong> <strong>Mover</strong><br />
57<br />
www.Global<strong>Market</strong>s.bnpparibas.com
Key Data Preview<br />
Source: Reuters EcoWin Pro<br />
Chart 13: Canadian Inflation<br />
m/m % Feb (f) Jan Dec Nov<br />
CPI 0.2 0.3 -0.3 0.5<br />
Bank of Canada Core 0.3 0.1 -0.3 0.4<br />
Key Point:<br />
Weak gasoline prices should restrain headline CPI<br />
developments. However, core CPI should increase by<br />
0.3% m/m, reflecting higher clothing and shelter<br />
costs.<br />
<strong>BNP</strong> Paribas Forecast: Increase<br />
Canada: CPI (February)<br />
Release Date: Friday 19 March<br />
Canadian CPI inflation is forecast to increase by 0.2% m/m<br />
in February following a 0.3% rise in January. However,<br />
because of large base effects, yearly inflation is expected<br />
to drop to 1.3% y/y in February from 1.9% previously.<br />
Weekly gasoline pump prices declined 1.6% m/m in<br />
February after increasing by 5.0% the previous month. In<br />
addition, natural gas prices are expected to moderate after<br />
surging in January, restraining headline developments.<br />
Upward pressures should come from clothing prices. In<br />
December, clothing prices plunged by 4.7% m/m, the<br />
largest monthly decline for this month in the series’ 60-year<br />
history. Prices eased by an additional 0.6% m/m in<br />
January. Such large discounts around the turn of the year<br />
are usually followed by price increases in February and<br />
March, as the new spring collection reaches stores. In<br />
February, we forecast that apparel prices will increase<br />
2.0% m/m. Shelter prices are expected to increase by<br />
0.2%, reflecting recent rises in house prices (which feed<br />
into the CPI index directly through their effect on the CPI<br />
replacement component). Excluding the eight most volatile<br />
components and the effect of indirect taxes, the Bank of<br />
Canada core CPI is expected to increase 0.3% m/m in<br />
February.<br />
<strong>Market</strong> Economics 12 March 2010<br />
<strong>Market</strong> <strong>Mover</strong><br />
58<br />
www.Global<strong>Market</strong>s.bnpparibas.com
Economic Calendar: 22 March – 16 April<br />
22 March 23 March 24 March 25 March 26 March<br />
Italy: Non-EU Trade<br />
Balance Feb<br />
<strong>Market</strong> Economics 12 March 2010<br />
<strong>Market</strong> <strong>Mover</strong><br />
Japan: BoJ Monetary<br />
Policy Meeting Minutes<br />
UK: CPI Feb<br />
France: Industry Survey<br />
Mar<br />
Belgium: Business<br />
Confidence Mar<br />
US: Existing Home Sales<br />
Feb, FHFA House Price<br />
Index Jan<br />
Japan: Trade Balance Feb<br />
Eurozone: Industrial<br />
Orders Jan, PMIs (Flash)<br />
Mar<br />
UK: Budget, CBI Dist<br />
Trades Mar<br />
Germany: Ifo Mar<br />
France: Job Seekers Feb<br />
Italy: ISAE Consumer<br />
Conf Mar, Labour Q4<br />
Sweden: Consumer<br />
Confidence Mar<br />
Norway: Norges Bank Rate<br />
Ann & Monetary Policy<br />
Report, Labour (sa) Jan<br />
US: Durable Goods<br />
Orders Feb, New Home<br />
Sales Feb<br />
Eurozone: Monetary<br />
Developments Feb<br />
UK: Retail Sales Feb<br />
Germany: GkF<br />
Consumer Confidence<br />
Apr<br />
France: Retail Sales Feb<br />
Italy: Retail Sales Jan,<br />
ISAE Business<br />
Confidence Mar<br />
Spain: PPI Feb<br />
Sweden: PPI Feb<br />
Norway: Labour (nsa)<br />
Mar<br />
Neths: GDP Q4 (Final),<br />
Producer Confidence<br />
Mar<br />
Japan: CPI Tokyo Mar,<br />
CPI National Feb<br />
Eurozone: Eurocoin Mar<br />
France: Consumer<br />
Confidence Mar<br />
Sweden: PPI Feb<br />
US: GDP (Final) Q4,<br />
Corporate Profits Q4, UoM<br />
Sentiment (Final) Mar<br />
During Week: Germany Import Prices Feb<br />
Europe – Clocks go forward 1 hour<br />
29 March 30 March 31 March 1 April 2 April<br />
Japan: Retail Sales Feb<br />
Eurozone: Business &<br />
Consumer Survey Mar<br />
UK: Net Consumer Credit<br />
Feb, Mortgage Approvals<br />
Feb<br />
Germany: States’ Cost of<br />
Living Mar, HICP (Flash)<br />
Mar<br />
Sweden: Retail Sales Feb<br />
US: Personal Income &<br />
Spending Feb<br />
Japan: Labour Feb,<br />
Household Consumption<br />
Feb, IP Feb<br />
Eurozone: Retail PMI Mar<br />
UK: GDP (Final) Q4<br />
France: Housing Starts<br />
Feb, GDP (Final) Q4,<br />
Housing Starts Feb<br />
Spain: HICP (Flash) Feb,<br />
Retail Sales Feb<br />
Belgium: CPI Mar<br />
Norway: Retail Sales Feb<br />
US: S&P/CS HPI Jan,<br />
Consumer Confidence Mar<br />
Australia: Retail Sales Feb<br />
Japan: Housing Starts Feb<br />
Eurozone: HICP (Flash)<br />
Mar, Labour Feb<br />
UK: GfK Consumer<br />
Confidence Mar<br />
Germany: Labour Feb<br />
France: PPI Feb<br />
Italy: PPI Feb, CPI<br />
(Flash) Mar<br />
Switz: KOF Leading<br />
Indicator Mar<br />
US: Factory Orders Feb,<br />
Chicago PMI Mar, Help<br />
Wanted Mar, ADP Labour<br />
Mar<br />
Canada: GDP Jan<br />
Australia: Trade Balance<br />
Feb<br />
Japan: Tankan Mar<br />
Eurozone: Manufacturing<br />
PMI Mar<br />
UK: CIPS Manufacturing<br />
Mar<br />
Italy: Wages Jan-Feb<br />
Switz: PMI Mar<br />
US: Challenger Layoffs<br />
Mar, Construction Feb,<br />
ISM Manufacturing Mar,<br />
Vehicle Sales Mar<br />
Public Holiday: UK,<br />
Germany, Spain, Sweden,<br />
Norway, Neths, Denmark<br />
US: Labour Mar<br />
During Week: UK Nationwide House Prices Mar, Halifax House Prices Mar, Germany Retail Sales Feb Australia - Clocks go back 1 hour<br />
5 April 6 April 7 April 8 April 9 April<br />
Public Holiday: UK,<br />
Germany, France, Italy,<br />
Spain, Sweden, Norway,<br />
Neths, Denmark<br />
US: Non-Manufacturing<br />
ISM Mar, Pending Home<br />
Sales Feb<br />
Australia: RBA Rate<br />
Announcement<br />
Japan: Leading Indicator<br />
Feb<br />
Switz: CPI Mar<br />
US: FOMC Minutes<br />
Japan: BoJ Rate<br />
Announcement<br />
Eurozone: PPI Feb, GDP<br />
(Final) Q4, <strong>Services</strong> PMI<br />
(Final) Mar<br />
UK: PMI <strong>Services</strong> Mar<br />
Germany: Factory Orders<br />
Feb<br />
US: Consumer Credit Feb<br />
Australia: Labour Mar<br />
Japan: C/A Feb,<br />
Machinery Orders Feb<br />
Eurozone: ECB Rate<br />
Ann & Press Conference,<br />
Retail Sales Feb<br />
UK: BoE Rate Ann, BoE<br />
Asset Purchase Target<br />
Apr, IP Feb<br />
Germany: IP Feb<br />
France: Trade Balance<br />
Feb, Budget Balance Feb<br />
Spain: IP Feb<br />
Neths: CPI Mar<br />
During Week: Germany WPI Mar<br />
12 April 13 April 14 April 15 April 16 April<br />
Japan: BoJ Monetary<br />
Policy Meeting Minutes,<br />
M2 Mar<br />
Italy: Industrial Production<br />
Feb<br />
US: Treasury Statement<br />
Source: <strong>BNP</strong> Paribas<br />
Australia: NAB Business<br />
Survey Mar<br />
Japan: CGPI Mar<br />
UK: BRC Retail Sales<br />
Monitor Mar, RICS House<br />
Price Balance Mar, Trade<br />
Balance Feb, DCLG<br />
House Prices Feb<br />
Germany: CPI Mar<br />
France: CPI Mar, BoP Feb<br />
Sweden: CPI Mar<br />
Neths: IP Feb<br />
US: Trade Balance Feb,<br />
Import Prices Mar<br />
Australia: Westpac<br />
Consumer Confidence<br />
Eurozone: Industrial<br />
Production Feb<br />
Sweden: AMV<br />
Unemployment Mar<br />
US: CPI Mar, Retail<br />
Sales, Mar, Business<br />
Inventories Feb, Beige<br />
Book<br />
Eurozone: Trade<br />
Balance Feb, ECB<br />
Monthly Bulletin<br />
Italy: Foreign Trade<br />
Balance Feb<br />
Spain: CPI Mar<br />
Neths: Retail Sales Feb<br />
US: Empire State Survey<br />
Apr, TICS Data Feb,<br />
Industrial Production Mar,<br />
Philly Fed Apr, NAHB Apr<br />
Release dates as at c.o.b. prior to the date of this publication. See our Daily Spotlight for any revisions<br />
59<br />
UK: PPI Mar<br />
Germany: Trade Balance<br />
Feb<br />
France: Industrial<br />
Production Feb, BoF<br />
Survey Mar<br />
Sweden: Industrial<br />
Production Feb<br />
Norway: CPI Mar, PPI Mar<br />
Neths: IP Feb<br />
US: Wholesale Inventories<br />
Feb<br />
Canada: Labour Mar<br />
Eurozone: HICP Mar,<br />
EU25 New Car<br />
Registrations<br />
Italy: CPI Mar<br />
US: Housing Starts Mar,<br />
UoM Sentiment (Prel) Apr<br />
www.Global<strong>Market</strong>s.bnpparibas.com
Treasury and SAS Issuance Calendar<br />
Daily update onto https://globalmarkets.bnpparibas.com, Tools & Apps, Analytical Tools, <strong>Market</strong> Calendar, Government Flows<br />
In the pipeline - Treasuries:<br />
Ireland: Considering the possibility of a syndicated 30y bond<br />
France: To consider dollar-denominated bond issue in 2010<br />
Germany: Reserves the right to issue foreign currency bonds, as market conditions allow<br />
Greece: May proceed with one or two more syndicated issues before resorting to regular re-openings of benchmark bonds<br />
Poland: Plans to issue an up to USD 1.5bn bond probably in Q2 and possibly as early as April. Most likely a 5y but a 10y paper not excluded<br />
Belgium: OLO auction scheduled for 29 March is cancelled<br />
Finland: To hold a second syndicated auction (5y), most likely in H2; possibly to issue a 5y USD bond in '10<br />
Neths: To issue a new 30y DSL (DDA, before the Summer) - No plans for Inflation-linked bonds - May issue a dollar-denominated bond (in '10)<br />
Denmark: To issue a EUR 5y loan (EUR 1-2bn) in H1 '10 - To open new 5y & 10y DGBs H2 '10<br />
Slovak Rep.: Bond 10-year (new, syndicated, EUR) to be issued in the coming weeks<br />
During the week:<br />
UK: Gilt 6% Dec 2028 (mini tender)<br />
US: Announcement of 2y,5y & 7y Notes (new) details on Thu 18 Mar<br />
FHLB: March Global Notes auction details to be announced on Wed 17 Mar<br />
Date Day Closing Country Issues Details <strong>BNP</strong>P forecasts<br />
Local GMT<br />
12/03 Fri 10:55 09:55 Italy BTP 3% Apr 2015 EUR 2.5-3.5bn<br />
BTP 5% Sep 2040<br />
EUR 1-1.5bn<br />
16/03 Tue 12:00 03:00 Japan JGB Mar 2030 JPY 1.1tn<br />
10:00 10:00 Ireland Gilt 4.6% Apr 2016<br />
Gilt 4.5% Apr 2020<br />
12 Mar EUR 1-1.5bn<br />
12:00 16:00 Canada Repurchase of 8 Cash Mgt Bonds (Jun-10 - Jun-11) CAD 1bn<br />
17/03 Wed 11:00 10:00 Germany Bund 3.25% Jan 2020 EUR 5bn<br />
10:30 10:30 Portugal OT 5.15% Jun 2011 (Reverse auction) EUR 0.3bn<br />
12:00 16:00 Canada CAN 30-year (Repurchase/Switch) 11 Mar<br />
18/03 Thu 12:00 03:00 Japan JGBs 10y Auction for Enhanced-liquidity issue 270-302<br />
JGBs 20y Auction for Enhanced-liquidity issue 54-80<br />
JPY 0.3tn<br />
10:30 09:30 Spain Obligacion 4% Apr 2020<br />
Obligacion 4.7% Jul 2041<br />
15 Mar EUR 4-6bn<br />
10:50 09:50 France BTANs 2- &/or 5-year 12 Mar EUR 6-8bn<br />
11:50 10:50 France OATis , OATeis, BTANeis 12 Mar EUR 1-2bn<br />
Sweden Exchange Offer ILBs 4% Dec-20 vs. 3.5% Dec-15 SEK 2.5bn<br />
Exchange Offer ILBs 3.5% Dec-28 vs. 3.5% Dec-15<br />
SEK 1.6bn<br />
10:30 10:30 UK Gilt 4.75% Mar 2020 GBP 3.25bn<br />
22/03 Mon 11:00 10:00 Sweden T-bonds (Buyback) 15 Mar<br />
Denmark DGB 17 Mar<br />
Slovak Rep. SLOVGB Jan 2012 (#212)<br />
23/03 Tue 11:00 10:00 Sweden T-bonds (Buyback) 16 Mar<br />
Neths DSLs (Off-the-run facility) 17 Mar<br />
13:00 17:00 US Notes 2-year (new) 18 Mar USD 44bn<br />
24/03 Wed 11:00 10:00 Sweden T-bonds 17 Mar<br />
10:30 10:30 Portugal OTs (To be confirmed) 18 Mar<br />
12:00 16:00 Canada CAN 3-year 18 Mar<br />
13:00 17:00 US Notes 5-year (new) 18 Mar USD 42bn<br />
25/03 Thu 12:00 03:00 Japan JGB 2-year 18 Mar JPY 2.6tn<br />
13:00 17:00 US Notes 7-year (new) 18 Mar USD 32bn<br />
26/03 Fri 10:55 09:55 Italy CTZ 23 Mar<br />
29/03 Mon 10:55 08:55 Italy BTPeis 23 Mar<br />
Denmark DGB 4% Nov 2010 (buy back)<br />
30/03 Tue 10:55 08:55 Italy 3 & 10y BTPs and CCT 23 Mar<br />
01/04 Thu 10:50 08:50 France OAT 26 Mar<br />
Slovak Rep. SLOVGB (#214) (new)<br />
05/04 Mon 13:00 17:00 US TIPS 10-year 1 Apr<br />
06/04 Tue 12:00 03:00 Japan JGB 10-year 30 Mar JPY 2.2tn<br />
11:00 09:00 Austria RAGBs 30 Mar<br />
13:00 17:00 US Notes 3-year (new) 1 Apr USD 40bn<br />
07/04 Wed 11:00 09:00 Germany Schatz 1% Mar 2012 (date to be confirmed) EUR 6bn<br />
11:00 09:00 Sweden T-bonds 31 Mar<br />
13:00 17:00 US Notes 10-year 1 Apr USD 21bn<br />
08/04 Thu 12:00 03:00 Japan Auction for Enhanced-liquidity 1 Apr JPY 0.3tn<br />
10:30 08:30 Spain Bonos 18 Mar<br />
13:00 17:00 US Bond 30-year 1 Apr USD 13bn<br />
Sources: Treasuries, <strong>BNP</strong> Paribas<br />
Interest Rate Strategy 12 March 2010<br />
<strong>Market</strong> <strong>Mover</strong>, Non-Objective Research Section<br />
60<br />
www.Global<strong>Market</strong>s.bnpparibas.com
Next week's T-Bills Supply<br />
Date Country Issues Details<br />
12/03 UK T-Bills Apr 2010 GBP 1.5bn<br />
T-Bills Jun 2010<br />
GBP 2bn<br />
T-Bills Sep 2010<br />
GBP 1.5bn<br />
15/03 Japan T-Bills Mar 2011 JPY 2.5tn<br />
France BTF Jun 2010 EUR 4bn<br />
BTF Sep 2010<br />
EUR 2bn<br />
BTF Mar 2011<br />
EUR 2bn<br />
Germany Bubills Sep 2010 (new) EUR 5bn<br />
Norway T-Bills Mar 2011 (new) NOK 6bn<br />
Neths DTC May 2010 EUR 0.5-1.5bn<br />
DTC Jun 2010<br />
EUR 1-2.5bn<br />
DTC Aug 2010<br />
EUR 1-2.5bn<br />
DTC Sep 2010<br />
EUR 1-2.5bn<br />
Slovak Rep. T-Bills Jul 2010 (#03)<br />
US T-Bills Jun 2010 USD 27bn<br />
T-Bills Sep 2010 (new) USD 29bn<br />
FHLMC Bills 3-month & 6-month 12 Mar<br />
16/03 Japan T-Bills Jun 2010 JPY 5.7tn<br />
Spain Letras Mar 2010 15 Mar<br />
Letras Aug 2011<br />
15 Mar<br />
Belgium TC Jun 2010 12 Mar<br />
TC Mar 2011<br />
12 Mar<br />
US T-Bills 4-week 15 Mar<br />
FHLB Discount Notes<br />
17/03 Sweden T-Bills Jun 2010 SEK 10bn<br />
T-Bills Sep 2010<br />
SEK 10bn<br />
Portugal BT Mar 2011 (new) EUR 1.25bn<br />
FNMA Bills 3-month & 6-month 15 Mar<br />
18/03 FHLB Discount Notes<br />
19/03 Japan T-Bills 2-month 12 Mar<br />
UK T-Bills 12 Mar<br />
Sources: Treasuries, <strong>BNP</strong> Paribas<br />
Comments and charts<br />
• EGB gross supply falls to around EUR 20bn in the<br />
week ahead from EUR 32bn in the past week. In 10y<br />
duration-adjusted terms, it falls to EUR 17bn from EUR<br />
25.7bn.<br />
• Ireland will kick off next week’s issuance on<br />
Tuesday with the reopening of Gilts Apr-16 & Apr-20 for<br />
EUR 1-1.5bn. Germany follows on Wednesday with a<br />
EUR 5bn tap of 10y Bund Jan-20. On Thursday, we will<br />
see Spain reopening SPGBs Apr-20 & Jul-41 for an<br />
expected amount of EUR 4-6bn. France will also issue<br />
2y- &/or 5y BTANs and OATeis/BTANeis. Expect a total<br />
size of around EUR 7-10bn.<br />
• Outside EMU, UK will issue GBP 3.25bn of Gilt<br />
Mar-20. There will also be auctions in Japan, Canada<br />
and Sweden.<br />
Next week's Eurozone Redemptions<br />
Date Country Details Amount<br />
15/03 Italy BOT 12mth EUR 8.2bn<br />
15/03 Neths DTC EUR 6.1bn<br />
15/03 Ireland T-Bills EUR 1.5bn<br />
16/03 Austria ATB EUR 0.1bn<br />
17/03 Germany Bubills EUR 7.0bn<br />
17/03 Austria ATB EUR 0.1bn<br />
18/03 France BTF EUR 7.5bn<br />
18/03 Belgium TC EUR 5.3bn<br />
19/03 Spain Letras EUR 9.3bn<br />
19/03 Portugal BT EUR 3.9bn<br />
Total Eurozone Short-term Redemption<br />
EUR 49bn<br />
Next week's Eurozone Coupons<br />
Country<br />
Amount<br />
Italy<br />
EUR 1.6bn<br />
Ireland<br />
EUR 0.4bn<br />
Austria<br />
EUR 1.0bn<br />
Total Long-term Coupon Payments<br />
EUR 3bn<br />
Chart 1: Investors’ Net Cash Flows<br />
(EUR bn, 10y equivalent)<br />
20<br />
15<br />
10<br />
5<br />
0<br />
-5<br />
-10<br />
-15<br />
-20<br />
-25<br />
-30<br />
25<br />
20<br />
15<br />
10<br />
5<br />
0<br />
Net Investors' Cash Flows<br />
(EUR bn , 10y equivalent)<br />
Week of Mar 15th Week of Mar 22nd Week of Mar 29th Week of Apr 5th<br />
Chart 2: EGB Gross Supply Breakdown by<br />
Country (EUR bn, 10y equivalent)<br />
Germany Italy Portugal Belgium<br />
France Spain Netherlands Austria<br />
Finland Greece Ireland<br />
Week of Mar 15th Week of Mar 22nd Week of Mar 29th Week of Apr 5th<br />
Chart 3: EGB Gross Supply Breakdown by<br />
Maturity (EUR bn, 10y equivalent)<br />
25<br />
20<br />
2-3-YR 5-7-YR 10-YR >10-YR<br />
EGBs Gross Supply (EUR bn, 10y equivalent)<br />
15<br />
10<br />
5<br />
0<br />
Week of Mar 15th Week of Mar 22nd Week of Mar 29th Week of Apr 5th<br />
All Charts Source: <strong>BNP</strong> Paribas<br />
Interest Rate Strategy 12 March 2010<br />
<strong>Market</strong> <strong>Mover</strong>, Non-Objective Research Section<br />
61<br />
www.Global<strong>Market</strong>s.bnpparibas.com
Central Bank Watch<br />
Interest Rate<br />
EUROZONE<br />
Current<br />
Rate<br />
Minimum Bid Rate 1.00<br />
US<br />
Fed Funds Rate 0 to 0.25<br />
Discount Rate 0.75<br />
JAPAN<br />
Call Rate 0.10<br />
Basic Loan Rate 0.30<br />
UK<br />
Bank Rate 0.5<br />
DENMARK<br />
Lending Rate 1.05<br />
SWEDEN<br />
Repo Rate 0.25<br />
NORWAY<br />
Sight Deposit Rate 1.75<br />
SWITZERLAND<br />
3 Mth LIBOR Target<br />
Range<br />
CANADA<br />
0.0-0.75<br />
Overnight Rate 0.25<br />
Bank Rate 0.50<br />
AUSTRALIA<br />
Cash Rate 4.00<br />
CHINA<br />
1Y Bank Lending<br />
Rate<br />
BRAZIL<br />
5.31%<br />
Selic Overnight Rate 8.75%<br />
Source: <strong>BNP</strong> Paribas<br />
Date of Last<br />
Change<br />
-25bp<br />
(7/5/09)<br />
-75bp<br />
(16/12/08)<br />
+25bp<br />
(18/2/10)<br />
-20bp<br />
(19/12/08)<br />
-20bp<br />
(19/12/08)<br />
-50bp<br />
(5/3/09)<br />
-10bp<br />
(14/1/10)<br />
-25bp<br />
(2/7/09)<br />
+25bp<br />
(16/12/09)<br />
-25bp<br />
(12/3/09)<br />
-25bp<br />
(21/4/09)<br />
-25bp<br />
(21/4/09)<br />
+25bp<br />
(2/03/09)<br />
-27bp<br />
(22/12/08)<br />
-50bp<br />
(22/7/09)<br />
Next Change in<br />
Coming 6 Months<br />
No Change<br />
No Change<br />
+25bp<br />
(Mar/May)<br />
No Change<br />
No Change<br />
No Change<br />
-5bp<br />
(Mar)<br />
+25bp<br />
(1/7/10)<br />
+25bp<br />
(Mar/May)<br />
+25bp<br />
(Sep)<br />
No Change<br />
No Change<br />
+25bp<br />
(4/5/10)<br />
+27bp<br />
(Q3)<br />
No Change<br />
Comments<br />
The combination of an insipid economic recovery and low inflation<br />
points to no conventional tightening, i.e. refi rate hikes, in 2010.<br />
The FOMC will end its purchases of mortgage-backed securities<br />
and agency debt by 31 March. It will maintain the funds rate at 0<br />
to 0.25% for an extended period and will probably raise the<br />
discount rate again after the next FOMC meeting in March.<br />
The BoJ could expand its liquidity provisions in order to<br />
cooperate with the government in countering deflation and the<br />
yen’s appreciation.<br />
We expect the MPC to reengage in asset purchases from<br />
August onwards.<br />
We expect the lending rate to fall further. The timing will depend<br />
on foreign exchange reserve developments.<br />
Given a further improvement in the economy, the Riksbank now<br />
intends to deliver its first hike in the summer or early autumn.<br />
We expect it in July. However, if the stress in financial markets<br />
intensifies, the Riksbank is likely to wait until September.<br />
Domestic economic conditions warrant further rate hikes as<br />
early as March. But the Norges Bank is now more cautious and<br />
uncertain about external developments ahead and therefore<br />
might wait until May, also given weaker-than-expected data<br />
since the last rate decision.<br />
By relaxing its commitment to prevent currency appreciation, the<br />
SNB is de facto tightening policy and has kept the ball rolling<br />
towards an eventual increase in rates. The strong franc remains<br />
the biggest hurdle to the first hike.<br />
The BoC’s conditional commitment is set to expire at the end of<br />
June. However, downside risks to activity remain, namely an<br />
expected slowdown in US growth and CAD strength. We see<br />
rates on hold through the summer and autumn and expect the<br />
first hike in Q4 2010.<br />
Following March’s rate hike, above-trend economic growth, the<br />
lack of spare capacity and the RBA’s desire to get rates to an<br />
“average level” suggest the cash rate will be raised further.<br />
The latest two RRR hikes are likely to mark the start of a series<br />
of more concrete measures to tighten policy. The first hike in key<br />
policy rates is expected in Q3 when the CPI rate is forecast to<br />
exceed 3%. However, given the authorities' rising caution about<br />
excess credit, an earlier move cannot be ruled out.<br />
The BCB frontloaded monetary easing by cutting rates by<br />
500bp. Given signs of a stabilisation of the Brazilian economy<br />
and an improvement in global conditions, we expect the BCB to<br />
remain on hold for a long period.<br />
Change since our last weekly in bold and italics<br />
For the full EMK Central Bank Watch please see our Local <strong>Market</strong>s <strong>Mover</strong><br />
<strong>Market</strong> Economics 12 March 2010<br />
<strong>Market</strong> <strong>Mover</strong><br />
62<br />
www.Global<strong>Market</strong>s.bnpparibas.com
FX Forecasts*<br />
USD Bloc Q1 '10 Q2 '10 Q3 '10 Q4 '10 Q1 '11 Q2 '11 Q3 '11 Q4 '11 Q1 '12 Q2 '12 Q3 '12<br />
EUR/USD 1.40 1.36 1.32 1.27 1.30 1.32 1.34 1.36 1.36 1.36 1.36<br />
USD/JPY 93 97 100 108 110 115 120 118 116 114 112<br />
USD/CHF 1.04 1.05 1.10 1.16 1.15 1.15 1.16 1.15 1.18 1.18 1.19<br />
GBP/USD 1.59 1.49 1.39 1.31 1.38 1.42 1.46 1.49 1.49 1.51 1.53<br />
USD/CAD 1.07 1.09 1.13 1.15 1.11 1.09 1.06 1.04 1.02 1.05 1.08<br />
AUD/USD 0.86 0.85 0.84 0.84 0.87 0.90 0.92 0.92 0.92 0.93 0.92<br />
NZD/USD 0.72 0.70 0.68 0.67 0.66 0.66 0.68 0.69 0.72 0.69 0.67<br />
USD/SEK 7.07 7.35 7.42 7.64 7.38 7.27 7.16 6.84 6.76 6.91 7.06<br />
USD/NOK 5.79 6.10 6.14 6.30 6.15 5.91 5.67 5.51 5.44 5.51 5.59<br />
EUR Bloc Q1 '10 Q2 '10 Q3 '10 Q4 '10 Q1 '11 Q2 '11 Q3 '11 Q4 '11 Q1 '12 Q2 '12 Q3 '12<br />
EUR/JPY 130 132 132 137 143 152 161 160 158 155 152<br />
EUR/GBP 0.88 0.91 0.95 0.97 0.94 0.93 0.92 0.91 0.91 0.90 0.89<br />
EUR/CHF 1.45 1.43 1.45 1.47 1.49 1.52 1.55 1.57 1.60 1.61 1.62<br />
EUR/SEK 9.90 10.00 9.80 9.70 9.60 9.60 9.60 9.30 9.20 9.40 9.60<br />
EUR/NOK 8.10 8.30 8.10 8.00 8.00 7.80 7.60 7.50 7.40 7.50 7.60<br />
EUR/DKK 7.46 7.46 7.46 7.46 7.46 7.46 7.46 7.46 7.46 7.46 7.46<br />
Central Europe Q1 '10 Q2 '10 Q3 '10 Q4 '10 Q1 '11 Q2 '11 Q3 '11 Q4 '11 Q1 '12 Q2 '12 Q3 '12<br />
USD/PLN 2.80 3.09 3.30 3.19 3.15 3.03 2.84 2.94 2.79 2.72 2.65<br />
EUR/CZK 26.0 26.2 26.2 25.8 25.2 25.5 25.0 24.7 24.3 24.0 23.9<br />
EUR/HUF 265 280 278 265 260 255 250 260 255 255 255<br />
USD/ZAR 8.00 8.20 8.30 8.50 8.40 8.50 8.40 8.20 7.80 7.80 7.50<br />
USD/TRY 1.48 1.53 1.58 1.55 1.60 1.58 1.55 1.50 1.43 1.45 1.45<br />
EUR/RON 4.30 4.30 4.40 4.35 4.40 4.30 4.20 4.00 3.90 3.80 3.75<br />
USD/RUB 30.51 31.84 30.59 29.42 28.19 27.10 26.02 25.82 25.29 25.88 26.84<br />
EUR/PLN 3.92 4.20 4.35 4.05 4.10 4.00 3.80 4.00 3.80 3.70 3.60<br />
USD/UAH 8.9 8.4 8.6 8.7 8.5 8.3 7.9 7.5 5.5 5.3 5.4<br />
EUR/RSD 92 105 95 93 90 87 85 87 90 86 87<br />
Asia Bloc Q1 '10 Q2 '10 Q3 '10 Q4 '10 Q1 '11 Q2 '11 Q3 '11 Q4 '11 Q1 '12 Q2 '12 Q3 '12<br />
USD/SGD 1.37 1.36 1.36 1.34 1.33 1.32 1.31 1.30 1.30 1.30 1.30<br />
USD/MYR 3.31 3.28 3.26 3.20 3.18 3.15 3.13 3.10 3.10 3.10 3.10<br />
USD/IDR 9000 8800 8700 8600 8500 8400 8300 8200 8100 8000 8000<br />
USD/THB 32.70 32.50 32.30 32.00 31.70 31.50 31.30 31.00 31.00 31.00 31.00<br />
USD/PHP 45.50 45.00 44.50 44.00 43.50 43.00 42.70 42.50 42.00 42.00 42.00<br />
USD/HKD 7.80 7.80 7.80 7.80 7.80 7.80 7.80 7.80 7.80 7.80 7.80<br />
USD/RMB 6.83 6.83 6.72 6.62 6.57 6.52 6.47 6.42 6.37 6.32 6.27<br />
USD/TWD 30.70 30.50 30.30 30.00 29.70 29.50 29.30 29.00 29.00 29.00 29.00<br />
USD/KRW 1120 1090 1070 1050 1030 1020 1010 1000 1000 1000 1000<br />
USD/INR 45.00 44.00 43.00 42.00 41.00 40.00 39.00 38.00 38.00 38.00 38.00<br />
USD/VND 19000 19500 20000 20500 20500 20500 20500 20500 16000 16000 16000<br />
LATAM Bloc Q1 '10 Q2 '10 Q3 '10 Q4 '10 Q1 '11 Q2 '11 Q3 '11 Q4 '11 Q1 '12 Q2 '12 Q3 '12<br />
USD/ARS 3.89 4.20 4.10 4.20 4.25 4.35 4.45 4.50 4.60 4.70 4.80<br />
USD/BRL 1.90 1.90 1.80 1.75 1.75 1.80 1.80 1.85 1.85 1.85 1.85<br />
USD/CHL 505 530 525 530 530 535 535 535 540 540 540<br />
USD/MXN 13.00 13.75 13.10 12.50 12.50 12.50 12.50 12.50 12.25 12.25 12.00<br />
USD/COP 1900 2100 2050 2000 2000 2050 2100 2100 2150 2150 2200<br />
USD/VEF (Priority) (1) 2.59 2.59 2.59 2.59 2.59 2.59 2.59 2.59 5.30 5.30 5.30<br />
USD/VEF (Oil) (1) 4.60 4.60 4.60 4.60 4.60 4.60 4.60 4.60 8.00 8.00 8.00<br />
Others Q1 '10 Q2 '10 Q3 '10 Q4 '10 Q1 '11 Q2 '11 Q3 '11 Q4 '11 Q1 '12 Q2 '12 Q3 '12<br />
USD Index 79.19 81.91 84.85 88.70 86.73 86.04 85.28 83.79 83.46 83.47 83.46<br />
*End Quarter<br />
(1) Following the devaluation of the VEF, there is now an official ‘priority’ exchange rate and a so-called ‘oil’ exchange rate used for certain transactions<br />
Source: <strong>BNP</strong> Paribas<br />
Foreign Exchange Strategy DD Month 2009<br />
<strong>Market</strong> <strong>Mover</strong><br />
www.Global<strong>Market</strong>s.bnpparibas.com<br />
63
<strong>Market</strong> Coverage<br />
<strong>Market</strong> Economics<br />
Paul Mortimer-Lee Global Head of <strong>Market</strong> Economics London 44 20 7595 8551 paul.mortimer-lee@uk.bnpparibas.com<br />
Ken Wattret Chief Eurozone <strong>Market</strong> Economist London 44 20 7595 8657 kenneth.wattret@uk.bnpparibas.com<br />
Luigi Speranza Head of Inflation Economics, Eurozone, Italy London 44 20 7595 8322 luigi.speranza@uk.bnpparibas.com<br />
Alan Clarke UK London 44 20 7595 8476 alan.clarke@uk.bnpparibas.com<br />
Eoin O’Callaghan Inflation, Eurozone, Switzerland, Ireland London 44 20 7595 8226 eoin.ocallaghan@uk.bnpparibas.com<br />
Gizem Kara Scandinavia London 44 20 7595 8783 gizem.kara@uk.bnpparibas.com<br />
Dominique Barbet Eurozone, France Paris 33 1 4298 1567 dominique.barbet@bnpparibas.com<br />
Brian Fabbri Chief Economist North America New York 1 212 841 3633 brian.fabbri@americas.bnpparibas.com<br />
Julia Coronado Senior US Economist New York 1 212 841 2281 julia.l.coronado@americas.bnpparibas.com<br />
Anna Piretti US, Canada New York 1 212 841 3663 anna.piretti@americas.bnpparibas.com<br />
Ryutaro Kono Chief Economist Japan Tokyo 81 3 6377 1601 ryutaro.kono@japan.bnpparibas.com<br />
Hiroshi Shiraishi Japan Tokyo 81 3 6377 1602 hiroshi.shiraishi@japan.bnpparibas.com<br />
Azusa Kato Japan Tokyo 81 3 6377 1603 azusa.kato@japan.bnpparibas.com<br />
Richard Iley Head of Asia Economics Hong Kong 852 2108 5104 richard.iley@asia.bnpparibas.com<br />
Dominic Bryant Asia, Australia Hong Kong 852 2108 5105 dominic.bryant@asia.bnpparibas.com<br />
Chan Kok Peng Chief Economist Singapore 65 6210 1946 kokpeng.chan@asia.bnpparibas.com<br />
Michal Dybula Central & Eastern Europe Warsaw 48 22 697 2354 michal.dybula@pl.bnpparibas.com<br />
Rafael de la Fuente Chief Economist Latin America ex Brazil New York 1 212 841 3637 rafael.delafuente@americas.bnpparibas.com<br />
Italo Lombardi Latin America New York 1 212 841 6599 italo.lombardi@americas.bnpparibas.com<br />
Alexandre Lintz Latin America São Paulo 55 11 3841 3418 alexandre.lintz@br.bnpparibas.com<br />
Diego Donadio Latin America São Paulo 55 11 3841 3421 diego.donadio@@br.bnpparibas.com<br />
Interest Rate Strategy<br />
Cyril Beuzit Global Head of Interest Rate Strategy London 44 20 7595 8639 cyril.beuzit@uk.bnpparibas.com<br />
Patrick Jacq Europe Strategist Paris 33 1 4316 9718 patrick.jacq@bnpparibas.com<br />
Hervé Cros Chief Inflation Strategist London 44 20 7595 8419 herve.cros@uk.bnpparibas.com<br />
Shahid Ladha Inflation Strategist London 44 20 7 595 8573 shahid.ladha@uk.bnpparibas.com<br />
Alessandro Tentori Chief Alpha Strategy Europe London 44 20 7595 8238 alessandro.tentori@uk.bnpparibas.com<br />
Matteo Regesta Europe Alpha Strategist London 44 20 7595 8607 matteo.regesta@uk.bnpparibas.com<br />
Ioannis Sokos Europe Alpha Strategist London 44 20 7595 8671 ioannis.sokos@uk.bnpparibas.com<br />
Bülent Baygün Head of Interest Rate Strategy US New York 1 212 471 8043 bulent.baygun@americas.bnpparibas.com<br />
Sergey Bondarchuk US Strategist New York 1 212 841 2026 sergey.bondarchuk@americas.bnpparibas.com<br />
Suvrat Prakash US Strategist New York 1 917 472 4374 suvrat.prakash@americas.bnpparibas.com<br />
Anish Lohokare MBS Strategist New York 1 212 841 2867 anish.lohokare@americas.bnpparibas.com<br />
Olurotimi Ajibola MBS Strategist New York 1 212 8413831 olurotimi.ajibola@americas.bnpparibas.com<br />
Koji Shimamoto Head of Interest Rate Strategy Japan Tokyo 81 3 6377 1700 koji.shimamoto@japan.bnpparibas.com<br />
Takafumi Yamawaki Japan Strategist Tokyo 81 3 6377 1705 takafumi.yamawak@bnpparibas.com<br />
Tomohisa Fujiki Japan Strategist Tokyo 81 3 6377 1702 Tomohisa.fujiki@japan.bnpparibas.com<br />
Christian Séné Technical Analyst Paris 33 1 4316 9717 christian.séné@bnpparibas.com<br />
FX Strategy<br />
Hans Redeker Global Head of FX Strategy London 44 20 7595 8086 hans-guenter.redeker@uk.bnpparibas.com<br />
Ian Stannard FX Strategist London 44 20 7595 8086 ian.stannard@uk.bnpparibas.com<br />
James Hellawell Quantitative Strategist London 44 20 7595 8485 james.hellawell@uk.bnpparibas.com<br />
Sebastien Galy FX Strategist New York 1 212 841 2492 sebastien.galy@bnpparibas.com<br />
Andy Chaveriat Technical Analyst New York 1 212 841 2408 andrew.chaveriat@americas.bnpparibas.com<br />
Emerging <strong>Market</strong>s FX & Interest Rate Strategy<br />
Drew Brick Head of FX & IR Strategy Asia Singapore 65 6210 3262 Drew.brick@asia.bnpparibas.com<br />
Chin Loo Thio FX & IR Asia Strategist Singapore 65 6210 3263 chin.thio@asia.bnpparibas.com<br />
Robert Ryan FX & IR Asia Strategist Singapore 65 6210 3314 robert.ryan@asia.bnpparibas.com<br />
Gao Qi FX & IR Asia Strategist Singapore 65 6210 3264 gao.qi@asia.bnpparibas.com<br />
Shahin Vallée Head of FX & IR Strategy CEEMEA London 44 20 7595 8306 shahin.vallee@uk.bnpparibas.com<br />
Elisabeth Gruié FX & IR CEEMEA Strategist London 44 20 7595 8492 elisabeth.gruie@uk.bnpparibas.com<br />
Bartosz Pawlowski FX & IR CEEMEA Strategist London 44 20 7595 8195 Bartosz.pawlowski@uk.bnpparibas.com<br />
For Production and Distribution, please contact:<br />
Ann Aston, <strong>Market</strong> Economics, London. Tel: 44 20 7595 8503 Email: ann.aston@uk.bnpparibas.com<br />
Danielle Catananzi, Interest Rate Strategy, London. Tel: 44 20 7595 4418 Email: danielle.catananzi@uk.bnpparibas.com<br />
Derek Allassani, FX Strategy, London. Tel: 44 20 7595 8486 Email: derek.allassani@uk.bnpparibas.com<br />
Martine Borde, <strong>Market</strong> Economics/Interest Rate Strategy, Paris. Tel: 33 1 4298 4144 Email martine.borde@bnpparibas.com<br />
Editors<br />
Amanda Grantham-Hill, Interest Rate Strategy/<strong>Market</strong> Economics, London. Tel: 44 20 7595 4107 Email: amanda.grantham-hill@bnpparibas.com<br />
Nick Ashwell, FX/<strong>Market</strong> Economics, London. Tel: 44 20 7595 4120 Email: nick.ashwell@uk.bnpparibas.com<br />
<strong>BNP</strong> Paribas Global Fixed Income Website<br />
www.globalmarkets.bnpparibas.com<br />
Bloomberg<br />
Fixed Income Research BPCM <strong>Market</strong> Economics BPEC<br />
Interest Rate Strategy BPBS Forex Strategy BPFR<br />
64
RESEARCH DISCLAIMERS:<br />
IMPORTANT DISCLOSURES: Please see important disclosures in the text of this report.<br />
Some sections of this report have been written by our strategy teams. These sections are clearly labelled and do not purport to be an exhaustive<br />
analysis, and may be subject to conflicts of interest resulting from their interaction with sales and trading which could affect the objectivity of this<br />
report. (Please see further important disclosures in the text of this report). These sections are a marketing communication. They are not<br />
independent investment research. They have not been prepared in accordance with legal requirements designed to provide the independence<br />
of investment research, and are not subject to any prohibition on dealing ahead of the dissemination of investment research.<br />
The information and opinions contained in this report have been obtained from, or are based on, public sources believed to be reliable, but no<br />
representation or warranty, express or implied, is made that such information is accurate, complete or up to date and it should not be relied<br />
upon as such. This report does not constitute an offer or solicitation to buy or sell any securities or other investment. Information and opinions<br />
contained in the report are published for the assistance of recipients, but are not to be relied upon as authoritative or taken in substitution for the<br />
exercise of judgement by any recipient, are subject to change without notice and not intended to provide the sole basis of any evaluation of the<br />
instruments discussed herein. Any reference to past performance should not be taken as an indication of future performance. To the fullest<br />
extent permitted by law, no <strong>BNP</strong> Paribas group company accepts any liability whatsoever (including in negligence) for any direct or<br />
consequential loss arising from any use of or reliance on material contained in this report. All estimates and opinions included in this report are<br />
made as of the date of this report. Unless otherwise indicated in this report there is no intention to update this report. <strong>BNP</strong> Paribas SA and its<br />
affiliates (collectively “<strong>BNP</strong> Paribas”) may make a market in, or may, as principal or agent, buy or sell securities of any issuer or person<br />
mentioned in this report or derivatives thereon. <strong>BNP</strong> Paribas may have a financial interest in any issuer or person mentioned in this report,<br />
including a long or short position in their securities and/or options, futures or other derivative instruments based thereon, or vice versa. <strong>BNP</strong><br />
Paribas, including its officers and employees may serve or have served as an officer, director or in an advisory capacity for any person<br />
mentioned in this report. <strong>BNP</strong> Paribas may, from time to time, solicit, perform or have performed investment banking, underwriting or other<br />
services (including acting as adviser, manager, underwriter or lender) within the last 12 months for any person referred to in this report. <strong>BNP</strong><br />
Paribas may be a party to an agreement with any person relating to the production of this report. <strong>BNP</strong> Paribas, may to the extent permitted by<br />
law, have acted upon or used the information contained herein, or the research or analysis on which it was based, before its publication. <strong>BNP</strong><br />
Paribas may receive or intend to seek compensation for investment banking services in the next three months from or in relation to any person<br />
mentioned in this report. Any person mentioned in this report may have been provided with sections of this report prior to its publication in order<br />
to verify its factual accuracy.<br />
<strong>BNP</strong> Paribas is incorporated in France with limited liability. Registered Office 16 Boulevard des Italiens, 75009 Paris. This report was produced<br />
by a <strong>BNP</strong> Paribas group company. This report is for the use of intended recipients and may not be reproduced (in whole or in part) or delivered<br />
or transmitted to any other person without the prior written consent of <strong>BNP</strong> Paribas. By accepting this document you agree to be bound by the<br />
foregoing limitations.<br />
Certain countries within the European Economic Area:<br />
This report is solely prepared for professional clients. It is not intended for retail clients and should not be passed on to any such persons.<br />
This report has been approved for publication in the United Kingdom by <strong>BNP</strong> Paribas London Branch. <strong>BNP</strong> Paribas London Branch is<br />
authorised by CECEI and AMF and authorised and subject to limited regulation by the Financial <strong>Services</strong> Authority. Details of the extent of our<br />
authorisation and regulation by the Financial <strong>Services</strong> Authority are available from us on request.<br />
This report has been approved for publication in France by <strong>BNP</strong> Paribas, a credit institution licensed as an investment services provider by the<br />
CECEI and the AMF, whose head office is 16, Boulevard des Italiens 75009 Paris, France.<br />
This report is being distributed in Germany either by <strong>BNP</strong> Paribas London Branch or by <strong>BNP</strong> Paribas Niederlassung Frankfurt am Main,<br />
regulated by the Bundesanstalt für Finanzdienstleistungsaufsicht (BaFin).<br />
United States: This report is being distributed to US persons by <strong>BNP</strong> Paribas Securities Corp., or by a subsidiary or affiliate of <strong>BNP</strong> Paribas<br />
that is not registered as a US broker-dealer to US major institutional investors only. <strong>BNP</strong> Paribas Securities Corp., a subsidiary of <strong>BNP</strong> Paribas,<br />
is a broker-dealer registered with the Securities and Exchange Commission and a member of the National Association of Securities Dealers, the<br />
New York Stock Exchange and other principal exchanges. <strong>BNP</strong> Paribas Securities Corp. accepts responsibility for the content of a report<br />
prepared by another non-US affiliate only when distributed to US persons by <strong>BNP</strong> Paribas Securities Corp.<br />
Japan: This report is being distributed to Japanese based firms by <strong>BNP</strong> Paribas Securities (Japan) Limited, Tokyo Branch, or by a subsidiary or<br />
affiliate of <strong>BNP</strong> Paribas not registered as a financial instruments firm in Japan, to certain financial institutions defined by article 17-3, item 1 of<br />
the Financial Instruments and Exchange Law Enforcement Order. <strong>BNP</strong> Paribas Securities (Japan) Limited, Tokyo Branch, a subsidiary of <strong>BNP</strong><br />
Paribas, is a financial instruments firm registered according to the Financial Instruments and Exchange Law of Japan and a member of the<br />
Japan Securities Dealers Association. <strong>BNP</strong> Paribas Securities (Japan) Limited, Tokyo Branch accepts responsibility for the content of a report<br />
prepared by another non-Japan affiliate only when distributed to Japanese based firms by <strong>BNP</strong> Paribas Securities (Japan) Limited, Tokyo<br />
Branch. Some of the foreign securities stated on this report are not disclosed according to the Financial Instruments and Exchange Law of<br />
Japan.<br />
Hong Kong: This report is being distributed in Hong Kong by <strong>BNP</strong> Paribas Hong Kong Branch, a branch of <strong>BNP</strong> Paribas whose head office is in<br />
Paris, France. <strong>BNP</strong> Paribas Hong Kong Branch is regulated as a Registered Institution by Hong Kong Monetary Authority for the conduct of<br />
Advising on Securities [Regulated Activity Type 4] under the Securities and Futures Ordinance.<br />
© <strong>BNP</strong> Paribas (2010). All rights reserved.


