

Market Economics | Interest Rate Strategy - BNP PARIBAS ...
Market Economics | Interest Rate Strategy - BNP PARIBAS ...
Market Economics | Interest Rate Strategy - BNP PARIBAS ...

You also want an ePaper? Increase the reach of your titles
YUMPU automatically turns print PDFs into web optimized ePapers that Google loves.
Table 1: <strong>BNP</strong> Paribas' Inflation Forecasts<br />
Eurozone<br />
France<br />
US<br />
Headline HICP Ex-tobacco HICP<br />
Headline CPI<br />
Ex-tobacco CPI<br />
CPI Urban SA CPI Urban NSA<br />
Index % m/m % y/y Index % m/m % y/y Index % m/m % y/y index % m/m % y/y Index % m/m % y/y Index % m/m % y/y<br />
2009 108.1 - 0.3 107.9 - 0.2 119.3 - 0.1 118.0 - 0.1 214.5 - -0.3 214.5 - -0.4<br />
2010 109.8 - 1.6 109.5 - 1.5 121.1 - 1.5 119.8 - 1.5 218.1 - 1.6 218.1 - 1.6<br />
2011 (1) 112.2 - 2.2 111.8 - 2.1 123.6 - 2.0 122.1 - 1.9 221.4 - 1.5 221.3 - 1.5<br />
Q1 2010 108.6 - 1.1 108.3 - 1.0 120.3 - 1.3 119.0 - 1.2 217.6 - 2.4 217.0 - 2.4<br />
Q2 2010 110.0 - 1.5 109.7 - 1.4 121.3 - 1.6 120.0 - 1.5 217.2 - 1.8 218.1 - 1.8<br />
Q3 2010 109.9 - 1.7 109.5 - 1.6 121.2 - 1.5 119.8 - 1.5 218.0 - 1.2 218.3 - 1.2<br />
Q4 2010 110.8 - 2.0 110.5 - 1.9 121.7 - 1.6 120.2 - 1.6 219.4 - 1.2 218.9 - 1.3<br />
Q1 2011 (1) 111.1 - 2.3 110.7 - 2.2 122.5 - 1.8 121.1 - 1.8 220.9 - 1.5 220.4 - 1.6<br />
Q2 2011 (1) 112.1 - 1.9 111.7 - 1.8 123.5 - 1.8 122.0 - 1.7 221.2 - 1.8 222.0 - 1.8<br />
Q3 2011 (1) 112.3 - 2.2 111.8 - 2.1 123.8 - 2.1 122.3 - 2.0 221.5 - 1.6 221.7 - 1.6<br />
Q4 2011 (1) 113.3 - 2.3 112.9 - 2.2 124.4 - 2.3 122.9 - 2.2 221.8 - 1.1 221.2 - 1.1<br />
Jul 10 109.7 -0.3 1.7 109.31 -0.4 1.7 121.0 -0.3 1.7 119.68 -0.3 1.6 217.6 0.3 1.3 218.01 0.0 1.2<br />
Aug 10 109.9 0.2 1.6 109.54 0.2 1.5 121.3 0.2 1.4 119.97 0.2 1.3 218.2 0.3 1.2 218.31 0.1 1.1<br />
Sep 10 110.1 0.2 1.8 109.76 0.2 1.7 121.2 -0.1 1.6 119.88 -0.1 1.5 218.4 0.1 1.1 218.44 0.1 1.1<br />
Oct 10 110.5 0.4 1.9 110.16 0.4 1.8 121.4 0.1 1.6 120.03 0.1 1.5 218.9 0.2 1.2 218.71 0.1 1.2<br />
Nov 10 110.6 0.1 1.9 110.27 0.1 1.8 121.5 0.1 1.6 120.09 0.0 1.5 219.1 0.1 1.1 218.80 0.0 1.1<br />
Dec 10 111.3 0.6 2.2 110.93 0.6 2.1 122.1 0.5 1.8 120.61 0.4 1.7 220.3 0.5 1.4 219.18 0.2 1.5<br />
Jan 11 (1) 110.6 -0.6 2.3 110.17 -0.7 2.2 122.1 0.0 2.0 120.58 0.0 1.9 220.8 0.3 1.5 219.95 0.4 1.5<br />
Feb 11 (1) 111.0 0.4 2.4 110.56 0.4 2.3 122.5 0.4 1.8 121.07 0.4 1.7 221.1 0.1 1.6 220.29 0.2 1.6<br />
Mar 11 (1) 111.7 0.6 2.1 111.27 0.6 2.0 123.0 0.4 1.7 121.53 0.4 1.6 220.9 -0.1 1.5 220.91 0.3 1.5<br />
Apr 11 (1) 112.0 0.3 1.9 111.56 0.3 1.8 123.3 0.3 1.7 121.85 0.3 1.6 221.1 0.1 1.6 221.50 0.3 1.6<br />
May 11 (1) 112.1 0.2 1.9 111.73 0.2 1.8 123.5 0.2 1.8 122.06 0.2 1.7 221.2 0.0 1.8 222.06 0.3 1.8<br />
Jun 11 (1) 112.2 0.1 2.0 111.79 0.1 1.9 123.6 0.1 1.8 122.13 0.1 1.8 221.3 0.0 2.0 222.38 0.1 2.0<br />
Jul 11 (1) 111.9 -0.2 2.1 111.49 -0.3 2.0 123.4 -0.2 2.0 121.93 -0.2 1.9 221.4 0.1 1.7 221.89 -0.2 1.8<br />
Aug 11 (1) 112.3 0.3 2.2 111.84 0.3 2.1 123.9 0.4 2.1 122.40 0.4 2.0 221.5 0.0 1.5 221.69 -0.1 1.5<br />
Sep 11 (1) 112.6 0.3 2.3 112.17 0.3 2.2 124.0 0.1 2.3 122.48 0.1 2.2 221.6 0.0 1.5 221.64 0.0 1.5<br />
Oct 11 (1) 113.1 0.5 2.4 112.70 0.5 2.3 124.3 0.3 2.4 122.76 0.2 2.3 221.7 0.0 1.3 221.49 -0.1 1.3<br />
Nov 11 (1) 113.2 0.1 2.4 112.78 0.1 2.3 124.4 0.1 2.4 122.83 0.1 2.3 221.8 0.1 1.2 221.36 -0.1 1.2<br />
Dec 11 (1) 113.6 0.3 2.1 113.13 0.3 2.0 124.7 0.2 2.1 123.10 0.2 2.1 222.0 0.1 0.8 220.80 -0.3 0.7<br />
Updated<br />
Next<br />
Release<br />
Jan 20<br />
Jan Flash HICP (Jan 31)<br />
Jan 20<br />
Jan CPI (Feb 23)<br />
Jan 14<br />
Jan CPI (Feb 17)<br />
Source: <strong>BNP</strong> Paribas, (1) Forecasts<br />
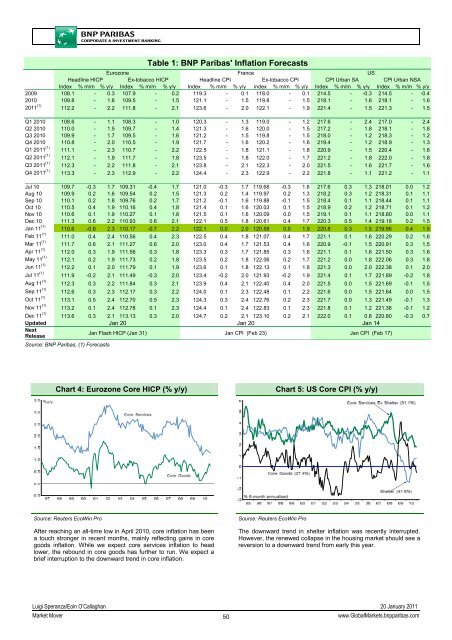
Chart 4: Eurozone Core HICP (% y/y)<br />
Chart 5: US Core CPI (% y/y)<br />
Source: Reuters EcoWin Pro<br />
After reaching an all-time low in April 2010, core inflation has been<br />
a touch stronger in recent months, mainly reflecting gains in core<br />
goods inflation. While we expect core services inflation to head<br />
lower, the rebound in core goods has further to run. We expect a<br />
brief interruption to the downward trend in core inflation.<br />
Source: Reuters EcoWin Pro<br />
The downward trend in shelter inflation was recently interrupted.<br />
However, the renewed collapse in the housing market should see a<br />
reversion to a downward trend from early this year.<br />
Luigi Speranza/Eoin O’Callaghan 20 January 2011<br />
<strong>Market</strong> Mover<br />
50<br />
www.Global<strong>Market</strong>s.bnpparibas.com


