

Market Economics | Interest Rate Strategy - BNP PARIBAS ...
Market Economics | Interest Rate Strategy - BNP PARIBAS ...
Market Economics | Interest Rate Strategy - BNP PARIBAS ...

Create successful ePaper yourself
Turn your PDF publications into a flip-book with our unique Google optimized e-Paper software.
EMU Debt Monitor: SSA & Covered Bonds<br />
• The recent richening of OBND, the Austrian<br />
agency, in the 10y area seems overrated.<br />
• In this segment of the curve, Dutch agencies<br />
offer a better yield and positive rolldown.<br />
• STRATEGY: Sell OBND Oct 2020 / Buy BNG<br />
Sep 2020 or NEDWBK Jan 2021 (yield pickup:<br />
7bp and 9bp resp.).<br />
Supply out of European SSA is not slowing. Seven<br />
benchmarks have been issued so far this week.<br />
NRW.BANK and ICO each issued a new EUR 1bn<br />
benchmark while KFW, CADES, EIB and NIB<br />
launched new bonds denominated in USD (USD<br />
1.5bn, 2.5bn, 4.5bn and 1bn respectively). The<br />
inaugural EFSF transaction is expected to be<br />
launched by the end of the month. The new 5y EUR<br />
benchmark is likely to add EUR 3-5bn to the USD<br />
54bn (equivalent) European SSA issued so far this<br />
month. This will be a key event to watch.<br />
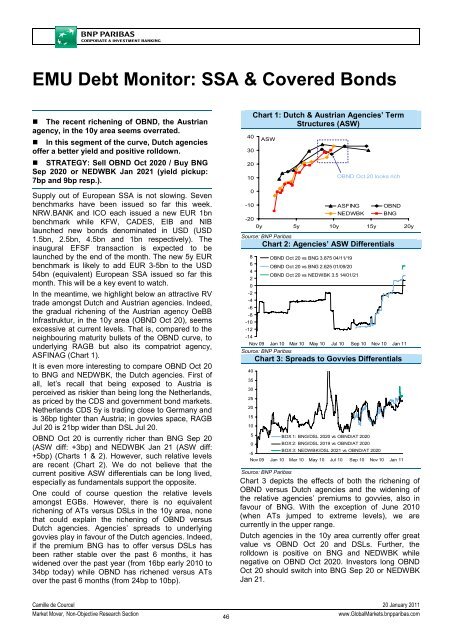
In the meantime, we highlight below an attractive RV<br />
trade amongst Dutch and Austrian agencies. Indeed,<br />
the gradual richening of the Austrian agency OeBB<br />
Infrastruktur, in the 10y area (OBND Oct 20), seems<br />
excessive at current levels. That is, compared to the<br />
neighbouring maturity bullets of the OBND curve, to<br />
underlying RAGB but also its compatriot agency,<br />
ASFINAG (Chart 1).<br />
It is even more interesting to compare OBND Oct 20<br />
to BNG and NEDWBK, the Dutch agencies. First of<br />
all, let’s recall that being exposed to Austria is<br />
perceived as riskier than being long the Netherlands,<br />
as priced by the CDS and government bond markets.<br />
Netherlands CDS 5y is trading close to Germany and<br />
is 36bp tighter than Austria; in govvies space, RAGB<br />
Jul 20 is 21bp wider than DSL Jul 20.<br />
OBND Oct 20 is currently richer than BNG Sep 20<br />
(ASW diff: +3bp) and NEDWBK Jan 21 (ASW diff:<br />
+5bp) (Charts 1 & 2). However, such relative levels<br />
are recent (Chart 2). We do not believe that the<br />
current positive ASW differentials can be long lived,<br />
especially as fundamentals support the opposite.<br />
One could of course question the relative levels<br />
amongst EGBs. However, there is no equivalent<br />
richening of ATs versus DSLs in the 10y area, none<br />
that could explain the richening of OBND versus<br />
Dutch agencies. Agencies’ spreads to underlying<br />
govvies play in favour of the Dutch agencies. Indeed,<br />
if the premium BNG has to offer versus DSLs has<br />
been rather stable over the past 6 months, it has<br />
widened over the past year (from 16bp early 2010 to<br />
34bp today) while OBND has richened versus ATs<br />
over the past 6 months (from 24bp to 10bp).<br />
40<br />
30<br />
20<br />
10<br />
0<br />
Chart 1: Dutch & Austrian Agencies’ Term<br />
Structures (ASW)<br />
ASW<br />
OBND Oct 20 looks rich<br />
-10<br />
ASFING OBND<br />
NEDWBK BNG<br />
-20<br />
0y 5y 10y 15y 20y<br />
Source: <strong>BNP</strong> Paribas<br />
Chart 2: Agencies’ ASW Differentials<br />
8<br />
6<br />
4<br />
2<br />
0<br />
-2<br />
-4<br />
-6<br />
-8<br />
-10<br />
-12<br />
OBND Oct 20 vs BNG 3.875 04/11/19<br />
OBND Oct 20 vs BNG 2.625 01/09/20<br />
OBND Oct 20 vs NEDWBK 3.5 14/01/21<br />
-14<br />
Nov 09 Jan 10 Mar 10 May 10 Jul 10 Sep 10 Nov 10 Jan 11<br />
Source: <strong>BNP</strong> Paribas<br />
Chart 3: Spreads to Govvies Differentials<br />
40<br />
35<br />
30<br />
25<br />
20<br />
15<br />
10<br />
5<br />
BOX 1: BNG/DSL 2020 vs OBND/AT 2020<br />
0<br />
BOX 2: BNG/DSL 2019 vs OBND/AT 2020<br />
-5<br />
BOX 3: NEDWBK/DSL 2021 vs OBND/AT 2020<br />
Nov 09 Jan 10 Mar 10 May 10 Jul 10 Sep 10 Nov 10 Jan 11<br />
Source: <strong>BNP</strong> Paribas<br />
Chart 3 depicts the effects of both the richening of<br />
OBND versus Dutch agencies and the widening of<br />
the relative agencies’ premiums to govvies, also in<br />
favour of BNG. With the exception of June 2010<br />
(when ATs jumped to extreme levels), we are<br />
currently in the upper range.<br />
Dutch agencies in the 10y area currently offer great<br />
value vs OBND Oct 20 and DSLs. Further, the<br />
rolldown is positive on BNG and NEDWBK while<br />
negative on OBND Oct 2020. Investors long OBND<br />
Oct 20 should switch into BNG Sep 20 or NEDWBK<br />
Jan 21.<br />
Camille de Courcel 20 January 2011<br />
<strong>Market</strong> Mover, Non-Objective Research Section<br />
46<br />
www.Global<strong>Market</strong>s.bnpparibas.com


