

Market Economics | Interest Rate Strategy - BNP PARIBAS ...
Market Economics | Interest Rate Strategy - BNP PARIBAS ...
Market Economics | Interest Rate Strategy - BNP PARIBAS ...

You also want an ePaper? Increase the reach of your titles
YUMPU automatically turns print PDFs into web optimized ePapers that Google loves.
ECB Inflation Performance: A Review<br />
• The eurozone inflation broke above the 2.0%<br />
threshold in December. More importantly,<br />
average eurozone inflation since January 1999<br />
rose from 1.98% in November to 2.01% in<br />
December.<br />
• Other indicators show that inflation remains<br />
subdued and below headline HICP, the measure<br />
the ECB has chosen to target. This implies the<br />
ECB has chosen the most demanding target.<br />
• The latest inflation figure has not altered<br />
ECB policy, but the language was toughened.<br />
Jean-Claude Trichet revisited the wording of the<br />
ECB achievement and that of the policy outlook.<br />
128<br />
124<br />
120<br />
116<br />
112<br />
108<br />
104<br />
100<br />
Base<br />
98=100<br />
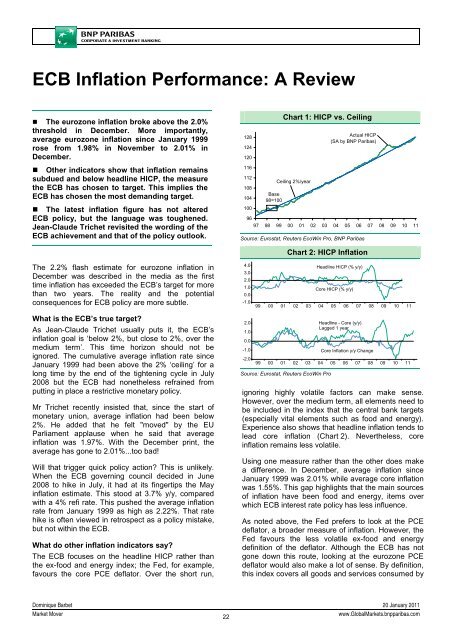
Chart 1: HICP vs. Ceiling<br />
Ceiling 2%/year<br />
Actual HICP<br />
(SA by <strong>BNP</strong> Paribas)<br />
96<br />
97 98 99 00 01 02 03 04 05 06 07 08 09 10 11<br />
Source: Eurostat, Reuters EcoWin Pro, <strong>BNP</strong> Paribas<br />
Chart 2: HICP Inflation<br />
The 2.2% flash estimate for eurozone inflation in<br />
December was described in the media as the first<br />
time inflation has exceeded the ECB’s target for more<br />
than two years. The reality and the potential<br />
consequences for ECB policy are more subtle.<br />
What is the ECB’s true target?<br />
As Jean-Claude Trichet usually puts it, the ECB’s<br />
inflation goal is ‘below 2%, but close to 2%, over the<br />
medium term’. This time horizon should not be<br />
ignored. The cumulative average inflation rate since<br />
January 1999 had been above the 2% ‘ceiling’ for a<br />
long time by the end of the tightening cycle in July<br />
2008 but the ECB had nonetheless refrained from<br />
putting in place a restrictive monetary policy.<br />
Mr Trichet recently insisted that, since the start of<br />
monetary union, average inflation had been below<br />
2%. He added that he felt "moved" by the EU<br />
Parliament applause when he said that average<br />
inflation was 1.97%. With the December print, the<br />
average has gone to 2.01%...too bad!<br />
Will that trigger quick policy action? This is unlikely.<br />
When the ECB governing council decided in June<br />
2008 to hike in July, it had at its fingertips the May<br />
inflation estimate. This stood at 3.7% y/y, compared<br />
with a 4% refi rate. This pushed the average inflation<br />
rate from January 1999 as high as 2.22%. That rate<br />
hike is often viewed in retrospect as a policy mistake,<br />
but not within the ECB.<br />
What do other inflation indicators say?<br />
The ECB focuses on the headline HICP rather than<br />
the ex-food and energy index; the Fed, for example,<br />
favours the core PCE deflator. Over the short run,<br />
4.0 Headline HICP (% y/y)<br />
3.0<br />
2.0<br />
1.0<br />
0.0<br />
-1.0<br />
2.0<br />
1.0<br />
0.0<br />
-1.0<br />
-2.0<br />
Core HICP (% y/y)<br />
99 00 01 02 03 04 05 06 07 08 09 10 11<br />
99 00 01 02 03 04 05 06 07 08 09 10 11<br />
Source: Eurostat, Reuters EcoWin Pro<br />
Headline - Core (y/y)<br />
Lagged 1 year<br />
Core Inflation y/y Change<br />
ignoring highly volatile factors can make sense.<br />
However, over the medium term, all elements need to<br />
be included in the index that the central bank targets<br />
(especially vital elements such as food and energy).<br />
Experience also shows that headline inflation tends to<br />
lead core inflation (Chart 2). Nevertheless, core<br />
inflation remains less volatile.<br />
Using one measure rather than the other does make<br />
a difference. In December, average inflation since<br />
January 1999 was 2.01% while average core inflation<br />
was 1.55%. This gap highlights that the main sources<br />
of inflation have been food and energy, items over<br />
which ECB interest rate policy has less influence.<br />
As noted above, the Fed prefers to look at the PCE<br />
deflator, a broader measure of inflation. However, the<br />
Fed favours the less volatile ex-food and energy<br />
definition of the deflator. Although the ECB has not<br />
gone down this route, looking at the eurozone PCE<br />
deflator would also make a lot of sense. By definition,<br />
this index covers all goods and services consumed by<br />
Dominique Barbet 20 January 2011<br />
<strong>Market</strong> Mover<br />
22<br />
www.Global<strong>Market</strong>s.bnpparibas.com


