

Gold Chart ($US) - The Global Speculator
Gold Chart ($US) - The Global Speculator
Gold Chart ($US) - The Global Speculator

Create successful ePaper yourself
Turn your PDF publications into a flip-book with our unique Google optimized e-Paper software.
Volume 2, Issue 16, 8 May 2008<br />
www.globalspeculator.com.au<br />
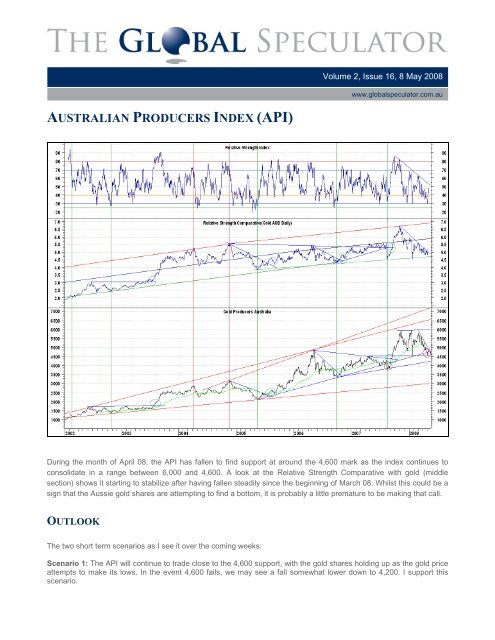
AUSTRALIAN PRODUCERS INDEX (API)<br />
During the month of April 08, the API has fallen to find support at around the 4,600 mark as the index continues to<br />
consolidate in a range between 6,000 and 4,600. A look at the Relative Strength Comparative with gold (middle<br />
section) shows it starting to stabilize after having fallen steadily since the beginning of March 08. Whilst this could be a<br />
sign that the Aussie gold shares are attempting to find a bottom, it is probably a little premature to be making that call.<br />
OUTLOOK<br />
<strong>The</strong> two short term scenarios as I see it over the coming weeks:<br />
Scenario 1: <strong>The</strong> API will continue to trade close to the 4,600 support, with the gold shares holding up as the gold price<br />
attempts to make its lows. In the event 4,600 fails, we may see a fall somewhat lower down to 4,200. I support this<br />
scenario.<br />
Volume 1, Issue 4, 5 June 2006<br />
© <strong>The</strong> <strong>Global</strong> <strong>Speculator</strong> 6
