

Gold Chart ($US) - The Global Speculator
Gold Chart ($US) - The Global Speculator
Gold Chart ($US) - The Global Speculator

Create successful ePaper yourself
Turn your PDF publications into a flip-book with our unique Google optimized e-Paper software.
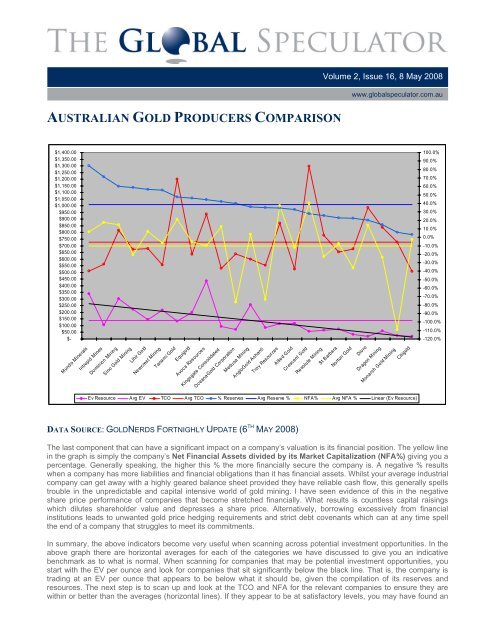
AUSTRALIAN GOLD PRODUCERS COMPARISON<br />
Volume 2, Issue 16, 8 May 2008<br />
www.globalspeculator.com.au<br />
$1,400.00<br />
$1,350.00<br />
$1,300.00<br />
$1,250.00<br />
$1,200.00<br />
$1,150.00<br />
$1,100.00<br />
$1,050.00<br />
$1,000.00<br />
$950.00<br />
$900.00<br />
$850.00<br />
$800.00<br />
$750.00<br />
$700.00<br />
$650.00<br />
$600.00<br />
$550.00<br />
$500.00<br />
$450.00<br />
$400.00<br />
$350.00<br />
$300.00<br />
$250.00<br />
$200.00<br />
$150.00<br />
$100.00<br />
$50.00<br />
$-<br />
100.0%<br />
90.0%<br />
80.0%<br />
70.0%<br />
60.0%<br />
50.0%<br />
40.0%<br />
30.0%<br />
20.0%<br />
10.0%<br />
0.0%<br />
-10.0%<br />
-20.0%<br />
-30.0%<br />
-40.0%<br />
-50.0%<br />
-60.0%<br />
-70.0%<br />
-80.0%<br />
-90.0%<br />
-100.0%<br />
-110.0%<br />
-120.0%<br />
Mundo Minerals<br />
Intrepid Mines<br />
Dominio n Mining<br />
Sino <strong>Gold</strong> Mining<br />
Lihir <strong>Gold</strong><br />
Newcrest Mining<br />
Tanami <strong>Gold</strong><br />
Equigold<br />
Avoca Resources<br />
Kingsgate Consolidated<br />
Oceana<strong>Gold</strong> Corporation<br />
Medusa Mining<br />
Anglo<strong>Gold</strong> Ashanti<br />
Troy Resources<br />
Allied G old<br />
Crescent <strong>Gold</strong><br />
Resolute Mining<br />
St Barbara<br />
Norton <strong>Gold</strong><br />
Dioro<br />
Dragon Mining<br />
Monarch <strong>Gold</strong> Mining<br />
Citigold<br />
Ev Resource Avg EV TCO Avg TCO % Reserves Avg Reserve % NFA% Avg NFA % Linear (Ev Resource)<br />
DATA SOURCE: GOLDNERDS FORTNIGHLY UPDATE (6 TH MAY 2008)<br />
<strong>The</strong> last component that can have a significant impact on a company’s valuation is its financial position. <strong>The</strong> yellow line<br />
in the graph is simply the company’s Net Financial Assets divided by its Market Capitalization (NFA%) giving you a<br />
percentage. Generally speaking, the higher this % the more financially secure the company is. A negative % results<br />
when a company has more liabilities and financial obligations than it has financial assets. Whilst your average industrial<br />
company can get away with a highly geared balance sheet provided they have reliable cash flow, this generally spells<br />
trouble in the unpredictable and capital intensive world of gold mining. I have seen evidence of this in the negative<br />
share price performance of companies that become stretched financially. What results is countless capital raisings<br />
which dilutes shareholder value and depresses a share price. Alternatively, borrowing excessively from financial<br />
institutions leads to unwanted gold price hedging requirements and strict debt covenants which can at any time spell<br />
the end of a company that struggles to meet its commitments.<br />
In summary, the above indicators become very useful when scanning across potential investment opportunities. In the<br />
above graph there are horizontal averages for each of the categories we have discussed to give you an indicative<br />
benchmark as to what is normal. When scanning for companies that may be potential investment opportunities, you<br />
start with the EV per ounce and look for companies that sit significantly below the black line. That is, the company is<br />
trading at an EV per ounce that appears to be below what it should be, given the compilation of its reserves and<br />
resources. <strong>The</strong> next step is to scan up and look at the TCO and NFA for the relevant companies to ensure they are<br />
within or better than the averages (horizontal lines). If they appear to be at satisfactory levels, you may have found an<br />
Volume 1, Issue 4, 5 June 2006<br />
© <strong>The</strong> <strong>Global</strong> <strong>Speculator</strong> 10
