Lab 1 â Measurements of Frequency - Astro Pas Rochester
Lab 1 â Measurements of Frequency - Astro Pas Rochester
Lab 1 â Measurements of Frequency - Astro Pas Rochester

You also want an ePaper? Increase the reach of your titles
YUMPU automatically turns print PDFs into web optimized ePapers that Google loves.
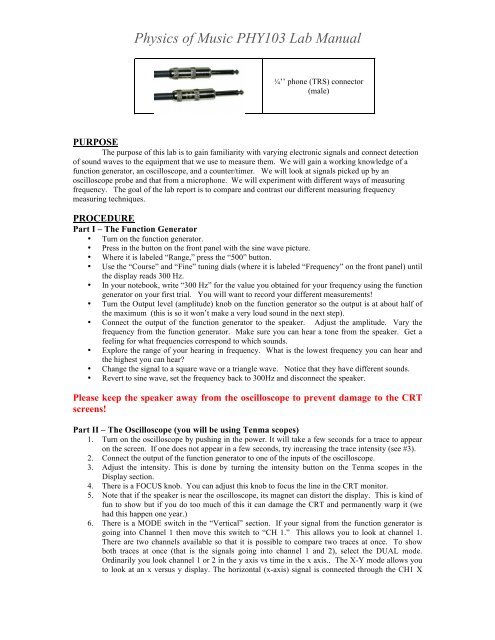
Physics <strong>of</strong> Music PHY103 <strong>Lab</strong> Manual<br />
¼’’ phone (TRS) connector<br />
(male)<br />
PURPOSE<br />
The purpose <strong>of</strong> this lab is to gain familiarity with varying electronic signals and connect detection<br />
<strong>of</strong> sound waves to the equipment that we use to measure them. We will gain a working knowledge <strong>of</strong> a<br />
function generator, an oscilloscope, and a counter/timer. We will look at signals picked up by an<br />
oscilloscope probe and that from a microphone. We will experiment with different ways <strong>of</strong> measuring<br />
frequency. The goal <strong>of</strong> the lab report is to compare and contrast our different measuring frequency<br />
measuring techniques.<br />
PROCEDURE<br />
Part I – The Function Generator<br />
• Turn on the function generator.<br />
• Press in the button on the front panel with the sine wave picture.<br />
• Where it is labeled “Range,” press the “500” button.<br />
• Use the “Course” and “Fine” tuning dials (where it is labeled “<strong>Frequency</strong>” on the front panel) until<br />
the display reads 300 Hz.<br />
• In your notebook, write “300 Hz” for the value you obtained for your frequency using the function<br />
generator on your first trial. You will want to record your different measurements!<br />
• Turn the Output level (amplitude) knob on the function generator so the output is at about half <strong>of</strong><br />
the maximum (this is so it won’t make a very loud sound in the next step).<br />
• Connect the output <strong>of</strong> the function generator to the speaker. Adjust the amplitude. Vary the<br />
frequency from the function generator. Make sure you can hear a tone from the speaker. Get a<br />
feeling for what frequencies correspond to which sounds.<br />
• Explore the range <strong>of</strong> your hearing in frequency. What is the lowest frequency you can hear and<br />
the highest you can hear?<br />
• Change the signal to a square wave or a triangle wave. Notice that they have different sounds.<br />
• Revert to sine wave, set the frequency back to 300Hz and disconnect the speaker.<br />
Please keep the speaker away from the oscilloscope to prevent damage to the CRT<br />
screens!<br />
Part II – The Oscilloscope (you will be using Tenma scopes)<br />
1. Turn on the oscilloscope by pushing in the power. It will take a few seconds for a trace to appear<br />
on the screen. If one does not appear in a few seconds, try increasing the trace intensity (see #3).<br />
2. Connect the output <strong>of</strong> the function generator to one <strong>of</strong> the inputs <strong>of</strong> the oscilloscope.<br />
3. Adjust the intensity. This is done by turning the intensity button on the Tenma scopes in the<br />
Display section.<br />
4. There is a FOCUS knob. You can adjust this knob to focus the line in the CRT monitor.<br />
5. Note that if the speaker is near the oscilloscope, its magnet can distort the display. This is kind <strong>of</strong><br />
fun to show but if you do too much <strong>of</strong> this it can damage the CRT and permanently warp it (we<br />
had this happen one year.)<br />
6. There is a MODE switch in the “Vertical” section. If your signal from the function generator is<br />
going into Channel 1 then move this switch to “CH 1.” This allows you to look at channel 1.<br />
There are two channels available so that it is possible to compare two traces at once. To show<br />
both traces at once (that is the signals going into channel 1 and 2), select the DUAL mode.<br />
Ordinarily you look channel 1 or 2 in the y axis vs time in the x axis.. The X-Y mode allows you<br />
to look at an x versus y display. The horizontal (x-axis) signal is connected through the CH1 X