Lab 1 â Measurements of Frequency - Astro Pas Rochester
Lab 1 â Measurements of Frequency - Astro Pas Rochester
Lab 1 â Measurements of Frequency - Astro Pas Rochester

Create successful ePaper yourself
Turn your PDF publications into a flip-book with our unique Google optimized e-Paper software.
Physics <strong>of</strong> Music PHY103 <strong>Lab</strong> Manual<br />
<strong>Lab</strong> 1 – <strong>Measurements</strong> <strong>of</strong> <strong>Frequency</strong><br />
EQUIPMENT and PREPARATION<br />
Part A:<br />
• Oscilloscopes (get 5 from teaching lab)<br />
• BK Precision function generators (get 5 from Thang or teaching lab)<br />
• Counter/timers (PASCO, 4 + 1 other)<br />
• Connectors and cables (BNC to BNC’s, banana plug pairs) connecting function/signal generators to<br />
oscilloscopes and speaker.<br />
• BNC to 2 leads<br />
• Adaptors: mike to BNC so that output <strong>of</strong> preamps can be looked at on oscilloscope.<br />
• BNC to banana adapters<br />
• BNC T- adapters<br />
• Oscilloscope probes<br />
• <strong>Pas</strong>co open speakers<br />
• Microphones, preamps, mic stands<br />
• Strobes (3) optional<br />
Warning: do not place speakers near oscilloscope screens as they can damage the<br />
CRT (cathode ray tube) screens.<br />
Note: The pr<strong>of</strong>essor will attempt to have the equipment out and available for the labs. However the<br />
TAs/TIs should check that the equipment is ready to use, that every lab setup has all the necessary<br />
equipment. The TA/TIs should also be familiar with the lab and know how to troubleshoot the equipment.<br />
INTRODUCTION<br />
In this lab, we will be measuring the frequency <strong>of</strong> a signal using three different methods. The first<br />
method involves the use <strong>of</strong> the function generator. A function generator is an instrument that can produce<br />
sine, square, and triangular waves at a given frequency. The second method makes use <strong>of</strong> the oscilloscope.<br />
An oscilloscope is an instrument principally used to display signals as a function <strong>of</strong> time. The final method<br />
for measuring the frequency uses the counter/timer. A counter/timer is an instrument that can give a very<br />
accurate measurement <strong>of</strong> the frequency <strong>of</strong> a signal by counting each time a voltage crosses a particular<br />
value.<br />
The frequency, f, and period, T, <strong>of</strong> a wave are related in the following way:<br />
f<br />
= 1 (Equation 1)<br />
T<br />
For frequency in Hz (cycles per second), the period is given in seconds. This equation makes<br />
sense because the frequency is the number <strong>of</strong> cycles that fits into 1 second (fT=1).<br />
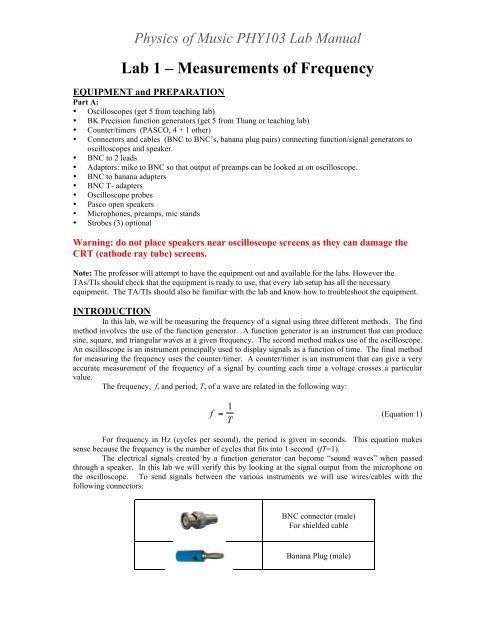
The electrical signals created by a function generator can become “sound waves” when passed<br />
through a speaker. In this lab we will verify this by looking at the signal output from the microphone on<br />
the oscilloscope. To send signals between the various instruments we will use wires/cables with the<br />
following connectors:<br />
BNC connector (male)<br />
For shielded cable<br />
Banana Plug (male)
Physics <strong>of</strong> Music PHY103 <strong>Lab</strong> Manual<br />
¼’’ phone (TRS) connector<br />
(male)<br />
PURPOSE<br />
The purpose <strong>of</strong> this lab is to gain familiarity with varying electronic signals and connect detection<br />
<strong>of</strong> sound waves to the equipment that we use to measure them. We will gain a working knowledge <strong>of</strong> a<br />
function generator, an oscilloscope, and a counter/timer. We will look at signals picked up by an<br />
oscilloscope probe and that from a microphone. We will experiment with different ways <strong>of</strong> measuring<br />
frequency. The goal <strong>of</strong> the lab report is to compare and contrast our different measuring frequency<br />
measuring techniques.<br />
PROCEDURE<br />
Part I – The Function Generator<br />
• Turn on the function generator.<br />
• Press in the button on the front panel with the sine wave picture.<br />
• Where it is labeled “Range,” press the “500” button.<br />
• Use the “Course” and “Fine” tuning dials (where it is labeled “<strong>Frequency</strong>” on the front panel) until<br />
the display reads 300 Hz.<br />
• In your notebook, write “300 Hz” for the value you obtained for your frequency using the function<br />
generator on your first trial. You will want to record your different measurements!<br />
• Turn the Output level (amplitude) knob on the function generator so the output is at about half <strong>of</strong><br />
the maximum (this is so it won’t make a very loud sound in the next step).<br />
• Connect the output <strong>of</strong> the function generator to the speaker. Adjust the amplitude. Vary the<br />
frequency from the function generator. Make sure you can hear a tone from the speaker. Get a<br />
feeling for what frequencies correspond to which sounds.<br />
• Explore the range <strong>of</strong> your hearing in frequency. What is the lowest frequency you can hear and<br />
the highest you can hear?<br />
• Change the signal to a square wave or a triangle wave. Notice that they have different sounds.<br />
• Revert to sine wave, set the frequency back to 300Hz and disconnect the speaker.<br />
Please keep the speaker away from the oscilloscope to prevent damage to the CRT<br />
screens!<br />
Part II – The Oscilloscope (you will be using Tenma scopes)<br />
1. Turn on the oscilloscope by pushing in the power. It will take a few seconds for a trace to appear<br />
on the screen. If one does not appear in a few seconds, try increasing the trace intensity (see #3).<br />
2. Connect the output <strong>of</strong> the function generator to one <strong>of</strong> the inputs <strong>of</strong> the oscilloscope.<br />
3. Adjust the intensity. This is done by turning the intensity button on the Tenma scopes in the<br />
Display section.<br />
4. There is a FOCUS knob. You can adjust this knob to focus the line in the CRT monitor.<br />
5. Note that if the speaker is near the oscilloscope, its magnet can distort the display. This is kind <strong>of</strong><br />
fun to show but if you do too much <strong>of</strong> this it can damage the CRT and permanently warp it (we<br />
had this happen one year.)<br />
6. There is a MODE switch in the “Vertical” section. If your signal from the function generator is<br />
going into Channel 1 then move this switch to “CH 1.” This allows you to look at channel 1.<br />
There are two channels available so that it is possible to compare two traces at once. To show<br />
both traces at once (that is the signals going into channel 1 and 2), select the DUAL mode.<br />
Ordinarily you look channel 1 or 2 in the y axis vs time in the x axis.. The X-Y mode allows you<br />
to look at an x versus y display. The horizontal (x-axis) signal is connected through the CH1 X
Physics <strong>of</strong> Music PHY103 <strong>Lab</strong> Manual<br />
input connector and the vertical (y-axis) signal is connected through the CH2 Y input connector.<br />
The ADD mode allows two traces to be added together. If your signal is going into Channel 2<br />
then you would make sure that the MODE switch is either on “CH2” or on “Dual”.<br />
7. There is a SOURCE switch in the “Trigger” section. Make sure this switch is on “CH1.” (if your<br />
signal from the function generator is in Channel 1) or on “CH2” (if your signal is going in<br />
Channel 2).<br />
8. Using the CH1 Y shift control (the vertical arrows) in the “Vertical” section to make sure that the<br />
trace is in the middle <strong>of</strong> the screen vertically.<br />
9. Using the X shift control (the horizontal arrows) in the “Horizontal” section, make sure that the<br />
trace is in the middle <strong>of</strong> the screen horizontally.<br />
10. Turn the VARIABLE knob, in the “Horizontal” section, clockwise to the CAL position. If this is<br />
not done you might measure incorrect times.<br />
11. In the “Vertical” section, there is a GND (ground) button. Make sure that this button is sticking<br />
out (i.e. not pushed in). This will keep the signal from being grounded or shorted out. On other<br />
Tenma scopes you must select either GND, AC (alternating) or DC (direct current). Make sure<br />
GND is NOT selected. If GND is selected you will not be able to see your signal (but you can<br />
center the signal and make sure you know where 0Volts is).<br />
12. If the waveform on your screen is not stationary, adjust the LEVEL knob in the “Trigger” section.<br />
When the waveform is not stationary it is said to be “free-running”. If your signal is not stationary<br />
then the TRIGGER may not be adjusted properly or you make have selected the wrong channel for<br />
the trigger.<br />
13. The CH1 dial contains an inner and outer dial. Make sure the inner dial is pushed in and set all<br />
the way clockwise to CAL. This way the voltage read from the screen can be converted into<br />
Volts. Otherwise the voltage read from the screen in boxes will not correspond to that chosen<br />
from the voltage knob in Volts.<br />
14. The TIME/CM or TIME/DIV knob in the “Horizontal” section specifies how long it takes for the<br />
trace to sweep through a centimeter box on the oscilloscope screen. Adjust the TIME/CM or<br />
TIME/DIV knob so you can see about one or two full cycles on the monitor.<br />
15. The VOLTS/CM or VOLTS/DIV knob in the “Vertical” section determines how tall the signal<br />
will be on the screen. Adjust the VOLTS/DIV knob for channel 1 to obtain a waveform that fills<br />
almost all <strong>of</strong> the screen vertically.<br />
16. Re-adjust the INTENSITY and FOCUS knobs to get a clear trace.<br />
17. At this point you should have a stationary waveform positioned nicely on your screen. If this is<br />
not the case, ask for some help from the instructor.<br />
18. Count the number <strong>of</strong> squares in one period <strong>of</strong> the wave (peak to peak). Record this number in<br />
your notes. Remember that each square is 1 cm by 1 cm.<br />
19. Multiply this number by the value that the TIME/CM knob is set to. Make sure to convert the<br />
value that the TIME/CM knob is set at into seconds per centimeter. For example, 0.2 ms/cm =<br />
.0002 s/cm. The number that you have just calculated is the period <strong>of</strong> the signal in seconds.<br />
Record this value in your notes.<br />
20. Determine the frequency <strong>of</strong> the signal using equation (1).<br />
21. In your lab notebook, write the value you obtained where it asks for the value <strong>of</strong> your frequency<br />
using the oscilloscope on your first trial.<br />
22. Error estimation: Suppose you mis-measure by 1/5 box on the screen. Redo your calculation.<br />
Compare this frequency to the one that you calculated in #20. The difference can be an estimate<br />
<strong>of</strong> the error or your uncertainty <strong>of</strong> your measurement. Record your estimated error (uncertainty) in<br />
your notes.<br />
Part III – The Counter/Timer<br />
1. Turn on the counter (switch on power supply module on left). A counter toggles every time the<br />
signal crosses a certain level. It can be used to count the number <strong>of</strong> crossings per second.<br />
2. Connect the output <strong>of</strong> the function generator to the counter input area. The black lead from the<br />
generator should go to the GND (ground, black) input. The red lead from the generator should go<br />
to the white or 0.5V p/p MIN lead. This stands for 0.5Volts peak to peak. To get the counter to<br />
trigger the input must go above 0.5Volts peak to peak. Note: there is one counter that is simpler
Physics <strong>of</strong> Music PHY103 <strong>Lab</strong> Manual<br />
than all the rest and connects with BNC and no leads. If you are at this lab set up the counter<br />
should simply show you the frequency in Hz (though I think there is also a reset button).<br />
3. In the counter module flip the black mode switch (up and down switch) to measure frequency<br />
(kHz) (bottom position). Note 1kHz is 1000 Hz.<br />
4. In your notebook, record the value you obtain for the frequency measured by the counter.<br />
5. You can make a more accurate measurement by setting the counter module to counter (middle<br />
position for the black mode switch). The set the counter to 1s (this is the horizontal switch in the<br />
counter section). On the upper right press the START/STOP button. The counter should measure<br />
the number <strong>of</strong> pulses in 1s. To make another measurement, you can press RESET (button on top<br />
left) before you start the counter again. You can do this a number <strong>of</strong> times and compute an<br />
average value.<br />
Part IV – Additional <strong>Measurements</strong><br />
1. Carry out about ten similar trials at different frequencies. For example at 1000 and 5000 Hz or<br />
other frequencies that you might choose. For these additional trials use the three methods<br />
(function generator, counter and oscilloscope) to record or estimate frequencies. In your lab<br />
report you will discuss differences between the frequency measurements and your feelings about<br />
the uncertainties in these measurements.<br />
Part V – Looking at the output <strong>of</strong> the microphone on the oscilloscope.<br />
1. Connect the output <strong>of</strong> the pre-amp into an input <strong>of</strong> the oscilloscope. You will need an adapter<br />
(male BNC to female 1/4” audio) that should be part <strong>of</strong> the equipment on the desk.<br />
2. Make sure that your microphone is connected to the preamp and that the preamp is plugged in.<br />
The green power indicator should light up. The +48V button should be pushed in. This powers<br />
the microphone that employs a capacitor. The capacitor creates an electric field between two<br />
plates. The plates respond to small pressure variations (such as those made by sound waves)<br />
creating a signal that is amplified by the preamp and passed on to the computer. Powered<br />
microphones are usually superior to un-powered ones.<br />
3. Play a sound from the computer speaker or by connecting the function generator to the open<br />
speaker. If you use the function generator you can send that signal into channel 2 <strong>of</strong> the<br />
oscilloscope and display both the signal from the microphone and that from the function generator<br />
together.<br />
4. Compare the output <strong>of</strong> the preamp (fed by the microphone) to the signal from the function<br />
generator. You can adjust the strength <strong>of</strong> the microphone output with the dials on the preamp.<br />
This signal should be stronger than that you will see by using the speaker as a microphone in the<br />
next lab.<br />
5. Try singing or speaking into the microphone while looking at the signal on the oscilloscope. Can<br />
you sing notes that cause the microphone signal to be a periodic signal even with the speaker on?<br />
(Pure intervals such as octaves or fifths or thirds?)<br />
Part VI – Your body as a conductor and Antenna.<br />
1. Remove the BNC cable from the CH1 input. Plug in the oscilloscope probe into CH 1.<br />
2. Touch the end <strong>of</strong> the oscilloscope with your finger.<br />
3. Adjust the Ch 1 VOLTS knob so that you can see a signal. While your body is a pretty good<br />
antenna, you don’t actually pick up a large voltage. You can use the oscilloscope to look at very<br />
small voltages and you will need to do so to see a signal.<br />
4. Adjust the TIME/CM knob to very small time intervals. You should see a lot <strong>of</strong> high frequency<br />
noise.<br />
5. Adjust the TIME/CM knob to larger time intervals. Look for a sine wave pattern in the noise.<br />
Your body is picking up a pretty strong low frequency signal. What is this frequency coming<br />
from? Measure its frequency to see if the frequency itself gives you a clue. Hint given at the end<br />
<strong>of</strong> the lab. *
Physics <strong>of</strong> Music PHY103 <strong>Lab</strong> Manual<br />
DATA ANALYSIS (<strong>Lab</strong> Report)<br />
1. Create a data table showing your measured frequencies. Explain where each row <strong>of</strong> numbers<br />
comes from and how you measured or calculated each.<br />
2. Remember to define symbols (and possibly units <strong>of</strong> quantities) in your table and if you give<br />
equations.<br />
3. Refer to the table in your text. For example: “Column 2 <strong>of</strong> Table 1 lists frequency measurements<br />
based on the oscilloscope and calculated with the equation f=1/T and using the procedure<br />
described above. Column 3 <strong>of</strong> Table 1 lists frequencies measured with the counter.”<br />
4. Mention your table in your discussion. Assume your reader is incapable <strong>of</strong> seeing the numbers in<br />
the table without them being pointed out. For example: “Comparison <strong>of</strong> Column 1 and 3 shows<br />
that the counter and frequency generator measured the same frequencies to an accuracy <strong>of</strong> 1Hz.<br />
The difference between Columns 1,2 and 1,3 in Table 1 suggests that the frequency measurements<br />
errors from the oscilloscope are the largest.”<br />
5. Look for and mention trends (or lack <strong>of</strong> them). Are the oscilloscope measurements systematically<br />
high or low compared to the settings <strong>of</strong> the function generator and counter/timer? Are the<br />
differences larger than you expect?<br />
6. Estimate the sizes <strong>of</strong> your errors or uncertainties. The difference between two measured<br />
frequencies would be a Δf in Hz. You could also compute Δf/f which would give you the error as<br />
a fraction <strong>of</strong> the signal. It might make sense to discuss errors for the oscilloscope in terms <strong>of</strong> a<br />
fraction or Δf/f and for the counter in terms <strong>of</strong> Δf or an absolute difference in Hz.<br />
7. Are the errors larger or smaller at high frequencies than low frequencies?<br />
8. In this lab your discussion <strong>of</strong> data can be used to argue which instruments are most accurate and<br />
estimate how accurate they are. These can be considered “results” and so can go into your<br />
abstract. For example. “We find that the frequency given on the function generator agreed with<br />
that measured by the counter, with differences between the two measurements that were within 2-<br />
4 Hz for signals in the range 100- 1kHz. We infer that these two instruments probably give<br />
accurate frequency measurements with errors less than 2-4Hz. We find that frequencies measured<br />
on the oscilloscope were consistent with the other measurements but tended to differ from the<br />
other measurements by a larger number or ~10Hz. We find that the counter made more reliable<br />
measurements <strong>of</strong> frequency than the oscilloscope. Noise picked up on the oscilloscope probe<br />
contained a strong signal with frequency approximately 60Hz and so was likely associated with<br />
AC power.”<br />
A note on error analysis: Sometimes scientists are under the impression that error analysis must be<br />
done in order to achieve a type <strong>of</strong> pr<strong>of</strong>essionalism. However error analysis requires work and in order<br />
to accomplish more one must figure out where and when it is important to do this work. If<br />
experimental errors are not significantly affecting your measurements then it is silly to spend a lot <strong>of</strong><br />
time analyzing them (your time is too valuable!). Errors are a problem if they are significantly<br />
affecting your measurements. For example, in your report you might want to argue that experimental<br />
errors are not affecting or invalidating your major findings. As part <strong>of</strong> this argument you could<br />
demonstrate understanding and estimates <strong>of</strong> the size <strong>of</strong> the errors. These estimates might then be used<br />
to show that the errors wouldn’t significantly change your measurements or invalidate the major results<br />
<strong>of</strong> your experiment. Errors are a part <strong>of</strong> any experiment. Sometimes your analysis suggests a trend or<br />
gives you a measurement that might not be certain. In this case you should discuss the uncertainties<br />
in your results and how they might be affecting your measurement or trend. Your conclusion would<br />
give a summary <strong>of</strong> your trend or measurement and then would explain the problems with the<br />
measurements. You could also suggest future ways (if any) <strong>of</strong> improving your experiments to validate<br />
(with better data) the results <strong>of</strong> your study.<br />
QUESTIONS and DISCUSSION<br />
1. Did you measure the same frequencies with different measurement techniques? Why or why not?
Physics <strong>of</strong> Music PHY103 <strong>Lab</strong> Manual<br />
2. If you measured the frequency with both oscilloscope and counter, which method did you find<br />
most accurate? How could you tell it was the most accurate? Can the counter measure fractional<br />
frequencies? Is it more accurate at low or high frequencies?<br />
3. About how accurately can you measure the frequency with the oscilloscope and counter? (to what<br />
% or what difference in Hz?). Is the accuracy <strong>of</strong> your measurements higher or lower at low<br />
frequencies than high frequencies?<br />
4. Discuss trends or lack <strong>of</strong> them. You may find it easier to illustrate trends by making a figure<br />
plotting the measurements from each instrument or by referring to lists <strong>of</strong> numbers in a data table.<br />
5. Is the difference between the frequency you measure on your body and 60Hz from AC power<br />
within your estimated errors? If the difference is less than the error then your measurement is<br />
consistent with 60Hz and so the frequency you measure on your body is likely to be ``consistent<br />
with’’ 60Hz. If the difference is greater than your estimated error then it is possible you are<br />
measuring something else (and so would be ``inconsistent with’’ 60Hz).<br />
6. Is it possible to use the counter to measure the frequency you picked up on the oscilloscope probe?<br />
(We used the oscilloscope to look at this signal but found that the counters were pretty accurate ---<br />
so why didn’t we use the counter to measure that frequency?)<br />
MINIMAL REQUIREMENTS FOR THIS LAB REPORT<br />
• Your name, lab group and collaborators.<br />
• A clear abstract at the top stating what your major findings are. For this report you should<br />
have an opinion about which types <strong>of</strong> measurements for frequency are most accurate.<br />
• A clearly labeled data table showing your measurements <strong>of</strong> frequencies that is used to support<br />
your findings.<br />
• Additional discussion based on the questions above.<br />
A good lab report would in its body provide evidence that clearly supports the findings summarized in<br />
the abstract. For this lab, a good lab report would have a clear description <strong>of</strong> how errors in measurements<br />
are estimated. It is likely that the most accurate measurements are those with the smallest errors. A good<br />
lab report would in words have discussion comparing columns <strong>of</strong> data in the table. A good lab report<br />
would compare the difference between the frequency you measure with the oscilloscope probe and 60 Hz<br />
with an error estimated for frequency measurements. This difference would then be used to argue that you<br />
did or did not measure 60Hz. If you measured something consistent with 60 Hz (by consistent we mean<br />
near or within your estimated error) then it is likely the signal was associated with AC power.<br />
Note: A good lab report clearly presents data and discussion that are used to support the summarized results<br />
in the abstract --- even if these results are surprising. Contradictory data should be mentioned and<br />
discussed rather than hidden. There is no shame is reporting contradictory or surprising experiments. If<br />
you suspect your measurements are spurious then you can add discussion speculating about what might<br />
have gone wrong in your experiment. It should be possible to get full credit on a lab report even if your<br />
experiment fails. *<br />
*<br />
Electric power in the United States is in the form <strong>of</strong> alternating current (AC). The voltage on an<br />
electric outlet looks like a sine wave (is alternating) with a frequency <strong>of</strong> 60Hz. The amplitude <strong>of</strong> the<br />
voltage oscillation is approximately 110 Volts. The standard for most <strong>of</strong> North, Central, and South<br />
America and the Caribbean is 60Hz and 120V AC. The standard for much <strong>of</strong> the rest <strong>of</strong> the world is<br />
50Hz and 220V AC. Your body, because it is full <strong>of</strong> electrolytes, conducts electricity and can act as<br />
an antenna. The ground level seen by the oscilloscope may differ from the voltage <strong>of</strong> your body. If<br />
you touch one hand to the tip <strong>of</strong> the probe and the other hand to the ground <strong>of</strong> the probe you will still<br />
see the 60 Hz signal but it will be weaker. 60 Hz noise is <strong>of</strong>ten a problem in electronic equipment.<br />
You may have heard an undesirable “60 Hz Hum” on a speaker system or electric guitar and we might<br />
pick it up when recording sounds later in the term (hence bringing this to your attention now). There<br />
are a variety <strong>of</strong> ways to get rid <strong>of</strong> 60 Hz noise, including the use <strong>of</strong> shielded (such as BNC) or twisted<br />
cables, humbucker pickups and well grounded instrument housings.