WINNER II pdf - Final Report - Cept
WINNER II pdf - Final Report - Cept
WINNER II pdf - Final Report - Cept

Create successful ePaper yourself
Turn your PDF publications into a flip-book with our unique Google optimized e-Paper software.
<strong>WINNER</strong> <strong>II</strong> D1.1.2 V1.1<br />
Table 6-10 Clustered delay-line model for Scenario C1 NLOS<br />
Cluster # Delay [ns] Power [dB] AoD [º] AoA [º] Ray power [dB]<br />
1 0 5 10 -3.0 -5.2 -7.0 0 0 -13.0<br />
2 25 -7.5 13 -71 -20.5<br />
3 35 -10.5 -15 -84 -23.5<br />
4 35 -3.2 -8 46 -16.2<br />
5 45 50 55 -6.1 -8.3 -10.1 12 -66 -16.1<br />
6 65 -14.0 -17 -97 -27.0<br />
7 65 -6.4 12 -66 -19.4<br />
8 75 -3.1 -8 -46 -16.1<br />
9 145 -4.6 -10 -56 -17.6<br />
10 160 -8.0 -13 73 -21.0<br />
11 195 -7.2 12 70 -20.2<br />
12 200 -3.1 8 -46 -16.1<br />
13 205 -9.5 14 -80 -22.5<br />
14 770 -22.4 22 123 -35.4<br />
Cluster ASD = 2º<br />
Cluster ASA = 10º<br />
XPR = 4 dB<br />
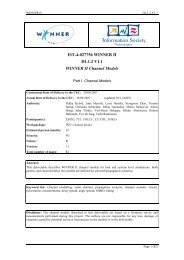
Figure 6-10: PDP and frequency correlation (FCF) of CDL model.<br />
6.7 C2 – Urban macro-cell<br />
The CDL parameters of LOS and NLOS condition are given below. In the LOS model Ricean K-factor is<br />
7.0 dB.<br />
Table 6-11 Scenario C2: LOS Clustered delay line model.<br />
Cluster # Delay [ns] Power [dB] AoD [º] AoA [º] Ray power [dB]<br />
1 0 0.0 0 0 -0.08 * -30.6 **<br />
2 0 5 10 -16.2 -18.4 -20.2 -24 -120 -26.2<br />
3 30 -15.3 26 129 -28.3<br />
4 85 -16.7 -27 -135 -29.7<br />
5 145 150 155 -18.2 -20.4 -22.2 26 -129 -28.2<br />
6 150 -18.2 28 141 -31.2<br />
7 160 -15.3 26 -129 -28.3<br />
8 220 -23.1 -32 -158 -36.1<br />
Cluster ASD = 6º<br />
Cluster ASA = 12º<br />
XPR = 8 dB<br />
* Power of dominant ray,<br />
** Power of each other ray<br />
Page 67 (82)