WINNER II pdf - Final Report - Cept
WINNER II pdf - Final Report - Cept
WINNER II pdf - Final Report - Cept

You also want an ePaper? Increase the reach of your titles
YUMPU automatically turns print PDFs into web optimized ePapers that Google loves.
<strong>WINNER</strong> <strong>II</strong> D1.1.2 V1.1<br />
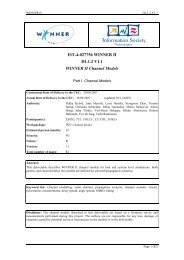
Figure 6-5: PDP and frequency correlation (FCF) of CDL model.<br />
6.4 B2 – Bad Urban micro-cell<br />
Table 6-6 Scenario B2: NLOS Clustered delay line model, bad urban, microcell<br />
Cluster<br />
# Delay [ns] Power [dB]<br />
AoD<br />
[º] AoA [º] Ray power [dB]<br />
1 0 5 10 -3.0 -5.2 -7.0 0 0 -13.0<br />
2 35 -5.4 20 -46 -18.4<br />
3 135 140 145 -5.0 -7.2 -9.0 40 -92 -15.0<br />
4 190 -8.2 25 57 -21.2<br />
5 350 -21.8 40 -92 -34.8<br />
6 425 -25.5 -44 -100 -38.5<br />
7 430 -28.7 -46 -106 -41.7<br />
8 450 -20.8 39 90 -33.8<br />
9 470 -30.7 -48 -110 -43.7<br />
10 570 -34.9 -51 -117 -47.9<br />
11 605 -34.5 -51 -116 -47.5<br />
12 625 -31.5 -48 -111 -44.5<br />
13 625 -35.3 -51 -118 -48.3<br />
14 630 -37.5 53 121 -50.5<br />
15 1600 -5.7 -110 15 -18.7<br />
16 2800 -7.7 75 -25 -20.7<br />
Cluster ASD = 10º<br />
Cluster ASA = 22º<br />
3º 3º<br />
XPR = 8 dB<br />
Figure 6-6: PDP and frequency correlation (FCF) of CDL model.<br />
6.5 B3 – Indoor hotspot<br />
The CDL parameters of LOS and NLOS condition are given below. In the LOS model Ricean K-factor is<br />
2 dB.<br />
Page 64 (82)