

Final report on link level and system level channel models - Winner
Final report on link level and system level channel models - Winner
Final report on link level and system level channel models - Winner

Create successful ePaper yourself
Turn your PDF publications into a flip-book with our unique Google optimized e-Paper software.
WINNER D5.4 v. 1.4<br />
5.4.7.1 Scenario A1<br />
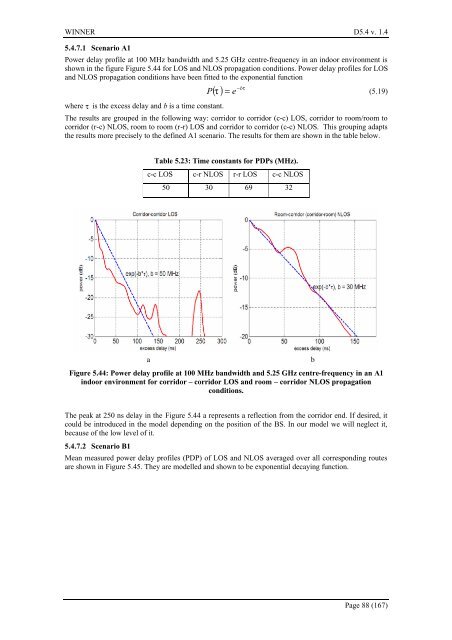
Power delay profile at 100 MHz b<strong>and</strong>width <strong>and</strong> 5.25 GHz centre-frequency in an indoor envir<strong>on</strong>ment is<br />
shown in the figure Figure 5.44 for LOS <strong>and</strong> NLOS propagati<strong>on</strong> c<strong>on</strong>diti<strong>on</strong>s. Power delay profiles for LOS<br />
<strong>and</strong> NLOS propagati<strong>on</strong> c<strong>on</strong>diti<strong>on</strong>s have been fitted to the exp<strong>on</strong>ential functi<strong>on</strong><br />
where τ is the excess delay <strong>and</strong> b is a time c<strong>on</strong>stant.<br />
P<br />
−bτ<br />
( τ ) e<br />
= (5.19)<br />
The results are grouped in the following way: corridor to corridor (c-c) LOS, corridor to room/room to<br />
corridor (r-c) NLOS, room to room (r-r) LOS <strong>and</strong> corridor to corridor (c-c) NLOS. This grouping adapts<br />
the results more precisely to the defined A1 scenario. The results for them are shown in the table below.<br />
Table 5.23: Time c<strong>on</strong>stants for PDPs (MHz).<br />
c-c LOS c-r NLOS r-r LOS c-c NLOS<br />
50 30 69 32<br />
a<br />
Figure 5.44: Power delay profile at 100 MHz b<strong>and</strong>width <strong>and</strong> 5.25 GHz centre-frequency in an A1<br />
indoor envir<strong>on</strong>ment for corridor – corridor LOS <strong>and</strong> room – corridor NLOS propagati<strong>on</strong><br />
c<strong>on</strong>diti<strong>on</strong>s.<br />
b<br />
The peak at 250 ns delay in the Figure 5.44 a represents a reflecti<strong>on</strong> from the corridor end. If desired, it<br />
could be introduced in the model depending <strong>on</strong> the positi<strong>on</strong> of the BS. In our model we will neglect it,<br />
because of the low <strong>level</strong> of it.<br />
5.4.7.2 Scenario B1<br />
Mean measured power delay profiles (PDP) of LOS <strong>and</strong> NLOS averaged over all corresp<strong>on</strong>ding routes<br />
are shown in Figure 5.45. They are modelled <strong>and</strong> shown to be exp<strong>on</strong>ential decaying functi<strong>on</strong>.<br />
Page 88 (167)


