reflection suppression to improve anechoic chamber performance
reflection suppression to improve anechoic chamber performance
reflection suppression to improve anechoic chamber performance

You also want an ePaper? Increase the reach of your titles
YUMPU automatically turns print PDFs into web optimized ePapers that Google loves.
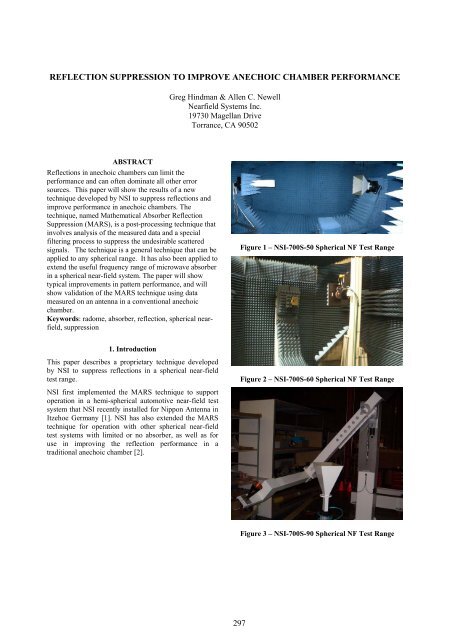
REFLECTION SUPPRESSION TO IMPROVE ANECHOIC CHAMBER PERFORMANCE<br />
Greg Hindman & Allen C. Newell<br />
Nearfield Systems Inc.<br />
19730 Magellan Drive<br />
Torrance, CA 90502<br />
ABSTRACT<br />
Reflections in <strong>anechoic</strong> <strong>chamber</strong>s can limit the<br />
<strong>performance</strong> and can often dominate all other error<br />
sources. This paper will show the results of a new<br />
technique developed by NSI <strong>to</strong> suppress <strong>reflection</strong>s and<br />
<strong>improve</strong> <strong>performance</strong> in <strong>anechoic</strong> <strong>chamber</strong>s. The<br />
technique, named Mathematical Absorber Reflection<br />
Suppression (MARS), is a post-processing technique that<br />
involves analysis of the measured data and a special<br />
filtering process <strong>to</strong> suppress the undesirable scattered<br />
signals. The technique is a general technique that can be<br />
applied <strong>to</strong> any spherical range. It has also been applied <strong>to</strong><br />
extend the useful frequency range of microwave absorber<br />
in a spherical near-field system. The paper will show<br />
typical <strong>improve</strong>ments in pattern <strong>performance</strong>, and will<br />
show validation of the MARS technique using data<br />
measured on an antenna in a conventional <strong>anechoic</strong><br />
<strong>chamber</strong>.<br />
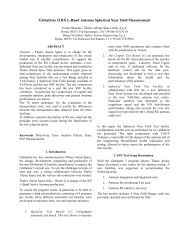
Keywords: radome, absorber, <strong>reflection</strong>, spherical nearfield,<br />
<strong>suppression</strong><br />
Figure 1 – NSI-700S-50 Spherical NF Test Range<br />
1. Introduction<br />
This paper describes a proprietary technique developed<br />
by NSI <strong>to</strong> suppress <strong>reflection</strong>s in a spherical near-field<br />
test range.<br />
Figure 2 – NSI-700S-60 Spherical NF Test Range<br />
NSI first implemented the MARS technique <strong>to</strong> support<br />
operation in a hemi-spherical au<strong>to</strong>motive near-field test<br />
system that NSI recently installed for Nippon Antenna in<br />
Itzehoe Germany [1]. NSI has also extended the MARS<br />
technique for operation with other spherical near-field<br />
test systems with limited or no absorber, as well as for<br />
use in improving the <strong>reflection</strong> <strong>performance</strong> in a<br />
traditional <strong>anechoic</strong> <strong>chamber</strong> [2].<br />
Figure 3 – NSI-700S-90 Spherical NF Test Range<br />
297
2. MARS Description<br />
The purpose of the MARS approach is <strong>to</strong> reduce the<br />
influence of scattering on far-field pattern results. We<br />
use a mathematical post processing technique that<br />
requires a minimum amount of detailed information about<br />
the AUT, probe and antenna range geometry. The<br />
processing is applied during regular near-field <strong>to</strong> far-field<br />
processing. The technique is general enough <strong>to</strong> apply <strong>to</strong><br />
different types of spherical measurement geometries and<br />
<strong>to</strong> different antenna types. NSI has developed a<br />
mathematical opera<strong>to</strong>r that is applied <strong>to</strong> the measured data<br />
that helps <strong>to</strong> distinguish between the correct antenna<br />
properties and scattering. Successful processing requires<br />
more measured data than for the AUT without scattering<br />
for best <strong>performance</strong> - typically requires one half the<br />
spacing in theta and phi than recommended by sampling<br />
criteria. This will usually require about double the test<br />
time, compared <strong>to</strong> normal measurements.<br />
3. Testing antenna in 3 different systems<br />
We will compare test results – patterns, directivity, and<br />
beam-widths from measurements of a NSI-RF-SG284<br />
measured on 3 different spherical NF antenna ranges over<br />
a frequency range of 2.6 <strong>to</strong> 3.95 GHz. The range<br />
configurations are summarized in the table below:<br />
Figure Type Location NSI Scanner Absorber<br />
Figure 4 – NSI-RF-SG284 gain horn tested at NSI on<br />
NSI-700S-90 ARCH Spherical NF in open<br />
environment with NO <strong>anechoic</strong> <strong>chamber</strong> – notice<br />
ripple in pattern at about -25 dB level due <strong>to</strong> range<br />
<strong>reflection</strong>s<br />
#1 Chamber Cus<strong>to</strong>mer NSI-700S-50 12” pyramid<br />
#2 Chamber NSI NSI-700S-60 8” pyramid<br />
#3 Open lab NSI NSI-700S-90 NONE!<br />
All the ranges are running NSI2000 Data acquisition and<br />
processing software, and we used the Agilent PNA for<br />
the RF subsystem. Data in the cus<strong>to</strong>mer facility was<br />
measured using a NSI-RF-WR284 open ended waveguide<br />
probe, and the data in the other two ranges was measured<br />
using an NSI dual-port probe. Range positioner axis<br />
alignment was performed using NSI’s electrical<br />
alignment technique documented in [3] [4] [5].<br />
Figures 4 shows the near-field measured data of the SGH<br />
on the 700S-90 arch range with no absorber or <strong>chamber</strong>,<br />
using NSI’s 3-D field viewer. One can easily see the<br />
ripple in the 3-D display and pattern cuts at about the -25<br />
dB level due <strong>to</strong> range <strong>reflection</strong>s. In figure 5, we show<br />
the result in NSI-s 700S-60 scanner in the <strong>anechoic</strong><br />
<strong>chamber</strong> at NSI, and the reduced <strong>reflection</strong>s are apparent.<br />
Figure 5 – NSI-RF-SG284 gain horn tested at NSI on<br />
NSI-700S-60 Spherical NF in <strong>chamber</strong><br />
298
4. MARS Far-field Pattern Results<br />
Figure 6 shows the far-field calculated pattern of the SGH<br />
on the NSI-700S-90 scanner with no absorber or <strong>chamber</strong><br />
at 3.15 GHz.<br />
MARS processing yields the result in figure 7. Clear<br />
<strong>improve</strong>ment in the main beam pattern shape due <strong>to</strong><br />
reduction of the effects of the <strong>reflection</strong>s is seen.<br />
Figure 6 – NSI-RF-SG284 Standard Gain Horn tested<br />
on NSI-700S-90 scanner with no absorber or <strong>chamber</strong><br />
– MARS correction OFF<br />
Figure 7 – NSI-RF-SG284 Standard Gain Horn tested<br />
on NSI-700S-90 scanner with no absorber or <strong>chamber</strong><br />
– MARS correction enabled<br />
299
The same type of SGH was tested with our 700S-50<br />
scanner in a cus<strong>to</strong>mer <strong>chamber</strong> with 12” pyramidal<br />
absorber, and on the NSI-700S-60 scanner at NSI with 8”<br />
pyramidal absorber. A comparison between the results<br />
in the two <strong>chamber</strong>s shows a -34 dB error level (figure 8)<br />
Amplitude (dB)<br />
0<br />
-5<br />
-10<br />
-15<br />
-20<br />
-25<br />
-30<br />
-35<br />
-40<br />
-45<br />
-50<br />
Far-field amplitude of NSI-RF-SG284.nsi - Far-field amplitude of NSI-RF-SG284_700S-60_017.nsi<br />
3.2 GHz<br />
700S-50 in <strong>chamber</strong> 1 700S-60 in <strong>chamber</strong> 2<br />
Plot 1 - Plot 2<br />
-75 -50 -25 0 25 50 75<br />
Azimuth (deg)<br />
Figure 8 – Far-field comparison at 3.2 GHz of SGH<br />
data taken in NSI <strong>chamber</strong> vs. cus<strong>to</strong>mer <strong>chamber</strong><br />
Far-field amplitude of NSI-RF-SG284_700S-60_017.ns i - Far-field amplitude of NSI-RF-SG284_700S-90_021.ns i<br />
3.2 GHz<br />
0<br />
-5<br />
-10<br />
700S-60 in <strong>chamber</strong> 700S-90 no <strong>chamber</strong><br />
Plot 1 - Plot 2<br />
Amplitude (dB)<br />
Far-field amplitude of NSI-RF-SG284_700S-60_017.nsi - Far-field amplitude of NSI-RF-SG284_700S-90_021.nsi<br />
3.2 GHz<br />
0<br />
-5<br />
-10<br />
-15<br />
-20<br />
-25<br />
-30<br />
-35<br />
-40<br />
-45<br />
-50<br />
700S-60 in <strong>chamber</strong> 700S-90 no <strong>chamber</strong>, with MARS<br />
Plot 1 - Plot 2<br />
-75 -50 -25 0 25 50 75<br />
Azimuth (deg)<br />
Figure 10 – Far-field comparison at 3.20 GHz of SGH<br />
data taken in <strong>chamber</strong> versus on 700S-90 ARCH<br />
range with no absorber or <strong>chamber</strong>, with MARS<br />
correction enabled<br />
Measuring the SGH in the open lab environment of the<br />
700S-90 scanner with no absorber or <strong>chamber</strong>, yields<br />
quite a different result as shown in figure 9. Here the<br />
unsuppressed <strong>reflection</strong>s give rise <strong>to</strong> only about a -21 dB<br />
error level from a comparison <strong>to</strong> the <strong>chamber</strong> data.<br />
However, using the MARS <strong>suppression</strong> technique shows<br />
the result in figure 10, where the error level has been<br />
suppressed back <strong>to</strong> about -33 dB – almost as good as the<br />
comparison between the two <strong>anechoic</strong> <strong>chamber</strong>s. Thus<br />
we can conclude that the MARS <strong>suppression</strong> gives about<br />
a 12 dB <strong>improve</strong>ment in <strong>chamber</strong> <strong>performance</strong>.<br />
-15<br />
Amplitude (dB)<br />
-20<br />
-25<br />
-30<br />
-35<br />
-40<br />
-45<br />
-50<br />
-75 -50 -25 0 25 50 75<br />
Azimuth (deg)<br />
Figure 9 – Far-field comparison at 3.20 GHz of SGH<br />
data taken in <strong>chamber</strong> versus on 700S-90 ARCH<br />
range with no absorber or <strong>chamber</strong>, with no MARS<br />
correction<br />
300
5. MARS Directivity Results<br />
To check the <strong>performance</strong> over a broader frequency<br />
range, we can use the multi-frequency data on the SGH <strong>to</strong><br />
calculate the directivity <strong>performance</strong> versus the NRL<br />
directivity calculations with and without the MARS<br />
processing. Figure 11 and 12 show this result. The<br />
maximum difference from the NRL curve with MARS off<br />
is about 1.7 dB, whereas when the MARS processing is<br />
applied, the large discrepancies disappear and the<br />
maximum difference drops <strong>to</strong> only about 0.5 dB.<br />
Directivity vs. Frequency of c:\i-drive\nsi97\data\AMTA 2005 MARS\NSI-RF-SG284_700S-90_021.nsi<br />
700S-90 SNF - no MARS correction - Worst-case difference 1.67 dB; average 0.54 dB<br />
Figures 13 and 14 show the results in the two <strong>anechoic</strong><br />
<strong>chamber</strong>s. The table below summarizes the 4 plots.<br />
Scanner Chamber Max diff.<br />
(dB)<br />
Ave diff.<br />
(dB)<br />
700S-90 No - MARS off 1.67 0.54<br />
700S-90 No - MARS ON 0.57 0.32<br />
700S-50 Yes 0.45 0.26<br />
700S-60 Yes 0.37 0.17<br />
Directivity vs. Frequency of C:\NSI2000\Data\SGH\NSI-RF-SG284.nsi<br />
700S-50 SNF in <strong>chamber</strong> - no MARS correction - Worst-case difference 0.45 dB; average 0.26 dB<br />
21.0<br />
Measured Directivity<br />
NRL Gain Calculation<br />
21.0<br />
Measured Directivity<br />
NRL Gain Calculation<br />
20.5<br />
20.5<br />
20.0<br />
20.0<br />
19.5<br />
19.5<br />
Directivity(dBi)<br />
19.0<br />
18.5<br />
18.0<br />
Directivity(dBi)<br />
19.0<br />
18.5<br />
18.0<br />
17.5<br />
17.5<br />
17.0<br />
17.0<br />
16.5<br />
16.5<br />
16.0<br />
2.75 3.00 3.25 3.50 3.75<br />
Frequency (GHz)<br />
Figure 11 – Directivity vs. frequency on 700S-90<br />
ARCH range with no absorber or <strong>chamber</strong>, compared<br />
<strong>to</strong> NRL directivity, with no MARS correction<br />
Directivity vs. Frequency of c:\i-drive\nsi97\data\AMTA 2005 MARS\NSI-RF-SG284_700S-90_021.nsi<br />
700S-90 SNF - MARS correction ON - Worst-case difference 0.57 dB; average 0.32 dB<br />
16.0<br />
2.6 2.7 2.8 2.9 3.0 3.1 3.2 3.3 3.4 3.5 3.6 3.7 3.8 3.9<br />
Frequency (GHz)<br />
Figure 13 – Directivity vs. frequency on 700S-50 in<br />
<strong>chamber</strong> at cus<strong>to</strong>mer site, compared <strong>to</strong> NRL<br />
directivity (only 14 frequencies)<br />
Directivity vs. Frequency of C:\i-drive\nsi97\data\AMTA 2005 MARS\NSI-RF-SG284_700S-60_017.nsi<br />
Worst-case difference 0.37 dB; average 0.17 dB<br />
21.0<br />
Measured Directivity<br />
NRL Gain Calculation<br />
21.0<br />
Measured Directivity<br />
NRL Gain Calculation<br />
20.5<br />
20.5<br />
20.0<br />
20.0<br />
19.5<br />
19.5<br />
Directivity(dBi)<br />
19.0<br />
18.5<br />
18.0<br />
17.5<br />
17.0<br />
16.5<br />
Directivity(dBi)<br />
19.0<br />
18.5<br />
18.0<br />
17.5<br />
17.0<br />
16.5<br />
16.0<br />
2.75 3.00 3.25 3.50 3.75<br />
Frequency (GHz)<br />
Figure 12 –Directivity versus frequency on 700S-90<br />
ARCH range with no absorber or <strong>chamber</strong>, compared<br />
<strong>to</strong> NRL directivity, with MARS correction<br />
16.0<br />
2.75 3.00 3.25 3.50 3.75<br />
Frequency (GHz)<br />
Figure 14 – Directivity vs. frequency on 700S-60 in<br />
<strong>chamber</strong> at NSI, compared <strong>to</strong> NRL directivity<br />
301
6. MARS Beamwidth Results<br />
Figures 15 and 16 show the beamwidth result for the two<br />
<strong>chamber</strong>s and the results are quite similar as expected.<br />
Figure 17 shows the poor results for the 700S-90 range<br />
with no absorber or <strong>chamber</strong>. Figure 18 shows the<br />
<strong>improve</strong>d results using the MARS <strong>suppression</strong>.<br />
Beamwidth (deg)<br />
Beamwidth vs. Frequency<br />
45<br />
40<br />
35<br />
30<br />
25<br />
20<br />
15<br />
10<br />
5<br />
0<br />
3 dB BW 6 dB BW 10 dB BW<br />
2.6 2.8 3 3.2 3.4 3.6 3.8<br />
Frequency (GHz)<br />
Figure 15 –Beamwidth versus freq - 700S-60 <strong>chamber</strong><br />
Beamwidth (deg)<br />
Beamwidth vs. Frequency<br />
45<br />
40<br />
35<br />
30<br />
25<br />
20<br />
15<br />
10<br />
5<br />
0<br />
3 dB BW 6 dB BW 10 dB BW<br />
2.6 2.8 3 3.2 3.4 3.6 3.8<br />
Frequency (GHz)<br />
Figure 16 –Beamwidth versus freq - 700S-50 <strong>chamber</strong><br />
Beamwidth (deg)<br />
Beamwidth vs. Frequency<br />
45<br />
40<br />
35<br />
30<br />
25<br />
20<br />
15<br />
10<br />
5<br />
0<br />
3 dB BW 6 dB BW 10 dB BW<br />
2.6 2.8 3 3.2 3.4 3.6 3.8<br />
Frequency (GHz)<br />
Figure 17 –Beamwidth versus frequency on 700S-90<br />
scanner – no absorber or <strong>chamber</strong><br />
Beamwidth (deg)<br />
Beamwidth vs. Frequency<br />
45<br />
40<br />
35<br />
30<br />
25<br />
20<br />
15<br />
10<br />
5<br />
0<br />
3 dB BW 6 dB BW 10 dB BW<br />
2.6 2.8 3 3.2 3.4 3.6 3.8<br />
Frequency (GHz)<br />
Figure 18 –Beamwidth versus frequency on 700S-90<br />
scanner – no absorber or <strong>chamber</strong> – WITH MARS<br />
7. Summary<br />
NSI has developed and validated a novel technique <strong>to</strong><br />
suppress <strong>reflection</strong>s on spherical near-field ranges. The<br />
technique is quite general and can be used <strong>to</strong> achieve<br />
acceptable results with use of minimal absorber or even<br />
with no <strong>anechoic</strong> <strong>chamber</strong>. It can also <strong>improve</strong> the<br />
<strong>reflection</strong> levels in a traditional <strong>anechoic</strong> <strong>chamber</strong> by 10<br />
dB or more, allowing <strong>improve</strong>d accuracy as well as the<br />
ability <strong>to</strong> use existing <strong>chamber</strong>s down <strong>to</strong> lower<br />
frequencies than the absorber used might indicate.<br />
8. REFERENCES<br />
[1] Betjes, P., Po<strong>to</strong>tzki, D., van Rensubrg, D.., " A hemispherical<br />
near-field system for au<strong>to</strong>motive antenna<br />
testing", AMTA 27th Annual Meeting & Symposium,<br />
Newport, RI, Oct. 2005.<br />
[2] Hindman, G, Newell, A.C., " Reflection Suppression<br />
in a large spherical near-field range", AMTA 27th Annual<br />
Meeting & Symposium, Newport, RI, Oct. 2005.<br />
[3] Newell, A. C., Hindman, G., "The alignment of a<br />
spherical near-field rota<strong>to</strong>r using electrical<br />
measurements" In the proceedings of the 19th annual<br />
AMTA Meeting and Symposium, Bos<strong>to</strong>n, MA, 1997.<br />
[4] Newell, A. C., Hindman, G., "Quantifying the effect<br />
of position errors in spherical near-field measurements",<br />
In the proceedings of the 20th annual AMTA Meeting<br />
and Symposium, pp 145-149, Montreal, Canada, 1998.<br />
[5] Newell, A.C., "The effect of measurement geometry<br />
on alignment errors in spherical near-field<br />
measurements", AMTA 21st Annual Meeting &<br />
Symposium, Monterey, California, Oct. 1999.<br />
302