Simandou Project - Vale.com
Simandou Project - Vale.com
Simandou Project - Vale.com

Create successful ePaper yourself
Turn your PDF publications into a flip-book with our unique Google optimized e-Paper software.
Roger Agnelli<br />
Chief Executive Officer<br />
The journey to<br />
sustainable<br />
value creation<br />
1<br />
October 18, 2010
Disclaimer<br />
“This presentation may include declarations about <strong>Vale</strong>'s expectations<br />
regarding future events or results. All declarations based upon future<br />
expectations, rather than historical facts, are subject to various risks and<br />
uncertainties. <strong>Vale</strong> cannot guarantee that such declarations will prove to<br />
be correct. These risks and uncertainties include factors related to the<br />
following: (a) the countries where <strong>Vale</strong> operates, mainly Brazil and<br />
Canada; (b) the global economy; (c) capital markets; (d) the mining and<br />
metals businesses and their dependence upon global industrial<br />
production, which is cyclical by nature; and (e) the high degree of global<br />
<strong>com</strong>petition in the markets in which <strong>Vale</strong> operates. To obtain further<br />
information on factors that may give rise to results different from those<br />
forecast by <strong>Vale</strong>, please consult the reports filed with the Brazilian<br />
Comissão de Valores Mobiliários (CVM), the French Autorité des Marchés<br />
Financiers (AMF), and with the U.S. Securities and Exchange Commission<br />
(SEC), including <strong>Vale</strong>’s most recent Annual Report on Form 20F and its<br />
reports on Form 6K.”<br />
2
3<br />
10 th <strong>Vale</strong> listing<br />
anniversary
VALEP started trading on the NYSE on<br />
Tuesday, June 20, 2000¹<br />
40<br />
VALE P<br />
35<br />
30<br />
October 12,<br />
2010<br />
25<br />
US$<br />
20<br />
15<br />
10<br />
5<br />
0<br />
June 2000 20, 2001 2002 2003 2004 2005 2006 2007 2008 2009 2010<br />
2000<br />
4<br />
¹ VALE – the ADR representative of our <strong>com</strong>mon shares - started trading on the NYSE on<br />
Wednesday, March 20, 2002
It has been one of the best investment options.<br />
Each US$ 100,000 invested in VALEP has<br />
grown into US$ 1.2 million in October 2010<br />
1,600<br />
1,400<br />
1,200<br />
1,000<br />
800<br />
600<br />
400<br />
VALE P<br />
MSCI metals & mining<br />
MSCI World<br />
October 12,<br />
2010<br />
200<br />
100<br />
0<br />
June 2000 20,<br />
2000<br />
2001 2002 2003 2004 2005 2006 2007 2008 2009 2010<br />
5
Agenda<br />
• A promising outlook<br />
• Growth and value creation<br />
• The quest for sustainability<br />
6
7<br />
A promising outlook
Emerging economies will continue to be the<br />
key engine of global growth, with positive<br />
implications for the demand of minerals,<br />
metals and fertilizers<br />
9<br />
8<br />
7<br />
6<br />
5<br />
4<br />
3<br />
2<br />
1<br />
0<br />
-1<br />
-2<br />
-3<br />
Convergence<br />
Real GDP growth<br />
% annual<br />
Developed Economies<br />
Emerging Economies<br />
Convergence<br />
-4<br />
1970 1975 1980 1985 1990 1995 2000 2005 2010E 2015E<br />
8<br />
Sources: <strong>Vale</strong> and IMF
Intensity of metals consumption in emerging<br />
economies is expected to remain high in view<br />
of urbanization, industrialization and the rising<br />
consumption of consumer durables<br />
35<br />
Steel consumption intensity<br />
metric tons / US$ million of real GDP<br />
90%<br />
Share of emerging economies in global<br />
consumption of metals<br />
30<br />
25<br />
20<br />
80%<br />
70%<br />
60%<br />
Iron Ore<br />
Nickel<br />
Copper<br />
15<br />
50%<br />
10<br />
5<br />
Emerging Economies<br />
Developed Economies<br />
40%<br />
30%<br />
0<br />
20%<br />
1990<br />
1992<br />
1994<br />
1996<br />
1998<br />
2000<br />
2002<br />
2004<br />
2006<br />
2008<br />
1997<br />
1999<br />
2001<br />
2003<br />
2005<br />
2007<br />
2009<br />
9<br />
Source: World Steel Association, WBMS, IMF and <strong>Vale</strong>
China’s urbanization rate in 2010 is equal to Brazil’s<br />
position in the mid 50’s and Korea in the early 70’s<br />
100<br />
Urbanization rate<br />
%<br />
60<br />
Urbanization rate<br />
%<br />
90<br />
80<br />
70<br />
60<br />
50<br />
40<br />
30<br />
Brazil<br />
Korea<br />
China<br />
India<br />
50<br />
40<br />
30<br />
20<br />
20<br />
10<br />
10<br />
China<br />
World<br />
0<br />
0<br />
1950<br />
1955<br />
1960<br />
1965<br />
1970<br />
1975<br />
1980<br />
1985<br />
1990<br />
1995<br />
2000<br />
2005<br />
2010<br />
2015<br />
2020<br />
1950<br />
1955<br />
1960<br />
1965<br />
1970<br />
1975<br />
1980<br />
1985<br />
1990<br />
1995<br />
2000<br />
2005<br />
2010<br />
2015<br />
2020<br />
10<br />
Source: UN Department of Economic and Social Affairs, “World Urbanization Prospects: the 2009 revision”.
In spite of the substantial expansion, there is<br />
still room for large flows of infrastructure<br />
spending in China<br />
2005 2009 2020F<br />
Expressways (km) 41,000 65,000 100,000<br />
Railways (km) 75,437 86,000 120,000<br />
Airports (number) 140 166 244<br />
11<br />
F = Target<br />
Sources: NBS, NDRC, CAAC and Ministry of Transport of China
India's ability to improve infrastructure is<br />
critical for the sustainability of its high pace<br />
of economic growth<br />
• Indian energy and logistics infrastructure is<br />
inadequate to meet its growth aspirations.<br />
• The Indian government intends to double<br />
infrastructure investment to US$ 1 trillion in<br />
2012-2017 from US$ 500 billion in 2007-<br />
2011.<br />
12
China’s car industry is already bigger than<br />
the US industry. However, the penetration is<br />
still low, indicating a huge growth potential<br />
Passenger cars per 1,000 people<br />
2002<br />
US<br />
Western Europe<br />
Japan<br />
428<br />
481<br />
464<br />
Korea<br />
205<br />
Russia<br />
Brazil<br />
Mexico<br />
World<br />
132<br />
120<br />
107<br />
95<br />
China 2008<br />
36<br />
13<br />
Sources: University of Sheffield, UK and CEIC
Geological and institutional factors will<br />
continue to constrain the supply response to<br />
price incentives contributing to lengthen the<br />
cycle<br />
• Grades are declining while stripping ratios are<br />
increasing.<br />
• World-class assets tend to be increasingly dependent on<br />
more <strong>com</strong>plex regions.<br />
• Restrictions on environmental permits are a major cause<br />
of project delays.<br />
• Natural resources nationalism hampers mining<br />
investment.<br />
• Higher taxes are a threat to mining investment.<br />
14
15<br />
Growth and value creation
Our long-term growth strategy embodies a multilane<br />
road to value creation built on discipline in capital<br />
allocation and minimization of cost of capital<br />
Discipline in capital allocation<br />
Maximizing<br />
asset<br />
performance<br />
Existing assets<br />
New assets<br />
Shareholder<br />
Value<br />
Brownfield<br />
projects<br />
Portfolio<br />
management<br />
Mineral<br />
exploration<br />
Greenfield<br />
projects<br />
Acquisitions<br />
16
Confidence in long-term global fundamentals<br />
underlies the continuity of our strategy to<br />
deliver strong and steady growth and value<br />
• Focus on organic growth.<br />
• Massive investment in the development of<br />
world-class assets supported by the expansion<br />
of our infrastructure.<br />
• Enhancement of <strong>com</strong>petitiveness in the Asian<br />
market.<br />
• Development of an asset base in Africa.<br />
17
Developing an exciting pipeline of world-class assets<br />
to exploit the opportunities stemming from rapid<br />
emerging economies growth<br />
Greenfield<br />
Onça<br />
Puma<br />
CSA¹<br />
Tres Valles<br />
Bayovar<br />
Estreito<br />
Oman<br />
Karebbe<br />
Moatize<br />
Salobo<br />
Tubarão VIII<br />
Teluk Rubiah<br />
2010 2011 2012<br />
2013 2014<br />
ALPA²<br />
CSP²<br />
Rio Colorado<br />
Konkola North<br />
Long-Harbour<br />
Biofuel<br />
CSU²<br />
Apolo<br />
Serra Sul<br />
(S11D)<br />
Carajás<br />
Additional 20 Mtpy<br />
Reference<br />
US$ 1 billion<br />
Brownfield<br />
Totten<br />
¹ Total project capex. <strong>Vale</strong> has a stake of 26.87%.<br />
² Total project capex. <strong>Vale</strong>’s investment depends on its final stake in the project<br />
18<br />
Carajás<br />
Additional 30 Mtpy<br />
Conceição<br />
Itabiritos<br />
Vargem Grande<br />
Itabiritos<br />
Salobo II<br />
Iron ore & pellets<br />
Nickel<br />
Coal<br />
Copper<br />
Phosphates & Potash<br />
Logistics<br />
Energy<br />
Steel
Many growth options to feed the project<br />
pipeline in the future<br />
Paulo Afonso<br />
<strong>Simandou</strong><br />
Cristalino<br />
118<br />
Alemão<br />
Salobo<br />
III<br />
Polo<br />
Regina<br />
Visconde<br />
Neuquén<br />
Carnalita<br />
Eagle<br />
Downs<br />
Ellensfield<br />
Corumbá<br />
Kalumines<br />
Evate<br />
Bayovar II<br />
Belvedere<br />
Malaysia<br />
Furnas<br />
Bayovar III<br />
Salitre<br />
Moatize II<br />
Iron ore<br />
Copper Phosphates Potash<br />
Coal<br />
19
18 large projects are <strong>com</strong>ing on stream in<br />
2010 - 2012<br />
•Cash flow will start to be generated from the<br />
US$ 26 billion invested over time in these 18 projects.<br />
•The delivery of these projects lays the ground<br />
for building new growth platforms through the<br />
development of low-capex brownfield projects.<br />
20
Changing the game in the Asian market<br />
• Maximizing <strong>com</strong>petitive advantages: boosting<br />
production of high-quality iron ore.<br />
• Minimizing <strong>com</strong>petitive disadvantages:<br />
building a low-cost portfolio of maritime<br />
freight and distribution centers.<br />
21
Carajás and <strong>Simandou</strong>, the best iron ore<br />
growth platform in the world<br />
Carajás<br />
<strong>Simandou</strong><br />
22
The focus on high-quality iron ore output<br />
• Lower operating costs and superior value-inuse<br />
recognized through price premia.<br />
• The use of <strong>Vale</strong>’s iron ores and pellets leads<br />
to higher productivity and reduction in fuel<br />
consumption and CO2 emission, addressing<br />
Chinese concerns.<br />
• Demand is less sensitive to recessions and<br />
tends to increase with rising needs for<br />
blending.<br />
23
The build up of a shipping fleet<br />
• Lower costs and mitigates freight price<br />
volatility for clients.<br />
• Portfolio <strong>com</strong>posed of own vessels -<br />
capesizes and VLOCs - and long-term<br />
contracts.<br />
• VLOCs, an innovative idea launched by <strong>Vale</strong>,<br />
will promote a permanent cut in the costs of<br />
Atlantic-Pacific dry bulk shipping.<br />
24
The construction of Distribution Centers adds<br />
flexibility to our operations, strengthening<br />
<strong>com</strong>petitiveness<br />
Low seaborne transit time,<br />
inventories synergy and blending<br />
flexibility are among the unique<br />
advantages of <strong>Vale</strong>’s DCs.<br />
Oman<br />
PDM<br />
Malaysia<br />
San Nicolas<br />
Guaíba<br />
&<br />
Itaguaí<br />
Tubarão<br />
25
Africa: the new mining frontier<br />
• “Easy” discoveries are gone.<br />
• The discovery of new world-class deposits is<br />
increasingly dependent on Africa.<br />
• <strong>Vale</strong> is taking steps to build a large African<br />
asset base.<br />
26
The build up of an efficient logistics<br />
infrastructure to anchor our African bulk<br />
materials assets<br />
<strong>Simandou</strong><br />
Moatize<br />
27
28<br />
The quest for sustainability
Contributing to global sustainability<br />
• While the benefits of carbon-based energy use<br />
are current and highly focused, social costs<br />
are delayed and dispersed.<br />
• <strong>Vale</strong> is developing several initiatives to<br />
reconcile short and long term interests,<br />
be<strong>com</strong>ing an agent of global sustainability.<br />
29
<strong>Vale</strong> has been developing and implementing<br />
several technological solutions in a quest for<br />
continuous improvement of mining<br />
• Dry iron ore processing<br />
• Truckless mine<br />
• Green vessels<br />
• Renewable energies<br />
- Biodiesel<br />
- Synthetic diesel<br />
30
Dry iron ore processing: saving water, an<br />
increasingly scarce resource<br />
Conventional wet process<br />
<strong>Vale</strong>’s dry ore process<br />
Run of mine<br />
Run of mine<br />
Water<br />
Lump<br />
Lump<br />
Sinter feed<br />
Sinter feed<br />
Tailings<br />
Pellet feed<br />
• Reduction of water and energy<br />
consumption.<br />
• Reduction of CO2 emissions.<br />
• No need for tailings dam.<br />
• Reduction of capex and opex<br />
31
The truckless operation at Serra Sul will mean<br />
a reduction in carbon emissions, higher safety<br />
and forest preservation<br />
Conventional mining<br />
Truckless transportation<br />
32
Green vessels<br />
• Increasing global focus on carbon<br />
emissions.<br />
• Our 400,000 dwt vessels emit 34% less<br />
pollution.<br />
Capesize<br />
170,000 dwt<br />
LOA 288m<br />
VLOC<br />
400,000 dwt<br />
LOA 360m<br />
33
<strong>Vale</strong>’s renewable source of energy - Biodiesel<br />
‣<strong>Vale</strong>’s solutions for reduction of GHG emissions and carbon sequestration<br />
Biodiesel<br />
Allows the use of blend B‐20 (20% pure<br />
biodiesel and 80% regular diesel) from<br />
2014 onwards.<br />
GHG emissions reduction<br />
Reduction of 12 millions tons of CO 2<br />
equivalent in 25 years.<br />
In<strong>com</strong>e generation<br />
• Creation of over 6,000 direct jobs.<br />
• Recovery of degraded areas in the Amazon region.<br />
• 70,000 ha. of natural forest.<br />
• 60,000 ha. of palm trees.<br />
Benefits to about 2,000 families of<br />
small producers in the Amazon region.<br />
34
Controlling dust pollution: wind fences<br />
• Installation of wind fences at the port of<br />
Tubarão, Brazil, where we operate seven iron<br />
ore pellet plants.<br />
• The wind fences minimize the emissions of up<br />
to 120 km/hour.<br />
35
Protecting natural wealth<br />
• <strong>Vale</strong> protects 10,321 sq km of natural areas in<br />
South America, North America, Asia and<br />
Oceania.<br />
• These include regions in several forests:<br />
• Amazon rainforest<br />
• Boreal<br />
• Atlantic<br />
• New Caledonia<br />
• Wellacea<br />
36
Fundação <strong>Vale</strong> : one of the largest corporate<br />
foundations in the world<br />
• Capacity to fund social investment through its own<br />
endowment and fund raising with partners.<br />
• Capacity to execute projects.<br />
• Focus on infrastructure building, human and economic<br />
development, quality of local administration and<br />
management of mining impacts.<br />
• 2009 investment reached 0.75 % of <strong>Vale</strong> net revenues,<br />
the highest among global metals and oil <strong>com</strong>panies.<br />
37
<strong>Vale</strong>,<br />
a global leader<br />
38
Tito Martins<br />
Executive Officer of Basic<br />
Materials Operations<br />
1<br />
October 18, 2010
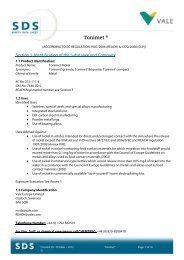
Introduction<br />
• Our base metals business involves nickel, copper,<br />
aluminum and associated precious metals and<br />
PGM’s.<br />
• Transfer of interests in aluminum to Norsk Hydro is<br />
expected to be concluded before year-end.<br />
• Centred in Toronto, Canada<br />
2
A global network of world-class assets<br />
THOMPSON<br />
VOISEYS BAY<br />
SUDBURY<br />
PORT COLBORNE<br />
• <br />
LONG HARBOUR<br />
PARAGOMINAS<br />
CLYDACH<br />
ACTON<br />
KOREA NICKEL<br />
DALIAN<br />
<br />
<br />
<br />
MATSUZAKA<br />
TAIWAN NICKEL<br />
Principal mines &<br />
operations<br />
• Development<br />
properties<br />
Other metal<br />
refineries<br />
<br />
JV refineries<br />
•<br />
TRES VALLES<br />
SOSSEGO<br />
•<br />
ONÇA PUMA, SALOBO<br />
CRISTALINO, POLO,<br />
FURNAS, ALEMAO<br />
KALUMINES<br />
•<br />
•<br />
KONKOLA<br />
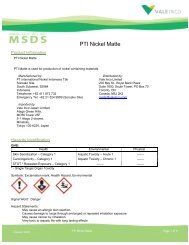
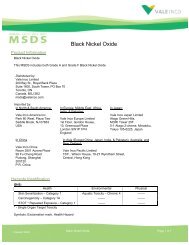
PTI<br />
VNC<br />
3
4<br />
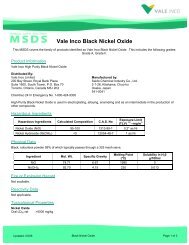
Nickel
An overview<br />
• Two broad types of ore (laterite + sulphide) are used to produce nickel with<br />
many different processing options dependant on the ore<br />
– There is an increasing shift to laterite ores<br />
– Sulphides are typically at the lower end of the cash cost curve<br />
• Different end-products can target specific markets; stainless represents 60-<br />
65% of global nickel demand<br />
– FeNi, NPI, and some other low grade products target stainless steel;<br />
represents majority of industry growth<br />
• Unlike copper, nickel is mostly integrated. 3 rd party volumes used as ‘top-up’<br />
– Sulphide process assets (dealing with 3 rd party trade) are generally<br />
controlled by the top 5 producers<br />
• Our growth projects will contribute to maintain <strong>Vale</strong>’s share in 20% of the<br />
global nickel market.<br />
5
A global set of world-class refineries with a<br />
diversified portfolio of high-quality products<br />
for all nickel applications<br />
Electro<br />
Tonimet<br />
Thompson<br />
Sudbury<br />
Voisey’s<br />
Bay<br />
Clydach<br />
KNC<br />
Dalian<br />
Matsusaka<br />
TNRC<br />
Carbonyl<br />
Onca<br />
Puma<br />
PTI<br />
Refinery<br />
Marketing or JV<br />
refinery<br />
FeNi<br />
Utility<br />
VNC<br />
Mines<br />
Development<br />
properties<br />
6
<strong>Vale</strong> has a strong platform to grow the nickel<br />
business – a balance of sulphide and laterite<br />
properties<br />
• Current<br />
Sudbury<br />
Voisey’s Bay<br />
Thompson<br />
Indonesia (PTI)<br />
• Growth<br />
Onça Puma<br />
<strong>Vale</strong> New Caledonia (VNC)<br />
7
<strong>Vale</strong> has world’s largest nickel reserves¹<br />
million metric tons of contained nickel<br />
<strong>Vale</strong><br />
7.9<br />
Norilsk Nickel<br />
6.4<br />
Jinchuan<br />
4.6<br />
Xstrata<br />
2.9<br />
BHP Billiton<br />
2.8<br />
Eramet<br />
2.6<br />
8<br />
¹ proven and probable reserves in 2009.<br />
Source: Companies’ reports and Brookhunt, 2009
<strong>Vale</strong> is one of the world’s leading nickel<br />
producers<br />
Share of world finished nickel production - 2008<br />
Other<br />
37.9%<br />
<strong>Vale</strong><br />
17.4%<br />
Norilsk<br />
20.6%<br />
Jinchuan<br />
7.6%<br />
Xstrata<br />
7.8%<br />
BHP<br />
8.7%<br />
Source: CRU Quarterly Q2 2009<br />
9
Nickel output from sulphides is generally the lowest<br />
on the cash cost curve<br />
2010 cash cost curves<br />
US$/lb<br />
Laterite –<br />
HPAL,<br />
Caron<br />
Laterite - FeNi<br />
Sulphides<br />
NPI EAF<br />
NPI BF<br />
Source: Brookhunt, 2010 Q2<br />
million lb<br />
10
The main goal of our nickel business<br />
11<br />
Ensure success of<br />
projects<br />
Complete and ramp-up of VNC, Onça Puma,<br />
Long Harbour, Karebbe<br />
=> Average gross fixed asset/throughput in ‘15 50% of ‘09 figure<br />
22<br />
Reduce sustaining<br />
capital<br />
Reduce the sustaining capital requirements of the<br />
Canadian operations to 3% of gross fixed assets<br />
33<br />
Improve cost<br />
efficiency<br />
Reduce the operating costs of the<br />
Canadian operations by 5% in ’15 over ‘09<br />
44<br />
Increase production<br />
Seek production improvements<br />
=> Increase production in Indonesia<br />
55<br />
Improve price<br />
realization<br />
Maximize premium and maintain consistency of sales<br />
11
Integration of the North Atlantic nickel flows<br />
2010<br />
Thompson<br />
mines<br />
Thompson<br />
mill<br />
Thompson<br />
smelter<br />
Thompson<br />
nickel refinery<br />
Cathode<br />
Rounds<br />
Ni Oxide<br />
Sinter<br />
Sudbury<br />
mines<br />
Clarabelle<br />
mill<br />
Copper Cliff<br />
smelter<br />
Matte<br />
processing<br />
Clydach nickel refinery<br />
Copper Cliff nickel refinery<br />
Pellets<br />
&<br />
Powders<br />
Port Colborne<br />
Cobalt<br />
Copper<br />
concentrate<br />
Acton<br />
PGMs<br />
Gold<br />
Silver<br />
Voisey’s Bay<br />
mine<br />
Voisey’s<br />
mill<br />
Copper<br />
anodes<br />
Copper<br />
concentrate<br />
12
VNC - New Caledonia<br />
• Design production of 60ktpa of<br />
nickel.<br />
• Ramping-up to full production<br />
has <strong>com</strong>menced.<br />
• Short-term strategy is to<br />
produce an intermediate<br />
product.<br />
13
Onça Puma - Brazil<br />
• Design production rate of<br />
58ktpa nickel as ferronickel.<br />
• Commissioning underway with<br />
first production in Q4 2010.<br />
• Continuing construction on line<br />
2 with <strong>com</strong>mercial production<br />
in 2011.<br />
14
Long Harbour - Canada<br />
• Construction underway of<br />
nickel concentrate refinery in<br />
Newfoundland.<br />
• Design capacity of 50 ktpa<br />
nickel.<br />
• Start-up in 2013.<br />
15
16<br />
Copper
An overview<br />
• In the copper industry the most value adding segment is mining /<br />
concentration because:<br />
– The capex per ton in mining is only 50% higher than for smelting /<br />
refinery.<br />
– Mining/concentration gets 90% of LME prices (just 10% for smelting /<br />
refinery).<br />
• There is no major problem to sell clean concentrates to existing smelters.<br />
The industry is only 46% vertically integrated (in <strong>com</strong>parison to almost 90%<br />
in nickel).<br />
• Declining costs at existing operations and low grades of existing resources<br />
of non developed projects demand high copper prices in the long term.<br />
• In addition, TC/RCs are expected to remain low, given the deficit in mine<br />
supply.<br />
• Therefore, smelters must specialize in treating concentrates with impurities<br />
in order to <strong>com</strong>pensate for these very low TC/RCs.<br />
17
Developing our copper business<br />
• Executing a pipeline of projects that will take<br />
advantage of potential copper deficits in the<br />
next 5 years.<br />
• Acquisitions may be an option to ensure scale<br />
and flexibility.<br />
18
Tres Valles - Chile<br />
• First international greenfield<br />
copper project to be executed by<br />
<strong>Vale</strong>.<br />
• First experience of downstream<br />
and first cathode industrial scale<br />
production.<br />
• The project is nearing <strong>com</strong>pletion<br />
with <strong>com</strong>missioning in Q4 2010.<br />
• It has an expected lifetime of 11<br />
years, with a production capacity<br />
of 18.5 ktpa of copper cathodes.<br />
19
Salobo - Brazil<br />
• Phase 1 of the Salobo project is<br />
currently under construction.<br />
• The start-up for the Phase 1 is<br />
scheduled for Q3 2011with a<br />
design production rate of 100 ktpa<br />
copper in concentrate.<br />
• Phase 2 of Salobo will double<br />
copper and gold production and is<br />
expected to be in production from<br />
2013.<br />
• A Phase 3 is being considered.<br />
20
Konkola North - Zambia<br />
• Konkola North, located at the northwestern<br />
extremity of the Zambian<br />
portion of the Copperbelt.<br />
• It was discovered in 1924 and mined<br />
until 1959.<br />
• Konkola North will be <strong>Vale</strong>’s first<br />
operation in the Copperbelt and is a<br />
JV with African Rainbow Minerals<br />
(ARM).<br />
• All licenses and permits have already<br />
been granted.<br />
• Design production is 45 ktpa of copper<br />
in concentrate.<br />
• Start-up is expected in 2013.<br />
21
Main projects by horizon and estimated<br />
production capacity<br />
Horizon 3<br />
Horizon 1<br />
Horizon 2<br />
000’ metric tons<br />
• Tres Valles 18<br />
• Salobo I 100<br />
• Salobo II 100<br />
• Cristalino 100<br />
• Konkola North 100<br />
• 118 Oxide 36<br />
• Polo 100<br />
• Salobo III 80<br />
• Alemão 80<br />
• Kalumines 36<br />
• Visconde 90<br />
• 118 Sulphide 36<br />
• Furnas 100<br />
• Paulo Afonso 160<br />
2010-2012 2012-2016<br />
2016 onwards<br />
22
Eduardo Ledsham<br />
Executive Officer of<br />
Exploration, Energy and <strong>Project</strong>s<br />
1<br />
October 18, 2010
<strong>Simandou</strong><br />
• <strong>Project</strong> overview<br />
• <strong>Project</strong> details<br />
• Short and medium term action plan<br />
2
3<br />
<strong>Vale</strong> will unlock the development of<br />
<strong>Simandou</strong> <strong>Project</strong>.<br />
Last high grade iron ore similar to Carajas
Opportunity for <strong>Vale</strong><br />
<strong>Vale</strong> will consolidate its position as main<br />
premium iron ore supplier in the seaborne<br />
market.<br />
<strong>Vale</strong>’s technologies and experience in the<br />
implementation of large iron ore projects<br />
will guarantee success of the project.<br />
• The current expansion in Carajas will provide<br />
the engineering to support <strong>Simandou</strong><br />
• The short distance between Brazil and<br />
Guinea/Liberia allows continuous training for<br />
different teams<br />
4
5<br />
<strong>Simandou</strong> project details
<strong>Simandou</strong> <strong>Project</strong><br />
Blocks 1 & 2 - highlights<br />
Extension:<br />
• 40km<br />
Average height:<br />
• 600m<br />
Hematite resources:<br />
• 2 billion metric tons @ 66% Fe (potential)<br />
Hematite resources:<br />
• 6 billion metric tons @ 45% Fe (potential)<br />
BSGR drilling campaign<br />
• Drillholes : 38<br />
• Metters drilled: 6,677m<br />
• Average depth: 175m<br />
• Access constructed: 70km<br />
• Drilling platforms: 9.5km 2<br />
6
<strong>Simandou</strong> <strong>Project</strong><br />
Blocks 1 & 2 - highlights<br />
2011 feasibility study drilling<br />
campaign (Hematite focus):<br />
• Drillholes : 1009<br />
• Metters to be drilled: 115,400m<br />
• Average depth: 150m<br />
• Access to be constructed: 217km<br />
• Drilling platforms: 252.3km2<br />
7
<strong>Simandou</strong> <strong>Project</strong><br />
Blocks 1 & 2 - geology<br />
8
9<br />
<strong>Simandou</strong> <strong>Project</strong><br />
Blocks 1 & 2 - geology
<strong>Simandou</strong> <strong>Project</strong><br />
Blocks 1 & 2 - geology<br />
10
<strong>Simandou</strong> <strong>Project</strong><br />
Blocks 1 & 2 - geology<br />
11
<strong>Simandou</strong> <strong>Project</strong><br />
Blocks 1 & 2 – open pit mine<br />
12
<strong>Simandou</strong> <strong>Project</strong><br />
Blocks 1 & 2 – dry process<br />
13
<strong>Simandou</strong> <strong>Project</strong><br />
Zogota highlights<br />
Extension:<br />
• 10km<br />
Average height:<br />
• 500m<br />
Hematite resources:<br />
• 220Mt @ 62% Fe (potential)<br />
Hematite resources:<br />
• 530Mt @ 45% Fe (potential)<br />
Drilling campaign<br />
• Drillholes : 139<br />
• Metters drilled: 12,334m<br />
• Average depth: 88m<br />
• Access constructed: 39km<br />
• Drilling platforms: 34.8km 2<br />
14
<strong>Simandou</strong> <strong>Project</strong><br />
Zogota highlights<br />
2011 drilling campaign:<br />
• Drillholes : 305<br />
• Metters to be drilled: 28,000m<br />
• Average depth: 100m<br />
• Access to be constructed: 56km<br />
• Drilling platforms: 76.3km 2<br />
15
16<br />
Zogota project<br />
Process plant project
Zogota project<br />
Beneficiation flowsheet<br />
17
Zogota project<br />
Master plan : hematite final pit and future expansion<br />
18
<strong>Simandou</strong> <strong>Project</strong><br />
Liberian logistics corridor<br />
19
<strong>Simandou</strong> <strong>Project</strong><br />
Transguinea railway: rehabilitation in progress<br />
20
<strong>Simandou</strong> <strong>Project</strong><br />
Hematite estimated production<br />
21
<strong>Simandou</strong> <strong>Project</strong><br />
Short and medium term action plan<br />
Action plan – finished<br />
<strong>Project</strong> team organization<br />
Infrastructure Development Agreement (IDA) Liberia<br />
Construction <strong>com</strong>panies bid process for the emergencial works<br />
Drilling <strong>com</strong>panies bid, sampling preparation laboratory bid, sampling assay solution<br />
Drilling camp construction<br />
Basic engineering for Zogota process plant<br />
Action plan – in progress<br />
• 330Km (50% of the total extension) refurbishment of Transguinean railway, for general cargo<br />
and passengers<br />
• Aerial survey<br />
• Environmental studies and licenses<br />
• Definition of the VBG new port location<br />
• Acquisition of the process plant main equipments<br />
• Alternative sources of energy for the Guinean and Liberian operations<br />
22<br />
• Basic engineering for railway
23<br />
<strong>Simandou</strong>: the largest integrated iron ore mine<br />
and infrastructure project ever developed in Africa
Mário Barbosa<br />
Executive Officer of Fertilizers<br />
1<br />
October 18, 2010
2<br />
Fertilizers in <strong>Vale</strong><br />
Industry perception, perspectives, strategy and initiatives
Fundamentals are strong<br />
Fertilizer demand has been boosted by the required increase in<br />
agriculture yields to support continued growth of food production<br />
• Population growth<br />
• Increasing per capita in<strong>com</strong>e and changing diets<br />
• Limited Agricultural Resources<br />
- Lower per capita arable land<br />
- Unbalanced soil conditions<br />
- Limited water availability<br />
• Climate Changes<br />
3
Fundamentals are strong<br />
Soil conditions and available land drive fertilizer´s demand<br />
Soil Resilience<br />
Soil Performance<br />
4<br />
Source: IFA
Fundamentals are strong<br />
Agricultural land, world grain productivity and fertilizer consumption<br />
• Fertilizer demand is driven by<br />
200<br />
4000<br />
two main factors.<br />
- Increasing demand for food<br />
as a result of population and<br />
high per capita in<strong>com</strong>e<br />
growth.<br />
- Limitation of arable, goodquality<br />
land.<br />
• Increase in grain production<br />
depends heavily on higher<br />
agricultural productivity, what<br />
Fertilizer Consumption (Mt)<br />
150<br />
100<br />
50<br />
Harvested Area<br />
Fertilizer Consumption<br />
Grain Productivity<br />
3000<br />
2000<br />
1000<br />
Harvested Area (Mha) and Productivity(kg/ha)<br />
leads to higher dosage of<br />
fertilizer.<br />
0<br />
61 64 67 70 73 76 79 82 85 88 91 94 97 00 03 06 09<br />
0<br />
5<br />
Source: IFA
Fundamentals are strong<br />
Pace of global demand growth is expected to accelerate in this<br />
decade<br />
• Global fertilizer consumption is<br />
expected to reach ~ 200 Mt by the<br />
end of this decade.<br />
- Global population is estimated to reach<br />
7.7 billion, 1.1% CAGR<br />
- Most refers to urban population, which<br />
has higher dietary standards .<br />
• That implies an average 3% CAGR<br />
for the growth of fertilizers demand<br />
the following years.<br />
• Emerging countries will lead this<br />
growth and Brazil´s rate is expected<br />
to keep is 6% aa pace.<br />
Fertilizer consumption, Mt<br />
200<br />
160<br />
120<br />
80<br />
40<br />
0<br />
K2O<br />
P2O5<br />
N<br />
3 % p.y.<br />
61 73 83 89 92 95 98 '01 '04 '07 10 13 16 19<br />
6<br />
Source: IFA
Fundamentals are strong<br />
Fertilizer consumption has increased significantly specially in<br />
emerging countries. Brazil presented the highest growth rate among<br />
them in the last two decades<br />
Fertilizer consumption, Mt Fertilizer consumption, index 1990=100<br />
CAGR<br />
90 00 05 06 08 %<br />
300<br />
China 27 34 44 46 48 3%<br />
India 13 17 20 22 22 3%<br />
USA 18 19 19 19 19 0%<br />
250<br />
200<br />
6% p.y.<br />
Brazilian Market<br />
Brazil 3 7 8 9 9 6%<br />
150<br />
World Market<br />
World 137 137 153 159 160 1%<br />
Source: IFA /ANDA<br />
100<br />
50<br />
90 92 94 96 98 '00 '02 '04 '06 '08<br />
7
Fundamentals are strong<br />
China, India, the US, EU and Brazil represent more than 70%<br />
of the total demand for fertilizers<br />
Nitrogen consumption<br />
kt of N<br />
35000<br />
Phosphate consumption<br />
15000<br />
Potash consumption<br />
kt of K 2 O<br />
9000<br />
28000<br />
21000<br />
14000<br />
7000<br />
0<br />
kt of P 2 O 5<br />
0<br />
12000<br />
7500<br />
9000<br />
6000<br />
4500<br />
6000<br />
3000<br />
3000<br />
1500<br />
0<br />
China<br />
India<br />
EUA<br />
UE<br />
Brasil<br />
Outros<br />
China<br />
India<br />
EUA<br />
Brasil<br />
UE<br />
Outros<br />
China<br />
EUA<br />
Brasil<br />
UE<br />
India<br />
Outros<br />
8 Source: IFA
Fundamentals are strong<br />
China is the main producer of nitrogen (ammonia) and phosphate<br />
(phosphate rock), but its production is mainly consumed internally<br />
32%<br />
Ammonia production<br />
153 Mt World in 2008<br />
36%<br />
Phos rock production<br />
174 Mt World in 2008<br />
18%<br />
14%<br />
9% 8%<br />
6% 1%<br />
6% 4%<br />
China Russia India US Brazil<br />
China US Morocco Russia Brazil<br />
33%<br />
KCl production<br />
54 Mt World in 2008<br />
Sulphur production<br />
48 Mt World in 2008<br />
19%<br />
15%<br />
11%<br />
17%<br />
15%<br />
13%<br />
2%<br />
6%<br />
0%<br />
Canada Russia Belarus Germany Brazil<br />
US Canada Russia S. Arabia Brazil<br />
9<br />
Source: IFA
Global trading of fertilizer<br />
Origin<br />
Western Canada<br />
Origin<br />
Eastern Europe<br />
Destination/Origin<br />
US/Mexico<br />
Origin<br />
Morocco<br />
Origin<br />
Arab Gulf<br />
Destination<br />
India<br />
Origin<br />
China **<br />
Potash<br />
Phosphate<br />
Dry Nitrogen<br />
UAN (liquid Nitrogen)<br />
Destination<br />
Brazil<br />
Destination<br />
Argentina<br />
Destination<br />
Southeast Asia<br />
* US exports only P. Us is a net importer of N and K. Mexico is a net importer of NPK<br />
** China is the largest producer and consumer of fertilizer. China is the largest producer and a significant exporter of urea.<br />
10<br />
Source: IFA<br />
10
Fundamentals are strong<br />
Raw material prices (excluding ammonia) are expected to stabilize in the<br />
near future, and final products still have room to increase more<br />
Nitrogen<br />
Phosphates<br />
278<br />
233 222<br />
199 195<br />
154<br />
102105 113<br />
318<br />
235<br />
588<br />
274<br />
522<br />
323<br />
278<br />
378<br />
415 435 475 505 545<br />
455<br />
365 395420<br />
325330<br />
Raw Materials Ammonia FOB<br />
Tampa US$/t<br />
Basic Fertilizer UREA Fob<br />
Black Sea US$/t<br />
'00 '02 '04 '06 '08 10 12 14 16 18 20<br />
Potash<br />
1000<br />
800<br />
600<br />
400<br />
413<br />
930<br />
442<br />
410<br />
Raw Materials phosphate<br />
rock Fob Morocco US$/t<br />
Raw Material Sulphur Fob<br />
Vancouver US$/t<br />
Basic Fertilizer MAP Fob<br />
Black Sea US$/t<br />
506<br />
467<br />
335 365 430<br />
546<br />
900<br />
700<br />
500<br />
300<br />
117 118118<br />
Basic Fertilizer KCl Fob Vancouver US$/t<br />
175 210 620<br />
520<br />
420<br />
360<br />
480 480 480480<br />
440<br />
200<br />
37<br />
0<br />
247<br />
262 329<br />
216<br />
147 146 177 176<br />
124<br />
95 100 110<br />
61<br />
43 40 43 47 56 36<br />
50<br />
50 38<br />
54<br />
26<br />
'00 '02 '04 '06 '08 10 12 14 16 18 20<br />
100<br />
'00 '02 '04 '06 '08 10 12 14 16 18 20<br />
11<br />
Source: CRU
Fundamentals are strong<br />
Brazil is highly dependent on imported fertilizers<br />
Brazilian production in 2008<br />
Imports in 2008<br />
Nitrogen<br />
Phosphate<br />
Potash<br />
20%<br />
47%<br />
8%<br />
53%<br />
80%<br />
92%<br />
Source: IFA<br />
12
Fundamentals are strong<br />
<strong>Vale</strong> is the only producer of Potash in Brazil and supplies an average of 10 % of<br />
domestic demand (6.5 Mt KCl in 2010). Agricultural frontiers head to the<br />
northeastern part of the country and total KCl consumption is expected to reach<br />
almost 10 Mt/y by the end of the decade<br />
KCl consumption<br />
Mt in 2010<br />
KCl consumption<br />
Mt in 2020<br />
Taquari-<br />
Vassouras<br />
> 900 > 600 and < 900 > 400 and < 600 > 100 and < 400 < 100<br />
13<br />
Source: Agroconsult
Fundamentals are strong<br />
P2O5 consumption in Brazil is 3.4 Mt and the projected demand is 4.7 Mt by<br />
the end of the decade. <strong>Vale</strong> assets supply around 45% of this total and are<br />
well located to support the regions with higher demand and growth potential<br />
P 2 0 5<br />
consumption<br />
kt<br />
Catalão<br />
Patos de Minas<br />
Uberaba<br />
Araxá<br />
> 500<br />
> 300 and < 500<br />
> 100 and < 200<br />
> 200 and < 300<br />
< 100<br />
Cubatão<br />
Guará<br />
Sources: ANDA, Conab, DIFM, Agroconsult<br />
14
An exciting portfolio of projects and<br />
operations supports <strong>Vale</strong>’s growth strategy<br />
Salitre<br />
<strong>Vale</strong><br />
Fertilizantes<br />
Potash<br />
Phosphate<br />
Expansion<br />
Bayovar<br />
Regina II ‐<br />
Canada<br />
Bayovar ‐ Peru<br />
Taquari<br />
Vassouras<br />
Rio Colorado ‐<br />
Argentina<br />
Carnalita<br />
<strong>Vale</strong> Fosfatados<br />
Regina ‐<br />
Canada<br />
Neuquén ‐<br />
Argentina<br />
Anitápolis<br />
<strong>Vale</strong><br />
Fosfatados<br />
expansions<br />
Evate – Mozambique<br />
15
Achievements made through organic growth<br />
and acquisitions have strengthen our<br />
positioning …<br />
Phosphate<br />
• Acquisition of fertilizer assets.<br />
• Start up of Bayovar in July 2010.<br />
• Asset integration and<br />
optimization: synergies<br />
assessment and capture already<br />
in place.<br />
• Salitre project to be submitted to<br />
Board approval on November<br />
2010.<br />
• Evate project under development<br />
Potash<br />
• Rio Colorado : submission to<br />
Board approval on November<br />
2010.<br />
• Carnalita and Regina (Canada)<br />
projects under development.<br />
16
Farmer<br />
… and have expanded <strong>Vale</strong>`s presence in the<br />
fertilizer industry<br />
Natural gas<br />
Nafta<br />
Asphalt residue<br />
N<br />
Sulphur<br />
S<br />
Phosphate<br />
rock<br />
P<br />
Potash<br />
Ammonia<br />
Sulfuric<br />
acid<br />
Nitric<br />
acid<br />
Phosphoric<br />
acid<br />
Ammonium<br />
nitrate<br />
Urea<br />
Ammonium<br />
sulphate<br />
MAP/DAP<br />
TSP<br />
Natural resources<br />
Initial industrialization<br />
Final industrialization<br />
Granulation and blending – NPK<br />
DCP<br />
SSP<br />
K<br />
<strong>Vale</strong> presence<br />
KCl<br />
17
Our goal is to be<strong>com</strong>e one of the global<br />
leaders in the industry<br />
Phosphate rock production capacity 2017 (Mt rock)<br />
Potash production capacity 2017 (Mt KCl)<br />
OCP 44.7<br />
PotashCorp<br />
18.9<br />
Mosaic<br />
<strong>Vale</strong><br />
JPMC<br />
18.2<br />
16.5<br />
11.5<br />
Mosaic<br />
<strong>Vale</strong><br />
Belaruskaliy<br />
Uralkaliy<br />
7.0<br />
9.7<br />
10.7<br />
15.1<br />
GCT / CPG<br />
10.5<br />
Silvinit<br />
6.3<br />
PCS Phosphates<br />
Ma'aden<br />
Gecopham<br />
5.5<br />
9.6<br />
9.0<br />
K+S<br />
Dead Sea Works<br />
Qinghai Salt Lake<br />
Agrium<br />
3.0<br />
2.8<br />
4.3<br />
6.1<br />
Rotem Amfert Negev<br />
Kara Tau<br />
Ferphos<br />
Foskor<br />
4.6<br />
4.2<br />
3.5<br />
3.5<br />
Note: Considers total capacity of the projects<br />
Bayovar 3.9 Mta, Bayovar II and III 3.8<br />
Mta, Evate 3.5 Mta, Salitre 2.0 Mta,<br />
Anitápolis 0.3 Mta<br />
Arab Potash<br />
EuroChem<br />
Iberpotasas<br />
Cleveland Potash<br />
Mengo Potash <strong>Project</strong><br />
2.4<br />
2.3<br />
1.5<br />
1.2<br />
1.2<br />
Note: Considers total capacity of the<br />
projects PRC 4.35 Mta, VSP I 2.9<br />
Mta, Carnalita I and II 1.6 Mta,<br />
Neuquén 1.0 Mta; UOTV 0.8 Mta<br />
CF Industries<br />
3.2<br />
Intrepid Mining<br />
1.2<br />
18<br />
Source: Fertecon, <strong>Vale</strong>
19<br />
Current operations
Potash - Taquari -Vassouras<br />
• KCl production.<br />
• Underground mine – room and pillar mining.<br />
• Estimate production for 2010 ~ 710 kt.<br />
• Average KCl grade of 27% (2009).<br />
• Life of mine up to 2019.<br />
20
Phosphate - Brazil<br />
Catalão<br />
Uberaba<br />
Patos de Minas<br />
Araxá<br />
Tapira<br />
Guará<br />
Cubatão/Piaçaguera<br />
Cajati(Mine and Port)<br />
Araucária<br />
mines<br />
plants<br />
21
Phosphates - Bayovar (Peru)<br />
• Located in Piura region in Peru.<br />
• World class resource with lowest<br />
cost in phosphate rock<br />
production.<br />
• Start up July 10, 2010.<br />
• Estimated production of 3.96<br />
Mtpa of phosphate rock to be<br />
reached in 2014.<br />
• Life of mine: 27 years.<br />
• Potential expansion under<br />
evaluation.<br />
Reserves<br />
Tonnage<br />
Grade<br />
P 2 O 5<br />
Tonage<br />
P 2 O 5<br />
MT % MT<br />
Proven 237.1 17.3 41.0<br />
Probable 1.9 15.9 0.3<br />
Total 239.0 17.2 41.1<br />
22
Phosphates - Bayovar (Peru)<br />
Port<br />
Conveyor belt<br />
Storage and conveyor belt<br />
23
24<br />
<strong>Project</strong>s in the pipeline
Potash - Rio Colorado<br />
• Located in Mendoza, Argentina<br />
• Successful solution mining pilot trials<br />
undertaken<br />
• Logistics and natural gas supply had<br />
been set on, mitigating project risk<br />
• Proprietary technology defined and<br />
acquired<br />
• Life of mine of at least 70 years<br />
• Large resource and planned<br />
infrastructure can support further<br />
expansion<br />
• Total capacity 4.3 Mt/y<br />
Reserves<br />
Tonnage<br />
Grade<br />
P 2 O 5<br />
Tonage<br />
P 2 O 5<br />
MT % MT<br />
Probable 360.8 34.2 123.4<br />
Total 360.8 34.2 123.4<br />
- First phase starting in 2013 and<br />
reaching 2.4 Mt/y by 2016<br />
25<br />
- Second phase starting in 2017 and<br />
reaching 1.9 Mt/y by 2023
Potash - Rio Colorado<br />
• Implementation plan : critical<br />
path to guarantee schedule is<br />
ongoing.<br />
• Energy solution: JV 50% <strong>Vale</strong> to<br />
dedicated gas supply.<br />
• Logistic solution: concession<br />
agreement already signed with<br />
Ferrosur.<br />
• Permits already granted.<br />
- general for mine and plant.<br />
- electric line.<br />
- port .<br />
Zapala<br />
Neuquén<br />
Rio Negro<br />
Buenos Aires<br />
La Pampa<br />
. Bahía Blanca Port<br />
26
Potash - Rio Colorado<br />
Well drilling<br />
27
Potash - Regina<br />
Location<br />
• Located in the leading potash<br />
producing province of<br />
Saskatchewan, Canada, with<br />
logistics and infrastructure in place.<br />
• Development stage: FEL 1 (to be<br />
concluded in 2010).<br />
• Solution mine envisaged.<br />
- 9 new holes drilled in 2009-2010.<br />
- All historic and new holes<br />
intersected the 3 potash beds with<br />
a <strong>com</strong>bined thickness of 20m -<br />
30m.<br />
• Resources to produce up 2.9 Mtpa<br />
of KCl/year.<br />
28<br />
- Start-up in 2015 and reaching full<br />
capacity of 2.9 Mt/y by 2024.
Potash - Carnalita<br />
Located in Sergipe, Brazil, near Taquari‐Vassouras<br />
operations<br />
Solution mining method<br />
CARNALITA<br />
PROJECT<br />
Development stage: FEL2 – pilot plant operation<br />
with two wells <strong>com</strong>menced in Aug/08<br />
UOTV<br />
TMIB<br />
ARACAJU<br />
• Test of first layer concluded with good<br />
results<br />
• Geomechanic tests in progress<br />
• Environmental permit granted in April<br />
08, 2010<br />
100% to domestic market.<br />
Pilot plant<br />
Gas supply (Long term): contract with Sergas<br />
First phase starting in 2015 and reaching<br />
1.2 Mt/y by 2016<br />
29
Phosphate - Salitre<br />
• Located in Patrocínio/MG, Brazil, in the heart of a fast growing market.<br />
• Open pit mine and sulfuric acid, phosphoric acid, MAP, DAP and TSP plants.<br />
• Development stage: FEL 3.<br />
• Start-up scheduled for 2014.<br />
• Board approval in November/2010.<br />
• Best practice on project development recognized by IPA (Independent <strong>Project</strong><br />
Analysis).<br />
Pilot mining<br />
Mine, plant and infrastructure<br />
30
Phosphate - Evate<br />
Northeast Mozambique, 65 km from<br />
the port of Nacala<br />
Location<br />
Consists of 3 types of phosphates:<br />
• High grade sands: 6Mt @ 20% P2O5<br />
• Low grade sands: 54Mt @ 8% P2O5<br />
• Hard rock: 208Mt @ 12% P2O5<br />
Development stage: FEL 1<br />
It is strategically located to supply the South<br />
and Southeast Asian markets<br />
31
Fertilizers<br />
Summary of estimated production capacity<br />
Current Additional Total 2017<br />
Potash (KCl)<br />
Phosphates<br />
Ammonia<br />
MAP (high)<br />
0.85 kt/y 10 Mt/t 11 Mt/y<br />
9.2 Mt/y 8.0 Mt/y 17 Mt/y<br />
620 kt/y 0 620 kt/y<br />
1,180 kt/y 1,300 kt/y 2,480 kt/y<br />
TSP (high)<br />
SSP<br />
Dicalcium<br />
Phosp<br />
865 kt/y<br />
2,500 kt/y<br />
500 kt/y<br />
670 kt/y 1,535 kt/y<br />
0 2,500 kt/y<br />
120 kt/y 620 kt/y<br />
Urea<br />
610 kt/y<br />
0<br />
610 kt/y<br />
32
Conclusion<br />
• <strong>Vale</strong> has established a robust platform to build a world-class<br />
fertilizer business.<br />
• Strong position in the most important and fast growing<br />
Brazilian market.<br />
• Our goal is to be<strong>com</strong>e a global leader in fertilizer industry.<br />
• Some important issues that should be addressed.<br />
- Define optimal corporate structure for fertilizer assets.<br />
- Integrate and capture synergies from acquired assets .<br />
- Delivery of projects on time and on budget.<br />
- Cost control and operational efficiency.<br />
33