Measuring the basal melt rate of Antarctic ice shelves using GPS ...
Measuring the basal melt rate of Antarctic ice shelves using GPS ...
Measuring the basal melt rate of Antarctic ice shelves using GPS ...

Create successful ePaper yourself
Turn your PDF publications into a flip-book with our unique Google optimized e-Paper software.
FRISP Report No. 14 (2003) 1<br />
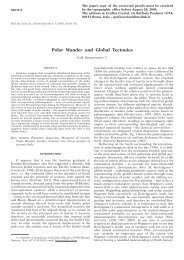
<strong>Measuring</strong> <strong>the</strong> <strong>basal</strong> <strong>melt</strong> <strong>rate</strong> <strong>of</strong> <strong>Antarctic</strong> <strong>ice</strong> <strong>shelves</strong> <strong>using</strong> <strong>GPS</strong> and<br />
phase-sensitive radar observations<br />
Adrian Jenkins, Hugh Corr, Keith Nicholls, Chris Doake and Craig Stewart<br />
British <strong>Antarctic</strong> Survey, Natural Environment Research Council,<br />
High Cross, Madingley Road, Cambridge, CB3 0ET, U.K.<br />
Introduction<br />
Basal <strong>melt</strong>ing <strong>of</strong> <strong>Antarctic</strong>a’s floating <strong>ice</strong> <strong>shelves</strong> accounts for between 15 and 35% <strong>of</strong><br />
<strong>the</strong> total mass loss from <strong>the</strong> <strong>ice</strong> sheet and helps to precondition <strong>the</strong> shelf waters for deep<br />
convection. Despite this pivotal role in <strong>ice</strong> sheet-ocean interactions, <strong>the</strong>re are only a handful<br />
<strong>of</strong> measurements <strong>of</strong> actual <strong>melt</strong>ing <strong>rate</strong>s. Almost all published figures are <strong>of</strong> steady state <strong>melt</strong><br />
<strong>rate</strong>s; that is, <strong>the</strong> <strong>melt</strong> <strong>rate</strong> required to maintain <strong>the</strong> <strong>ice</strong> shelf in a state <strong>of</strong> equilibrium, deduced<br />
from <strong>the</strong> residual <strong>of</strong> <strong>the</strong> o<strong>the</strong>r mass balance terms. Such observations have obvious<br />
limitations, such as <strong>the</strong> impossibility <strong>of</strong> determining <strong>the</strong> role <strong>of</strong> <strong>basal</strong> <strong>melt</strong>ing in driving <strong>ice</strong><br />
shelf thinning or retreat. Over <strong>the</strong> past two <strong>Antarctic</strong> field seasons we have conducted a<br />
series <strong>of</strong> experiments to measure <strong>the</strong> actual <strong>melt</strong> <strong>rate</strong> at various locations on George VI and<br />
Filchner-Ronne <strong>ice</strong> <strong>shelves</strong>. The key to our technique is a precise measurement <strong>of</strong> <strong>the</strong> <strong>ice</strong><br />
shelf thinning <strong>rate</strong>, by phase-sensitive radar. The thinning <strong>rate</strong> can be partitioned between<br />
vertical strain and <strong>melt</strong>ing without <strong>the</strong> need to assume that <strong>the</strong> <strong>ice</strong> shelf is in equilibrium,<br />
given contemporaneous measurements <strong>of</strong> <strong>the</strong> vertical strain <strong>rate</strong>.<br />
Theory<br />
Applying <strong>the</strong> principle <strong>of</strong> mass conservation to a moving column <strong>of</strong> <strong>ice</strong> on an <strong>ice</strong> shelf<br />
we obtain:<br />
DH<br />
r<br />
⎛ ∂u<br />
∂v<br />
⎞ m ⎛<br />
s<br />
1 1 ⎞ mb<br />
+ H<br />
r<br />
⎜ + ⎟ +<br />
= −<br />
Dt x y n<br />
⎜ −<br />
i<br />
ρ( hu<br />
) ρ<br />
⎟<br />
⎝ ∂ ∂ ⎠ ⎝<br />
i ⎠ ρi<br />
where H r is <strong>the</strong> effective <strong>ice</strong> thickness derived from measurement <strong>of</strong> <strong>the</strong> two-way travel time<br />
<strong>of</strong> a radar pulse transmitted through <strong>the</strong> <strong>ice</strong> shelf and an assumption <strong>of</strong> constant refractive<br />
index, n i , and m s and m b are surface and <strong>basal</strong> mass fluxes, defined as positive for a<br />
downwards mass flux. O<strong>the</strong>r symbols have <strong>the</strong>ir conventional meanings, with <strong>the</strong> subscript i<br />
indicating values for solid <strong>ice</strong>. In deriving <strong>the</strong> above expression, we have made <strong>the</strong><br />
conventional assumption that <strong>the</strong> density varies only with depth below <strong>the</strong> surface and is<br />
o<strong>the</strong>rwise spatially and temporally constant, and have made use <strong>of</strong> <strong>the</strong> fact that <strong>the</strong> refractive<br />
index <strong>of</strong> <strong>ice</strong> and firn is linearly related to density. We have also assumed that <strong>the</strong> thickness is<br />
measured between an internal radar reflector, which we have taken to be a material surface,<br />
and <strong>the</strong> <strong>ice</strong> shelf base. The term (h u ) refers to <strong>the</strong> density at <strong>the</strong> depth <strong>of</strong> this upper<br />
reflecting horizon. If <strong>the</strong> upper reference horizon is deep enough to lie within solid <strong>ice</strong>, <strong>the</strong><br />
last term on <strong>the</strong> left-hand side is identically zero; o<strong>the</strong>rwise <strong>the</strong> size <strong>of</strong> this last term, which<br />
physically results from compaction beneath <strong>the</strong> reference depth, must be estimated.<br />
We can apply this same equation to <strong>the</strong> thickness, H ri , measured between two internal<br />
reflectors, and if <strong>the</strong>se are both within <strong>the</strong> solid <strong>ice</strong> below <strong>the</strong> firn layer and are both material
¡<br />
¢<br />
FRISP Report No. 14 (2003) 2<br />
surfaces, we arrive at a simple expression for <strong>the</strong> horizontal divergence term that appears<br />
above:<br />
⎛ ∂u<br />
∂v<br />
⎞ 1 DH<br />
ri<br />
⎜ + ⎟ = −<br />
⎝ ∂x<br />
∂y<br />
⎠ H<br />
ri<br />
Dt<br />
Making use <strong>of</strong> <strong>the</strong> above two equations we can derive <strong>the</strong> <strong>basal</strong> <strong>melt</strong> <strong>rate</strong> <strong>of</strong> an <strong>ice</strong> shelf<br />
directly from repeat radar sounding. If two suitably deep internal reflectors are not available<br />
<strong>the</strong> horizontal divergence can be measured sepa<strong>rate</strong>ly by <strong>the</strong> repeat survey <strong>of</strong> a pattern <strong>of</strong><br />
surface markers.<br />
Method<br />
The practical application <strong>of</strong> <strong>the</strong> technique is illust<strong>rate</strong>d in Figure 1. At <strong>the</strong> start <strong>of</strong> <strong>the</strong><br />
experiment a column <strong>of</strong> <strong>ice</strong> was marked and <strong>the</strong> thickness between a prominent internal radar<br />
reflector and <strong>the</strong> <strong>ice</strong> shelf base was measured. Each thickness measurement actually<br />
comprised six individual soundings, spaced at short intervals, to ensure <strong>the</strong> correct<br />
identification <strong>of</strong> stable internal reflectors. The radar was a step frequency system (Corr et al.,<br />
2002) configured to respond as an equivalent pulsed system having a centre frequency close<br />
to 300 MHz and a bandwidth <strong>of</strong> between 60 and 160 MHz. Since both <strong>the</strong> amplitude and<br />
phase <strong>of</strong> <strong>the</strong> radar signal were recorded, changes in <strong>the</strong> range <strong>of</strong> reflectors could be measured<br />
to a small fraction (~1%) <strong>of</strong> <strong>the</strong> wavelength, giving sub-centimetre accuracy on <strong>the</strong> <strong>ice</strong><br />
thickness changes. Survey poles were set in <strong>the</strong> snow surface around <strong>the</strong> site <strong>of</strong> <strong>the</strong> radar<br />
sounding, and inter-stake distances were measured <strong>using</strong> <strong>GPS</strong> techniques. The stake pattern<br />
was triangular to provide measurements <strong>of</strong> extension or compression in three directions.<br />
Trimble 4000 series <strong>GPS</strong> receivers were use to record dual frequency, carrier phase data.<br />
FastStatic TM processing techniques <strong>the</strong>n yielded inter-stake distances to ~1 cm or better with<br />
observation times as short as 8-10 min. The survey was designed so that all <strong>the</strong> required<br />
inter-stake distances were directly-observed <strong>GPS</strong> baselines, ensuring no degradation <strong>of</strong><br />
accuracy through <strong>the</strong> need to infer distances from <strong>the</strong> measured coordinates <strong>of</strong> <strong>the</strong> (moving)<br />
survey markers.<br />
£ ¤ £ ¥<br />
Figure 1: Ice column at times t 1 and t 2 . Repeat observations <strong>of</strong> (h u -h b ) are made. The <strong>rate</strong> at<br />
which this quantity changes is determined by horizontal convergence/divergence <strong>of</strong> <strong>the</strong> <strong>ice</strong><br />
flow, measured by repeat survey <strong>of</strong> surface markers, and <strong>basal</strong> <strong>melt</strong>ing/freezing.
FRISP Report No. 14 (2003) 3<br />
On subsequent visits all <strong>the</strong> measurements were repeated. The initial and repeat radar<br />
soundings provided <strong>the</strong> <strong>ice</strong> thickness and material derivative <strong>of</strong> thickness that appear in <strong>the</strong><br />
above equations. Given a suitable selection <strong>of</strong> internal radar reflectors <strong>the</strong>se were <strong>the</strong> only<br />
measurements that needed to be made. Where <strong>the</strong> observable internal layering did not extend<br />
deep enough, we estimated <strong>the</strong> parameters in <strong>the</strong> compaction term from regional surface<br />
accumulation and temperature data. We also used <strong>the</strong> results <strong>of</strong> <strong>the</strong> <strong>GPS</strong> surveys to deduce<br />
<strong>the</strong> horizontal divergence term. Where both radar and <strong>GPS</strong> measurements <strong>of</strong> <strong>the</strong> latter were<br />
available, we favoured <strong>the</strong> former, this being a point measurement on <strong>the</strong> <strong>ice</strong> column <strong>of</strong><br />
interest ra<strong>the</strong>r than an areal average over a finite region surrounding <strong>the</strong> radar site.<br />
Most <strong>of</strong> <strong>the</strong> sites discussed here (Figure 2) were established in <strong>the</strong> austral summer <strong>of</strong><br />
2000/01, with repeat visits being made that summer over periods ranging from a few days up<br />
to one month. Some <strong>of</strong> <strong>the</strong>se sites were revisited in 2001/02, giving estimates <strong>of</strong> year-round<br />
<strong>melt</strong>ing, and fur<strong>the</strong>r sites were established, for which only summer (2002) <strong>melt</strong> <strong>rate</strong>s are so<br />
far available.<br />
Results<br />
Time-series measurements on George VI Ice Shelf and Rutford Ice Stream<br />
At both <strong>the</strong>se locations (see map) <strong>the</strong> radar sites were visited repeatedly during <strong>the</strong><br />
course <strong>of</strong> <strong>the</strong> initial survey. These experiments provide <strong>the</strong> best estimate <strong>of</strong> <strong>the</strong> true precision<br />
<strong>of</strong> <strong>the</strong> thickness change measurements, taking into account not only <strong>the</strong> performance <strong>of</strong> <strong>the</strong><br />
radar but also <strong>the</strong> errors associated with repositioning <strong>the</strong> system over <strong>the</strong> same column <strong>of</strong><br />
<strong>ice</strong>. Likely errors in positioning are ~1 cm over short periods, but probably rise to ~10 cm<br />
over <strong>the</strong> year-long observations.<br />
72°S<br />
76°S<br />
George VI<br />
Ice Shelf<br />
1<br />
2 3 4<br />
78°S<br />
70°W<br />
Ronne<br />
Ice Shelf<br />
60°W<br />
74°S<br />
Korff<br />
Ice Rise<br />
71°W<br />
78.8°S<br />
3<br />
4<br />
2<br />
1<br />
70.5°W<br />
79°S<br />
80°W<br />
78.9°S<br />
71.5°W<br />
Rutford Ice Stream<br />
80°S<br />
Figure 2: Map showing <strong>the</strong> location <strong>of</strong> <strong>the</strong> measurement sites discussed in <strong>the</strong> text (black<br />
stars). Floating <strong>ice</strong> is shaded.
FRISP Report No. 14 (2003) 4<br />
Phase difference(degrees)<br />
0.107<br />
0.077<br />
0.046<br />
0.015<br />
Thickness change (m)<br />
Days since initial visit<br />
Figure 3: Thickness change observed over a twelve-day period on George VI Ice Shelf. The<br />
scales indicate <strong>the</strong> position <strong>of</strong> <strong>the</strong> <strong>ice</strong> shelf base relative to its initial depth, i.e. <strong>the</strong> <strong>ice</strong> column<br />
is thinning. Dotted lines are two standard deviations above and below <strong>the</strong> best fit (solid) line.<br />
Figure 3 shows <strong>the</strong> results from nine observations (each comprising six individual<br />
thickness soundings) at S72° 47' 41", W070° 20' 16" on George VI Ice Shelf. The data are<br />
displayed as a change in phase <strong>of</strong> <strong>the</strong> return signal, and <strong>the</strong> equivalent change in path length,<br />
from that <strong>of</strong> <strong>the</strong> original measurement. The standard deviation about <strong>the</strong> best fit straight line<br />
is 2° <strong>of</strong> phase, equivalent to 1.5 mm <strong>of</strong> <strong>ice</strong>. Once <strong>the</strong> contributions <strong>of</strong> compaction and<br />
horizontal divergence have been taken into account, <strong>the</strong> observed thinning <strong>rate</strong> implies <strong>basal</strong><br />
<strong>melt</strong>ing at a <strong>rate</strong> <strong>of</strong> 2.78±0.08 m yr -1 over <strong>the</strong> twelve-day period (Corr et al., 2002). This is<br />
somewhat higher than <strong>the</strong> regional average equilibrium <strong>melt</strong> <strong>rate</strong>, calculated by Potter and<br />
Paren (1985) as 2.17±0.14 m yr -1 . Since <strong>melt</strong>ing in this region is driven by <strong>the</strong> inflow <strong>of</strong><br />
warm Circumpolar Deep Water, which has a fairly constant temperature year-round, we<br />
would not anticipate a large seasonal variation in <strong>the</strong> <strong>basal</strong> <strong>melt</strong>ing.<br />
0.02<br />
0<br />
Thickness change (m)<br />
-0.02<br />
-0.04<br />
-0.06<br />
-0.08<br />
-0.10<br />
-0.12<br />
-0.14<br />
14 16 18 20 22 24 26 28 30 32<br />
Days since 1 January 2001<br />
Figure 4: Thickness change observed over a fifteen-day period on Rutford Ice Stream. The<br />
scales indicate <strong>the</strong> position <strong>of</strong> <strong>the</strong> <strong>ice</strong> shelf base relative to its initial depth, i.e. <strong>the</strong> <strong>ice</strong> column<br />
is thickening. Dotted lines are two standard deviations above and below <strong>the</strong> best fit (solid)<br />
line. The straight, solid line indicates <strong>the</strong> thickening trend with <strong>the</strong> tidal component removed.
FRISP Report No. 14 (2003) 5<br />
<br />
0.4<br />
0<br />
-. / 01 / 2 3 /5406 798;:-2 / 3 8 ? :/ @BA CD3 6 7FE 8 3
FRISP Report No. 14 (2003) 6<br />
Spatial and temporal pattern <strong>of</strong> <strong>melt</strong>ing near <strong>the</strong> coast <strong>of</strong> Korff Ice Rise<br />
Four sepa<strong>rate</strong> sites were established at 5 km intervals along a line approximately<br />
perpendicular to <strong>the</strong> coast <strong>of</strong> Korff Ice Rise (Figure 2). The location <strong>of</strong> Site 3 coincided with<br />
that <strong>of</strong> an oceanographic mooring site (also Site 3), set up in January 1996 (Nicholls and<br />
Makinson, 1998). Radar measurements have been made at each site on three occasions: once<br />
when <strong>the</strong>y were set up in early January 2001, again in early February 2001, and once more in<br />
late December 2001. The <strong>melt</strong> <strong>rate</strong>s measured over one month and one year at each site are<br />
shown in Table 1.<br />
Table 1: Melt <strong>rate</strong>s calculated at sites near Korff Ice Rise (Figure 2).<br />
Site Ice depth (m) Time diff (days) Melt <strong>rate</strong> (m yr -1 ) Error (m yr -1 )<br />
Korff 1 783 31.9 0.87 0.02<br />
350.8 0.83 0.003<br />
Korff 2 802 31.2 0.73 0.02<br />
350.0 0.59 0.003<br />
Korff 3 816 36.7 0.78 0.02<br />
350.7 0.56 0.003<br />
Korff 4 821 31.8 0.68 0.02<br />
347.9 0.43 0.003<br />
The most striking feature <strong>of</strong> <strong>the</strong>se numbers is that <strong>melt</strong>ing <strong>rate</strong>s are significantly<br />
above <strong>the</strong> year-round average during <strong>the</strong> summer (January) at all sites. The reason for this is<br />
apparent in <strong>the</strong> record <strong>of</strong> ocean temperature recorded at Site 3 (Nicholls and Makinson,<br />
1998). The oceanographic data are not contemporaneous with <strong>the</strong> radar measurements, but<br />
subsequent observations suggest that <strong>the</strong> phasing <strong>of</strong> <strong>the</strong> annual cycle in water temperature<br />
does not vary much from year to year. The highest temperatures throughout <strong>the</strong> water<br />
column are observed between November and March, and coincide with <strong>the</strong> arrival in this part<br />
<strong>of</strong> Ronne Depression <strong>of</strong> High Salinity Shelf Water (HSSW) that was gene<strong>rate</strong>d at <strong>the</strong> Ronne<br />
Ice Front during <strong>the</strong> previous winter.<br />
Ano<strong>the</strong>r obvious feature <strong>of</strong> <strong>the</strong> figures in Table 1 is <strong>the</strong> generally decreasing <strong>melt</strong> <strong>rate</strong><br />
with increasing distance from <strong>the</strong> coast, which might be explained by upwelling <strong>of</strong> <strong>the</strong> warm,<br />
inflowing HSSW at <strong>the</strong> coast. In general, an <strong>ice</strong> shelf thins in <strong>the</strong> direction <strong>of</strong> flow, so, if <strong>the</strong><br />
upper layers <strong>of</strong> <strong>the</strong> underlying seawater are freshened by <strong>melt</strong>, <strong>the</strong> isopycnal surfaces in <strong>the</strong><br />
ocean should slope up quasi-parallel to <strong>the</strong> <strong>ice</strong> shelf base. This should promote current shear<br />
in <strong>the</strong> water column perpendicular to <strong>the</strong> direction <strong>of</strong> <strong>ice</strong> flow, with <strong>the</strong> upper part flowing to<br />
<strong>the</strong> left (looking in <strong>the</strong> direction <strong>of</strong> <strong>ice</strong> flow) and <strong>the</strong> lower part flowing to <strong>the</strong> right. Such<br />
motion would cause upwelling at a coast lying on <strong>the</strong> right-hand side (looking in <strong>the</strong> direction<br />
<strong>of</strong> <strong>ice</strong> flow), such as <strong>the</strong> western coast <strong>of</strong> Korff Ice Rise, and downwelling at a coast on <strong>the</strong><br />
left. Such an explanation <strong>of</strong> <strong>the</strong> spatial pattern <strong>of</strong> <strong>melt</strong>ing near Korff Ice Rise is consistent<br />
with <strong>the</strong> finding <strong>of</strong> Makinson (2002) that tidally-induced vertical mixing in <strong>the</strong> water column<br />
at Site 3 is insufficient to supply <strong>the</strong> heat needed to <strong>melt</strong> <strong>the</strong> <strong>ice</strong> shelf at <strong>the</strong> inferred <strong>rate</strong><br />
(somewhat less than <strong>the</strong> observed <strong>rate</strong> reported here). Makinson (2002) concluded that most<br />
<strong>of</strong> <strong>the</strong> heat must <strong>the</strong>refore be supplied by advection within <strong>the</strong> <strong>ice</strong>-ocean boundary layer. The<br />
increasing seasonality <strong>of</strong> <strong>the</strong> <strong>melt</strong>ing with increasing distance from <strong>the</strong> coast could also be<br />
explained through this mechanism. The increased flow <strong>of</strong> HSSW during <strong>the</strong> November to<br />
March period could lead to stronger upwelling and more efficient advection <strong>of</strong> <strong>the</strong> heat away<br />
from <strong>the</strong> site <strong>of</strong> coastal upwelling.
FRISP Report No. 14 (2003) 7<br />
Spatial pattern <strong>of</strong> <strong>melt</strong>ing on north-west Ronne Ice Shelf<br />
In <strong>the</strong> austral summer <strong>of</strong> 2001/02, four radar sites were established ~50 km south <strong>of</strong><br />
<strong>the</strong> Ronne Ice Front, spanning <strong>the</strong> Ronne Depression. They were reoccupied 2-3 weeks<br />
following <strong>the</strong>ir establishment. Two <strong>of</strong> <strong>the</strong>m (sites 1 and 4) were situated (unwittingly) on <strong>the</strong><br />
downstream end <strong>of</strong> <strong>the</strong> two westernmost bodies <strong>of</strong> marine <strong>ice</strong> that form in <strong>the</strong> flow shadows<br />
<strong>of</strong> Fowler Peninsula and Cape Zumberge. At site 1 <strong>the</strong> <strong>ice</strong> shelf base could not be<br />
unambiguously detected, but at site 4 a weak <strong>basal</strong> return was observed through what appears<br />
to be about 60 m <strong>of</strong> marine <strong>ice</strong>. At sites 2 and 3 strong returns were found, consistent with a<br />
pure <strong>ice</strong>-water <strong>basal</strong> interface at <strong>the</strong>se locations. The derived <strong>melt</strong> <strong>rate</strong>s for <strong>the</strong> three sites<br />
with identifiable <strong>basal</strong> returns are given in Table 2.<br />
Table 2: Melt <strong>rate</strong>s calculated at sites on north-west Ronne Ice Shelf (Figure 2).<br />
Site Ice depth (m) Time diff (days) Melt <strong>rate</strong> (m yr -1 ) Error (m yr -1 )<br />
NW Ronne 2 365 15.7 0.12 0.04<br />
NW Ronne 3 398 19.1 0.00 0.04<br />
NW Ronne 4 334 15.0 1.41 0.08<br />
Site 4 is about 40 km to <strong>the</strong> west <strong>of</strong> <strong>the</strong> penultimate site on <strong>the</strong> flowline studied by<br />
Jenkins and Doake (1991). At <strong>the</strong> time <strong>of</strong> <strong>the</strong>ir study this site was about <strong>the</strong> same distance<br />
from <strong>the</strong> <strong>ice</strong> front as <strong>the</strong> north-west Ronne sites are from <strong>the</strong> current <strong>ice</strong> front. Jenkins and<br />
Doake (1991) estimated a steady state <strong>melt</strong> <strong>rate</strong> <strong>of</strong> 1.6±0.5 m yr -1 at <strong>the</strong>ir site, consistent with<br />
<strong>the</strong> recent findings at site 4. However, distance from <strong>the</strong> <strong>ice</strong> front is clearly not <strong>the</strong> only<br />
factor determining <strong>the</strong> <strong>melt</strong> <strong>rate</strong>, as <strong>the</strong> sharp decline to near zero <strong>melt</strong>ing west <strong>of</strong> site 4<br />
indicates. The controlling factor is most likely <strong>the</strong> route taken by <strong>the</strong> inflowing HSSW,<br />
which is likely to follow <strong>the</strong> eastern side <strong>of</strong> Ronne Depression and <strong>the</strong>refore pass directly<br />
beneath site 4. Models typically show stronger <strong>melt</strong>ing on <strong>the</strong> eastern side <strong>of</strong> <strong>the</strong> depression<br />
(Gerdes et al., 1999; Jenkins and Holland, 2002a,b), and <strong>the</strong> channel <strong>of</strong> thinner <strong>ice</strong> that<br />
extends in from <strong>the</strong> <strong>ice</strong> front here (note <strong>the</strong> difference in thickness between sites 3 and 4) is<br />
probably a result <strong>of</strong> this. Observations at <strong>the</strong> <strong>ice</strong> front typically show Ice Shelf Water<br />
dominating much <strong>of</strong> Ronne Depression, and if this water mass occupies <strong>the</strong> water column<br />
beneath sites 2 and 3, near-zero <strong>melt</strong>ing is perhaps not surprising. It will be interesting to see<br />
if such low <strong>melt</strong> <strong>rate</strong>s are only a summer feature, with higher <strong>melt</strong>ing during winter when <strong>the</strong><br />
inflow <strong>of</strong> HSSW becomes more vigorous, but fur<strong>the</strong>r observations at <strong>the</strong>se sites are required<br />
before that question can be answered.<br />
Conclusions<br />
We have described an experimental technique whereby <strong>the</strong> <strong>melt</strong> <strong>rate</strong> at <strong>the</strong> base <strong>of</strong> an<br />
<strong>ice</strong> shelf can be measured at high spatial and temporal resolution. Compared with traditional<br />
techniques used to estimate steady state <strong>melt</strong> <strong>rate</strong>s, <strong>the</strong>se observations provide new insight<br />
into <strong>the</strong> processes operating in <strong>the</strong> ocean beneath <strong>Antarctic</strong>a’s <strong>ice</strong> <strong>shelves</strong>.<br />
Our observations <strong>of</strong> <strong>melt</strong>ing on Ronne Ice Shelf are broadly consistent with earlier<br />
estimates <strong>of</strong> steady state <strong>melt</strong>ing, suggesting that <strong>the</strong> regions we have studied are close to<br />
equilibrium. On George VI Ice Shelf our measured <strong>melt</strong> <strong>rate</strong> was significantly higher than<br />
<strong>the</strong> regional average steady state <strong>melt</strong> <strong>rate</strong>. However, <strong>the</strong> limited scope <strong>of</strong> our observations<br />
(this was primarily a test site for <strong>the</strong> technique) means that we are unable to ascribe this<br />
difference to ei<strong>the</strong>r spatial or temporal variability in <strong>melt</strong>ing or to thinning <strong>of</strong> <strong>the</strong> <strong>ice</strong> shelf.
FRISP Report No. 14 (2003) 8<br />
Data from <strong>the</strong> interior <strong>of</strong> Ronne Ice Shelf suggest proximity to a sou<strong>the</strong>rn or eastern<br />
boundary implies relatively high <strong>melt</strong>ing and suppressed seasonality. These observations are<br />
consistent with a picture in which localised upwelling near <strong>the</strong> boundaries and horizontal<br />
advection <strong>of</strong> heat away from <strong>the</strong> upwelling sites supplies <strong>the</strong> heat to fuel <strong>basal</strong> <strong>melt</strong>ing over<br />
large areas, ra<strong>the</strong>r than one in which <strong>the</strong> heat is supplied by more uniform and widespread<br />
vertical diffusion. In contrast, our observations from nearer <strong>the</strong> <strong>ice</strong> front, which show high<br />
<strong>melt</strong> <strong>rate</strong>s above <strong>the</strong> location <strong>of</strong> a deep inflow <strong>of</strong> HSSW, seem more consistent with <strong>the</strong> latter<br />
picture, with <strong>the</strong> heat for <strong>melt</strong>ing presumably being supplied locally by vertical diffusion.<br />
Tides probably provide <strong>the</strong> energy for enhanced vertical mixing here, because <strong>the</strong> eastern side<br />
<strong>of</strong> Ronne Depression lies on <strong>the</strong> western boundary <strong>of</strong> a region characterised by high tidal<br />
dissipation <strong>rate</strong>s (Makinson and Nicholls, 1999), owing to <strong>the</strong> relatively shallow water<br />
column and strong tidal currents. Although strong vertical mixing is not in itself sufficient to<br />
gene<strong>rate</strong> high <strong>melt</strong> <strong>rate</strong>s, <strong>the</strong> position <strong>of</strong> site 4 over <strong>the</strong> HSSW inflow would appear to<br />
guarantee a ready supply <strong>of</strong> ocean heat. It is probable that <strong>the</strong> sharp transition to lower<br />
<strong>melt</strong>ing to <strong>the</strong> west <strong>of</strong> north-west Ronne site 4 results from a combination <strong>of</strong> just lower water<br />
temperatures and a marked decrease in vertical mixing. Fur<strong>the</strong>r observations at <strong>the</strong>se sites,<br />
and in particular <strong>the</strong> installation <strong>of</strong> oceanographic instruments to monitor <strong>the</strong> water column<br />
should help to clarify <strong>the</strong> source <strong>of</strong> <strong>the</strong> high spatial gradients in <strong>basal</strong> <strong>melt</strong>ing.<br />
References<br />
Corr, H.F.J., A. Jenkins, K.W. Nicholls and C.S.M. Doake. 2002. Precise measurement <strong>of</strong><br />
changes in <strong>ice</strong>-shelf thickness by phase-sensitive radar to determine <strong>basal</strong> <strong>melt</strong> <strong>rate</strong>s,<br />
Geophys. Res. Lett., 29(8), 10.1029/2001GL014618.<br />
Gerdes, R., J. Determann and K. Grosfeld. 1999. Ocean circulation beneath Filchner-Ronne<br />
Ice Shelf from three-dimensional model results, J. Geophys. Res., 104(C7), 15,827–<br />
15,842.<br />
Jenkins, A. and C.S.M. Doake. 1991. Ice-ocean interaction on Ronne Ice Shelf, <strong>Antarctic</strong>a,<br />
J. Geophys. Res., 96(C1), 791–813.<br />
Jenkins, A. and D.M. Holland. 2002a. A model study <strong>of</strong> circulation beneath Filchner-Ronne<br />
Ice Shelf, <strong>Antarctic</strong>a: Implications for bottom water formation, Geophys. Res. Lett.,<br />
29(8), 10.1029/2001GL014589.<br />
Jenkins, A. and D.M. Holland. 2002b. Correction to “A model study <strong>of</strong> circulation beneath<br />
Filchner-Ronne Ice Shelf, <strong>Antarctic</strong>a: Implications for bottom water formation” by<br />
Adrian Jenkins and David M. Holland, Geophys. Res. Lett., 29(13),<br />
10.1029/2002GL015647.<br />
Makinson, K. 2002. Tidal Currents and Vertical Mixing Processes beneath Filchner-Ronne<br />
Ice Shelf, Ph.D. Thesis, Open University, xxiv+208 pp.<br />
Makinson, K. and K.W. Nicholls. 1999. Modeling tidal currents beneath Filchner-Ronne Ice<br />
Shelf and on <strong>the</strong> adjacent continental shelf: <strong>the</strong>ir effect on mixing and transport, J.<br />
Geophys. Res., 104(C6), 13,449–13,465.<br />
Nicholls, K.W. and K. Makinson. 1998. Ocean circulation beneath <strong>the</strong> western Ronne Ice<br />
Shelf, as derived from in situ measurements <strong>of</strong> water currents and properties, in<br />
Ocean, Ice and Atmosphere: Interactions at <strong>the</strong> <strong>Antarctic</strong> Continental Margin, edited<br />
by S.S. Jacobs and R.F. Weiss, Antarct. Res. Ser., 75, 301–318.<br />
Potter, J.R. and J.G. Paren. 1985. Interaction between <strong>ice</strong> shelf and ocean in George VI<br />
Sound, <strong>Antarctic</strong>a, in Oceanology <strong>of</strong> <strong>the</strong> <strong>Antarctic</strong> Continental Shelf, edited by S.S.<br />
Jacobs, Antarct. Res. Ser., 43, 35–58.