- Page 1 and 2:
BEHAVIORAL SURVEILLANCE SURVEYS GUI
- Page 3 and 4:
Family Health International (FHI) H
- Page 5 and 6:
Chapter 7 Analysis and interpretati
- Page 7 and 8:
3. Choosing populations for behavio
- Page 9 and 10:
G UIDELINES FOR REPEATED BEHAVIORAL
- Page 11 and 12:
Recognizing that HIV surveillance d
- Page 13 and 14:
Different approaches to collecting
- Page 15 and 16:
The principal rationale for focusin
- Page 17 and 18:
It is not possible to validate data
- Page 19 and 20:
GUIDELINES FOR REPEATED BEHAVIORAL
- Page 21 and 22:
The process of building partnership
- Page 23 and 24:
Funders of HIV prevention activitie
- Page 25 and 26:
What is to be measured ? Indicators
- Page 27 and 28:
Step 7 : Constructing a sampling fr
- Page 29 and 30:
Step 12 : Data collection and super
- Page 31 and 32:
choosing population groups GUIDELIN
- Page 33 and 34:
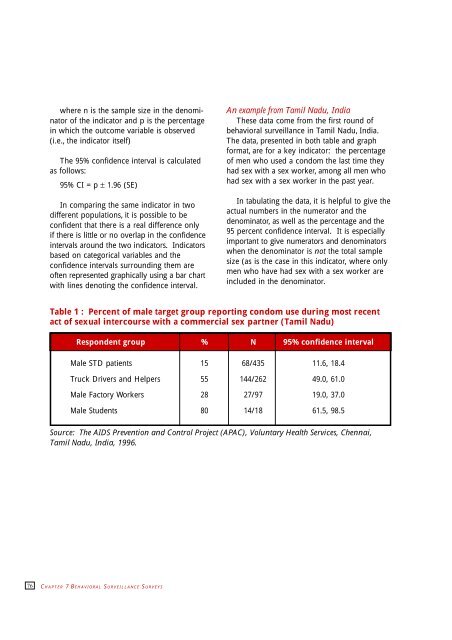
the spread of HIV. For this reason,
- Page 35 and 36: In some circumstances, public healt
- Page 37 and 38: GUIDELINES FOR REPEATED BEHAVIORAL
- Page 39 and 40: The majority of sub-populations of
- Page 41 and 42: In the end, the issue boils down to
- Page 43 and 44: In looking at behaviors of hard-to-
- Page 45 and 46: Maps derived from program planning
- Page 47 and 48: Selecting primary sampling units (c
- Page 49 and 50: ...when measures of size are not av
- Page 51 and 52: If there is no reason to believe th
- Page 53 and 54: Figure 3 : Decision tree for first-
- Page 55 and 56: Implications of alternative samplin
- Page 57 and 58: Table 5 : Values of Z 1-α and Z 1-
- Page 59 and 60: Table 6 : Sample size requirements
- Page 61 and 62: equired. In this case, the pros and
- Page 63 and 64: Should one- or two-tailed z-score v
- Page 65 and 66: Other measurement issues for BSS Th
- Page 67 and 68: A “low-tech” solution to the pr
- Page 69 and 70: 5 Weighting in multi-stage sampling
- Page 71 and 72: Figure 6 : Procedures for calculati
- Page 73 and 74: Calculating weights from sampling p
- Page 75 and 76: Calculating standard errors with mu
- Page 77 and 78: 6 Adapting and using questionnaires
- Page 79 and 80: Some attempts have in the past been
- Page 81 and 82: Informed consent Confidentiality an
- Page 83 and 84: GUIDELINES FOR REPEATED BEHAVIORAL
- Page 85: Recommended Methods of Statistical
- Page 89 and 90: Table 2 : Reported number of non-re
- Page 91 and 92: False conclusions: the danger of co
- Page 93 and 94: Analysis of trends in behavior over
- Page 95 and 96: Changes in sampling methodology ove
- Page 97 and 98: 8 Using the data collected to impro
- Page 99 and 100: Improving prevention programs As a
- Page 101 and 102: Finally, information about HIV and
- Page 103 and 104: Figure 9 : HIV and STD prevalence,
- Page 105 and 106: 9 Indicators This guide identifies
- Page 107 and 108: The standard questionnaires are acc
- Page 109 and 110: INDICATORS Page INDICATORS FOR YOUT
- Page 111 and 112: INDICATORS Page INDICATORS FOR MEN
- Page 113 and 114: KEY INDICATORS What follows is a fu
- Page 115 and 116: The indicator uses promoted data. O
- Page 117 and 118: To be counted the numerator for thi
- Page 119 and 120: Strengths and limitations Some meas
- Page 121 and 122: Adult Indicator 5 Consistent condom
- Page 123 and 124: Adult Indicator 7 (men only) Number
- Page 125 and 126: Adult Indicator 9 Consistent condom
- Page 127 and 128: Adult Indicator 11 Population seeki
- Page 129 and 130: Adult Indicator 12 Exposure to inte
- Page 131 and 132: Youth Indicator 2 No incorrect beli
- Page 133 and 134: Youth Indicator 4 Youth sexually ac
- Page 135 and 136: Youth Indicator 6 Number of sexual
- Page 137 and 138:
Youth Indicator 8 Consistent condom
- Page 139 and 140:
Youth Indicator 10 Commercial sex a
- Page 141 and 142:
Youth Indicator 14 Exposure to inte
- Page 143 and 144:
Female Sex Worker Indicator 2 No in
- Page 145 and 146:
Female Sex Worker Indicator 5 Sex w
- Page 147 and 148:
Indicators for men who have sex wit
- Page 149 and 150:
Men Who Have Sex With Men Indicator
- Page 151 and 152:
Men who have sex with men Indicator
- Page 153 and 154:
Men Who Have Sex With Men Indicator
- Page 155 and 156:
Men Who Have Sex With Men Indicator
- Page 157 and 158:
Indicators for injecting drug users
- Page 159 and 160:
Injecting Drug User Indicator 3 Inj
- Page 161 and 162:
Injecting Drug User Indicator 4 Inj
- Page 163 and 164:
Injecting Drug User Indicator 6 Inj
- Page 165 and 166:
Injecting Drug User Indicator 8 Dru
- Page 167 and 168:
Injecting Drug User Indicator 10 Dr
- Page 169 and 170:
Suggested Reading Brown T, Sittitra
- Page 171 and 172:
QUESTIONNAIRE For Adult Target Grou
- Page 173 and 174:
The ADULT questionnaire includes th
- Page 175 and 176:
FHI 1999 HIV/AIDS/STD BEHAVIORAL SU
- Page 177 and 178:
FHI 2000 HIV/AIDS/STD BEHAVIORAL SU
- Page 179 and 180:
FHI 2000 HIV/AIDS/STD BEHAVIORAL SU
- Page 181 and 182:
FHI 2000 HIV/AIDS/STD BEHAVIORAL SU
- Page 183 and 184:
FHI 2000 HIV/AIDS/STD BEHAVIORAL SU
- Page 185 and 186:
FHI 2000 HIV/AIDS/STD BEHAVIORAL SU
- Page 187 and 188:
FHI 2000 HIV/AIDS/STD BEHAVIORAL SU
- Page 189 and 190:
FHI 2000 HIV/AIDS/STD BEHAVIORAL SU
- Page 191 and 192:
POSSIBLE ADDITIONAL QUESTIONS Commu
- Page 193 and 194:
STD Treatment seeking behaviors No.
- Page 195 and 196:
STD Treatment seeking behaviors (co
- Page 197 and 198:
QUESTIONNAIRE For Unmarried Male An
- Page 199 and 200:
The YOUTH questionnaire includes th
- Page 201 and 202:
FHI 2000 HIV/AIDS/STD BEHAVIORAL SU
- Page 203 and 204:
FHI 2000 HIV/AIDS/STD BEHAVIORAL SU
- Page 205 and 206:
FHI 2000 HIV/AIDS/STD BEHAVIORAL SU
- Page 207 and 208:
FHI 2000 HIV/AIDS/STD BEHAVIORAL SU
- Page 209 and 210:
FHI 2000 HIV/AIDS/STD BEHAVIORAL SU
- Page 211 and 212:
FHI 2000 HIV/AIDS/STD BEHAVIORAL SU
- Page 213 and 214:
POSSIBLE ADDITIONAL QUESTIONS Commu
- Page 215 and 216:
No. Questions and filters Coding ca
- Page 217 and 218:
Stigma and Discrimination No. Quest
- Page 219 and 220:
FAMILY HEALTH INTERNATIONAL (FHI) H
- Page 221 and 222:
FHI 2000 HIV/AIDS/STD BEHAVIORAL SU
- Page 223 and 224:
FHI 2000 HIV/AIDS/STD BEHAVIORAL SU
- Page 225 and 226:
FHI 2000 HIV/AIDS/STD BEHAVIORAL SU
- Page 227 and 228:
FHI 2000 HIV/AIDS/STD BEHAVIORAL SU
- Page 229 and 230:
FHI 2000 HIV/AIDS/STD BEHAVIORAL SU
- Page 231 and 232:
FHI 2000 HIV/AIDS/STD BEHAVIORAL SU
- Page 233 and 234:
POSSIBLE ADDITIONAL QUESTIONS Commu
- Page 235 and 236:
STD Treatment seeking behaviors No.
- Page 237 and 238:
STD Treatment seeking behaviors (co
- Page 239 and 240:
QUESTIONNAIRE For Men Who Have Sex
- Page 241 and 242:
The MSM questionnaire includes the
- Page 243 and 244:
FHI 2000 HIV/AIDS/STD BEHAVIORAL SU
- Page 245 and 246:
FHI 2000 HIV/AIDS/STD BEHAVIORAL SU
- Page 247 and 248:
FHI 2000 HIV/AIDS/STD BEHAVIORAL SU
- Page 249 and 250:
FHI 2000 HIV/AIDS/STD BEHAVIORAL SU
- Page 251 and 252:
FHI 2000 HIV/AIDS/STD BEHAVIORAL SU
- Page 253 and 254:
FHI 2000 HIV/AIDS/STD BEHAVIORAL SU
- Page 255 and 256:
FHI 2000 HIV/AIDS/STD BEHAVIORAL SU
- Page 257 and 258:
FHI 2000 HIV/AIDS/STD BEHAVIORAL SU
- Page 259 and 260:
STD Treatment seeking behaviours No
- Page 261 and 262:
No. Questions and filters Coding ca
- Page 263 and 264:
QUESTIONNAIRE For Injecting Drug Us
- Page 265 and 266:
This questionnaire includes the fol
- Page 267 and 268:
FHI 2000 HIV/AIDS/STD BEHAVIORAL SU
- Page 269 and 270:
FHI 2000 HIV/AIDS/STD BEHAVIORAL SU
- Page 271 and 272:
FHI 2000 HIV/AIDS/STD BEHAVIORAL SU
- Page 273 and 274:
FHI 2000 HIV/AIDS/STD BEHAVIORAL SU
- Page 275 and 276:
FHI 2000 HIV/AIDS/STD BEHAVIORAL SU
- Page 277 and 278:
FHI 2000 HIV/AIDS/STD BEHAVIORAL SU
- Page 279 and 280:
FHI 2000 HIV/AIDS/STD BEHAVIORAL SU
- Page 281 and 282:
FHI 2000 HIV/AIDS/STD BEHAVIORAL SU
- Page 283 and 284:
FHI 2000 HIV/AIDS/STD BEHAVIORAL SU
- Page 285 and 286:
FHI 2000 HIV/AIDS/STD BEHAVIORAL SU
- Page 287 and 288:
FHI 2000 HIV/AIDS/STD BEHAVIORAL SU
- Page 289 and 290:
EXAMPLE OF SUPERVISORS’ AND INTER
- Page 291 and 292:
A “take-all” approach is to be
- Page 293 and 294:
• To probe for additional informa
- Page 295 and 296:
Part B: How to use the Long Distanc
- Page 297 and 298:
An example of a question for which
- Page 299 and 300:
Part C: Section-by-section review o
- Page 301 and 302:
Q109. If the respondent says he/she
- Page 303 and 304:
it is asking if the respondent has
- Page 305 and 306:
Section 5 : Non-regular partners Q5
- Page 307 and 308:
Q706 : This question determines the
- Page 309 and 310:
Q910 - Q912 : Knowledge of maternal
- Page 311 and 312:
in riskier behavior (i.e., not usin
- Page 313 and 314:
Section 5 : Non-paying partners Que
- Page 315 and 316:
3 APPENDIX WORKING EXAMPLES OF SAMP
- Page 317 and 318:
For the purposes of the BSS, the ke
- Page 319 and 320:
The second stage sampling procedure
- Page 321 and 322:
Notes: 1. It may not always be poss
- Page 323 and 324:
The information from the mapping ex
- Page 325 and 326:
In Figure 3, clusters were chosen b
- Page 327 and 328:
Fieldwork assignments when the “t
- Page 329 and 330:
Figure 4 : Example of targeted snow
- Page 331 and 332:
In some settings it may not be acce
- Page 333 and 334:
Figure 6 : Steps in using the segme
- Page 335 and 336:
Figure 9 : Map of hypothetical samp
- Page 337 and 338:
In-class sampling of school youth T
- Page 339 and 340:
Alternative to “in-class” sampl
- Page 341 and 342:
found at the various locations at d
- Page 343 and 344:
What should be done if, even after
- Page 345 and 346:
FIELDWORK FORMS The following set o
- Page 347 and 348:
Form I Cluster Selection Sheet (Pro
- Page 349 and 350:
Form 2 Cluster Selection Sheet (Equ
- Page 351 and 352:
Form 3 Assignment Information Sheet
- Page 353 and 354:
Form 4 Cluster Information Sheet Su
- Page 355 and 356:
TABLE OF CHI-SQUARE STATISTICS AND
- Page 357 and 358:
Step 2 : Calculate the expected num