Behavioural Surveillance Surveys - The Wisdom of Whores
Behavioural Surveillance Surveys - The Wisdom of Whores
Behavioural Surveillance Surveys - The Wisdom of Whores

Create successful ePaper yourself
Turn your PDF publications into a flip-book with our unique Google optimized e-Paper software.
...when measures <strong>of</strong> size are not available for<br />
each PSU<br />
If the number <strong>of</strong> individuals associated<br />
with each “fixed” primary sampling unit is not<br />
known (in other words where no measure <strong>of</strong><br />
size is available), it is obviously not possible<br />
to select PSU with probability proportional<br />
to their size. In this case, each PSU should<br />
have an equal probability <strong>of</strong> being selected.<br />
<strong>The</strong> procedures for choosing a sample <strong>of</strong><br />
clusters with equal probability are described<br />
in Figure 2, and an example is provided in<br />
Table 4. Form 2 in Appendix 4 can be used<br />
in the field to assist with the selection <strong>of</strong><br />
clusters by equal probability.<br />
If a fixed number <strong>of</strong> respondent group<br />
members were to be chosen from each PSU<br />
selected, this would lead to individuals having<br />
differing overall probabilities <strong>of</strong> selection, and<br />
the final sample would be non-self-weighting.<br />
To continue the previous example, the<br />
women in the brothel with 100 employees<br />
would be less likely to be selected than the<br />
women in the brothel with 50 employees.<br />
Both brothels have the same probability <strong>of</strong><br />
selection into the sample, but because there<br />
are twice as many women in the large<br />
brothel, each woman is half as likely to end<br />
up in the final sample. Since women in small<br />
brothels might have different risk behavior<br />
than women in big brothels, this unequal<br />
probability <strong>of</strong> selection might bias the results<br />
<strong>of</strong> the survey. To correct for this potential<br />
bias, data can be weighted at the analysis<br />
stage, as described in Chapter 5. Alternatively,<br />
a fixed proportion (rather than a fixed number)<br />
<strong>of</strong> individuals associated with each site could<br />
be included in the survey — for example<br />
every third group member. This would result<br />
in a self-weighting sample. However it should<br />
be noted that an estimated measure <strong>of</strong> size<br />
will still be necessary at the time <strong>of</strong> data<br />
collection if this method is to be used.<br />
A drawback is that if the size <strong>of</strong> the population<br />
associated with the PSU is not known<br />
before-hand, using this second approach to<br />
self-weighting will result in an unpredictable<br />
final sample size.<br />
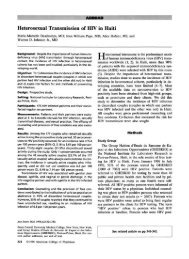
Figure 2 : Steps in the selection <strong>of</strong> a systematic-random sample <strong>of</strong> primary<br />
sampling units with equal probability<br />
1. Prepare a numbered list <strong>of</strong> primary sampling units, preferably ordered geographically<br />
(e.g., by areas <strong>of</strong> a city);<br />
2. Calculate the sampling interval (SI) by dividing the total number <strong>of</strong> PSUs in the domain<br />
(i.e. sub-population) (M) by the number <strong>of</strong> PSUs to be selected (a) — that is, SI = M/a;<br />
3. Select a random number (RS) between 1 and (SI). <strong>The</strong> PSU on the numbered list<br />
corresponding to this number will be the first sample unit;<br />
4. Subsequent units are chosen by adding the sampling interval (SI) to the number identified<br />
in step (3); that is RS + SI, RS + 2SI, RS + 3SI, etc;<br />
5. This procedure is followed until the list has been exhausted.<br />
40<br />
C H A PTER 4 B EHAV I OR A L S U R V EI L L A NC E S U R V EY S