History of DNA Discovery.pdf - Biology
History of DNA Discovery.pdf - Biology
History of DNA Discovery.pdf - Biology

You also want an ePaper? Increase the reach of your titles
YUMPU automatically turns print PDFs into web optimized ePapers that Google loves.
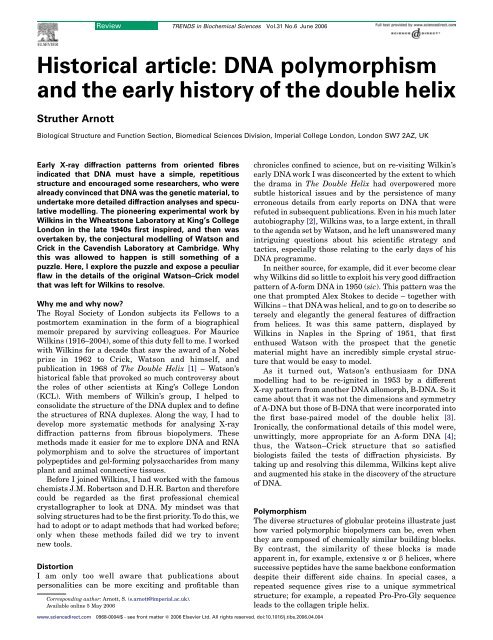
Review TRENDS in Biochemical Sciences Vol.31 No.6 June 2006<br />
Historical article: <strong>DNA</strong> polymorphism<br />
and the early history <strong>of</strong> the double helix<br />
Struther Arnott<br />
Biological Structure and Function Section, Biomedical Sciences Division, Imperial College London, London SW7 2AZ, UK<br />
Early X-ray diffraction patterns from oriented fibres<br />
indicated that <strong>DNA</strong> must have a simple, repetitious<br />
structure and encouraged some researchers, who were<br />
already convinced that <strong>DNA</strong> was the genetic material, to<br />
undertake more detailed diffraction analyses and speculative<br />
modelling. The pioneering experimental work by<br />
Wilkins in the Wheatstone Laboratory at King’s College<br />
London in the late 1940s first inspired, and then was<br />
overtaken by, the conjectural modelling <strong>of</strong> Watson and<br />
Crick in the Cavendish Laboratory at Cambridge. Why<br />
this was allowed to happen is still something <strong>of</strong> a<br />
puzzle. Here, I explore the puzzle and expose a peculiar<br />
flaw in the details <strong>of</strong> the original Watson–Crick model<br />
that was left for Wilkins to resolve.<br />
Why me and why now?<br />
The Royal Society <strong>of</strong> London subjects its Fellows to a<br />
postmortem examination in the form <strong>of</strong> a biographical<br />
memoir prepared by surviving colleagues. For Maurice<br />
Wilkins (1916–2004), some <strong>of</strong> this duty fell to me. I worked<br />
with Wilkins for a decade that saw the award <strong>of</strong> a Nobel<br />
prize in 1962 to Crick, Watson and himself, and<br />
publication in 1968 <strong>of</strong> The Double Helix [1] – Watson’s<br />
historical fable that provoked so much controversy about<br />
the roles <strong>of</strong> other scientists at King’s College London<br />
(KCL). With members <strong>of</strong> Wilkin’s group, I helped to<br />
consolidate the structure <strong>of</strong> the <strong>DNA</strong> duplex and to define<br />
the structures <strong>of</strong> RNA duplexes. Along the way, I had to<br />
develop more systematic methods for analysing X-ray<br />
diffraction patterns from fibrous biopolymers. These<br />
methods made it easier for me to explore <strong>DNA</strong> and RNA<br />
polymorphism and to solve the structures <strong>of</strong> important<br />
polypeptides and gel-forming polysaccharides from many<br />
plant and animal connective tissues.<br />
Before I joined Wilkins, I had worked with the famous<br />
chemists J.M. Robertson and D.H.R. Barton and therefore<br />
could be regarded as the first pr<strong>of</strong>essional chemical<br />
crystallographer to look at <strong>DNA</strong>. My mindset was that<br />
solving structures had to be the first priority. To do this, we<br />
had to adopt or to adapt methods that had worked before;<br />
only when these methods failed did we try to invent<br />
new tools.<br />
Distortion<br />
I am only too well aware that publications about<br />
personalities can be more exciting and pr<strong>of</strong>itable than<br />
Corresponding author: Arnott, S. (s.arnott@imperial.ac.uk).<br />
Available online 5 May 2006<br />
chronicles confined to science, but on re-visiting Wilkin’s<br />
early <strong>DNA</strong> work I was disconcerted by the extent to which<br />
the drama in The Double Helix had overpowered more<br />
subtle historical issues and by the persistence <strong>of</strong> many<br />
erroneous details from early reports on <strong>DNA</strong> that were<br />
refuted in subsequent publications. Even in his much later<br />
autobiography [2], Wilkins was, to a large extent, in thrall<br />
to the agenda set by Watson, and he left unanswered many<br />
intriguing questions about his scientific strategy and<br />
tactics, especially those relating to the early days <strong>of</strong> his<br />
<strong>DNA</strong> programme.<br />
In neither source, for example, did it ever become clear<br />
why Wilkins did so little to exploit his very good diffraction<br />
pattern <strong>of</strong> A-form <strong>DNA</strong> in 1950 (sic). This pattern was the<br />
one that prompted Alex Stokes to decide – together with<br />
Wilkins – that <strong>DNA</strong> was helical, and to go on to describe so<br />
tersely and elegantly the general features <strong>of</strong> diffraction<br />
from helices. It was this same pattern, displayed by<br />
Wilkins in Naples in the Spring <strong>of</strong> 1951, that first<br />
enthused Watson with the prospect that the genetic<br />
material might have an incredibly simple crystal structure<br />
that would be easy to model.<br />
As it turned out, Watson’s enthusiasm for <strong>DNA</strong><br />
modelling had to be re-ignited in 1953 by a different<br />
X-ray pattern from another <strong>DNA</strong> allomorph, B-<strong>DNA</strong>. So it<br />
came about that it was not the dimensions and symmetry<br />
<strong>of</strong> A-<strong>DNA</strong> but those <strong>of</strong> B-<strong>DNA</strong> that were incorporated into<br />
the first base-paired model <strong>of</strong> the double helix [3].<br />
Ironically, the conformational details <strong>of</strong> this model were,<br />
unwittingly, more appropriate for an A-form <strong>DNA</strong> [4];<br />
thus, the Watson–Crick structure that so satisfied<br />
biologists failed the tests <strong>of</strong> diffraction physicists. By<br />
taking up and resolving this dilemma, Wilkins kept alive<br />
and augmented his stake in the discovery <strong>of</strong> the structure<br />
<strong>of</strong> <strong>DNA</strong>.<br />
Polymorphism<br />
The diverse structures <strong>of</strong> globular proteins illustrate just<br />
how varied polymorphic biopolymers can be, even when<br />
they are composed <strong>of</strong> chemically similar building blocks.<br />
By contrast, the similarity <strong>of</strong> these blocks is made<br />
apparent in, for example, extensive a or b helices, where<br />
successive peptides have the same backbone conformation<br />
despite their different side chains. In special cases, a<br />
repeated sequence gives rise to a unique symmetrical<br />
structure; for example, a repeated Pro-Pro-Gly sequence<br />
leads to the collagen triple helix.<br />
www.sciencedirect.com 0968-0004/$ - see front matter Q 2006 Elsevier Ltd. All rights reserved. doi:10.1016/j.tibs.2006.04.004
350<br />
Review TRENDS in Biochemical Sciences Vol.31 No.6 June 2006<br />
(a)<br />
(i)<br />
(ii)<br />
(iii)<br />
(b)<br />
(i)<br />
(ii)<br />
(iii)<br />
(c)<br />
(i)<br />
(ii)<br />
(iii)<br />
(d)<br />
(i)<br />
(ii)<br />
(iii)<br />
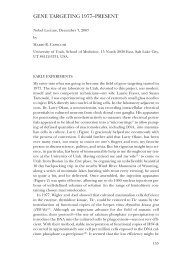
Figure 1. Fibre diffraction fingerprints and helical structures <strong>of</strong> some <strong>DNA</strong>s and RNAs. (a) A-<strong>DNA</strong>; (b) B-<strong>DNA</strong>; (c) Z-<strong>DNA</strong>; (d) A-RNA. In each form shown, the double helical<br />
molecules are uniaxially orientated and further ordered into microcrystals, the axes <strong>of</strong> which are also more or less parallel. The fibres have been tipped in order to record on<br />
the meridian (the central vertical axis in each pattern) the reflections from which the screw symmetries <strong>of</strong> the polynucleotide chains can be diagnosed. For A-<strong>DNA</strong> (a), the first<br />
meridional reflection is on the eleventh layer line above the equator (the central horizontal axis in each pattern) and indicates 11-fold screw symmetry (i). The patterns for B-<br />
<strong>DNA</strong> (b), Z-<strong>DNA</strong> (c) and A-RNA (d) indicate, respectively, 10-fold, 6-fold and 12-fold symmetry (i). In series (ii) <strong>of</strong> the images, one pitch length <strong>of</strong> each double helix is shown<br />
alongside its diffraction pattern; the views are perpendicular to the helix axes and are designed to show mainly the groove structures in the different helices. In series (iii), the<br />
views perpendicular to the helix axes show that the phosphate groups are invariantly on the molecular periphery but the base pairs are in various positions. A-<strong>DNA</strong> (a) is the<br />
double helix that is most compact vertically with a pitch <strong>of</strong> only 28 Å associated with base pairs that are tipped away from being perpendicular to the helix axis; the base pairs<br />
are near the surface <strong>of</strong> the duplex and therefore the minor groove <strong>of</strong> A-<strong>DNA</strong> is shallow (ii,iii). B-<strong>DNA</strong> (b) has a very different morphology with a pitch <strong>of</strong> 34 Å; bases are<br />
www.sciencedirect.com
Review TRENDS in Biochemical Sciences Vol.31 No.6 June 2006 351<br />
Nucleotides are more complex than peptides; thus,<br />
polynucleotides, when single-stranded, can be expected to<br />
be even more polymorphic than polypeptides. But when<br />
Watson–Crick base-pairing is possible, the structural<br />
isomorphism <strong>of</strong> the A†T, G†C, T†A and C†G pairs results<br />
in just two common types <strong>of</strong> polynucleotide double helix,<br />
A-<strong>DNA</strong> and B-<strong>DNA</strong>, which are both right-handed<br />
(Figure 1a,b). The analogy with polypeptides is continued<br />
with special nucleotide sequences; for example, polyd(GC)†polyd(GC)<br />
can exist in an exotic left-handed Z<br />
helix (Figure 1c), and in A- and B-form <strong>DNA</strong>.<br />
In each category (A, B and Z), there is enough residual<br />
conformational variability to produce a wide range <strong>of</strong><br />
distinct helical morphologies in <strong>DNA</strong> and RNA double<br />
helices [5]. I have provided a sampler gallery <strong>of</strong> only four <strong>of</strong><br />
these structures: namely, the ones that I explicitly discuss<br />
in this review. Their X-ray diffraction fingerprints are<br />
shown in Figure 1a(i),b(i),c(i),d(i), accompanied by<br />
mutually perpendicular views <strong>of</strong> their helical shapes in<br />
Figure 1a(ii,iii),b(ii,iii),c(ii,iii),d(ii,iii).<br />
A-<strong>DNA</strong><br />
Polymorphism confused the interpretation <strong>of</strong> earliest<br />
X-ray patterns from <strong>DNA</strong> fibres obtained by Astbury’s<br />
group at Leeds. We can now see that their specimens<br />
were <strong>of</strong>ten a mixture <strong>of</strong> the two phases A and B, which<br />
led to the confused conclusion that the two important<br />
vertical spacings in <strong>DNA</strong> were 27 Å (the layer line<br />
spacing from A-<strong>DNA</strong>) and 3.4 Å (the strong meridional<br />
reflection from B-<strong>DNA</strong>). Noticing that 3.4z27/8,<br />
Astbury’s rational deduction was that the ordered<br />
form <strong>of</strong> <strong>DNA</strong> was a stack <strong>of</strong> nucleotides with an eightfold<br />
periodicity perhaps deriving from the sequence <strong>of</strong><br />
bases. But it was Furberg, a PhD student in Bernal’s<br />
laboratory at Birkbeck College, London (1947–1949),<br />
who made an imaginative synthesis and constructive<br />
leap forward in his PhD thesis (S. Furberg, PhD thesis,<br />
University <strong>of</strong> London, 1949) by putting together a <strong>DNA</strong><br />
model that was indeed a (eightfold) helix comprising a<br />
single strand <strong>of</strong> nucleotides with stacked bases and<br />
sugar rings that displayed the conformation that he had<br />
obtained from his own X-ray crystallographic analysis<br />
<strong>of</strong> cytidine [6] – itself a virtuoso achievement in the<br />
late 1940s.<br />
The pattern <strong>of</strong> crystalline A-<strong>DNA</strong> that Wilkins and<br />
Gosling [7] obtained in the summer <strong>of</strong> 1950 not only<br />
cleanly removed the confusion <strong>of</strong> mixed phases but also<br />
provided a sure foundation for a quasi-orthodox X-ray<br />
analysis. Its 100 diffraction spots provided unit-cell<br />
dimensions (aZ22 Å, bZ40 Å, cZ28 Å, bZ978) and a<br />
space group assignment (C2), and the peculiar overall<br />
distribution <strong>of</strong> intensity from the spots suggested a<br />
symmetry for the molecular structure that lay behind<br />
the diffraction pattern. The odd feature <strong>of</strong> the pattern<br />
(Figure 1a[i]) is the lozenge-shaped empty space on the<br />
meridian that comes to a point on the eleventh layer line.<br />
Crystallographic axes with empty diffraction spaces<br />
imply screw (i.e. helix) symmetries. Crystals themselves<br />
are permitted only two-, three-, four- or six-fold screw<br />
axes; therefore, the 11-fold screw symmetry indicated by<br />
the first meridional reflection appearing on the eleventh<br />
layer line <strong>of</strong> A-<strong>DNA</strong> has to be a property <strong>of</strong> its molecules<br />
and not their packing in the p crystal. A C-face-centred unit<br />
cell with the ratio b=az<br />
ffiffiffi<br />
3 further implies that, looking<br />
down the fibre axis, the scattering units are equally<br />
spaced w22-Å apart on a quasi-hexagonal net. Moreover,<br />
the additional two-fold rotation axes <strong>of</strong> the provisional<br />
space group would be perpendicular to the molecular 11-<br />
fold screw axis and would partition each scattering unit<br />
into two subunits <strong>of</strong> opposite polarity.<br />
In retrospect, it is difficult to imagine that a welltrained<br />
crystallographer, committed to getting a structure<br />
by hook or by crook, would not conclude that the<br />
assignment to A-<strong>DNA</strong> <strong>of</strong> space group C2, no. 5, in<br />
International Tables [8] immediately meant that its<br />
structure contained 2!2 almost identical polynucleotide<br />
chains, diadically paired and packed like a bundle <strong>of</strong><br />
cylinders 22-Å apart. The cylinders, in fact, would be<br />
spirals with 11-fold screw symmetry.<br />
Of course, this is not what happened.<br />
What if.?<br />
Structural crystallographers in their analyses prefer to<br />
escape as soon as possible from diffraction or reciprocal<br />
space into real space. The best way <strong>of</strong> doing this is to<br />
make a Fourier transformation <strong>of</strong> the X-ray amplitudes<br />
– that is, the square roots <strong>of</strong> the intensities, suitably<br />
corrected – and their associated phases. From the<br />
resulting electron density map, a model can be made.<br />
When the X-ray data have high resolution, making a<br />
model might be the very straightforward business <strong>of</strong><br />
either identifying atoms and their positions or draping<br />
a polypeptide chain <strong>of</strong> known sequence along a ridge <strong>of</strong><br />
high electron density. At the lower resolutions characteristic<br />
<strong>of</strong> <strong>DNA</strong> fibre data, more structural information<br />
must be put into the model because the individual<br />
atomic positions are blurred. This information has to<br />
come in the form <strong>of</strong> prefabricated chemical components<br />
with dimensions that are well established from highresolution<br />
analyses <strong>of</strong> model compounds.<br />
Modelling <strong>of</strong> some kind is inescapable in structural<br />
crystallography, even if it is no more than a list <strong>of</strong><br />
provisional conclusions. Tangible models are better.<br />
They challenge vagueness and, when appropriately<br />
constructed, can be used to calculate not only diffraction<br />
intensities (to compare with those observed) but also<br />
diffraction phases that can be combined with the<br />
intensity-derived amplitudes in Fourier syntheses to<br />
start or to continue a process <strong>of</strong> imaging and<br />
improvement. It is surprising how adequate, from a<br />
phasing point <strong>of</strong> view, incomplete or inaccurate structures<br />
can be, and how few data are needed to make<br />
perpendicular to the helix axis and near the centre <strong>of</strong> the duplex, such that both grooves are deep (ii,iii). Z-<strong>DNA</strong> (c) has a pitch <strong>of</strong> 44 Å and is rather prism-like (ii,iii). The A-RNA<br />
duplex (d) is like B-<strong>DNA</strong> in having a large pitch (36 Å) and bases that are nearly perpendicular to the helix axis, but conformationally and morphologically it is an A-type<br />
structure with C3 0 -endo puckered sugar rings and with one deep and one shallow groove (ii,iii); in these respects, it resembles the original Watson and Crick model that was<br />
intended to be the solution to the B-<strong>DNA</strong> diffraction pattern.<br />
www.sciencedirect.com
352<br />
Review TRENDS in Biochemical Sciences Vol.31 No.6 June 2006<br />
crucial decisions about improving preliminary models.<br />
Bunn et al. [9], working on penicillin in the 1940s,<br />
pioneered this kind <strong>of</strong> adventurous use <strong>of</strong> Fourier<br />
syntheses and thereby were able to convert a provisional,<br />
erroneous model for penicillin into what turned<br />
out to be the chemically accurate one. In later work<br />
with fibre data, my colleagues and I successfully used<br />
this approach to determine the presence and precise<br />
site <strong>of</strong> a second chain in hyaluronate [10], to decide that<br />
A-RNA was an 11-fold rather than a 10-fold helix [11],<br />
and that the Hoogsteen alternative base-pairing was an<br />
unacceptable option for B-<strong>DNA</strong> [12]. Furberg’s model,<br />
adjusted to comply with the new and more accurate<br />
experimental observations, could have been used as the<br />
provisional structure <strong>of</strong> the polynucleotide chains in<br />
A-<strong>DNA</strong>, and a process <strong>of</strong> refinement could have been<br />
attempted as early as 1950.<br />
Simplifying complexity<br />
A crystal model with spirals <strong>of</strong> nucleotides would have<br />
been a bold start, but the next challenge that could not<br />
be evaded, and should not have been postponed, was to<br />
explain how a relatively simple, highly symmetric<br />
structure could accommodate four different kinds <strong>of</strong><br />
nucleotide in any sequence. This kind <strong>of</strong> challenge was<br />
as old as chemical crystallography itself. It first<br />
presented itself in the field <strong>of</strong> mineralogy, where it<br />
was found that many materials <strong>of</strong> different, complex<br />
chemical compositions had the same, simple crystal<br />
form. This phenomenon, termed ‘isomorphism’, arises<br />
because many minerals have simple lattice structures,<br />
which comprise silicate most <strong>of</strong>ten but phosphate<br />
sometimes! The lattices form cages that are not very<br />
discriminating in terms <strong>of</strong> content – provided that it is<br />
the right size and shape.<br />
The related phenomenon <strong>of</strong> clathrate formation was a<br />
source <strong>of</strong> excitement to organic chemical crystallographers<br />
in the late 1940s, when <strong>DNA</strong> structural studies<br />
were being resurrected. Clathrates, so named by Palin<br />
and Powell [13] at Oxford in 1945, can occur when<br />
substances such as hydroquinone or urea are crystallized<br />
in the presence <strong>of</strong> suitable guest molecules. When<br />
these molecules are an appropriate size and shape to fill<br />
holes in the simple, but highly hydrogen-bonded, lattices<br />
<strong>of</strong> the host materials, they get taken up to form<br />
complexes that are crystallographically isomorphous<br />
with the host substance.<br />
Exploiting the first clean diffraction pattern <strong>of</strong> oriented<br />
and polycrystalline <strong>DNA</strong> by using an updated Furberg<br />
model and the methods <strong>of</strong> chemical crystallographers was<br />
an option that could have been pursued as early as 1950. But<br />
perhaps it would have been possible only in the right<br />
environment? Did the research unit <strong>of</strong> the KCL Medical<br />
Research Council have too many physicists and not enough<br />
chemists? Or was this option not pursued because the<br />
primitive state <strong>of</strong> computing at the time required chemical<br />
crystallographers to do a great deal <strong>of</strong> hard pounding on<br />
adding machines, and at KCL there were too many generals<br />
and not enough gunners to do such hard pounding?<br />
Eventually, in 1952, a graduate student (Gosling) and a<br />
new postdoctoral fellow (Franklin) did embark on<br />
www.sciencedirect.com<br />
intensive computation, but their efforts were concentrated<br />
on Patterson transforms that involved only diffraction<br />
intensities and not phases [14]. This mathematically more<br />
sophisticated way <strong>of</strong> looking at the intensities could do<br />
little more than confirm the heuristic interpretation <strong>of</strong> the<br />
A-<strong>DNA</strong> diffraction that had already been made. In the end,<br />
the results would still have needed to be given a concrete<br />
form in a model; and the final model would need to<br />
explain how a diverse sequence <strong>of</strong> bases with different<br />
sizes and shapes could be incorporated into a simple<br />
repetitious structure.<br />
B-<strong>DNA</strong> overtakes A-<strong>DNA</strong><br />
Meanwhile, it had become possible to get clean diffraction<br />
patterns <strong>of</strong> the B-<strong>DNA</strong> allomorph [14,15]. To begin with,<br />
the fibres <strong>of</strong> B-<strong>DNA</strong> were only uniaxially oriented; that is,<br />
the <strong>DNA</strong> molecules were lined up parallel to one another<br />
but not otherwise ordered. Microcrystals combined with<br />
uniaxial orientation (Figure 1b[i]) came only later when<br />
the subtle interplay <strong>of</strong> retained salts and water content<br />
on the crystallinity <strong>of</strong> <strong>DNA</strong> fibres was worked out. In<br />
addition, it was initially thought that B-<strong>DNA</strong> was the wet<br />
and more ‘natural’ allomorph, whereas A-<strong>DNA</strong> was<br />
merely an ‘artefact’ <strong>of</strong> drying and thus less worthy <strong>of</strong><br />
further investment. Even then, this idea was obviously<br />
an oversimplification.<br />
Gosling, who worked with both Wilkins and Franklin,<br />
scrupulously describes in his PhD thesis (R.G. Gosling,<br />
PhD thesis, University <strong>of</strong> London, 1953) three kinds <strong>of</strong><br />
<strong>DNA</strong> sample: in one, the B-form was the only form seen in<br />
damp fibres; in another, only the A-form was found; and in<br />
a third, the A-form, B-form or both forms could be<br />
obtained, depending on the ambient relative humidity.<br />
We now know that A-form crystals are as highly hydrated<br />
as B-form crystals, that it is the excess retained salt that<br />
shuts down the possibility <strong>of</strong> a B-to-A transition, and that<br />
the absence <strong>of</strong> retained salt helps to preserve the A-form<br />
even at the highest relative humidity. With intermediate<br />
levels <strong>of</strong> retained salt, it is possible to switch between<br />
A-<strong>DNA</strong> and B-<strong>DNA</strong> by changing the ambient<br />
relative humidity.<br />
There was a good reason to concentrate attention on<br />
B-<strong>DNA</strong>, but it was not the lack <strong>of</strong> hydration in A-<strong>DNA</strong>. A<br />
more attractive property <strong>of</strong> the B-<strong>DNA</strong> molecules was<br />
their diffraction signature. The diffraction pattern <strong>of</strong> the B<br />
allomorph is strikingly similar to the elementary textbook<br />
pattern provided by a simple helix <strong>of</strong> atoms; thus, however<br />
mistakenly it might have been argued that A-<strong>DNA</strong><br />
molecules could not be helices, it would have been<br />
perverse not to accept that the most likely conformation<br />
<strong>of</strong> B-<strong>DNA</strong> molecules was indeed a helix. In private, even<br />
Franklin [16] had come to regard B-<strong>DNA</strong> as helical,<br />
despite having earlier ostentatiously buried this hypothesis<br />
for ‘crystalline’ (i.e. A-form) <strong>DNA</strong>. Certainly, Watson<br />
and Crick were inspired to resume <strong>DNA</strong> modelling within<br />
the constraints set by the B-form pattern: a ten-fold screw<br />
symmetry, a 34-Å pitch, and nucleotides stacked 3.4-Å<br />
apart with their bases approximately perpendicular to the<br />
helix axis.<br />
In a tubular cage comprising antiparallel sugar–<br />
phosphate bars, hydrogen-bonded A†T, T†A, G†C and
Review TRENDS in Biochemical Sciences Vol.31 No.6 June 2006 353<br />
C†G pairs could vicariously replace one another because<br />
they were isomorphous – in other words, the same size, a<br />
similar shape, and containing glycosidic links in the same<br />
symmetrical positions.<br />
Furberg’s ghost<br />
The Watson and Crick [3] paper announcing their<br />
essential conclusions about the general structure <strong>of</strong> <strong>DNA</strong><br />
did not fail to acknowledge, albeit dismissively, Furberg’s<br />
earlier work. But implicit in the detailed coordinates <strong>of</strong><br />
every nucleotide <strong>of</strong> their B-<strong>DNA</strong> model [4] was the ghost <strong>of</strong><br />
Furberg’s structure <strong>of</strong> cytidine with its puckered deoxyribose<br />
rings. Five-membered sugar rings are not planar,<br />
and ribose rings in particular have two equally common,<br />
puckered forms that have come to be known as C3 0 -endo<br />
and C2 0 -endo. The first is found in A-<strong>DNA</strong> and the second<br />
in B-<strong>DNA</strong>. Ironically, ribose had the C3 0 -endo conformation<br />
in Furberg’s cytidine crystals; thus, what Watson<br />
and Crick had unwittingly done was to produce a model <strong>of</strong><br />
a credible <strong>DNA</strong> double helix, but it was an A-form double<br />
helix and therefore not an accurate model <strong>of</strong> their<br />
intended target, B-<strong>DNA</strong>.<br />
For most biologists this did not matter: the Watson–<br />
Crick conjecture was accurate enough and its base-pairing<br />
component was immediately stimulating and productive.<br />
The fact that there was some connection between the<br />
model and X-ray diffraction experiments was reassuring,<br />
but the appropriateness <strong>of</strong> the connection was almost<br />
irrelevant. Yet the full ratification by diffraction scientists<br />
that other researchers thought was needed had to be<br />
withheld for the very good reason that the misfit <strong>of</strong> the<br />
diffraction amplitudes calculated from the model was <strong>of</strong><br />
the same order as would be expected from a completely<br />
wrong structure.<br />
This discrepancy had come about because the switch<br />
in sugar pucker, which might seem a modest local flaw<br />
in a model, gets amplified into much larger shifts in the<br />
relative positions and orientation <strong>of</strong> phosphates and<br />
bases. The consequent morphological changes in a<br />
double helix are large in terms <strong>of</strong> atomic positions,<br />
and the diffraction signals that derive from them are<br />
affected substantially: in B-<strong>DNA</strong>, the bases are in the<br />
centre <strong>of</strong> the helix (Figure 1b[iii]) and accessible via two<br />
deep grooves (Figure 1b[ii]); in A-<strong>DNA</strong>, the bases are<br />
4–5 Å out from the helix axis (Figure 1a[iii]) such that<br />
one groove becomes slightly deeper and the other<br />
slightly shallower (Figure 1a[ii]). This feature is found<br />
in all A-like allomorphs, including the original Watson–<br />
Crick model. No double helix has been found that<br />
exactly matches their model, although an A-form RNA<br />
duplex [17] (Figure 1d) has base pairs that are nearly<br />
perpendicular to the helix axis (similar to B-<strong>DNA</strong>) but<br />
otherwise has all the characteristics <strong>of</strong> an A-type<br />
structure (Figure 1d[ii,iii]).<br />
Wilkins’ long march<br />
Laying to rest Furberg’s ghost had consequences that were<br />
positive, practical and political for Wilkins. More investment<br />
in fibre diffraction technology could be justified:<br />
materials got better, specimen preparation was improved,<br />
new X-ray cameras were designed, and computers were<br />
exploited more and more as their power increased. These<br />
technical developments are among the more important, if<br />
less glamorous, contributions made by Wilkins and his<br />
colleagues at KCL.<br />
In Wilkins’s own research group, the new technologies<br />
were focused mainly on refining B-<strong>DNA</strong> and its close<br />
relative, C-<strong>DNA</strong>. A-<strong>DNA</strong> was a side-show despite its<br />
virtuoso refinement by Fuller in his PhD thesis (W. Fuller,<br />
PhD thesis, University <strong>of</strong> London, 1960). The definitive<br />
publication was delayed until 1965 [18] after it had<br />
become obvious that its structure was fundamentally the<br />
same as those available to RNA duplexes [11].<br />
Concluding remarks<br />
The relentless pursuit <strong>of</strong> the best (X-ray) structure for<br />
B-<strong>DNA</strong> was helped by technical improvements, but<br />
changes in analytical tactics were long delayed. The<br />
process <strong>of</strong> refining this structure could be described as a<br />
slow transition from one kind <strong>of</strong> sugar ring conformation<br />
to another, but throughout the 1950s, and well into the<br />
1960s, the refinement was never overtly recognized as<br />
such. Attention was concentrated on the bases and<br />
phosphate groups – that is, the main X-ray scatterers –<br />
the positions <strong>of</strong> which were being slowly adjusted to give a<br />
better fit with the X-ray intensities observed. The<br />
correlation between base and phosphate positions and<br />
the precise puckering <strong>of</strong> the sugar rings was noted only<br />
when linked-atom refinement was introduced and the<br />
conformation angles at every nucleotide bond had to be<br />
stated explicitly [17].<br />
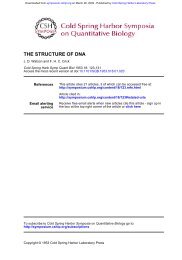
In addition, the repeated rounds <strong>of</strong> manual model<br />
building and calculation <strong>of</strong> the consequent diffraction were<br />
never short-circuited by the real-space approach <strong>of</strong><br />
examining the provisional images that could be calculated<br />
by combining observed diffraction amplitudes with provisional<br />
model phases. Interestingly, the original, physically<br />
flawed model <strong>of</strong> Watson and Crick would have provided<br />
phases good enough to show that the base pairs in their<br />
model needed to be moved w5-Å closer to the helix axis<br />
(Figure 2).<br />
Although the meticulous process <strong>of</strong> refinement maintained<br />
interest in <strong>DNA</strong> diffraction and its most competent<br />
practitioner, Wilkins, its downside was that it provided<br />
plenty <strong>of</strong> time for others to speculate on alternative<br />
structures. If <strong>DNA</strong> could be polymorphic, then so could its<br />
models. Thus, there arose speculative models incorporating<br />
other patterns <strong>of</strong> base-pairing, different chirality, and<br />
even ladder-like structures with no chirality at all! Indeed,<br />
there are real examples <strong>of</strong> many <strong>of</strong> these conjectured<br />
structures: non-Watson–Crick pairs are found in fourstranded<br />
poly(G) [19]; Hoogsteen pairs [20] and Watson–<br />
Crick pairs [21,22] are present in triple-stranded <strong>DNA</strong>s;<br />
left-handed but Watson–Crick-paired helices can be<br />
obtained with polyd(GC)†polyd(GC) [23]; and an achiral<br />
<strong>DNA</strong> duplex has been even observed in a drug complex<br />
[24]. In fact, most <strong>of</strong> the architects <strong>of</strong> the ‘hopeful<br />
monsters’ were not interested in polynucleotide polymorphism,<br />
but in toppling the prevailing model <strong>of</strong> B-<strong>DNA</strong><br />
and its steady improvements. Nor were they interested in<br />
investing time and energy themselves in detailed diffraction<br />
tests <strong>of</strong> their speculations; this task was left to the<br />
www.sciencedirect.com
354<br />
Review TRENDS in Biochemical Sciences Vol.31 No.6 June 2006<br />
(a)<br />
No fibrous polynucleotide structure produced in a<br />
laboratory not <strong>of</strong> Wilkins’ school has survived critical reexamination:<br />
this fact might not say much for the quality<br />
<strong>of</strong> other laboratories, but it says a great deal for the<br />
meticulous standards <strong>of</strong> fibre diffraction analysis that he<br />
initiated and promoted with such important consequences<br />
for molecular biology.<br />
Acknowledgements<br />
Currently, I am indebted for the provision <strong>of</strong> facilities to John Squire<br />
(Head <strong>of</strong> the Biological Structure and Function Section, Imperial College,<br />
London, UK, and Editor <strong>of</strong> Fibre Diffraction Review) and to Stephen<br />
Neidle (Director <strong>of</strong> the CRUK Biomolecular Structure Group, University<br />
<strong>of</strong> London School <strong>of</strong> Pharmacy, London, UK).<br />
(b)<br />
(c)<br />
Figure 2. Fourier syntheses with low-resolution X-ray data obtained from crystalline<br />
B-<strong>DNA</strong>. Data are from Figure 1b(i). Blue contours indicate positive electron density<br />
on a plane through a base pair; red contours indicate negative density. Spheres<br />
indicate atoms that would contribute electron density in this plane. (a) The result<br />
obtained if the calculation is done with the observed X-ray amplitudes and phases<br />
calculated from the original, physically flawed, Watson–Crick model <strong>of</strong> B-<strong>DNA</strong>. A<br />
broad plateau <strong>of</strong> electron density includes the base pairs <strong>of</strong> the phasing model but<br />
spreads out beyond it. (b) Subtracting the density <strong>of</strong> the model at the same<br />
resolution reveals the bases <strong>of</strong> the phasing model in a deep negative trough and<br />
indicates that a better model should place them on the ridge <strong>of</strong> positive density at a<br />
distance <strong>of</strong> 5 Å. (c) When the model is revised as indicated in (b), the new calculated<br />
phases combined with the observed amplitudes give a more acceptable fit between<br />
model and image.<br />
conscientious pr<strong>of</strong>essionalism <strong>of</strong> Wilkins and his helpers.<br />
Responding to the continuous sniping might have been<br />
tiresome, but it surely contributed to the evolution <strong>of</strong> more<br />
robust methods <strong>of</strong> fibre diffraction analysis.<br />
References<br />
1 Watson, J.D. (1968) The Double Helix: A Personal Account <strong>of</strong> the<br />
<strong>Discovery</strong> <strong>of</strong> the Structure <strong>of</strong> <strong>DNA</strong>, Athenaeum<br />
2 Wilkins, M. (2003) The Third Man <strong>of</strong> the Double Helix, Oxford<br />
University Press<br />
3 Watson, J.D. and Crick, F.H.C. (1953) A structure for deoxyribosenucleic<br />
acid. Nature 171, 737–738<br />
4 Crick, F.H.C. and Watson, J.D. (1954) The complementary structure <strong>of</strong><br />
deoxyribosenucleic acid. Proc. R. Soc. London A 223, 80–96<br />
5 Arnott, S. (1999) Polynucleotide secondary structures: an historical<br />
perspective. In The Oxford Handbook <strong>of</strong> Nucleic Acid Structures<br />
(Neidle, S., ed.), pp. 1–38, Oxford University Press<br />
6 Furberg, S. (1949) The crystal structure <strong>of</strong> cytidine. Nature 164, 22<br />
7 Wilkins, M.H.F. (1963) The molecular configuration <strong>of</strong> nucleic acids. In<br />
Les Prix Nobel en 1962, pp. 126–154, Nobel Foundation<br />
8 Hahn, T., ed. (1983) International Tables for Crystallography (Vol. A),<br />
p. 116, Springer<br />
9 Bunn, C.W. et al. (1949) X-ray crystallographic investigation <strong>of</strong> the<br />
structure <strong>of</strong> penicillin. In Chemistry <strong>of</strong> Penicillin (Clarke, H.T., ed.),<br />
pp. 310–366, Princeton University Press<br />
10 Guss, J.M. et al. (1975) Hyaluronic acid: molecular conformations and<br />
interactions in two sodium salts. J. Mol. Biol. 95, 359–384<br />
11 Arnott, S. et al. (1966) Molecular and crystal structures <strong>of</strong> doublehelical<br />
RNA. III. An 11-fold molecular model and comparison <strong>of</strong><br />
the agreement between the observed and calculated threedimensional<br />
diffraction data for 10 and 11-fold models. J. Mol.<br />
Biol. 27, 535–548<br />
12 Arnott, S. et al. (1965) Fourier synthesis studies <strong>of</strong> lithium <strong>DNA</strong>:<br />
Hoogsteen models. J. Mol. Biol. 11, 391–402<br />
13 Palin, D.E. and Powell, H.M. (1945) Clathrates. Nature 156, 334<br />
14 Franklin, R.E. and Gosling, R.G. (1953) Molecular configuration in<br />
sodium thymonucleate. Nature 421, 400–401<br />
15 Wilkins, M.H.F. et al. (1951) Physical studies <strong>of</strong> nucleic acids. Nature<br />
167, 759–760<br />
16 Klug, A. (1968) Rosalind Franklin and the discovery <strong>of</strong> the structure <strong>of</strong><br />
<strong>DNA</strong>. Nature 219, 808–810<br />
17 Arnott, S. et al. (1968) Molecular conformations and structural<br />
transitions <strong>of</strong> RNA complementary helices and their possible<br />
biological significance. Nature 220, 561–564<br />
18 Fuller, W. et al. (1965) Molecular configuration <strong>of</strong> deoxyribonucleic<br />
acid. IV. X-ray Diffraction Study <strong>of</strong> the A-form. J. Mol. Biol. 12, 60–80<br />
19 Arnott, S. et al. (1974) Structures for polyinosinic acid and<br />
polyguanylic acid. Biochem. J. 141, 537–543<br />
20 Hoogsteen, K. (1963) The crystal and molecular structure <strong>of</strong> a<br />
hydrogen-bonded complex between 1-methylthymine and 9-methyladenine.<br />
Acta Crystallogr. 16, 907–916<br />
21 Arnott, S. and Selsing, E. (1974) Structures for poly(dA)†poly(dT) and<br />
poly(dT)†poly(dA)†poly(dT). J. Mol. Biol. 88, 509–521<br />
22 Chandrasekaran, R. et al. (2000) Structure <strong>of</strong> poly(dT)†poly(-<br />
dA)†poly(dT). J. Biomol. Struct. Dyn. 17, 1011–1022<br />
23 Arnott, S. et al. (1980) Left-handed <strong>DNA</strong> helices. Nature 283, 743–745<br />
24 Bond, P.J. et al. (1980) Visualization <strong>of</strong> an unwound <strong>DNA</strong> duplex.<br />
Nature 287, 561–563<br />
www.sciencedirect.com