a static and dynamic technique contingency ranking analysis in ...
a static and dynamic technique contingency ranking analysis in ...
a static and dynamic technique contingency ranking analysis in ...

Create successful ePaper yourself
Turn your PDF publications into a flip-book with our unique Google optimized e-Paper software.
Muhammad Nizam, A Static And Dynamic Technique Cont<strong>in</strong>gency Rank<strong>in</strong>g Analysis<br />
A STATIC AND DYNAMIC TECHNIQUE CONTINGENCY<br />
RANKING ANALYSIS IN VOLTAGE STABILITY<br />
ASSESSMENT<br />
Muhammad Nizam<br />
Eng<strong>in</strong>eer<strong>in</strong>g Faculty Sebelas Maret University<br />
(Ph.D Student of Electrical, Electronic <strong>and</strong> System Department<br />
Eng<strong>in</strong>eer<strong>in</strong>g Faculty, Universiti Kebangsaan Malaysia)<br />
Email : nizam_kh@yahoo.com<br />
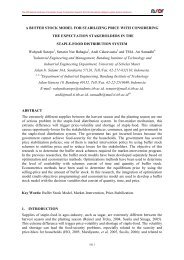
ABSTRACT<br />
The objective of the research is to compare between <strong>technique</strong> for determ<strong>in</strong>e<br />
the weak bus of the power system us<strong>in</strong>g <strong>static</strong> <strong>and</strong> <strong>dynamic</strong> <strong>cont<strong>in</strong>gency</strong><br />
<strong>rank<strong>in</strong>g</strong> <strong>analysis</strong>. Identification of the weak bus is very important for<br />
provid<strong>in</strong>g a proper control system to prevent for voltage collapse. Test<br />
system of this research is us<strong>in</strong>g the New Engl<strong>and</strong> (IEEE 39 bus) power<br />
system. A severity <strong>rank<strong>in</strong>g</strong> of the system is carried out on the study system to<br />
specify weak buses, <strong>in</strong> term of voltage <strong>in</strong>stability. A <strong>cont<strong>in</strong>gency</strong> as a load<br />
<strong>in</strong>crement is employed to exam<strong>in</strong>e the network buses condition <strong>and</strong> stability<br />
marg<strong>in</strong> <strong>in</strong> the system. Three methods <strong>technique</strong>s as eigenvalue <strong>analysis</strong> of<br />
jacobian matrix is used as a <strong>static</strong> methods <strong>and</strong> a voltage collapse prediction<br />
<strong>in</strong>dex, <strong>and</strong> power transfer stability <strong>in</strong>dex as a <strong>dynamic</strong> methods are<br />
<strong>in</strong>vestigated. The result showed that the <strong>static</strong> <strong>analysis</strong> is giv<strong>in</strong>g more<br />
optimistic <strong>in</strong> evaluat<strong>in</strong>g loadability limit than <strong>dynamic</strong>. For the <strong>cont<strong>in</strong>gency</strong><br />
<strong>rank<strong>in</strong>g</strong> both <strong>static</strong> <strong>and</strong> <strong>dynamic</strong> give same trend <strong>in</strong> every bus. But for f<strong>in</strong>al<br />
decisions <strong>in</strong>volv<strong>in</strong>g several consideration both plann<strong>in</strong>g <strong>and</strong> operation<br />
should be confirm by more accurate time doma<strong>in</strong> simulation (<strong>dynamic</strong>) <strong>in</strong><br />
which different characteristics of load, multiple controller, protection relays<br />
<strong>and</strong> coord<strong>in</strong>ated them taken <strong>in</strong>to account<br />
Key words: <strong>cont<strong>in</strong>gency</strong> <strong>analysis</strong>, <strong>static</strong> <strong>and</strong> <strong>dynamic</strong> <strong>analysis</strong>, voltage stability<br />
INTRODUCTION<br />
Voltage <strong>in</strong>stability <strong>and</strong> voltage collapse is<br />
became important concern to electric<br />
power <strong>in</strong>dustry <strong>in</strong> recent years. The voltage<br />
problems are often associated with<br />
cont<strong>in</strong>gencies like unexpected l<strong>in</strong>e <strong>and</strong><br />
generator outages, <strong>in</strong>sufficient local<br />
reactive power supply <strong>and</strong> <strong>in</strong>creased<br />
load<strong>in</strong>g of transmission l<strong>in</strong>es<br />
(Hasani&Paniani, 2005; Balamourgan et.<br />
al. 2004; Nizam et. al.,2006). Voltage<br />
collapse is usually characterized by an<br />
<strong>in</strong>itial slow <strong>and</strong> progressive decrease <strong>and</strong> a<br />
f<strong>in</strong>al rapid decl<strong>in</strong>e <strong>in</strong> voltage magnitude at<br />
different buses (Hasani&Paniani, 2005;<br />
Kundur, 1994)<br />
The <strong>analysis</strong> methods for voltage<br />
stability problems are classified <strong>in</strong>to two<br />
classes, <strong>static</strong> <strong>and</strong> <strong>dynamic</strong> <strong>analysis</strong>.<br />
Several well known <strong>static</strong> methods are<br />
base on sensitivity factor such as dV/dQ;<br />
eigenvalues <strong>and</strong> s<strong>in</strong>gular values; <strong>and</strong><br />
106
Muhammad Nizam, A Static And Dynamic Technique Cont<strong>in</strong>gency Rank<strong>in</strong>g Analysis<br />
cont<strong>in</strong>uation power flow (Kundur, 1994;<br />
Dong et. al., 2004). These power flowbased<br />
<strong>static</strong> methods can provide a<br />
measure of degree of stability, like a<br />
proximity <strong>in</strong>dicator, dom<strong>in</strong>ant eigenvalues,<br />
real <strong>and</strong> reactive power marg<strong>in</strong>, etc.<br />
Dynamic simulations on the other h<strong>and</strong>,<br />
can produce the time response of system to<br />
a sequence of discrete events. Therefore it<br />
is able to shed light on the mechanism of<br />
voltage stability <strong>and</strong> also provide<br />
corrective strategies to improve voltage<br />
stabilities (Huang&Zhang., 2001). Several<br />
<strong>dynamic</strong> voltage collapse <strong>in</strong>dicators, like a<br />
voltage collapse prediction <strong>in</strong>dex<br />
(Balamourgan, et.al., 2004) <strong>and</strong> power<br />
transfer stability <strong>in</strong>dex (Nizam et.al, 2006).<br />
Although different approaches have<br />
been proposed <strong>and</strong> employed for voltage<br />
collapse <strong>analysis</strong> till now, few literatures<br />
dealt with <strong>dynamic</strong>s of this phenomenon <strong>in</strong><br />
large <strong>in</strong>terconnected power systems. Most<br />
of the methods that are applied to this<br />
network are of <strong>static</strong> type. Little work has<br />
been published on <strong>dynamic</strong> voltage<br />
stability <strong>analysis</strong> of the systems, <strong>and</strong> the<br />
differences between the results of two<br />
approaches have been rarely analyzed.<br />
This paper <strong>in</strong>vestigates the discrepancies<br />
between <strong>static</strong> <strong>and</strong> <strong>dynamic</strong> <strong>technique</strong>s for<br />
voltage collapse analyz<strong>in</strong>g.<br />
In this paper, the New Engl<strong>and</strong> (IEEE<br />
39 bus) power system is used as the test<br />
system. A severity <strong>rank<strong>in</strong>g</strong> of the system is<br />
carried out on the study system to specify<br />
weak buses, <strong>in</strong> term of voltage <strong>in</strong>stability.<br />
The <strong>cont<strong>in</strong>gency</strong> load <strong>in</strong>crement at bus 15<br />
is provided. For this <strong>cont<strong>in</strong>gency</strong> <strong>static</strong> <strong>and</strong><br />
<strong>dynamic</strong> methods are employed to<br />
exam<strong>in</strong>e the network buses condition <strong>and</strong><br />
stability marg<strong>in</strong> with three methods<br />
<strong>technique</strong>s as eigenvalue <strong>analysis</strong> of<br />
jacobian matrix as a <strong>static</strong> methods <strong>and</strong> a<br />
voltage collapse prediction <strong>in</strong>dex, <strong>and</strong><br />
power transfer stability <strong>in</strong>dex as a <strong>dynamic</strong><br />
methods.<br />
VOLTAGE COLLAPSE ANALYSIS<br />
METHODS<br />
Many aspects of voltage stability<br />
problems can be effectively analyzed by<br />
us<strong>in</strong>g <strong>static</strong> methods. These methods<br />
exam<strong>in</strong>e the viability of the equilibrium<br />
po<strong>in</strong>t represented by a specified operat<strong>in</strong>g<br />
condition of the power system. Static<br />
approach like sensitivity <strong>analysis</strong> for<br />
voltage stability assessment uses a system<br />
condition or snapshot for voltage stability<br />
evaluation. They usually solve power flow<br />
equation of the network with specific load<br />
<strong>in</strong>crements until the po<strong>in</strong>t of voltage<br />
collapse is reached. The <strong>dynamic</strong> method<br />
is giv<strong>in</strong>g more clarifies of this<br />
phenomenon. It shows the time event of<br />
their chronologies lead<strong>in</strong>g the system to<br />
f<strong>in</strong>al phase of voltage collapse.<br />
Eigen value Analysis<br />
This methods calculates the<br />
relationship between voltage changes <strong>and</strong><br />
reactive power changes at different buses<br />
us<strong>in</strong>g reduced Jacobian matrix (Kundur,<br />
1994). From the power flow equation,<br />
⎡ ∂P<br />
∂P<br />
⎤<br />
⎡dP⎤<br />
⎢ ⎥⎡<br />
⎤<br />
= ∂θ ∂V<br />
dθ<br />
(1)<br />
⎢ ⎥ ⎢∂<br />
∂ ⎥⎢<br />
⎥<br />
⎣dQ⎦<br />
Q Q<br />
⎢ ⎥⎣dV<br />
⎦<br />
⎣ ∂θ<br />
∂V<br />
⎦<br />
The Jacobian matrix J is :<br />
⎡ ∂P<br />
∂P<br />
⎤<br />
⎢ ∂ ∂ ⎥ ⎡ K L ⎤<br />
J = θ V<br />
(2)<br />
⎢ ⎥ =<br />
∂Q<br />
∂Q<br />
⎢ ⎥<br />
⎢ ⎥ ⎣M<br />
N ⎦<br />
⎣ ∂θ<br />
∂V<br />
⎦<br />
where K, L, M <strong>and</strong> N are the Jacobian submatrices,<br />
<strong>and</strong> ∆P is <strong>in</strong>cremental change <strong>in</strong><br />
bus real power, Q is <strong>in</strong>cremental change <strong>in</strong><br />
107
Muhammad Nizam, A Static And Dynamic Technique Cont<strong>in</strong>gency Rank<strong>in</strong>g Analysis<br />
bus reactive power <strong>in</strong>jection, ∆θ is<br />
<strong>in</strong>cremental <strong>in</strong> bus voltage angle <strong>and</strong> ∆V is<br />
<strong>in</strong>cremental change <strong>in</strong> bus voltage<br />
magnitude. The elements of Jacobian<br />
matrix give the sensitivity between power<br />
flow <strong>and</strong> bus voltage changes. In fact<br />
system voltage stability is affected by both<br />
P <strong>and</strong> Q. However at each operat<strong>in</strong>g po<strong>in</strong>t<br />
we may keep P constant <strong>and</strong> evaluate<br />
voltage stability by consider<strong>in</strong>g the<br />
<strong>in</strong>cremental relationship between Q <strong>and</strong> V.<br />
Base on above considerations, equation<br />
(1), let ∆P=0. Then equation (1) become<br />
⎡ ∂P<br />
∂P<br />
⎤<br />
⎡ 0 ⎤ ⎢ ⎥⎡<br />
⎤<br />
= ∂θ ∂V<br />
0 (3)<br />
⎢ ⎥ ⎢∂<br />
∂ ⎥⎢<br />
⎥<br />
⎣dQ⎦<br />
Q Q<br />
⎢ ⎥⎣dV<br />
⎦<br />
⎣ ∂θ<br />
∂V<br />
⎦<br />
Or<br />
∆Q = J R ∆V or ∆V = J R -1 ∆Q (4)<br />
where<br />
J R = [ J QV - J Qθ J Pθ -1 J PV ] (5)<br />
<strong>and</strong> J R -1 is the reduced V-Q Jacobian of<br />
the system. J R -1 is also called sensitivity of<br />
V-Q. A positive sensitivities represent<br />
stable operation; the smaller the sensitivity<br />
the more the stable the system. As stability<br />
decrease, the magnitude of sensitivity<br />
becom<strong>in</strong>g <strong>in</strong>f<strong>in</strong>ite at the maximum<br />
loadability limit. Conversely, a negative V-<br />
Q sensitivity is <strong>in</strong>dicative of unstable<br />
operation. A small negative sensitivity<br />
represents a very unstable operation. The<br />
magnitudes of sensitivities for different<br />
system conditions do not provide a direct<br />
measure of relative degree of stability. It is<br />
because of the non l<strong>in</strong>ear nature of the Q-V<br />
relationship (Kundur, 1994). Voltage<br />
stability characteristics of the system can<br />
be identified by comput<strong>in</strong>g the eigenvalues<br />
<strong>and</strong> eigenvectors of the reduced jacobian<br />
matrix J R . S<strong>in</strong>ce the jacobian reduction<br />
matrix dimension is 1x1 then the<br />
eigenvalues is equal to value of jacobian<br />
reduction of the system.<br />
Dynamic Analysis<br />
An <strong>in</strong>dices for detection of voltage<br />
stability <strong>in</strong>dex is the Power Transfer<br />
Stability Index (PTSI). The PTSI is<br />
calculated by know<strong>in</strong>g <strong>in</strong>formation of total<br />
load power, voltage <strong>and</strong> impedance at<br />
Theven<strong>in</strong> bus <strong>and</strong> phase angle between<br />
Theven<strong>in</strong> <strong>and</strong> load bus (Nizam et.al.,<br />
2006). The value of PTSI will fall<br />
between 0 <strong>and</strong> 1. When PTSI value<br />
reaches 1, it <strong>in</strong>dicates that a voltage<br />
collapse has occurred. The proposed<br />
power transfer stability <strong>in</strong>dex (PTSI) is<br />
derived by first consider<strong>in</strong>g a simple twobus<br />
Theven<strong>in</strong> equivalent system, where<br />
one of the buses is a slack bus connected<br />
to a load bus. The magnitude of load<br />
apparent power S L from equation (6) can<br />
be expressed as,<br />
2<br />
EThevZ<br />
L<br />
S =<br />
(6)<br />
L 2<br />
2<br />
Z + Z + 2Z<br />
Z cos( β −α)<br />
Thev<br />
L<br />
Thev<br />
Determ<strong>in</strong>e the maximum load apparent<br />
power S L by differentiat<strong>in</strong>g equation (6)<br />
with respect to the load impedance Z L , or<br />
∂S L /∂Z L = 0, hence,<br />
2<br />
EThev<br />
S<br />
max<br />
=<br />
(7)<br />
L<br />
2Z<br />
(1 + 2cos( β −α))<br />
Thev<br />
A voltage collapse will occur if the<br />
ratio of S L to S Lmax is equal to 1, that is,<br />
SL<br />
= 1<br />
(8)<br />
S<br />
L max<br />
L<br />
108
Muhammad Nizam, A Static And Dynamic Technique Cont<strong>in</strong>gency Rank<strong>in</strong>g Analysis<br />
Substitut<strong>in</strong>g equations (6) <strong>and</strong> (7) <strong>in</strong>to<br />
(8) we get,<br />
2S<br />
LZThev<br />
( 1+<br />
cos( β − α ))<br />
PTSI = (9)<br />
2<br />
EThev<br />
where,<br />
S L is Load power at a bus<br />
β phase angle of Theven<strong>in</strong> bus<br />
Z Thev is impedance Theven<strong>in</strong> connected at<br />
bus α phase angle of Load bus<br />
E Thev is voltage Theven<strong>in</strong> at bus<br />
The other <strong>in</strong>dices that have been<br />
proposed by other researchers namely<br />
VCPI are also described(Balamourgan et.<br />
al., 2004). The calculation of the voltage<br />
collapse prediction <strong>in</strong>dex (VCPI) requires<br />
voltage phasor <strong>in</strong>formation of the<br />
participat<strong>in</strong>g buses <strong>in</strong> a system <strong>and</strong><br />
network admittance matrix.<br />
VCPI<br />
'<br />
m<br />
k<br />
= 1−<br />
N<br />
∑<br />
m=<br />
1<br />
m≠k<br />
V<br />
V<br />
k<br />
'<br />
m<br />
(10)<br />
V <strong>in</strong> equation (10) is given by<br />
' Ykm<br />
Vm<br />
= V<br />
(11)<br />
N m<br />
Y<br />
∑<br />
j=<br />
1<br />
j≠k<br />
kj<br />
where,<br />
V k is the voltage phasor at bus k<br />
V m is the voltage phasor at bus m<br />
Y km is the admittance between bus k <strong>and</strong><br />
bus m<br />
Y kj is the admittance between bus k <strong>and</strong><br />
bus j<br />
k is the monitor<strong>in</strong>g bus<br />
m is the other bus connected to bus k<br />
The value of VCPI varies between 0<br />
<strong>and</strong> 1. If the <strong>in</strong>dex is zero, the voltage at<br />
bus k is considered stable <strong>and</strong> if the <strong>in</strong>dex<br />
is unity, a voltage collapse is said to occur.<br />
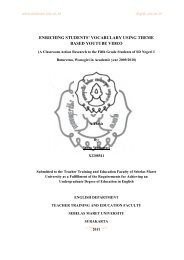
TEST SYSTEM AND MODELING<br />
This paper presented comparison<br />
<strong>technique</strong> of <strong>static</strong> <strong>and</strong> <strong>dynamic</strong> <strong>analysis</strong><br />
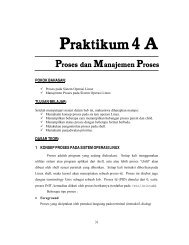
for voltage collapse. The New Engl<strong>and</strong><br />
(IEEE 39 bus) power system shown <strong>in</strong><br />
Figure 1 is used as the test system. Power<br />
System Analysis Toolbox is used <strong>in</strong> the<br />
simulation presented <strong>in</strong> this paper. For<br />
<strong>static</strong> power flow simulation, we followed<br />
the general methodology used for plann<strong>in</strong>g<br />
<strong>and</strong> operation <strong>in</strong> power system. The loads<br />
were represented mixed load as <strong>static</strong> <strong>and</strong><br />
voltage sensitive load (Induction Motors).<br />
Reference (Hasani&Paniani, 2005)<br />
describes the general consideration of<br />
<strong>static</strong> <strong>analysis</strong>.<br />
For <strong>dynamic</strong> simulation, the 39 bus<br />
test system which is used <strong>in</strong> the <strong>dynamic</strong><br />
simulation conta<strong>in</strong>s a variety of power<br />
system component models. The system as<br />
shown <strong>in</strong> Figure 1 consists of ten<br />
generators connected at buses 30 to 39 <strong>in</strong><br />
which bus 31 is a slack bus. All generators<br />
are equipped with identical automatic<br />
voltage regulator (AVR), over excitation<br />
limiters (OEL) <strong>and</strong> turb<strong>in</strong>e governor. The<br />
load <strong>and</strong> l<strong>in</strong>e data of the test system for<br />
steady state power flow calculation are<br />
given <strong>in</strong> appendix A.<br />
Figure 1. One-L<strong>in</strong>e diagram of the 39-bus<br />
test system<br />
109
Muhammad Nizam, A Static And Dynamic Technique Cont<strong>in</strong>gency Rank<strong>in</strong>g Analysis<br />
Generator <strong>and</strong> Load Model<strong>in</strong>g<br />
All the ten generators have identical<br />
<strong>dynamic</strong> characteristics us<strong>in</strong>g the sixth<br />
order synchronous mach<strong>in</strong>e model (two<br />
axes, with two w<strong>in</strong>d<strong>in</strong>gs on each axis) for<br />
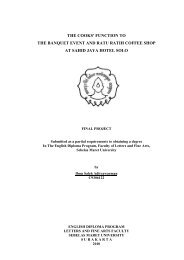
each generator (Milano, 2005). The AVR<br />
of IEEE model 1, Over Exciter Limiter <strong>and</strong><br />
the type 1 steam turb<strong>in</strong>e governors as<br />
shown <strong>in</strong> Figure 2 <strong>and</strong> 3 are used <strong>in</strong> the<br />
study. Both AVR <strong>and</strong> over excitation<br />
limiter (OEL) regulate the voltage at the<br />
synchronous generator term<strong>in</strong>al by<br />
perform<strong>in</strong>g both regulat<strong>in</strong>g <strong>and</strong> excitation<br />
system stabiliz<strong>in</strong>g functions. Specification<br />
of AVR, OEL <strong>and</strong> Turb<strong>in</strong>e governor is<br />
shown on table 1, 2 <strong>and</strong> 3. The AVR<br />
def<strong>in</strong>es the primary voltage regulation of<br />
the synchronous generator while the OEL<br />
provides an additional signal to the<br />
reference voltage of AVR (Silva et.al,<br />
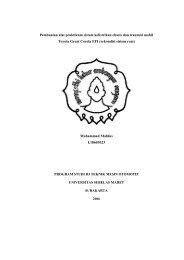
2004). The turb<strong>in</strong>e governor Type 1<br />
(Milano, 2006) def<strong>in</strong>e the primary<br />
frequency regulation of the synchronous<br />
generators.<br />
The entire system conta<strong>in</strong>s six<br />
<strong>in</strong>duction motors which have identical<br />
<strong>dynamic</strong> characteristics. The type of<br />
<strong>in</strong>duction motor used is the s<strong>in</strong>gle cage<br />
<strong>in</strong>duction motor model. These <strong>in</strong>duction<br />
motors are connected at bus 4, 12, 16, 21<br />
<strong>and</strong> 23 with rat<strong>in</strong>gs of 500 + j184 MVA,<br />
8.5 + j88 MVA, 329 + j32.3 MVA, 274 +<br />
j115 MVA, <strong>and</strong> 23 of 247.5 + j84.6 MVA,<br />
respectively. Table 4 gives the detailed<br />
specification of each <strong>in</strong>duction motor.<br />
Ka<br />
Tas + 1<br />
1<br />
T r<br />
s + 1<br />
K<br />
f<br />
s<br />
T s +1<br />
f<br />
S c<br />
1<br />
T e<br />
s + 1<br />
Figure 2. AVR – IEEE model 1<br />
1<br />
T3s<br />
+ 1 T4s<br />
+ 1<br />
T s s + 1<br />
TC<br />
s + 1 T5s<br />
+ 1<br />
Figure 3. Turb<strong>in</strong>e Governor – Type 1<br />
Table 1. AVR System Parameter – Type<br />
IEEE Model 1 (for All Generators)<br />
Table 2. Specification of Over Exciter<br />
Limiter (for All Generators)<br />
Table 3. Specification of Turb<strong>in</strong>e Governor<br />
– Type 1 (for All Generators)<br />
Table 4. Specification of <strong>in</strong>duction motor<br />
(for All Motors)<br />
ULTC Transformer Model<strong>in</strong>g<br />
The ULTC is used for controll<strong>in</strong>g the<br />
secondary voltage (Huang&Zhang, 2001).<br />
Its action is represented with time delay<br />
<strong>and</strong> deadb<strong>and</strong>s <strong>in</strong> which the time delay for<br />
ULTC is assumed to be 1 second. The tap<br />
ratio considered has a m<strong>in</strong>imum <strong>and</strong><br />
maximum voltage tap of 0.8 p.u. <strong>and</strong> 1.2<br />
p.u., respectively, with a step of 0.025<br />
p.u. per tap or 16 steps.<br />
The Scenario<br />
This research has two scenarios to<br />
compare <strong>static</strong> <strong>and</strong> <strong>dynamic</strong> <strong>analysis</strong> for<br />
voltage collapse. The base case condition<br />
110
Muhammad Nizam, A Static And Dynamic Technique Cont<strong>in</strong>gency Rank<strong>in</strong>g Analysis<br />
IEEE 39 bus was used for <strong>cont<strong>in</strong>gency</strong><br />
selection. This <strong>cont<strong>in</strong>gency</strong> selection is<br />
based on voltage <strong>in</strong>stability <strong>in</strong> power<br />
system (Hasani&Paniani, 2005). The <strong>static</strong><br />
<strong>analysis</strong> methods were used to select the<br />
most severe conditions correspond<strong>in</strong>g to<br />
every load <strong>in</strong> load <strong>in</strong>crement <strong>cont<strong>in</strong>gency</strong><br />
at bus 15.<br />
To f<strong>in</strong>d the loadibility marg<strong>in</strong> of <strong>static</strong><br />
<strong>and</strong> <strong>dynamic</strong> methods can be def<strong>in</strong>ed at<br />
one bus, one sub-area or the entire system.<br />
This paper the entire system loadability is<br />
calculated to f<strong>in</strong>d maximum power marg<strong>in</strong><br />
<strong>in</strong> the entire system. First for <strong>static</strong><br />
<strong>analysis</strong> cont<strong>in</strong>uation power flow is used.<br />
A second for the <strong>dynamic</strong> <strong>analysis</strong> is us<strong>in</strong>g<br />
time doma<strong>in</strong> simulation with <strong>in</strong>crement<br />
load at bus 15 at a rate of 0.1 + j0.05 p.u.<br />
MVA/s with <strong>in</strong>itial load of 3.20+j1.53 p.u.<br />
A third method to determ<strong>in</strong>e the maximum<br />
loadability is giv<strong>in</strong>g the disturbance as l<strong>in</strong>e<br />
outage between bus 4 <strong>and</strong> 14 <strong>and</strong><br />
<strong>in</strong>crement load at bus 15 at a rate of 0.1 +<br />
j0.05 p.u. MVA/s with <strong>in</strong>itial load of<br />
3.20+j1.53 p.u.<br />
The <strong>technique</strong> to compare <strong>static</strong> <strong>and</strong><br />
<strong>dynamic</strong> at voltage collapse po<strong>in</strong>t is us<strong>in</strong>g<br />
eigenvalue <strong>analysis</strong> as <strong>static</strong> <strong>analysis</strong> <strong>and</strong><br />
power transfer stability <strong>in</strong>dex (PTSI) <strong>and</strong><br />
voltage collapse prediction <strong>in</strong>dex (VCPI)<br />
as the <strong>dynamic</strong> tools <strong>analysis</strong>. To reach<br />
voltage collapse at system, the <strong>in</strong>crement<br />
load at bus 15 at a rate of 0.1 + j0.05 p.u.<br />
MVA/s with <strong>in</strong>itial load of 3.20+j1.53 p.u.<br />
is used as a <strong>cont<strong>in</strong>gency</strong>. Status of<br />
stability, voltage collapse <strong>and</strong> <strong>cont<strong>in</strong>gency</strong><br />
<strong>rank<strong>in</strong>g</strong> is calculated when the simulation<br />
is stop. Other cont<strong>in</strong>gencies also presented<br />
as a l<strong>in</strong>e outage between bus 3 <strong>and</strong> 4 <strong>and</strong> a<br />
generator outages at bus 30.<br />
RESULT<br />
In these four test cases is considered to<br />
evaluate the performance of <strong>static</strong> <strong>and</strong><br />
<strong>dynamic</strong>s <strong>analysis</strong> for voltage collapse.<br />
Comparison of Static <strong>and</strong> Dynamic<br />
Methods to f<strong>in</strong>d Loadability Marg<strong>in</strong>s<br />
A first method, the cont<strong>in</strong>uation power<br />
flow, is used to f<strong>in</strong>d the maximum power<br />
marg<strong>in</strong> <strong>in</strong> entire system. The <strong>in</strong>itial value<br />
shows total load of 65.2843 p.u. MVA.<br />
The cont<strong>in</strong>uation power flow shows the<br />
marg<strong>in</strong> <strong>in</strong> entire system to be 159.5 p.u.<br />
MVA.<br />
A second method, <strong>in</strong>creas<strong>in</strong>g load is<br />
happened at bus 15 with a rate <strong>in</strong>crease of<br />
0.1 + j0.05 p.u. MVA/s with <strong>in</strong>itial load of<br />
3.20+j1.53 p.u. The <strong>in</strong>itial value shows<br />
total load of 65.2843 p.u. MVA. Us<strong>in</strong>g the<br />
<strong>dynamic</strong> simulations by PSAT, the<br />
maximum load<strong>in</strong>g of entire system was<br />
found 141.18 p.u. MVA.<br />
A third methods to determ<strong>in</strong>e<br />
maximum loadability is giv<strong>in</strong>g the<br />
disturbance as l<strong>in</strong>e outage between bus 4<br />
<strong>and</strong> 14 <strong>and</strong> <strong>in</strong>crement load at bus 15 at a<br />
rate of 0.1 + j0.05 p.u. MVA/s with <strong>in</strong>itial<br />
load of 3.20+j1.53 p.u. By follow<strong>in</strong>g this<br />
methods the maximum load<strong>in</strong>g of entire<br />
system was found to be 95.0147 p.u. MVA<br />
with <strong>in</strong>itial value shows total load of<br />
65.2843 p.u. MVA. The reason for the<br />
difference between two marg<strong>in</strong>s is the<br />
second method the load <strong>in</strong>crease was only<br />
assigned to load impedance. Results of<br />
three method show on table 5.<br />
From maximum loadability showed at<br />
table 5 <strong>in</strong>dicate the <strong>static</strong> method is<br />
optimistic <strong>in</strong> evaluat<strong>in</strong>g the stability<br />
marg<strong>in</strong>.<br />
Table 5. Comparison Maximum Loadability<br />
of Static <strong>and</strong> Dynamic<br />
Method Maximum Loadability<br />
Static - CPF<br />
159.5 p.u<br />
Dynamic :<br />
1.Load Increment<br />
141.18 p.u.<br />
2.Load Increment<br />
95.015 p.u.<br />
<strong>and</strong> L<strong>in</strong>e outages<br />
111
Muhammad Nizam, A Static And Dynamic Technique Cont<strong>in</strong>gency Rank<strong>in</strong>g Analysis<br />
Comparison of Static <strong>and</strong> Dynamic<br />
Methods to f<strong>in</strong>d Bus Rank<strong>in</strong>g<br />
Identification.<br />
In voltage stability control part is very<br />
important. The bus identification system is<br />
part of it. The bus identification is to f<strong>in</strong>d<br />
the weak area of the system. To compare<br />
the <strong>static</strong> <strong>and</strong> <strong>dynamic</strong> methods can be<br />
def<strong>in</strong>ed at every load bus <strong>in</strong> the entire<br />
system. First, the Eigen value <strong>analysis</strong> is<br />
used for <strong>static</strong> method <strong>analysis</strong>. The power<br />
transfer stability <strong>in</strong>dex (PTSI) <strong>and</strong> voltage<br />
collapse prediction <strong>in</strong>dex (VCPI) are used<br />
for <strong>dynamic</strong>s methods <strong>analysis</strong>. A<br />
<strong>cont<strong>in</strong>gency</strong> is used to create voltage<br />
collapse as load <strong>in</strong>crement at bus 15, load<br />
<strong>in</strong>crement at bus 15. Load <strong>in</strong>crease at bus<br />
15 at a rate of 0.1 + j0.05 p.u. MVA/s with<br />
<strong>in</strong>itial load of 3.20+j1.53 p.u. MVA.<br />
Analysis is taken at a po<strong>in</strong>t when the<br />
simulation stop or voltage collapse occurs.<br />
Result of the simulation showed that the<br />
voltage <strong>in</strong> time doma<strong>in</strong> simulation at every<br />
load bus. The simulation end at t = 24 sec.<br />
From this case the comparison result,<br />
<strong>static</strong> <strong>and</strong> <strong>dynamic</strong> <strong>cont<strong>in</strong>gency</strong> <strong>rank<strong>in</strong>g</strong><br />
<strong>analysis</strong> can be shown as a table 6.<br />
At table 6 showed <strong>rank<strong>in</strong>g</strong> at both<br />
<strong>static</strong> <strong>and</strong> <strong>dynamic</strong> <strong>analysis</strong>. Rank<strong>in</strong>g<br />
arrange from the highest to lowest at PTSI<br />
<strong>and</strong> VCPI. The higher <strong>in</strong>dicate the weaker<br />
bus. The Eigen value arrange from low to<br />
high. The lowest <strong>in</strong>dicate the weaker bus.<br />
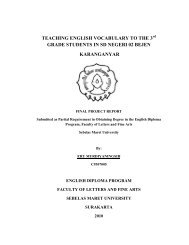
From table 6 the weakest bus <strong>in</strong>dicates<br />
at bus 15. Figure 5 shows the bar chart<br />
comparison between <strong>static</strong> <strong>and</strong> <strong>dynamic</strong> <strong>in</strong><br />
every load buses.<br />
Voltage (pu)<br />
1.1<br />
1<br />
0.9<br />
0.8<br />
0.7<br />
0.6<br />
0.5<br />
V 4<br />
V 7<br />
V 8<br />
V 12<br />
V 15<br />
V 16<br />
V 17<br />
V 20<br />
V 21<br />
V 24<br />
V 25<br />
V 26<br />
V 27<br />
V 28<br />
V 29<br />
V 39<br />
0.4<br />
0 5 10 15 20 25<br />
time (second)<br />
Figure 4. Voltage vs Time at load<br />
<strong>in</strong>crement <strong>cont<strong>in</strong>gency</strong><br />
Table 6. Rank<strong>in</strong>g <strong>cont<strong>in</strong>gency</strong> for load<br />
<strong>in</strong>crement at Bus 15<br />
For stability <strong>rank<strong>in</strong>g</strong>, there are two<br />
status of stability <strong>in</strong> every load bus. First,<br />
determ<strong>in</strong>e stable or unstable the system,<br />
second, determ<strong>in</strong>e voltage collapse <strong>in</strong><br />
every load bus. Table 7 shows the status of<br />
stability <strong>in</strong> every load bus.<br />
# Rank<strong>in</strong>g No<br />
16<br />
14<br />
12<br />
10<br />
8<br />
6<br />
4<br />
2<br />
0<br />
4<br />
7<br />
Rank<strong>in</strong>g at a Bus<br />
8<br />
12<br />
15<br />
16<br />
17<br />
20<br />
21<br />
24<br />
25<br />
26<br />
27<br />
28<br />
29<br />
39<br />
PTSI<br />
VCPI<br />
Eigen Value<br />
# Bus No<br />
Figure 5. Bar chart comparison<br />
<strong>static</strong> <strong>and</strong> <strong>dynamic</strong> <strong>cont<strong>in</strong>gency</strong><br />
112
Muhammad Nizam, A Static And Dynamic Technique Cont<strong>in</strong>gency Rank<strong>in</strong>g Analysis<br />
Table 7. Comparison Status of Stability for<br />
Static <strong>and</strong> Dynamic <strong>analysis</strong><br />
From the <strong>static</strong> <strong>and</strong> <strong>dynamic</strong> give same<br />
<strong>in</strong>dicates. Accord<strong>in</strong>g to part 2.1 positive<br />
value of Eigen value <strong>in</strong>dicate the system is<br />
stable when negative value is <strong>in</strong>dicat<strong>in</strong>g<br />
system unstable. In <strong>dynamic</strong> <strong>in</strong>dicator also<br />
give same <strong>in</strong>dicate, especially for PTSI.<br />
The PTSI give more accurate than VCPI.<br />
In this case both <strong>static</strong> <strong>and</strong> <strong>dynamic</strong>s<br />
<strong>analysis</strong> gives same trend.<br />
It showed at Table 7, that the VCPI<br />
give all bus <strong>in</strong> stable authority <strong>and</strong> PTSI<br />
give one bus collapse when fifteen buses is<br />
<strong>in</strong> stable authority. It can be shown at table<br />
7 Eigen value is giv<strong>in</strong>g ten buses are<br />
unstable <strong>and</strong> six more bus are still <strong>in</strong> stable<br />
authority. One bus said collapse when the<br />
Eigen value equal to zero. Negative Eigen<br />
value also mean a bus is collapsed.<br />
Accord<strong>in</strong>g to section 2.1 the least Eigen<br />
value is very unstable bus. In other word it<br />
can be said that negative part of Eigen<br />
value show which is the bus reach collapse<br />
first. Compare to the PTSI, the trend is<br />
same as the Eigen value <strong>analysis</strong>. PTSI<br />
only show until value unity. The PTSI<br />
value near unity gives <strong>in</strong>formation that a<br />
bus is stable but nearly to voltage collapse.<br />
From load <strong>in</strong>crement <strong>cont<strong>in</strong>gency</strong><br />
showed that the <strong>static</strong> (Eigen value<br />
<strong>analysis</strong>) <strong>and</strong> <strong>dynamic</strong> (PTSI) is give most<br />
same of <strong>cont<strong>in</strong>gency</strong> <strong>rank<strong>in</strong>g</strong> <strong>in</strong>dicator at<br />
entire system. The more optimistic load<br />
ability at <strong>static</strong> give more buses collapse<br />
compare to the <strong>dynamic</strong> <strong>analysis</strong>.<br />
CONCLUSIONS<br />
This paper presents a <strong>static</strong> <strong>and</strong> <strong>dynamic</strong><br />
<strong>cont<strong>in</strong>gency</strong> <strong>rank<strong>in</strong>g</strong> <strong>analysis</strong> <strong>in</strong> voltage<br />
stability assessment. The conclusion from<br />
this paper give us<strong>in</strong>g <strong>static</strong> methods, a<br />
voltage stability <strong>rank<strong>in</strong>g</strong> was performed to<br />
def<strong>in</strong>e fa<strong>in</strong>t buses. Then <strong>dynamic</strong> <strong>analysis</strong><br />
was used for most severe conditions.<br />
Result showed that <strong>static</strong> give more<br />
optimistic <strong>in</strong> evaluat<strong>in</strong>g load ability limit<br />
than <strong>dynamic</strong>. Although <strong>static</strong> methods<br />
base on power flow <strong>analysis</strong> is very<br />
suitable for screen<strong>in</strong>g, <strong>and</strong> determ<strong>in</strong>e the<br />
weak bus by calculat<strong>in</strong>g bus participation<br />
factor <strong>in</strong> the system, f<strong>in</strong>al decisions<br />
<strong>in</strong>volv<strong>in</strong>g several consideration both<br />
plann<strong>in</strong>g <strong>and</strong> operation should be confirm<br />
by more accurate time doma<strong>in</strong> simulation<br />
<strong>in</strong> which different characteristics of<br />
multiple controller, protection relays <strong>and</strong><br />
coord<strong>in</strong>ated them taken <strong>in</strong>to account.<br />
113
Muhammad Nizam, A Static And Dynamic Technique Cont<strong>in</strong>gency Rank<strong>in</strong>g Analysis<br />
References<br />
Balamourgan V, T.S.Sidhu, M.S.Sachdev, 2004, Technique For Onl<strong>in</strong>e Prediction of<br />
Voltage Collapse. IEE Proc-Generation, Transmission, Distribution, 151(4) 453-460.<br />
Dong F., Chowdhury B.H., Crow M., Acar L., 2004, Cause <strong>and</strong> Effect of Voltage<br />
Collapse – Case Study with Dynamic Simulations, IEEE PES General Meet<strong>in</strong>g, Vol<br />
2, pp. 1806-1812<br />
Hasani M <strong>and</strong> Parniani M., 2005, Method of Comb<strong>in</strong>ed Static <strong>and</strong> Dynamic Analysis of<br />
Voltage collapse <strong>in</strong> Voltage Stability Assessment, IEEE/PES Transmission <strong>and</strong><br />
Distribution Conference <strong>and</strong> Exhibition, Ch<strong>in</strong>a<br />
Huang G., Zhang H., 2001, Detection Voltage Stability Reserve Study For Deregulated<br />
Environment, Power System Eng<strong>in</strong>eer<strong>in</strong>g Research centre, http://www.pserc.wisc.<br />
edu/ecow/get/publicatio/2001public/<strong>dynamic</strong>reserve.pdf<br />
Kundur P., 1994, Power System Stability <strong>and</strong> Control, McGraw-Hills, Inc, New York.<br />
Milano F., Power System Analysis Toolbox Documentation For PSAT version 2.0.0.,<br />
http://thunderbox.uwaterloo.ca/~fmilano, (2006)<br />
Nizam M., Mohamed A., Hussa<strong>in</strong> A., 2006, Performance Evaluation of Voltage Stability<br />
Indices for Dynamic Voltage Collapse Prediction, Journal of Applied Science 6 (5) :<br />
1104-1113<br />
Silva A.S., Lerm A.A.P., Irv<strong>in</strong>g M. , A Basic Study of Voltage Instability with Inclusion of<br />
Limiters, IEEE/PES Transmission <strong>and</strong> distribution conference <strong>and</strong> Exposition, (2004)<br />
548-553<br />
114