Economic Models - Convex Optimization
Economic Models - Convex Optimization
Economic Models - Convex Optimization

You also want an ePaper? Increase the reach of your titles
YUMPU automatically turns print PDFs into web optimized ePapers that Google loves.
166 Anna-Maria Mouza<br />
increase for each group, the number of employees per group together with<br />
the ranking scores, I computed the index presented in the 4th column of<br />
Table 6. Multiplying the elements of this column by 59,090.0625, we get<br />
the entries of the 5th column.<br />
From the last column of Table 6, I computed the end period salary<br />
of each group and the corresponding annual rate of increase, which are<br />
presented in Table 7.<br />
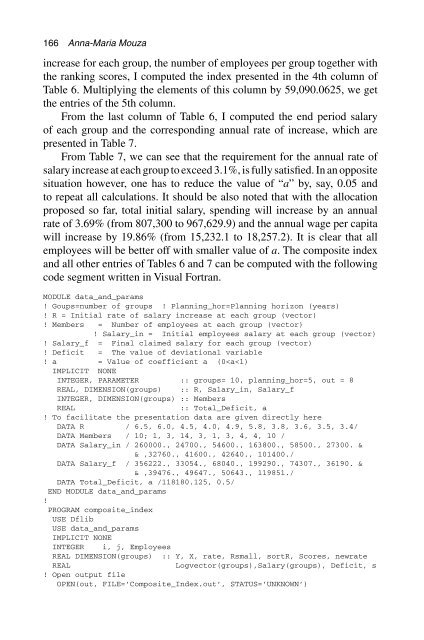
From Table 7, we can see that the requirement for the annual rate of<br />
salary increase at each group to exceed 3.1%, is fully satisfied. In an opposite<br />
situation however, one has to reduce the value of “a” by, say, 0.05 and<br />
to repeat all calculations. It should be also noted that with the allocation<br />
proposed so far, total initial salary, spending will increase by an annual<br />
rate of 3.69% (from 807,300 to 967,629.9) and the annual wage per capita<br />
will increase by 19.86% (from 15,232.1 to 18,257.2). It is clear that all<br />
employees will be better off with smaller value of a. The composite index<br />
and all other entries of Tables 6 and 7 can be computed with the following<br />
code segment written in Visual Fortran.<br />
MODULE data_and_params<br />
! Goups=number of groups ! Planning_hor=Planning horizon (years)<br />
! R = Initial rate of salary increase at each group (vector)<br />
! Members = Number of employees at each group (vector)<br />
! Salary_in = Initial employees salary at each group (vector)<br />
! Salary_f = Final claimed salary for each group (vector)<br />
! Deficit = The value of deviational variable<br />
! a = Value of coefficient a (0