Determination of EDTA in Dairy Wastewater and Adjacent Surface ...
Determination of EDTA in Dairy Wastewater and Adjacent Surface ...
Determination of EDTA in Dairy Wastewater and Adjacent Surface ...

Create successful ePaper yourself
Turn your PDF publications into a flip-book with our unique Google optimized e-Paper software.
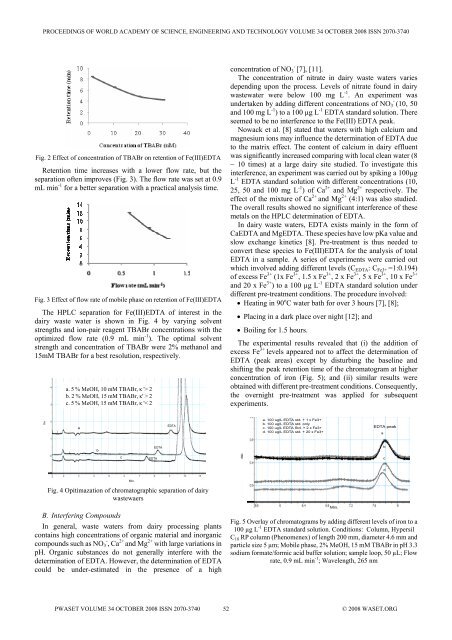
PROCEEDINGS OF WORLD ACADEMY OF SCIENCE, ENGINEERING AND TECHNOLOGY VOLUME 34 OCTOBER 2008 ISSN 2070-3740<br />
Fig. 2 Effect <strong>of</strong> concentration <strong>of</strong> TBABr on retention <strong>of</strong> Fe(III)<strong>EDTA</strong><br />
Retention time <strong>in</strong>creases with a lower flow rate, but the<br />
separation <strong>of</strong>ten improves (Fig. 3). The flow rate was set at 0.9<br />
mL m<strong>in</strong> -1 for a better separation with a practical analysis time.<br />
Fig. 3 Effect <strong>of</strong> flow rate <strong>of</strong> mobile phase on retention <strong>of</strong> Fe(III)<strong>EDTA</strong><br />
The HPLC separation for Fe(III)<strong>EDTA</strong> <strong>of</strong> <strong>in</strong>terest <strong>in</strong> the<br />
dairy waste water is shown <strong>in</strong> Fig. 4 by vary<strong>in</strong>g solvent<br />
strengths <strong>and</strong> ion-pair reagent TBABr concentrations with the<br />
optimized flow rate (0.9 mL m<strong>in</strong> -1 ). The optimal solvent<br />
strength <strong>and</strong> concentration <strong>of</strong> TBABr were 2% methanol <strong>and</strong><br />
15mM TBABr for a best resolution, respectively.<br />
a. 5 % MeOH, 10 mM TBABr, κ '> 2<br />
b. 2 % MeOH, 15 mM TBABr, κ' > 2<br />
c. 5 % MeOH, 15 mM TBABr, κ '< 2<br />
concentration <strong>of</strong> NO 3<br />
-<br />
[7], [11].<br />
The concentration <strong>of</strong> nitrate <strong>in</strong> dairy waste waters varies<br />
depend<strong>in</strong>g upon the process. Levels <strong>of</strong> nitrate found <strong>in</strong> dairy<br />
wastewater were below 100 mg L -1 . An experiment was<br />
undertaken by add<strong>in</strong>g different concentrations <strong>of</strong> NO 3<br />
-<br />
(10, 50<br />
<strong>and</strong> 100 mg L -1 ) to a 100 µg L -1 <strong>EDTA</strong> st<strong>and</strong>ard solution. There<br />
seemed to be no <strong>in</strong>terference to the Fe(III) <strong>EDTA</strong> peak.<br />
Nowack et al. [8] stated that waters with high calcium <strong>and</strong><br />
magnesium ions may <strong>in</strong>fluence the determ<strong>in</strong>ation <strong>of</strong> <strong>EDTA</strong> due<br />
to the matrix effect. The content <strong>of</strong> calcium <strong>in</strong> dairy effluent<br />
was significantly <strong>in</strong>creased compar<strong>in</strong>g with local clean water (8<br />
~ 10 times) at a large dairy site studied. To <strong>in</strong>vestigate this<br />
<strong>in</strong>terference, an experiment was carried out by spik<strong>in</strong>g a 100µg<br />
L -1 <strong>EDTA</strong> st<strong>and</strong>ard solution with different concentrations (10,<br />
25, 50 <strong>and</strong> 100 mg L -1 ) <strong>of</strong> Ca 2+ <strong>and</strong> Mg 2+ respectively. The<br />
effect <strong>of</strong> the mixture <strong>of</strong> Ca 2+ <strong>and</strong> Mg 2+ (4:1) was also studied.<br />
The overall results showed no significant <strong>in</strong>terference <strong>of</strong> these<br />
metals on the HPLC determ<strong>in</strong>ation <strong>of</strong> <strong>EDTA</strong>.<br />
In dairy waste waters, <strong>EDTA</strong> exists ma<strong>in</strong>ly <strong>in</strong> the form <strong>of</strong><br />
Ca<strong>EDTA</strong> <strong>and</strong> Mg<strong>EDTA</strong>. These species have low pKa value <strong>and</strong><br />
slow exchange k<strong>in</strong>etics [8]. Pre-treatment is thus needed to<br />
convert these species to Fe(III)<strong>EDTA</strong> for the analysis <strong>of</strong> total<br />
<strong>EDTA</strong> <strong>in</strong> a sample. A series <strong>of</strong> experiments were carried out<br />
which <strong>in</strong>volved add<strong>in</strong>g different levels (C <strong>EDTA</strong> : C Fe3+ =1:0.194)<br />
<strong>of</strong> excess Fe 3+ (1x Fe 3+ , 1.5 x Fe 3+ , 2 x Fe 3+ , 5 x Fe 3+ , 10 x Fe 3+<br />
<strong>and</strong> 20 x Fe 3+ ) to a 100 µg L -1 <strong>EDTA</strong> st<strong>and</strong>ard solution under<br />
different pre-treatment conditions. The procedure <strong>in</strong>volved:<br />
• Heat<strong>in</strong>g <strong>in</strong> 90 o C water bath for over 3 hours [7], [8];<br />
• Plac<strong>in</strong>g <strong>in</strong> a dark place over night [12]; <strong>and</strong><br />
• Boil<strong>in</strong>g for 1.5 hours.<br />
The experimental results revealed that (i) the addition <strong>of</strong><br />
excess Fe 3+ levels appeared not to affect the determ<strong>in</strong>ation <strong>of</strong><br />
<strong>EDTA</strong> (peak areas) except by disturb<strong>in</strong>g the basel<strong>in</strong>e <strong>and</strong><br />
shift<strong>in</strong>g the peak retention time <strong>of</strong> the chromatogram at higher<br />
concentration <strong>of</strong> iron (Fig. 5); <strong>and</strong> (ii) similar results were<br />
obta<strong>in</strong>ed with different pre-treatment conditions. Consequently,<br />
the overnight pre-treatment was applied for subsequent<br />
experiments.<br />
mv<br />
a<br />
<strong>EDTA</strong><br />
a. 100 ug/L <strong>EDTA</strong> std. + 1 x Fe3+<br />
b. 100 ug/L <strong>EDTA</strong> std. only<br />
c. 100 ug/L <strong>EDTA</strong> Std. + 2 x Fe3+<br />
d. 100 ug/L <strong>EDTA</strong> std. + 20 x Fe3+<br />
<strong>EDTA</strong> peak<br />
a<br />
b<br />
<strong>EDTA</strong><br />
mv<br />
b<br />
c<br />
<strong>EDTA</strong><br />
mv<br />
c<br />
d<br />
M<strong>in</strong>.<br />
Fig. 4 Opitimazation <strong>of</strong> chromatographic separation <strong>of</strong> dairy<br />
wastewaers<br />
M<strong>in</strong>.<br />
B. Interfer<strong>in</strong>g Compounds<br />
In general, waste waters from dairy process<strong>in</strong>g plants<br />
conta<strong>in</strong>s high concentrations <strong>of</strong> organic material <strong>and</strong> <strong>in</strong>organic<br />
compounds such as NO - 3 , Ca 2+ <strong>and</strong> Mg 2+ with large variations <strong>in</strong><br />
pH. Organic substances do not generally <strong>in</strong>terfere with the<br />
determ<strong>in</strong>ation <strong>of</strong> <strong>EDTA</strong>. However, the determ<strong>in</strong>ation <strong>of</strong> <strong>EDTA</strong><br />
could be under-estimated <strong>in</strong> the presence <strong>of</strong> a high<br />
Fig. 5 Overlay <strong>of</strong> chromatograms by add<strong>in</strong>g different levels <strong>of</strong> iron to a<br />
100 µg L -1 <strong>EDTA</strong> st<strong>and</strong>ard solution. Conditions: Column, Hypersil<br />
C 18 RP column (Phenomenex) <strong>of</strong> length 200 mm, diameter 4.6 mm <strong>and</strong><br />
particle size 5 µm; Mobile phase, 2% MeOH, 15 mM TBABr <strong>in</strong> pH 3.3<br />
sodium formate/formic acid buffer solution; sample loop, 50 µL; Flow<br />
rate, 0.9 mL m<strong>in</strong> -1 ; Wavelength, 265 nm<br />
M<strong>in</strong>.<br />
PWASET VOLUME 34 OCTOBER 2008 ISSN 2070-3740 52 © 2008 WASET.ORG