PHY 222 LAB 11-2: Pendulum
PHY 222 LAB 11-2: Pendulum
PHY 222 LAB 11-2: Pendulum

Create successful ePaper yourself
Turn your PDF publications into a flip-book with our unique Google optimized e-Paper software.
<strong>PHY</strong> <strong>222</strong> <strong>LAB</strong> <strong>11</strong>-2: <strong>Pendulum</strong><br />
Objective: Use video analysis to study the motion of a pendulum using the Angular Momentum<br />
Principle.<br />
Background<br />
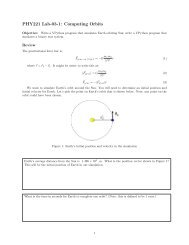
A simple pendulum is composed of a string and mass (0.2 kg) as shown in Figure ??.<br />
θ<br />
y<br />
R<br />
x<br />
Fgrav<br />
Figure 1: A simple pendulum.<br />
The gravitational force on the mass exerts a torque on the pendulum that changes its angular momentum,<br />
according to the Angular Momentum Principle. Calculate torque and angular momentum about the pivot.<br />
⃗τ net<br />
= d⃗ L<br />
dt<br />
⃗τ grav<br />
= d (⃗r × ⃗p)<br />
dt<br />
τ z = d dt (Rp)<br />
= mR dv<br />
dt<br />
= mR d dt (Rω)<br />
= mR 2 dω<br />
dt<br />
= mR 2 d2 θ<br />
dt 2<br />
In this experiment, you are going to graph the torque due to the gravitational force (τ = F x) vs. the<br />
angular acceleration (α = d2 θ<br />
dt<br />
), and from your graph you will measure the moment of inertia of the pendulum<br />
2<br />
(I = mR 2 ). Using the moment of inertia, you will calculate mass of the pendulum and compare it to what<br />
you measure with a balance.<br />
Experiment<br />
1. Go to our course web site and download the video <strong>11</strong>-2-pendulum-3cycles.mov.<br />
2. Import the video into Logger Pro for analysis.<br />
1
3. Set the origin to be at the pivot and use the meterstick to calibrate distance in the video.<br />
4. Mark the position of the mass as it swings from the far right to the far left. You should mark the top<br />
edge of the green sticker. (In fact the top edge is probably still a bit lower than its center of mass. Be<br />
consistent.)<br />
5. Create a new calculated column for R = √ (x 2 + y 2 ).<br />
6. Create a new calculated column for θ. Use the function atan2(x,-y) (see the triangle in the picture<br />
above).<br />
7. Create a new calculated column for ω = dθ<br />
dt .<br />
8. Create a new calculated column for α = d2 θ<br />
dt 2 .<br />
9. Create a new calculated column for τ = F x.<br />
10. Graph τ vs.<br />
d 2 θ<br />
dt 2 . Do a linear fit to the linear portion of the graph. Do not include data on the edges<br />
of the curve since the derivative function for the end data points has numerical error.<br />
What is the equation for the linear curve fit?<br />
What does the slope represent?<br />
Use the slope to determine the mass of the pendulum.<br />
Compare the mass of the pendulum determined from the curve fit to its actual mass, 0.2 kg. Calculate the<br />
percent difference in the values.<br />
2
The torque on the pendulum can be written as mgR sin(θ). Write a differential equation that relates θ, t, g,<br />
and R.<br />
Fit a curve to θ vs. t and use your curve fit to determine the frequency f and period T for the pendulum.<br />
√<br />
The theoretical period of a pendulum with small angle oscillations is T = 2π<br />
L<br />
g<br />
where L is the length of<br />
the pendulum. In this experiment, we called it R. Calculate the period of the pendulum from theory using<br />
the average radius R measured from the data in the video.<br />
What is the percent difference between the measured period and the calculated (theoretical) period of the<br />
pendulum?<br />
3