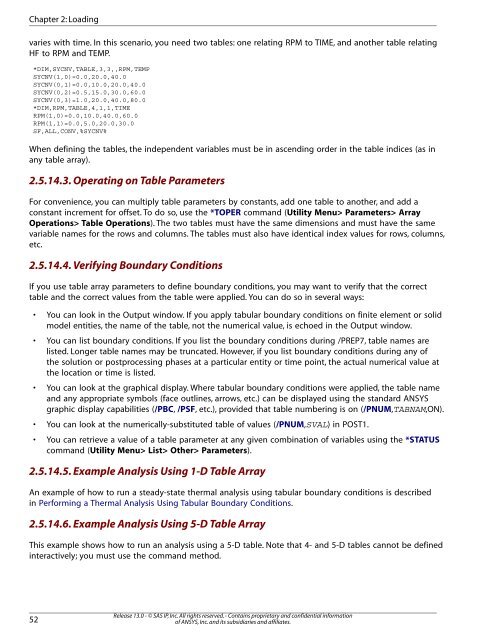
Chapter 2: Loading varies with time. In this scenario, you need two tables: one relating RPM to TIME, and another table relating HF to RPM and TEMP. *DIM,SYCNV,TABLE,3,3,,RPM,TEMP SYCNV(1,0)=0.0,20.0,40.0 SYCNV(0,1)=0.0,10.0,20.0,40.0 SYCNV(0,2)=0.5,15.0,30.0,60.0 SYCNV(0,3)=1.0,20.0,40.0,80.0 *DIM,RPM,TABLE,4,1,1,TIME RPM(1,0)=0.0,10.0,40.0,60.0 RPM(1,1)=0.0,5.0,20.0,30.0 SF,ALL,CONV,%SYCNV% When defining the tables, the independent variables must be in ascending order in the table indices (as in any table array). 2.5.14.3. Operating on Table Parameters For convenience, you can multiply table parameters by constants, add one table to another, and add a constant increment for offset. To do so, use the *TOPER command (Utility Menu> Parameters> Array Operations> Table Operations). The two tables must have the same dimensions and must have the same variable names for the rows and columns. The tables must also have identical index values for rows, columns, etc. 2.5.14.4. Verifying Boundary Conditions If you use table array parameters to define boundary conditions, you may want to verify that the correct table and the correct values from the table were applied. You can do so in several ways: • You can look in the Output window. If you apply tabular boundary conditions on finite element or solid model entities, the name of the table, not the numerical value, is echoed in the Output window. • You can list boundary conditions. If you list the boundary conditions during /PREP7, table names are listed. Longer table names may be truncated. However, if you list boundary conditions during any of the solution or postprocessing phases at a particular entity or time point, the actual numerical value at the location or time is listed. • You can look at the graphical display. Where tabular boundary conditions were applied, the table name and any appropriate symbols (face outlines, arrows, etc.) can be displayed using the standard ANSYS graphic display capabilities (/PBC, /PSF, etc.), provided that table numbering is on (/PNUM,TABNAM,ON). • You can look at the numerically-substituted table of values (/PNUM,SVAL) in POST1. • You can retrieve a value of a table parameter at any given combination of variables using the *STATUS command (Utility Menu> List> Other> Parameters). 2.5.14.5. Example <strong>Analysis</strong> Using 1-D Table Array An example of how to run a steady-state thermal analysis using tabular boundary conditions is described in Performing a Thermal <strong>Analysis</strong> Using Tabular Boundary Conditions. 2.5.14.6. Example <strong>Analysis</strong> Using 5-D Table Array This example shows how to run an analysis using a 5-D table. Note that 4- and 5-D tables cannot be defined interactively; you must use the command method. 52 Release 13.0 - © SAS IP, Inc. All rights reserved. - Contains proprietary and confidential information of ANSYS, Inc. and its subsidiaries and affiliates.
This problem consists of a thermal-stress analysis with a pressure that varies as a function of (x,y,z,time,temp). The table and table values are first defined. The table is applied as a pressure boundary condition to the faces of a rectangular beam. Time and temperature are prescribed for two load steps and solved. /batch,list /title, Illustrate use of 5D table for SF command (pressure) loading !!!! !!!! !!!! create 5D table for applied pressure X1=2 !!!! X dimensionality Y1=2 !!!! Y dimensionality Z1=10 !!!! Z dimensionality D4=5 !!!! time dimensionality D5=5 !!!! temperature dimensionality len=10 !!!! cantilever beam length wid=1 !!!! cantilever beam width hth=2 !!!! cantilever beam height *dim,xval,array,X1 !!!! create 1D arrays to load 5D table xval(1)=0,20 !!!! variations per dimension same *dim,yval,array,Y1 !!!! but will give different values on each yval(1)=0,20 !!!! book and shelf *dim,zval,array,10 zval(1)=10,20,30,40,50,60,70,80,90,100 *dim,tval,array,5 tval(1)=1,.90,.80,.70,.60 *dim,tevl,array,5 tevl(1)=1,1.20,1.30,1.60,1.80 *dim,ccc,tab5,X1,Y1,Z1,D4,D5,X,Y,Z,TIME,TEMP *taxis,ccc(1,1,1,1,1),1,0,wid !!! X-Dim *taxis,ccc(1,1,1,1,1),2,0,hth !!! Y-Dim *taxis,ccc(1,1,1,1,1),3,1,2,3,4,5,6,7,8,9,10 !!! Z-Dim *taxis,ccc(1,1,1,1,1),4,0,10,20,30,40 !!! Time *taxis,ccc(1,1,1,1,1),5,0,50,100,150,200 !!! Temp *do,ii,1,2 *do,jj,1,2 *do,kk,1,10 *do,ll,1,5 *do,mm,1,5 ccc(ii,jj,kk,ll,mm)=(xval(ii)+yval(jj)+zval(kk))*tval(ll)*tevl(mm) *enddo *enddo *enddo *enddo *enddo /prep7 block,,wid,,hth,,len !!!! create beam volume et,1,5 !!!! use SOLID5 esize,0.5 !!!! element size mshkey,1 !!!! mapped mesh vmesh,all mp,ex,1,1e7 !!!! material properties mp,nuxy,1,.3 mp,kxx,1,1 nsel,s,loc,z,0 !!!! fix end of beam d,all,all fini save !!!! save problem for future restart /solu antyp,trans timint,off asel,u,loc,z,0 sfa,all,1,pres,%ccc% !!!! apply pressure to all selected areas alls 2.5.14. Applying Loads Using TABLE Type Array Parameters Release 13.0 - © SAS IP, Inc. All rights reserved. - Contains proprietary and confidential information of ANSYS, Inc. and its subsidiaries and affiliates. 53
- Page 1 and 2:
ANSYS Mechanical APDL Basic Analysi
- Page 3 and 4:
Table of Contents 1. Getting Starte
- Page 5 and 6:
2.8.4.3. Define Material Properties
- Page 7 and 8:
7.2.1.6. Particle Flow and Charged
- Page 9 and 10:
10. Getting Started with Graphics .
- Page 11 and 12:
13.2.4.1.Turning Load Symbols and C
- Page 13 and 14:
20.8. Reviewing Contents of Binary
- Page 15 and 16:
List of Tables 2.1. DOF Constraints
- Page 17 and 18: Chapter 1: Getting Started with ANS
- Page 19 and 20: shown below define two element type
- Page 21 and 22: You can choose constant, isotropic,
- Page 23 and 24: You can save linear material proper
- Page 25 and 26: Figure 1.4 Material Model Interface
- Page 27 and 28: Figure 1.7 Data Input Dialog Box -
- Page 29 and 30: The first example below is intended
- Page 31 and 32: 9. Click on OK. The dialog box clos
- Page 33 and 34: 1.1.4.9. Reading a Material Library
- Page 35 and 36: If you are performing a static or f
- Page 37 and 38: Chapter 2: Loading The primary obje
- Page 39 and 40: Figure 2.2 Transient Load History C
- Page 41 and 42: The arc-length method is an advance
- Page 43 and 44: • Transferred solid loads will re
- Page 45 and 46: Note If the node rotation angles th
- Page 47 and 48: Figure 2.7 Scaling Temperature Cons
- Page 49 and 50: Below are examples of some of the G
- Page 51 and 52: Utility Menu> List> Loads> Surface>
- Page 53 and 54: Figure 2.9 Example of Surface Load
- Page 55 and 56: the shell, and 270° to 360° for t
- Page 57 and 58: Below are examples of some of the G
- Page 59 and 60: Figure 2.15 Transfers to BFK Loads
- Page 61 and 62: CASE C: At least one BFV, BFA, or B
- Page 63 and 64: A handy way to specify density so t
- Page 65 and 66: For more information, see Initial S
- Page 67: Boundary Condition Heat Flux Film C
- Page 71 and 72: 2.6. Specifying Load Step Options A
- Page 73 and 74: - All loads changed in later load s
- Page 75 and 76: Main Menu> Preprocessor> Loads> Loa
- Page 77 and 78: Command GUI Menu Paths Main Menu> S
- Page 79 and 80: ! Load Step 1: D, ... ! Loads SF, .
- Page 81 and 82: Modeling> Create> Elements> Auto Nu
- Page 83 and 84: Figure 2.22 Pretension Section Samp
- Page 85 and 86: cylind,0.35,1, 0.75,1, 0,180 wpstyl
- Page 87 and 88: 11. Select Utility Menu> PlotCtrls>
- Page 89 and 90: 24. Select Utility Menu> Plot> Comp
- Page 91 and 92: Chapter 3: Using the Function Tool
- Page 93 and 94: Hint: A common error is a divide-by
- Page 95 and 96: 3.3. Using the Function Loader When
- Page 97 and 98: 2. Define the convection boundary c
- Page 99 and 100: 7. Optional: Enter comments for thi
- Page 101 and 102: 3.6.1. Graphing a Function From the
- Page 103 and 104: Chapter 4: Initial State The term i
- Page 105 and 106: inis,defi,,,1,,100,200,150 inis,def
- Page 107 and 108: applies an equal stress of SX = 100
- Page 109 and 110: 4.7.2. Example: Initial Stress Prob
- Page 111 and 112: inis,defi,all,all,all,all,0.1,,, in
- Page 113 and 114: Chapter 5: Solution In the solution
- Page 115 and 116: Solver Typical Applications * In to
- Page 117 and 118: used. Running the distributed spars
- Page 119 and 120:
With all iterative solvers, be part
- Page 121 and 122:
5.3.3. Disk Space (I/O) and Postpro
- Page 123 and 124:
If your analysis is either static o
- Page 125 and 126:
Note Whether you make changes to on
- Page 127 and 128:
Figure 5.2 PGR File Options From th
- Page 129 and 130:
GUI: Main Menu> Solution> Current L
- Page 131 and 132:
Figure 5.3 Examples of Time-Varying
- Page 133 and 134:
Requirements for Performing an Anal
- Page 135 and 136:
*dim,temtbl,table,4,1,,time ! Defin
- Page 137 and 138:
5.9.1.1.1. Multiframe Restart Limit
- Page 139 and 140:
prnsol finish 5.9.2. VT Accelerator
- Page 141 and 142:
5.12. Stopping Solution After Matri
- Page 143 and 144:
Chapter 6: An Overview of Postproce
- Page 145 and 146:
each element. Derived data are also
- Page 147 and 148:
Chapter 7: The General Postprocesso
- Page 149 and 150:
Although not required for postproce
- Page 151 and 152:
The ETABLE command documentation li
- Page 153 and 154:
• Path plots • Reaction force d
- Page 155 and 156:
The PLETAB command contours data st
- Page 157 and 158:
PLDISP,1 ! Deformed shape superimpo
- Page 159 and 160:
7.2.1.6. Particle Flow and Charged
- Page 161 and 162:
• Particle flow traces occasional
- Page 163 and 164:
The surfaces you create fall into t
- Page 165 and 166:
You can opt to archive all defined
- Page 167 and 168:
19 41.811 51.777 .00000E+00 -66.760
- Page 169 and 170:
Sample PRETAB and SSUM Output *****
- Page 171 and 172:
7.2.5. Mapping Results onto a Path
- Page 173 and 174:
Command(s): PDEF GUI: Main Menu> Ge
- Page 175 and 176:
To retrieve path information from a
- Page 177 and 178:
7.2.6. Estimating Solution Error On
- Page 179 and 180:
Write Results - You can use the dat
- Page 181 and 182:
NOTE: When you append data to your
- Page 183 and 184:
EMF - Windows Enhanced Metafile For
- Page 185 and 186:
Figure 7.20 The PGR File Options Di
- Page 187 and 188:
7.4.8. Comparing Nodal Solutions Fr
- Page 189 and 190:
the effect of the rigid body rotati
- Page 191 and 192:
The SADD command (Main Menu> Genera
- Page 193 and 194:
To view correct mid-surface results
- Page 195 and 196:
To get usable results combine the r
- Page 197 and 198:
7.4.4. Mapping Results onto a Diffe
- Page 199 and 200:
• EMF (Main Menu> General Postpro
- Page 201 and 202:
7.4.8.1. Matching the Nodes The Mec
- Page 203 and 204:
7.4.8. Comparing Nodal Solutions Fr
- Page 205 and 206:
Chapter 8: The Time-History Postpro
- Page 207 and 208:
enables the alternate selections sh
- Page 209 and 210:
1. Click on the Add Data button. Re
- Page 211 and 212:
APPEND Appends data to previously s
- Page 213 and 214:
!derivative of variable 2 with resp
- Page 215 and 216:
The above command assumes that you
- Page 217 and 218:
When plotting complex data such as
- Page 219 and 220:
Sample Output from EXTREM time-hist
- Page 221 and 222:
5. Select the variables to be opera
- Page 223 and 224:
RESP requires two previously define
- Page 225 and 226:
Chapter 9: Selecting and Components
- Page 227 and 228:
Note Crossover commands for selecti
- Page 229 and 230:
would put UX and UZ constraints on
- Page 231 and 232:
The Command Reference describes the
- Page 233 and 234:
Chapter 10: Getting Started with Gr
- Page 235 and 236:
Remote Network Access Hidden Line R
- Page 237 and 238:
10.4.1. Adjusting Input Focus To en
- Page 239 and 240:
• If the environment variable SB_
- Page 241 and 242:
10.5.5. Erasing the Current Display
- Page 243 and 244:
Chapter 11: General Graphics Specif
- Page 245 and 246:
11.3.1. Changing the Viewing Direct
- Page 247 and 248:
11.4. Controlling Miscellaneous Tex
- Page 249 and 250:
11.4.3. Controlling the Location of
- Page 251 and 252:
Chapter 12: PowerGraphics Two metho
- Page 253 and 254:
The subgrid approach affects both t
- Page 255 and 256:
Chapter 13: Creating Geometry Displ
- Page 257 and 258:
Figure 13.1 Element Plot of SOLID65
- Page 259 and 260:
13.2.1.12. Vector Versus Raster Mod
- Page 261 and 262:
Figure 13.2 Create Best Quality Ima
- Page 263 and 264:
13.2.3.2. Choosing a Format for the
- Page 265 and 266:
Chapter 14: Creating Geometric Resu
- Page 267 and 268:
Figure 14.2 A Typical ANSYS Results
- Page 269 and 270:
• Changing the contour interval.
- Page 271 and 272:
14.5. Isosurface Techniques Isosurf
- Page 273 and 274:
Chapter 15: Creating Graphs If you
- Page 275 and 276:
Establishing separate Y-axis scales
- Page 277 and 278:
15.2.3.5. Defining the TIME (or, Fo
- Page 279 and 280:
Chapter 16: Annotation A common ste
- Page 281 and 282:
16.3. 3-D Annotation 3-D text and g
- Page 283 and 284:
Chapter 17: Animation Animation is
- Page 285 and 286:
• ANMODE (Utility Menu> PlotCtrls
- Page 287 and 288:
Figure 17.2 The Animation Controlle
- Page 289 and 290:
Note If you are doing animation fro
- Page 291 and 292:
Chapter 18: External Graphics Besid
- Page 293 and 294:
18.1.4. Exporting Graphics in UNIX
- Page 295 and 296:
Note The commands discussed in this
- Page 297 and 298:
18.3.6. Editing the Neutral Graphic
- Page 299 and 300:
Chapter 19: The Report Generator Th
- Page 301 and 302:
2. Specify a caption for the captur
- Page 303 and 304:
19.4.1.1. Creating a Custom Table I
- Page 305 and 306:
Table ID 46 47 48 Description Compo
- Page 307 and 308:
Button or Field DYNAMIC DATA REPORT
- Page 309 and 310:
The HTML tag to begin JavaScript co
- Page 311 and 312:
listingName A unique listing name a
- Page 313 and 314:
Chapter 20: File Management and Fil
- Page 315 and 316:
20.4. Text Versus Binary Files Depe
- Page 317 and 318:
Identifier ELEM EMAT ERR ESAV FATG
- Page 319 and 320:
20.4.3. File Compression Many file
- Page 321 and 322:
You can also redirect graphics outp
- Page 323 and 324:
Chapter 21: Memory Management and C
- Page 325 and 326:
21.3.3. Changing Database Space Fro
- Page 327 and 328:
Figure 21.4 Dividing Work Space ANS
- Page 329 and 330:
NUM_BUFR is the number of buffers p
- Page 331 and 332:
een chosen for efficient running of
- Page 333 and 334:
Index Symbols 3-D graphics devices,
- Page 335 and 336:
path plots, 142 POST26 graphs, 200
- Page 337 and 338:
fatigue graphs, 257 files, 277 focu
- Page 339 and 340:
material model interface, 8 materia
- Page 341 and 342:
multiframe, 117 restarting an analy
- Page 343 and 344:
WINDOW command, 227 Windows graphic


