MS Word Technical Paper Template
MS Word Technical Paper Template
MS Word Technical Paper Template

You also want an ePaper? Increase the reach of your titles
YUMPU automatically turns print PDFs into web optimized ePapers that Google loves.
pH<br />
Ni (mg/L)<br />
10<br />
9<br />
8<br />
7<br />
C1<br />
C4<br />
6<br />
5<br />
4<br />
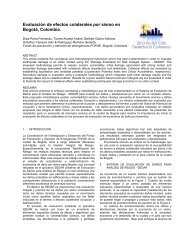
Figure 2: pH evolution in effluent of the two cells<br />
0,8<br />
0,7<br />
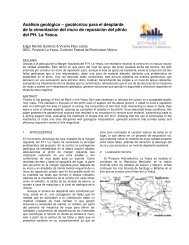
Figure 1: Configuration of the test cell (from Demers et<br />
al. 2010)<br />
Table 1: Mineralogical composition (in %) of the waste<br />
rock<br />
Mineral C1 C4<br />
Labradorite 45 32<br />
Ilmenite 23 23<br />
Hematite 8 8<br />
Pyrite 1 1<br />
Enstatite 6 25<br />
Pigeonite 4 2<br />
Biotite 2 < 1<br />
Muscovite < 1 1<br />
Chlorite 3 3<br />
Orthoclase 7 1<br />
Table 2: Selected geotechnical and hydrogeological<br />
parameters of the waste rock<br />
Parameter Unit C1 C4<br />
G s - 3.087 3.271<br />
k sat cm/s 0.2 0.2<br />
AEV cm of water < 10 < 10<br />
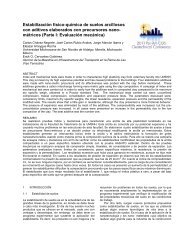
Figures 2 and 3 present the evolution of pH and Ni<br />
concentration in the effluent of cells C1 (fresh) and C4<br />
(weathered). Their pH level is similar, from 6 to 9 for both<br />
cells. C4 has higher Ni concentrations that keep<br />
increasing with time, from 0.1 mg/L in 2006 to above 0.6<br />
mg/L in 2010. C1 kept its Ni concentrations below 0.02<br />
mg/L. The difference between the two type of test plots<br />
being the alteration level of the waste rock, it was<br />
postulated that retention of nickel by the fresh waste rock<br />
reduces the nickel concentration at the outlet. As the<br />
waste rock ages, its retention capacity is slowly<br />
decreased since its sorption sites are being saturated<br />
0,6<br />
0,5<br />
0,4<br />
0,3<br />
0,2<br />
0,1<br />
0,0<br />
Figure 3: Ni evolution in the effluent of the two cells<br />
3 FIELD RETENTION TESTS<br />
A field retention test campaign was designed to verify the<br />
retention of nickel on the test plots and then validate the<br />
laboratory observations (Plante 2010; Plante et al., 2010a,<br />
b, c). Nickel rich water was collected on the mine site into<br />
1000-L containers. Each container was analysed in situ<br />
for pH, ORP and Ni concentration using pH, conductivity<br />
and ORP probes, and colorimetry for Ni. Ni concentrations<br />
were later confirmed by ICP-AES. ICP-AES analyses also<br />
included the following elements: Al, As, Ba, Be, Bi, Ca,<br />
Cd, Co, Cr, Cu, Fe, Mg, Mn, Mo, Pb, S tot, Sb, Si, Ti, Zn.<br />
Some key results for each water container are presented<br />
in Table 3. Overall, the input water for C1 contained<br />
approximately 1.8 mg/L Ni at a pH value of 7, while the<br />
input water for C4 contained approximately 2 mg/L Ni at a<br />
pH value of 6.8.<br />
C1<br />
C4<br />
Table 3: Main characteristics of the Ni-rich water before<br />
the retention tests