August 2012 - National Crop Insurance Services
August 2012 - National Crop Insurance Services
August 2012 - National Crop Insurance Services

Create successful ePaper yourself
Turn your PDF publications into a flip-book with our unique Google optimized e-Paper software.
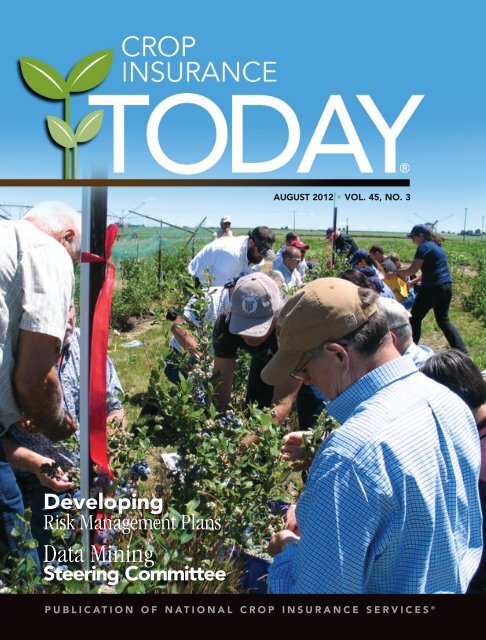
AUGUST <strong>2012</strong> • VOL. 45, NO. 3<br />
Developing<br />
Risk Management Plans<br />
Data Mining<br />
Steering Committee<br />
P U B L I C A T I O N O F N A T I O N A L C R O P I N S U R A N C E S E R V I C E S ®
We give you the support you need to stand<br />
with America’s Producers<br />
FROM OUR SERVICE TO OUR TECHNOLOGY, RCIS ® IS PARTNERING WITH YOU TO<br />
INSURE AMERICA’S FARMERS AND RANCHERS. GO TO RCIS.COM TO LEARN MORE.<br />
We grow stronger every day—together SM<br />
Rural Community <strong>Insurance</strong> Agency, Inc., D/B/A RCIS. RCIS is an equal opportunity provider. © <strong>2012</strong> Rural Community <strong>Insurance</strong> Agency, Inc. All rights reserved.
TODAYPRESIDENT’S MESSAGE<br />
“What is, and What<br />
Should Never Be....”<br />
Laurie Langstraat, Editor<br />
TODAY IS PROVIDED AS A SERVICE OF<br />
NATIONAL CROP INSURANCE SERVICES ®<br />
TO EDUCATE READERS ABOUT THE RISK<br />
MANAGEMENT TOOLS PRODUCERS USE<br />
TO PROTECT THEMSELVES FROM<br />
THE RISKS ASSOCIATED WITH<br />
PRODUCTION AGRICULTURE.<br />
TODAY is published quarterly–February, May,<br />
<strong>August</strong>, and November by<br />
<strong>National</strong> <strong>Crop</strong> <strong>Insurance</strong> <strong>Services</strong><br />
8900 Indian Creek Parkway, Suite 600<br />
Overland Park, Kansas 66210<br />
www.ag-risk.org<br />
If you move, or if your address is incorrect,<br />
please send old address label clipped from recent issue<br />
along with your new or corrected address to<br />
Laurie Langstraat, Editor, at the above address.<br />
NCIS ® EXECUTIVE COMMITTEE<br />
Steve Rutledge, Chairman<br />
Ted Etheredge, Vice Chairman<br />
Tim Weber, Second Vice Chairman<br />
NCIS ® MANAGEMENT<br />
Thomas P. Zacharias, President<br />
P. John Owen, General Counsel<br />
James M. Crist, CFO/COO<br />
Frank F. Schnapp, Senior Vice President<br />
Mike Sieben, Senior Vice President<br />
Creative Layout and Design<br />
by Graphic Arts of Topeka, Inc., Kansas<br />
Printed on recycled paper.<br />
Recently, I did an interview with Chris<br />
Clayton of DTN following Secretary-Vilsack’s<br />
White House Press Briefing on the drought, and<br />
Chris asked me if I had any song lyrics that<br />
came to mind as we discussed the drought<br />
situation and the critically essential role of crop<br />
insurance for the summer of <strong>2012</strong>.<br />
In last year’s summer issue of TODAY<br />
magazine, we pulled Fire and Rain from the<br />
“deep tracks” to talk about the flooding along the<br />
Mississippi and Missouri Rivers as well as the<br />
prolonged drought occurring in the Southern<br />
Plains, particularly in the states of Kansas,<br />
Oklahoma, and Texas. This year, as our industry<br />
Tom Zacharias, NCIS President responds to the drought of <strong>2012</strong>, we deal not<br />
only with the severity of the drought, but in<br />
addition, the politics of the Farm Bill, the associated negative publicity campaign of our<br />
critics, the uncertainty of a presidential election, and a struggling US and world economy.<br />
So upon further reflection, I went to the “vinyl” and pulled some classic Led Zeppelin<br />
from the shelf—What Is, and What Should Never Be.<br />
What Is<br />
The Drought of <strong>2012</strong><br />
Unfortunately, we have not seen the end of the drought of <strong>2012</strong>. We could be in for<br />
a prolonged drought that began with the drought conditions in 2011 in the Southern<br />
Plains. No one knows.<br />
We do know that over one-half of U.S. counties have been declared natural disaster<br />
areas. According to USDA’s July 31, <strong>2012</strong> Weekly Weather and <strong>Crop</strong> Bulletin, we do know<br />
the condition of this year’s corn and soybean crops are both tracking with the 1988 crop<br />
conditions. The 1988 drought was the worst in recent history, with a loss ratio (total<br />
indemnities divided by total premium) of 2.45. We do know that crop insurance losses<br />
on that scale would cost insurance companies, farmers and taxpayers billions of dollars.<br />
Continued Pressure On the Agricultural Production Sector<br />
We do know agricultural commodity prices have risen to historic levels, and could<br />
continue to rise. According to the June 29, <strong>2012</strong> USDA Grain Stocks Report, U.S. stocks<br />
of most major grain crops, with the exception of soybeans, have dropped significantly<br />
compared to this same time last year. This is the short term outlook. Long term, we<br />
expect to continue to observe increased population and income growth. World population<br />
reached approximately seven billion people at the end of October 2011, and is<br />
expected to exceed eight billion in population by 2025. We do know short-term crop<br />
shortages relative to demand and long term population and income growth will<br />
continue to put enormous pressure on the agricultural production sector.<br />
Continued on page 27<br />
CROP INSURANCE TODAY ® 1
VOL. 45, NO. 3<br />
AUGUST <strong>2012</strong><br />
Table of Contents<br />
1 “What is, and What Should Never Be....”<br />
4 Developing Risk Management Plans<br />
16<br />
10 <strong>Crop</strong> <strong>Insurance</strong> Rate of Return: Issues & Concerns<br />
16 2011 Research Review<br />
23 RMA/AIP Data Mining Steering Committee<br />
30 NCIS Adjuster Training in Full Swing<br />
32 Industry Support of FFA<br />
35 <strong>Crop</strong> <strong>Insurance</strong> & Specialty <strong>Crop</strong>s<br />
30<br />
Visit<br />
www.cropinsuranceinamerica.com<br />
32<br />
Copyright Notice<br />
All material distributed by <strong>National</strong> <strong>Crop</strong> <strong>Insurance</strong> <strong>Services</strong> is protected by copyright and other laws. All rights reserved.<br />
Possession of this material does not confer the right to print, reprint, publish, copy, input, transform, distribute or use same<br />
in any manner without the prior written permission of NCIS. Permission is hereby granted to Members in good standing of<br />
NCIS whose Membership Class (and service area, if membership is limited by service area) entitles them to receive copies<br />
of the enclosed or attached material to reprint, copy or distribute such NCIS copyrighted material in its present form<br />
solely for their own business use and solely to employees, adjusters or agents who are under contract with them, and<br />
as a condition to receiving such copies, such employees, adjusters and agents agree that they will not reprint, copy or<br />
distribute, or permit use of any such NCIS copyrighted material to or by any other person and/or company, or transform<br />
into another work such NCIS copyrighted material, without prior written permission of NCIS.<br />
© 2011 <strong>National</strong> <strong>Crop</strong> <strong>Insurance</strong> <strong>Services</strong>, Inc.
Your ticket to...<br />
Intuitive deployment<br />
<br />
Faster claims processing<br />
Robust reporting tools<br />
More business opportunities<br />
Advanced claims tools<br />
Contact your RVP or marketing representative for your training schedule.<br />
®<br />
Producers Ag <strong>Insurance</strong> Group, Inc., d/b/a ProAg®, is a wholly owned subsidiary iary<br />
of CUNA Mutual ual Group. ProAg is an equal opportunity portu<br />
provider. © <strong>2012</strong> ProAg. All Rights Reserved.<br />
www.ProAg.com<br />
®<br />
The Past, Present and Future of Agricultural Risk Management. ®
TODAYcrop insurance<br />
Developing<br />
Risk Management Plans<br />
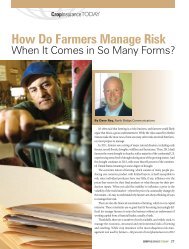
By Dr. Laurence Crane, NCIS<br />
This article summarizes the activities of<br />
an RMA funded Competitive Cooperative<br />
Partnership Agreement awarded to NCIS as<br />
part of the Risk Management Education<br />
and Outreach Partnerships Program. NCIS<br />
presented educational workshops this<br />
spring and summer in cooperation with<br />
the University of Arkansas–Pine Bluff, and<br />
Alcorn State University in Mississippi. The<br />
objective of these workshops was to help<br />
African-American farmers and ranchers in<br />
Arkansas and Mississippi develop risk<br />
management plans for their farms. This<br />
training consisted of a series of three<br />
sequential workshops in each state and<br />
sixty hours of individualized instruction<br />
and homework assignments.<br />
4 AUGUST <strong>2012</strong><br />
Project Overview<br />
Risk management planning continues<br />
to be a timely topic as farmers face historically<br />
high input and energy costs, fewer<br />
off-farm employment opportunities, and<br />
increased financial and marketing risks.<br />
The goal of this project was to assist limited<br />
resource and African-American producers<br />
of specialty crops and underserved<br />
commodities in Arkansas and Mississippi in<br />
responding to risk in the five special<br />
emphasis areas of production (crop and<br />
livestock insurance), marketing (strategies<br />
and farmers markets), financial (farm management<br />
strategies), legal (liabilities and<br />
estate planning), and human resource<br />
(labor) management. Individualized risk<br />
management responses were formulated<br />
using the business planning approach.<br />
An applied education program consisting<br />
of six workshops and individualized<br />
counseling was developed and conducted<br />
via a partnership of two trainers, two state<br />
host coordinators (SHC) and twelve local<br />
educators (Extension Associates). Specific<br />
project objectives were to use business<br />
planning to: 1) review risk management<br />
principles, practices, and tools to familiarize<br />
producers with how they can be effectively<br />
applied in a holistic approach to their<br />
farm situation; 2) assist producers in conducting<br />
an effective risk assessment of their<br />
own farm business; 3) inform producers of<br />
Risk management planning<br />
continues to be a timely<br />
topic as farmers face<br />
historically high input and<br />
energy costs, fewer off-farm<br />
employment opportunities,<br />
and increased financial and<br />
marketing risks.<br />
alternative risk management strategies,<br />
including crop and livestock insurance,<br />
and delineate financial and marketing<br />
opportunities for alternative case scenarios;<br />
4) assist producers with formation<br />
and adoption of their own individualized<br />
risk response strategy; and, 5) review the<br />
financial implications and legal considerations<br />
of their chosen strategy.<br />
The primary outcome of this educational<br />
effort was for participants to develop the<br />
skills and to understand their own operations<br />
well enough to develop personal risk<br />
management strategies for each of the five<br />
risk emphasis areas specified above. The<br />
extended duration and iterative nature of<br />
the program, with sequential workshops<br />
and personal follow-up, provided participants<br />
with an opportunity to both develop<br />
and revise plans with their own data and<br />
have it professionally reviewed. This concentrated<br />
and hands-on approach to education<br />
typically leads to long-term behavioral<br />
change and is consistent with the philosophy<br />
that behavior changes are more<br />
likely with sustained personal support.<br />
Priority and Emphasis<br />
This activity focused on producers of specialty<br />
crops where there is no insurance coverage,<br />
and producers of underserved commodities<br />
that are covered by crop insurance<br />
but have a participation rate lower than the<br />
national average. Many of these producers<br />
have limited historical knowledge and/or<br />
personal experience with insurance programs.<br />
It is imperative that they receive the<br />
tools necessary to benefit from the use of<br />
crop insurance where available and learn
Dr. Crane (far left) with the farmers and ranchers who attended the workshops at the University of Arkansas-Pine Bluff.<br />
Extension Associate, Kandi Williams, (front row, second from right) UAPB & Silas H. Hunt Community Development Corporation Small Farm<br />
Program, Texarkana, Arkansas noted: “From this risk management training, the producers worked on case studies that helped them understand<br />
and better manage their farm enterprises. Some of the producers are still working on goals that they agreed to complete after the training. It has<br />
been inspiring to see them take information from the workshops and actually achieve short-term goals discussed during the training.”<br />
Dr. Crane with the farmers and ranchers who participated in the workshops in Jackson, MS, coordinated by Alcorn State University.<br />
Ralph Arrington, (back row, 3rd from right) Agricultural Educator with Alcorn State Extension, was pleased with the workshops and felt<br />
the participants were “provided a successful opportunity to set goals and decrease their risks.”<br />
how it can be used in concert with the other<br />
risk management and cost control strategies<br />
they employ.<br />
Partnering<br />
Project partners were Dr. Laurence<br />
Crane, NCIS Vice President-Education and<br />
Communication; Dr. Albert Essel, Associate<br />
Dean for Extension, Delaware State<br />
University; Dr. Henry English, Small Farm<br />
Project Director, University of Arkansas-<br />
Pine Bluff; and Mr. Anthony Reed, Interim<br />
Assistant Extension Administrator, Alcorn<br />
State University in Mississippi. Dr. English<br />
and Mr. Reed are the Small Farm Program<br />
Coordinators in their respective states, and<br />
were selected based on their membership<br />
in and personal relationships with Small,<br />
Limited Resource and African-American<br />
farmers, and their history of delivering<br />
exceptional educational programs to these<br />
farmers and ranchers.<br />
Dr. Essel assisted in managing the project<br />
and teaching the workshops. Dr. Essel<br />
has co-authored several extension publications<br />
on all aspects of marketing and financial<br />
risk management. He has extensive<br />
CROP INSURANCE TODAY ® 5
educational experience in the South working<br />
with African-American producers on a<br />
wide array of farm and risk management<br />
issues, including business planning, financial<br />
and economic development and marketing<br />
strategies common in the region. Dr.<br />
Essel is a gifted teacher and relates well<br />
with Limited Resource and African-<br />
American producers and ranchers due to<br />
his personal background and professional<br />
experiences at Fort Valley State University,<br />
Virginia State University, and Delaware<br />
State University. Additionally, he has been<br />
involved with outreach programs at almost<br />
all of the 1890 Land-Grant Universities.<br />
Each participant was expected<br />
to develop a personalized<br />
risk management action plan<br />
for each special emphasis<br />
topic (production, marketing,<br />
financial, human, legal) over<br />
a period of time following<br />
the initial workshop.<br />
Project Delivery<br />
The delivery of this risk management<br />
education program consisted of two<br />
major components: workshops and individualized<br />
study. Three day-long (6<br />
hours, 18 hours total) sequential workshops<br />
were conducted in each state<br />
approximately 30 days apart. There were<br />
52 producers (21 in Arkansas and 31 in<br />
Mississippi) who attend all three workshops.<br />
Workshop activities were designed<br />
to build upon each other with specific<br />
homework (individual study) assignments<br />
to be conducted following each workshop.<br />
The three homework assignments<br />
were designed to take approximately 20<br />
hours each to complete. The twelve local<br />
Extension Associates were responsible to<br />
follow-up individually with the producers<br />
to ensure that homework assignments<br />
were completed.<br />
The workshops were instructional with<br />
“hands-on,” participatory exercises.<br />
Participants worked through several case<br />
The workshops consisted of classroom instruction, group discussion, and personal assignments.<br />
Here, participants are completing a hands-on assignment to conduct an inventory assessment of<br />
their farm. Because writing focuses thinking, participants were required to document their<br />
thoughts throughout the workshop.<br />
Participants were grouped together by the types of commodities they produced (row crops, vegetables,<br />
livestock, etc.) and worked together to identify the common risks they face and discussed<br />
potential risk management strategies. Here, Dr. Laurence Crane is discussing the use of<br />
enterprise budgeting in making decisions. Dr. Crane attributed the success of the program to its<br />
focused and personal design: “This concentrated and hands-on approach to education typically<br />
leads to long-term behavioral change and is consistent with the philosophy that behavior<br />
changes are more likely with sustained personal support.”<br />
A critical aspect to the success of this activity was the support and follow up by local Extension<br />
Educators. Here, Dr. Henry English (right) is discussing this work assignment with Stephan<br />
Walker, multi-county agent for Jefferson, Desha, Lincoln and Pulaski counties for the Small Farm<br />
Program at the University of Arkansas at Pine Bluff.<br />
6 AUGUST <strong>2012</strong>
examples and began applying the principles<br />
learned to their own operations.<br />
Participant progress and learning was<br />
monitored with the Personal Response<br />
System (PRS) and other written assessment<br />
techniques. PRS technology was<br />
particularly well-suited for this workshop<br />
as risk assessment and response strategies<br />
can be quite personal. Individuals<br />
who may be hesitant to speak orally can<br />
simply respond to questions anonymously<br />
by pressing numbers on a devise<br />
resembling a TV remote control. A computer<br />
and receiver process the responses<br />
instantly and graph the results for all to<br />
see. The PRS was used periodically<br />
throughout the workshops to engage participants<br />
and monitor the progress of<br />
their understanding.<br />
Each participant was expected to<br />
develop a personalized risk management<br />
action plan for each special emphasis<br />
topic (production, marketing, financial,<br />
human, legal) over a period of time following<br />
the initial workshop. This required<br />
participants to evaluate the risk situation<br />
of their operations, set goals for managing<br />
risk, interact with professionals (e.g. loan<br />
officer, crop insurance agent, estate planning<br />
advisor, etc.), and develop specific<br />
strategies to measure and manage risk. All<br />
workshop materials and supporting documents<br />
were provided in hard copy and<br />
electronically for review and downloading.<br />
The State Coordinators, working with<br />
the local educators, made contact with the<br />
participants at regular intervals to offer<br />
assistance and encourage them in their<br />
efforts. Involving local educators and<br />
other local resource people (crop insurance<br />
agents, lenders, etc.) strengthened<br />
the network of advisers that participants<br />
could tap into and obtain additional information.<br />
These resources provided a support<br />
network that enabled adoption of<br />
program materials and increased the<br />
probability of long-term success.<br />
Results<br />
The primary outcome of this educational<br />
effort was for participants to possess<br />
the skills and to understand their<br />
own operations well enough to develop<br />
personalized risk management strategies<br />
for each of the five emphasis areas (production,<br />
financial, marketing, legal,<br />
human). Participants were expected to<br />
spend at least 20 hours completing homework<br />
assignments after each workshop<br />
for a total of 60 hours expected. On the<br />
written evaluation form they reported<br />
spending an average of 22.4 hours per<br />
session for a total of 67.4 hours of personal<br />
homework. Moreover, each of the 52<br />
participants established a goal in each of<br />
the five risk emphasis areas and delineated<br />
three specific actions they would take<br />
during the next year to reach each goal.<br />
A secondary outcome of this project<br />
was to develop and foster a long-term<br />
working relationship between the farmer<br />
participants and local educators.<br />
Moreover, this educational approach also<br />
improves the skills of these educators.<br />
The personal interaction of these farmers<br />
with the local Extension Associates as<br />
designed in this project has the potential<br />
of creating long-lasting relationships that<br />
will be mutually beneficial.<br />
The most important indicator of success<br />
was the strong participation by the<br />
AgriLogic <strong>Insurance</strong> <strong>Services</strong>, LLC<br />
“The <strong>Crop</strong> <strong>Insurance</strong> Company In Your Community”<br />
AgriLogic <strong>Insurance</strong> <strong>Services</strong>’ strategy is to provide agents with customized risk management solutions that<br />
allow their producers to minimize their production risk and manage their farm operations. ALIS is committed<br />
to building long term relationships with crop insurance agents and agricultural producers. Experience the<br />
AgriLogic difference.<br />
<br />
agriculture in your area<br />
<br />
<br />
Help continue our unprecedented growth... NOW HIRING ALL POSITIONS.<br />
Contact us today to learn about career opportunities with AgriLogic at hr@agrilogic.com<br />
or visit our website at www.agrilogic.com and click on Career Opportunities.<br />
888-AGLOGIC (254-6442) l WWW.AGRILOGIC.COM<br />
CROP INSURANCE TODAY ® 7
participants who returned each time and<br />
actively participated in each of the three<br />
workshops. At the conclusion of the last<br />
workshop several farmers commented<br />
orally and on the written evaluation that<br />
they were grateful for the opportunity to<br />
participate, had learned more than<br />
expected, and wished the series could<br />
continue on a regular basis.<br />
See testimonials from program participants<br />
on page 14.<br />
Developing the skills to prepare financial statements was one of the workshop activities. Here, Dr.<br />
Albert Essel is helping a group of row crop farmers prepare a balance sheet and income statement<br />
for their farms. Dr. Essel commented about the program success, stating, “Over the years, I have<br />
been involved with many educational interventions in agricultural risk management for socially disadvantaged<br />
producers and educators who conduct programs for underserved audiences. The<br />
response that we received from these producers in Mississippi and Arkansas during this series<br />
gives me hope that for once we have hit the target. The energy, enthusiasm and desire to learn<br />
tools for managing farm risk among the participating producers was exhilarating and infectious.”<br />
This program integrated the use of existing<br />
educational materials at the local level. Here,<br />
Mr. Anthony Reed, Alcorn State University<br />
discusses the publication, “Legal Risks Facing<br />
Family Farms: What Every Small Farmer<br />
Should Know.” Mr. Reed, who was the State<br />
Host Coordinator in Mississippi commented,<br />
“I believe the participants in the RMA/NCIS<br />
class received a holistic approach to risk management<br />
that I feel will help to sustain,<br />
enhance and minimize their risks on their<br />
farming enterprise.”<br />
Each Participant who completed the program was presented with a certificate in recognition of<br />
successfully completing the “Developing Personal Risk Management Plans” short course of<br />
instruction, including eighteen hours of classroom instruction and sixty hours of supervised individual<br />
study. Here, Roddric Bell, RMA Senior Risk Management Specialist/Outreach Coordinator,<br />
Jackson Regional Office (left), and Dr. Laurence Crane, NCIS (right), present Audrey German,<br />
Edwards, Mississippi, with her Certificate of Completion.<br />
Participants were expected to set a goal in each<br />
of five risk management areas (production, marketing,<br />
financial, human resource, legal), and<br />
identify three specific actions they will take to<br />
accomplish each goal. Here, Dr. Henry English is<br />
helping vegetable growers establish their goals.<br />
Dr. English, who was the State Host Coordinator<br />
for Arkansas commented, “I was quite pleased<br />
by the interest that the participants showed in<br />
the material that was presented. Several famers<br />
indicated that this was their first time being<br />
exposed to this quality of education on these<br />
topics, and they really appreciated the effort to<br />
help them learn the material.”<br />
8 AUGUST <strong>2012</strong>
The Next Evolution in Mapping<br />
AXIS has evolved and<br />
EASYmapping is ushering in the next<br />
phase of<br />
crop insurance mapping. ping.<br />
{ Faster. Easier. Better. }<br />
Rebuilt from the ground up with all of your feedback in mind, we’re<br />
e<br />
setting the new standard for crop insurance mapping.<br />
Considering this unprecedented increase<br />
in application performance, is it<br />
a mapping Evolution<br />
or an industry Revolution?<br />
naucountry.com |<br />
1.888.NAU.MPCI<br />
© <strong>2012</strong> NAU<br />
Country<br />
<strong>Insurance</strong> Company.<br />
All Rights Reserved. NAU<br />
Country<br />
<strong>Insurance</strong> n<br />
Company is an Equal<br />
Opportunity Provider. The links logo is a registered service mark of<br />
QBE <strong>Insurance</strong> Group, Limited. NAU Country<br />
is a registered service mark of<br />
NAU Country <strong>Insurance</strong> Company.
TODAYcrop insurance<br />
<strong>Crop</strong> <strong>Insurance</strong> Rate of Return<br />
Issues & Concerns<br />
By Frank Schnapp, NCIS<br />
In recent months, a variety of claims<br />
have been aired in the press regarding<br />
the cost of delivery of the Federal crop<br />
insurance program and the profitability of<br />
the private sector companies that deliver<br />
the program to farmers. These claims<br />
place the crop insurance industry in an<br />
unfavorable light, arguing that the industry<br />
is too profitable, that profits are guaranteed,<br />
and that Administrative and<br />
Operating (A&O) expense payments are<br />
excessive. Naturally, the companies participating<br />
in the program disagree. They<br />
argue that if profits were generous or<br />
excessive, new insurance companies<br />
would be entering the program on a regular<br />
basis. This is simply not taking<br />
place. At one time, 49 companies participated<br />
in the Federal program, but in<br />
recent years the number of insurers has<br />
not exceeded 16.<br />
One explanation for the negative<br />
press received by the program is simply<br />
misinformation. Discussions of the<br />
industry’s profitability often disregard<br />
recent funding reductions to the program,<br />
confuse basic financial concepts used to<br />
calculate industry returns, and fail to take<br />
into account that industry returns vary<br />
over time and differ across geographic<br />
regions. There are also serious questions<br />
about the data used to estimate the industry’s<br />
rate of return.<br />
Unfortunately, public statements<br />
regarding the rate of return have confused<br />
the issue even further. Industry<br />
leaders have met with the government to<br />
clarify the issues and look forward to<br />
continued dialogue. Among the concerns<br />
voiced about the rate of return estimates<br />
being discussed publicly are that<br />
they:<br />
• Confuse gross revenues with net<br />
income;<br />
• Assume that government A&O payments<br />
to companies on behalf of producers<br />
cover all program delivery<br />
costs, which they do not;<br />
• Fail to account for certain other operational<br />
costs such as reinsurance;<br />
• Ignore recent changes in the program;<br />
and<br />
• Fail to provide insurance companies<br />
with the reasonable rate of return indicated<br />
by government’s own study.<br />
Up till now, the crop insurance industry<br />
has not attempted to respond to the<br />
misinformation appearing in the press.<br />
However, in view of the ongoing attacks<br />
against the program, the moment seems<br />
right to present an overview of the industry’s<br />
finances as a counterweight to the<br />
distortions being presented to the public.<br />
Unfortunately, statements<br />
by government officials<br />
regarding the rate of return<br />
have confused the issue<br />
even further. Industry<br />
leaders have met with<br />
the government to clarify<br />
the issues and look forward<br />
to continued dialogue.<br />
How <strong>Crop</strong> <strong>Insurance</strong><br />
Works<br />
In virtually every other Property and<br />
Casualty (P&C) line of insurance, insurance<br />
companies determine the rates they<br />
charge based on their own loss experience,<br />
expenses, and profit objectives.<br />
The Federal crop insurance program<br />
operates on an entirely differently basis.<br />
The Risk Management Agency (RMA) of<br />
the US Department of Agriculture establishes<br />
the rates that every farmer will pay.<br />
These represent expected indemnities<br />
only, without taking into account<br />
expenses or profit for the insurance company.<br />
Since no insurance company can<br />
operate without the ability to recoup its<br />
expenses or earn a profit, the government<br />
created a separate contractual<br />
arrangement by which it can enlist the<br />
services of the private sector in delivering<br />
the program to all eligible farmers while<br />
simultaneously providing participating<br />
insurers the ability to recoup their program<br />
delivery costs and the opportunity<br />
to earn a reasonable return.<br />
The Standard Reinsurance Agreement<br />
(SRA) is a cooperative financial assistance<br />
agreement that outlines the responsibilities<br />
of insurance companies in delivering<br />
the program and specifies the financial<br />
arrangements under which the companies<br />
operate. One section within the SRA<br />
establishes the amount of A&O the government<br />
pays to compensate insurers for<br />
their cost of delivering the program.<br />
Delivery costs would be included as part<br />
of the premium in any other line of insurance,<br />
but the government has chosen to<br />
10 AUGUST <strong>2012</strong>
eimburse these costs by making A&O<br />
payments on behalf of insured farmers.<br />
As mentioned above, rates for the<br />
Federal crop insurance program exclude<br />
any loading for the insurer’s profit.<br />
Instead, the SRA allows an insurance company<br />
to retain a portion of the total underwriting<br />
gains (defined as the difference<br />
between premiums and indemnity payments)<br />
produced on its book of business.<br />
At the same time it also requires the insurer<br />
to retain a portion of any underwriting<br />
losses. In the five Corn Belt states, an<br />
insurer’s maximum underwriting gain is<br />
currently 34.75 percent of premium, while<br />
its underwriting loss can be as much as 94<br />
percent of premium. In other states,<br />
underwriting gains are capped at 42.6 percent<br />
while underwriting losses can be up<br />
to 51.5 percent of premium. What should<br />
be kept in mind is that the underwriting<br />
gain or loss a company earns in a year<br />
depends primarily on the weather. When<br />
weather conditions are good and farmers<br />
have high yields, fewer claims are reported<br />
and companies are able to earn underwriting<br />
gains. However, in a year with poor<br />
weather conditions and low yields, farmers<br />
report more claims and insurers absorb<br />
underwriting losses. If poor weather<br />
affects a large number of states, the underwriting<br />
losses in those states could swamp<br />
the gains earned throughout the rest of the<br />
country. Due to the potential for widespread<br />
losses, crop insurance is much riskier<br />
than most other P&C lines of insurance.<br />
This point can be illustrated by considering<br />
how often an industry loses money.<br />
Industry sources report that the P&C industry<br />
as a whole has lost money only once, in<br />
2001, due to the unprecedented attack on<br />
the World Trade Center in New York City.<br />
In comparison, the crop insurance industry<br />
has lost money in two years over just the<br />
past two decades, in 1993 and 2002. If the<br />
current SRA had been in effect during 1983<br />
and 1988, two years with widespread crop<br />
failures, the industry would have lost<br />
money in those years as well.<br />
Recent Program Changes<br />
The finances of the crop insurance program<br />
regularly come up for Congressional<br />
review as part of the Farm Bill debate.<br />
Reforms introduced in the 2008 Farm Bill<br />
were estimated to have reduced industry<br />
revenues in excess of $6 billion over the<br />
ten year budgeting period. In addition,<br />
RMA renegotiates the terms of the SRA<br />
every five years. Based on information<br />
released by RMA, the recently completed<br />
negotiations for the 2011 SRA reduced<br />
industry underwriting gains and A&O payments<br />
by an additional $6 billion over the<br />
next 10 years. Under the terms of that<br />
agreement, government estimates of private<br />
sector underwriting gains (not Net Income)<br />
were 14.5 percent of retained premium.<br />
Shortly after the conclusion of the SRA<br />
negotiations, RMA reduced its <strong>2012</strong> premium<br />
rates for corn and soybeans. These<br />
changes are estimated to reduce prospective<br />
underwriting gains by an additional 2<br />
percent of retained premium.<br />
The President’s 2013 Budget proposal<br />
now seeks to reduce the overall return to<br />
the companies even further. This is a matter<br />
of serious concern for the industry.<br />
Even prior to the recent reductions, there<br />
were a number of states where companies<br />
have little or no opportunity to earn a fair<br />
return. The significant uncertainties<br />
regarding the adequacy of returns for the<br />
entire program and by region raise the<br />
issue of whether adequate incentives exist<br />
for private sector delivery of the program<br />
on a nationwide basis.<br />
CROP INSURANCE TODAY ® 11
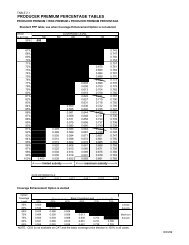
Table 1.<br />
<strong>Crop</strong> <strong>Insurance</strong> Industry Income Statement<br />
In Millions of Dollars<br />
Premium and Equity<br />
Gross Premium (a) 10,417<br />
Retained Premium after reinsurance and Quota Share (a) 8,265<br />
Equity (b) 10,871<br />
Revenue<br />
Underwriting Gain/Loss (c) 1,033<br />
Investment Income on Equity (d) 353<br />
A&O Payments (e) 1,332<br />
Expense<br />
Loss Adjustment and Company Overhead (f) (629)<br />
Commissions and processing fees (g) (1,132)<br />
Cost of borrowed funds due to delay in payment of<br />
A&O and Underwriting Gain (h)<br />
(42)<br />
Income = Revenue – Expense<br />
Pretax Income 915<br />
Federal Income Tax (i) (287)<br />
After-tax Net Income 628<br />
Rate of Return<br />
Return on Equity (ROE) 5.8%<br />
Cost of Capital (Required Return on Equity) (j) 12.7%<br />
(a) Estimated <strong>2012</strong> premium is based on 2011 actual premiums adjusted for corn and soybean rate changes<br />
and commodity price changes. Retained Premium is based on 2011 premium retention percentages and<br />
is net of Quota Share.<br />
(b) For the purpose of this exhibit, industry equity has been developed under the assumption that the industry<br />
holds sufficient capital to make commercial reinsurance unnecessary. Federal Regulations require companies<br />
to hold capital of no less than twice the company’s maximum possible underwriting loss. This<br />
assumption obviates the need to include the cost of reinsurance as an expense.<br />
(c) Estimated underwriting gain is based on RMA’s long-term estimated underwriting gain (14.5% of<br />
Retained Premium) as of June 28, 2010, reduced by the estimated impact of the new RMA ratemaking<br />
methodology (2.0% of Retained Premium) for the <strong>2012</strong> year. Additional reductions in underwriting gains<br />
are anticipated for 2013 but are as yet unknown.<br />
(d) Equity is invested in short-term instruments to ensure that the money will be readily available when needed.<br />
Investment income is based on the Wall Street Journal prime rate of 3.25% as of July 9, <strong>2012</strong>. No<br />
investment income is earned on insurance policy cash flows due to the brief period between collection of<br />
premium and payment of indemnities.<br />
(e) <strong>2012</strong> A&O payments have been estimated based on the provisions of the 2011 SRA.<br />
(f) Loss adjustment and overhead expenses are the average of 2009 and 2010 actual expenses reported in<br />
the most recent Grant Thornton report adjusted for annual inflation of 2 percent.<br />
(g) Commissions are based on provisions in the 2011 SRA that provide up to 85% of A&O for agent commissions<br />
and processing fees. The SRA also allows additional agent compensation, which is not included in<br />
the figures presented here.<br />
(h) Delays in receiving A&O and underwriting gains impose a financial cost on the industry estimated to be<br />
-0.5% of Retained Premium.<br />
(i) Applies a Federal corporate tax rate of 35% on operating income and 25.4% on investment income<br />
(obtained from the 2009 Milliman study).<br />
(j) The average cost of capital as shown in the 2009 Milliman study prepared under contract with RMA.<br />
Net Income, Return on<br />
Equity, and Cost of<br />
Capital<br />
In order to respond to the public<br />
debate regarding the profitability of the<br />
program, we first need to clarify the distinction<br />
between gross revenue and net<br />
income. The net income, or profit, of a<br />
business is the difference between its revenue<br />
and expense. For a crop insurer, revenues<br />
consist of underwriting gains and<br />
A&O payments, as well as any income<br />
earned from the investment of the insurer’s<br />
capital. Program delivery expenses include<br />
loss adjustment expense, agent compensation,<br />
and company overhead. Net income<br />
is also net of Federal, state, and local taxes.<br />
While net income is important in itself,<br />
companies also need to know how well<br />
they are performing in comparison to their<br />
peers and other industries. The accepted<br />
standard for measuring the profitability of a<br />
company or an industry is its Return on<br />
Equity (ROE), defined as the ratio of net<br />
income to the equity (i.e., capital) invested<br />
in the business. According to financial theory,<br />
unless ROE is competitive with other<br />
uses for capital, capital will be withdrawn<br />
from an industry and be reinvested in<br />
industries with better rates of return. In<br />
general, the riskier a business, the greater<br />
its rate of return needs to be. Financial theory<br />
refers to the required rate of return of<br />
a business as its cost of capital. In effect, a<br />
company needs to achieve an ROE equal<br />
to its cost of capital in order to remain<br />
viable over the long term.<br />
Cost Effectiveness<br />
Another issue raised during public discussions<br />
has been the A&O payments<br />
made to the companies. A&O has often<br />
been described as extra profit that companies<br />
make in addition to their underwriting<br />
gains. The reality is that A&O is used to<br />
compensate insurers for their cost of delivery.<br />
A&O is paid on behalf of farmers<br />
rather than included as part of the premium<br />
in order to reduce farmers’ out-ofpocket<br />
cost for risk protection.<br />
One question critics raise with regard<br />
to A&O is whether the government is<br />
overpaying for private sector delivery of<br />
the program. This question can be<br />
addressed by comparing the cost of delivery<br />
of the Federal crop insurance program<br />
to other P&C lines of insurance.<br />
That comparison has been published in a<br />
report prepared by Grant Thornton LLP 1 .<br />
The report demonstrates that the crop<br />
insurance industry is vastly more cost<br />
effective than other sectors of the insurance<br />
industry. Total delivery expense in<br />
2010 for the crop insurance industry was<br />
roughly 25 percent of expected indemnities.<br />
For the P&C industry in total, the<br />
comparable cost was in excess of 65 percent.<br />
Over the most recent five year period,<br />
loss adjustment expense for the crop<br />
12 AUGUST <strong>2012</strong>
insurance industry averaged just 2.5 percent<br />
of expected indemnities versus 14.6<br />
percent for Homeowners and Private<br />
Passenger Auto Physical Damage insurance.<br />
Agent compensation was 16.3 percent<br />
in comparison to 18.1 percent for<br />
the P&C industry in total. Company overhead<br />
expense for the crop insurance<br />
industry was only 4.9 percent versus 22.6<br />
percent for the P&C industry as a whole.<br />
Clearly, the industry has very little fat left<br />
to trim.<br />
<strong>Crop</strong> insurers also raise a question with<br />
regard to A&O payments, but their question<br />
is whether the amount of A&O they<br />
receive is adequate to cover their delivery<br />
cost. A&O has been cut drastically over<br />
time, from 35 percent of premium in the<br />
early years of the program, to an estimated<br />
11 percent in 2011. Prior reductions had<br />
been feasible due to the rapid growth of<br />
the program, which enabled companies to<br />
spread their costs over a larger base. It<br />
needs to be recognized, however, that the<br />
current A&O reimbursement is a fraction of<br />
the amount that other insurers receive for<br />
delivering the Federal Flood insurance program,<br />
a program in which insurers share<br />
none of the risk, and a fraction of the premium<br />
expense loading in other sectors of<br />
the P&C industry. Out of this reduced<br />
A&O allotment, critics of the industry argue<br />
that companies should be able to pay loss<br />
adjusters to investigate and settle claims on<br />
one out of every four policies, cover company<br />
overhead costs such as employee<br />
salaries, benefits, rent, and utilities, and<br />
compensate agents for delivery of the program<br />
to farmers. This is simply not feasible.<br />
The reality is that A&O does not now<br />
and has not been adequate to cover program<br />
delivery cost for the past 15 years.<br />
Companies have been compelled to dig<br />
into their own pockets instead to pay the<br />
portion of expenses not covered by A&O.<br />
Measuring the <strong>Crop</strong><br />
<strong>Insurance</strong> Industry Rate<br />
of Return<br />
Because companies within the crop<br />
insurance industry differ with respect to<br />
their scale of operation, regional spread of<br />
business, and organizational structure,<br />
there is no single rate of return that can be<br />
Another issue raised<br />
during public discussions<br />
has been the A&O<br />
payments made to the<br />
companies. A&O has<br />
often been described as<br />
extra profit that companies<br />
make in addition to their<br />
underwriting gains.<br />
ascribed to every company in the industry.<br />
The following analysis instead attempts to<br />
estimate the average rate of return expected<br />
for the industry as a whole. Results<br />
have been developed based on an estimate<br />
of <strong>2012</strong> premium. These results do<br />
not reflect actual experience for 2011 or<br />
what may happen in <strong>2012</strong> due to effect of<br />
the drought. Instead, they represent what<br />
would have been expected for <strong>2012</strong> at the<br />
start of the year, before effects of the<br />
drought became apparent.<br />
• As noted above, the level of underwriting<br />
gains negotiated under the 2011<br />
SRA were estimated to be 14.5 percent<br />
of retained premium. However, underwriting<br />
gains are now expected to be 2<br />
points less than this due to the effect of<br />
the <strong>2012</strong> rate reductions.<br />
• A&O has been estimated based on the<br />
provisions of the 2011 SRA.<br />
• Estimated loss adjustment and industry<br />
overhead expenses for <strong>2012</strong> are the<br />
average of 2009 and 2010 actual<br />
expenses from the most recent Grant<br />
Thornton report adjusted for annual<br />
inflation of 2 percent;<br />
• Commissions are based on provisions<br />
in the 2011 SRA that provide up to 85<br />
percent of A&O for commissions and<br />
processing fees. Total agent compensation<br />
is limited to 100 percent of A&O<br />
plus an additional 5 percent for processing.<br />
• The delay in receiving A&O and underwriting<br />
gains imposes a financial cost<br />
on the industry of 0.5 percent of<br />
retained premium;<br />
• Equity retained in support of the program<br />
has been developed under the<br />
assumption that industry capital fully<br />
satisfies the requirements of the Code<br />
of Federal Regulations. This eliminates<br />
the need for commercial reinsurance<br />
and allows the cost of reinsurance to<br />
be excluded from the analysis.<br />
• Investment income is earned through<br />
the investment of the insurer’s equity<br />
in the bond markets. Equity is<br />
assumed to be invested in short-term<br />
instruments at 3.25% to ensure that the<br />
money will be available when needed.<br />
No investment income is earned on<br />
premium cash flows since premiums<br />
are collected close to the time when<br />
indemnities are paid.<br />
The attached exhibit estimates the<br />
crop insurance industry expected rate of<br />
return. Once all of the relevant factors<br />
have been taken into account, the industrywide<br />
expected return on equity of 5.8<br />
percent is well below the estimates<br />
quoted in the press. It is also significantly<br />
less than the industry’s cost of<br />
capital as reported in the 2009 Milliman<br />
study commissioned by RMA 2 . The<br />
industry’s rate of return is roughly half<br />
of the level needed to retain capital in<br />
the program. While critics might argue<br />
that an adequate rate of return could be<br />
achieved if industry were to reduce its<br />
expenses even further, this is not the<br />
case. Even if A&O covered all program<br />
delivery costs, industry ROE would be<br />
just 8.3 percent, still well below the<br />
industry’s cost of capital.<br />
Additional Observations<br />
on the Rate of Return<br />
The one certainty in the crop insurance<br />
industry is that change is continual.<br />
Ongoing program changes may bring<br />
about further changes. How these may<br />
affect the industry is yet to be determined.<br />
Additional points to keep in mind with<br />
regard to the results shown here are that<br />
returns earned by the industry are not<br />
guaranteed. Companies are exposed to<br />
considerable risk that may cause their<br />
results to vary widely from year to year<br />
and from region to region. The high<br />
degree of risk has not been adequately<br />
considered in any analysis provided by the<br />
government. Furthermore, an adequate<br />
CROP INSURANCE TODAY ® 13
ate of return at the national level may not<br />
ensure an adequate return for individual<br />
states. Certain states, particularly in the<br />
Southern Plains, have extremely low or<br />
even negative expected rates of return,<br />
which has serious implications for the<br />
long-term viability of the private delivery<br />
system in those regions.<br />
As the <strong>2012</strong> Farm Bill<br />
debate continues, it is<br />
hoped that everyone<br />
recognizes that the crop<br />
insurance system is working<br />
exactly as Congress<br />
intended by reducing<br />
taxpayer risk and speeding<br />
relief to growers when<br />
they need it the most.<br />
Summary<br />
As the <strong>2012</strong> Farm Bill debate continues,<br />
it is hoped that everyone recognizes that the<br />
crop insurance system is working exactly as<br />
Congress intended by reducing taxpayer risk<br />
and speeding relief to growers when they<br />
need it the most. This is why farmers and<br />
their bankers are strong proponents of the<br />
existing crop insurance structure and have<br />
asked that it not be weakened further. The<br />
crop insurance companies are doing more<br />
with less and fear that the misinformation<br />
reported in the press may undermine the<br />
successful public-private partnership that has<br />
taken more than three decades to build.<br />
The crop insurance industry welcomes<br />
the opportunity for an open and honest dialogue<br />
regarding the profitability of the program.<br />
We believe that an impartial analysis<br />
of the industry’s profitability will demonstrate<br />
that the industry is earning a rate of<br />
return less than industries of similar risk, and<br />
well below the industry’s cost of capital.<br />
1 h t t p : / / w w w. a g - r i s k . o rg / N C I S P U B S /<br />
SpecRPTS/GrantThornton/Grant_Thornton_R<br />
eport-2011.pdf<br />
2 Table 1 from Historical Rate of Return Analysis,<br />
prepared by Milliman, Inc., <strong>August</strong> 18, 2009<br />
14 AUGUST <strong>2012</strong><br />
Risk Management Education &<br />
Outreach Partnerships Program<br />
Farmer and Rancher Testimonials<br />
“The first exercise was one of the best I<br />
had, because it helped me realize I really<br />
didn’t know what I had for assets. The lesson<br />
for that week was to go home and look<br />
at everything and do an inventory and see<br />
what assets you have. What I learned really<br />
surprised me. This was a really great class<br />
to do. I learned about risk management,<br />
and about asset and liability management.<br />
I would tell everybody-if you are into<br />
farming, you need to take this class.”<br />
–Keith January, Sr., Fayette<br />
Jefferson County, Mississippi<br />
“This workshop has been most helpful<br />
to me because I have learned the different<br />
aspects of risk management on a farm.<br />
There are great aspects of record keeping,<br />
and financial record keeping is one of the<br />
most important things in taking care of the<br />
business on the farm.”<br />
–Sandra Bennett<br />
Madison County, Mississippi<br />
“I enjoyed participating in the workshops.<br />
I learned a lot about business planning as<br />
well as risk and goal setting and asset<br />
management; basically what is being looked<br />
at by bankers and other people these days<br />
in agriculture. I’m glad I participated in the<br />
program and thankful that Alcorn State<br />
University invited me to participate and it<br />
should be very beneficial to me.”<br />
–Louis Sanders, Mound Bayou<br />
Bolivar County, Mississippi<br />
See the complete, Developing Risk Management Plans article<br />
starting on page 4.<br />
Personalized Risk Management Strategies
TODAYcrop insurance<br />
2011<br />
Research Review<br />
By Dr. Mark Zarnstorff, NCIS<br />
Each year NCIS sponsors research<br />
projects on a variety of crops. The purpose<br />
of the research varies, but it could<br />
be to study new crops or changes in crop<br />
varieties/practices, to verify accuracy of<br />
loss charts and procedures, or develop<br />
improved loss instructions. All research<br />
projects are conducted for a period of at<br />
least three years. If, for some reason,<br />
results are not obtained for one or more<br />
years, the research project can be extended.<br />
University experiment stations and<br />
agricultural colleges conduct the research,<br />
often at more than one location across the<br />
United States. The results of the 2011<br />
research program are summarized below.<br />
It is important that these results are not<br />
used exclusively, but combined with the<br />
results from previous years’ research and<br />
any subsequent research.<br />
Canola–Saskatchewan<br />
This research was done to reexamine<br />
the influence of defoliation during the<br />
early stages of hybrid canola growth and<br />
development. The original research was<br />
done in the early 1980s on open pollinated<br />
varieties that have very different<br />
Soybeans V2 stage.<br />
growth rates and plant vigor compared<br />
with the hybrid varieties grown currently.<br />
This trial was done at two locations just<br />
out of Saskatoon, Saskatchewan during<br />
the 2011 growing season. The treatments<br />
were based on different leaf stages of<br />
2, 4, 6, 8, and 10 full leaves with defoliation<br />
levels of 0, 50, and 100 percent.<br />
The response to the defoliation treatments<br />
are below:<br />
Loss<br />
Defoliation 50% 100%<br />
2 Leaf 0% 5%<br />
4 Leaf 12% 24%<br />
6 Leaf 6% 28%<br />
8 Leaf 4 28%<br />
10 Leaf 3 28%<br />
Corn–Kansas<br />
This is the last year of the corn research<br />
project that is focused on the effect of stand<br />
reduction and the accuracy of the use of the<br />
one-for-one factor in stand reductions<br />
occurring after the 11-leaf stage. The treatments<br />
are stand reductions of 0, 25, 50, and<br />
75 percent being applied at the 7, 10, 13,<br />
and 17-leaf stages. The experiment was<br />
done under irrigation at an elevation of 2800<br />
ft at Garden City, Kansas. The response to<br />
the stand reduction treatments are below:<br />
Loss<br />
Leaf Stage 7 leaf 10 leaf 13 leaf 17 leaf<br />
25% Stand Loss 19% 9% 6% 23%<br />
50% Stand Loss 3% 23% 17% 28%<br />
75% Stand Loss 46% 53% 52% 68%<br />
16 AUGUST <strong>2012</strong>
Collecting wheat samples in Washington.<br />
Corn–Illinois, Minnesota,<br />
Ohio<br />
This research is being conducted to<br />
determine the accuracy of the maturity<br />
line appraisal method for corn. Previous<br />
research suggested that the current maturity<br />
line appraisal method may be underestimating<br />
the final yields when done at<br />
the early milk lines. The research was<br />
done in three states to try and determine<br />
the actual corn fill rates and if the current<br />
factors are adequate or if different factors<br />
may be more appropriate. The research<br />
shows that the current appraisal method<br />
underestimates yield by approximately<br />
44 percent at the 1/4 kernel stage to<br />
about 28 percent at the doughy<br />
stage. The appraisal method estimated<br />
yield within five percent of the actual<br />
yield when the appraisal was done in the<br />
extended kernel stage.<br />
Cotton–Arizona<br />
This study was initiated to determine<br />
the effects of plant cut-offs in cotton, that<br />
is specific to the growing conditions of<br />
Arizona. This research looks at the cutoffs<br />
during vegetative and reproductive<br />
stages of growth. The treatments were<br />
cutoffs at node 2, 4, 8, 12, 16, and 24 with<br />
the cutoff occurring at the top node, and<br />
then at 2 nodes and 4 nodes below the<br />
top node. An example would be at node<br />
16, the cut-offs would occur at C16, C14,<br />
and C12.<br />
The growth stage at which the plant<br />
cut-offs were removed had a significant<br />
effect on cotton yield. The loss percentages<br />
were consistently lower than what<br />
the current charts would suggest.<br />
Node Cut 2 4 8 12 16 24<br />
Terminal 9% 6% 2% 9% 9% 3%<br />
Cut 2 Nodes 11% 5% 7% 9% 4%<br />
Cut 4 Nodes 12% 8% 9% -1%<br />
Cotton–South Carolina<br />
This study was initiated to determine<br />
the effects of plant cut-offs in cotton that is<br />
specific to the growing conditions of South<br />
Carolina. This research was conducted<br />
under dryland and irrigated conditions.<br />
This study looks at the cut-offs during vegetative<br />
and reproductive stages of growth.<br />
The treatments were cutoffs at node 2, 4, 8,<br />
12, 16, and 24 with the cutoff occurring at<br />
the top node, and then at 2 nodes and 4<br />
nodes below the top node. An example<br />
CROP INSURANCE TODAY ® 17
and first open boll (approximately 16 fruiting<br />
branches) and was done under subsurface<br />
drip irrigation. Losses are outlined<br />
below:<br />
Defoliation was another aspect of this<br />
trial. Defoliation at levels of 0, 50, and 100<br />
percent were done at the same stages as<br />
the limb removals. Results are as follow:<br />
Loss<br />
Defoliation 50% 100%<br />
R8 11% 35%<br />
R12 20% 65%<br />
R16 13% 20%<br />
Counting tillers.<br />
would be at node 16, the cut-offs would<br />
occur at C16, C14, and C12.<br />
The growth stage at which the plant<br />
cut-offs were removed had a significant<br />
effect on cotton yield. The loss percentages<br />
were consistently lower than what the current<br />
charts would suggest. The later stages<br />
of development actually saw increased<br />
yields under irrigation from the removal of<br />
the upper most nodes.<br />
Irrigated Loss<br />
Node Cut 2 4 8 12 16 24<br />
Terminal 10% -5% -7% -13% -21% -14%<br />
Cut 2 Nodes 6% -10% 13% -28% -27%<br />
Cut 4 Nodes 14% 20% -3% -26%<br />
Dryland Loss<br />
Node Cut 2 4 8 12 16 24<br />
Terminal 4% 12% 10% 10% 3% -5%<br />
Cut 2 Nodes 12% 7% 10% 2% -6%<br />
Cut 4 Nodes 18% 19% 34% -9%<br />
Cotton–Texas<br />
This trial was initiated to look at the differences<br />
in the impact of limb removal and<br />
defoliation on the production of “stripper”<br />
and “picker” cotton in the High Plains of<br />
Texas. The development of newer varieties,<br />
with a combination of genetic characteristics<br />
between the traditional “stripper”<br />
and “picker” types, has resulted in some<br />
questions in how these newer varieties will<br />
respond to defoliation and vegetative limb<br />
removal. This study looks at removal of the<br />
reproductive limbs at levels of 0, 25, 50, 75,<br />
and 100 percent at first flower (approximately<br />
eight fruiting branches); one-inch<br />
boll (approximately 12 fruiting branches);<br />
Loss<br />
Limb Removal 35% 50% 75% 100%<br />
R8 3% 1% -2% 1%<br />
R12 -2% -1% 10% 29%<br />
R16 16% 32% 44% 94%<br />
Cotton–Texas<br />
This study was initiated to determine the<br />
effects of plant cut-offs in cotton that is specific<br />
to the growing conditions of Texas.<br />
The trial was conducted under dryland and<br />
irrigated conditions and looks at the cut-offs<br />
during vegetative and reproductive stages<br />
of growth. The treatments were cutoffs at<br />
node 2, 4, 8, 12, 16, and 24 with the cutoff<br />
occurring at the top node, and then at 2<br />
nodes and 4 nodes below the top node. An<br />
example would be at node 16, the cut-offs<br />
would occur at C16, C14, and C12.<br />
The weather conditions were extremely<br />
difficult for growing cotton, especially under<br />
the dryland conditions due to extreme<br />
drought. The response to the various treatments<br />
varied greatly and will be examined<br />
to determine their fit before any changes are<br />
incorporated into the loss procedures.<br />
Irrigated Loss<br />
Node Cut 2 4 8 12 16 24<br />
Terminal 6% 23% 5% 22% -13% -8%<br />
Cut 2 Nodes 18% 10% 17% 13% 3%<br />
Cut 4 Nodes 21% 9% 6% 15%<br />
Dryland Loss<br />
Node Cut 2 4 8 12 16 24<br />
Terminal 2% -4% 8% -5% 11% 8%<br />
Cut 2 Nodes 29% 8% 26% -11% -17%<br />
Cut 4 Nodes 19% -37% -16% 8%<br />
Dry Beans–Nebraska<br />
This is the third year of a three-year<br />
study of the influence of defoliation on two<br />
new plant architecture classifications of dry<br />
beans. Historically, dry beans have been<br />
18 AUGUST <strong>2012</strong>
classified as either bush (Type I), vining<br />
(Type III) or as pole (Type IV). Plant<br />
breeders have started developing new varieties<br />
that are not true bush types (not<br />
determinant like a true bush) but are more<br />
upright in architecture than the true vining<br />
types that were very prostrate. These new<br />
varieties are classified as Type IIa (Upright<br />
short vines–USV) and Type IIb (Upright<br />
vines–UV).<br />
This trial looked at two varieties, one a<br />
UV (Matterhorn) and one a Type III (Beryl)<br />
with plant defoliation at three different stages<br />
of growth, V4, R1, and R3 and imposed four<br />
different levels of defoliation: 0, 33, 66, and<br />
100 percent. There was no difference in the<br />
response of the two varieties at the different<br />
stages of growth and levels of defoliation<br />
over the three years of the trials.<br />
Dry Field Peas–<br />
Saskatchewan, Canada<br />
2011 was the third year for this trial<br />
looking at node removal or cut-offs in<br />
field peas. The current varieties used for<br />
dry pea production are almost exclusively<br />
semi-leafless varieties that have little to no<br />
leaf area but rather an enlarged stipule at<br />
the base of each node or branch. This<br />
leaves no “defoliation” as a means of<br />
determining losses, so we are left with cutoffs<br />
or node removal as the way to determine<br />
the losses due to hail damage.<br />
Treatments consisted of the plant having<br />
0, 25, 50, 75, or 100 percent of the above<br />
ground nodes removed at the four, eight,<br />
12, 16 node stages and at the second<br />
flower bloom (approximately 20 nodes).<br />
The 2011 growing season was different<br />
than 2009 or 2010 because it was more<br />
“normal”—drier than 2010 but warmer<br />
than 2009. The three years of the study<br />
had data from the range of weather that is<br />
often experienced in Saskatchewan so<br />
should provide a good average for what<br />
can be expected.<br />
Loss<br />
Nodes Removed 25% 50% 75% 100%<br />
Losses at Stage V4 –% 5% –% 11%<br />
Losses at Stage V8 17% 28% 31% 45%<br />
Losses at Stage V12 35% 55% 74% 85%<br />
Losses at Stage V16/R1 45% 62% 73% 87%<br />
Losses at Stage R2 49% 74% 89% 95%<br />
Rice.<br />
Dry Field Peas–<br />
Washington<br />
The state of Washington is a traditional<br />
growing area for dry field peas. The<br />
climate is much different than<br />
Saskatchewan or North Dakota in that the<br />
summer is much warmer and drier than<br />
those found in the upper Great Plains.<br />
Field peas may not have as much potential<br />
for recovery if cut-off by hail as the<br />
plant develops because of this. A trial<br />
was initiated in 2010 to study the affect of<br />
hail on cut-offs of dry field peas. The current<br />
varieties used for dry pea production<br />
are almost exclusively semi-leafless varieties<br />
which have little to no leaf area but<br />
rather an enlarged stipule at the base of<br />
each node or branch. This leaves no<br />
“defoliation” as a means of determining<br />
losses, so we are left with cut-offs or<br />
node removal as the way to determine<br />
the losses to hail damage. Treatments<br />
consisted of the plant having 0, 25, 50,<br />
75, or 100 percent of the above ground<br />
nodes removed at the 4, 8, 12 node<br />
stages and at the second flower bloom<br />
(approximately 14 nodes in 2011 due to<br />
dry weather). Removal of nodes at the 4-<br />
node stage had little effect on the production<br />
of the peas. Losses for the 8-node<br />
treatment were not very severe until it<br />
reached 100 percent of the nodes<br />
removed. The losses increased as the age<br />
of the plant advanced especially with<br />
damage of 75 or 100 percent of the nodes<br />
removed.<br />
Loss<br />
Nodes Removed 25% 50% 75% 100%<br />
Losses at Stage V4 –% 31% –% 53%<br />
Losses at Stage V8 47% 45% 84% 63%<br />
Losses at Stage V12 70% 48% 100% 100%<br />
Losses at Stage R2 69% 90% 100% 100%<br />
Rice–Arkansas<br />
This study was developed to compare<br />
some of the new hybrid rice varieties to a<br />
conventional rice variety with respect for<br />
the tendency to shatter. Various observations<br />
have been made over the past two<br />
years that the new hybrid rice varieties<br />
have a greater yield potential than the<br />
conventional varieties, but that under<br />
field conditions they may also have a<br />
greater tendency to shatter the seed<br />
before harvest. This experiment looked at<br />
the conventional variety “Wells” and<br />
compared these to the hybrid varieties<br />
“Arize 1003”, “CLXL729,”“CLXL745,” and<br />
“XL723.” These varieties were planted<br />
within the rice variety tests that were<br />
planted at seven different locations with<br />
the rice growing of Arkansas. Just prior to<br />
harvest, ten representative heads of each<br />
variety tested were clipped and placed in<br />
CROP INSURANCE TODAY 19
a bag. The ten heads were then “slapped”<br />
against the collector’s leg for ten times<br />
resulting in seeds that either remained<br />
attached to the panicle or were loose.<br />
These seeds were then weighed and<br />
counted to determine the percent of shatter<br />
for each variety. The ease of shatter<br />
was greater in 2011 than 2010 for all varieties,<br />
including the conventional “Wells.”<br />
Percent of Shatter<br />
Variety 2011 Two Year Average<br />
Arize 1003 52% 52%<br />
CLXL729 75% 62%<br />
CLXL745 60% 50%<br />
XL723 76% 66%<br />
Wells 51% 37%<br />
Soybeans–Missouri<br />
A trial that began in 2009 continued to<br />
look at the removal of nodes at various<br />
times during the vegetative and reproductive<br />
stages. The stages that were studied<br />
were the V3, R1, and R3 stages with<br />
node removal rates of 25, 50, 75, and 100<br />
percent. The differences in response to<br />
the level of node removal at the different<br />
stages are similar to those shown in previous<br />
studies in Indiana and Iowa.<br />
Loss<br />
Nodes Removed 25% 50% 75% 100%<br />
Stage V4 3% 4% 13% 78%<br />
Stage R1 4% 7% 33% 100%<br />
Stage R3 5% 33% 47% 100%<br />
Wheat–Washington<br />
This trial was done to research the<br />
different factors that can influence the<br />
yield of soft white winter wheat in the<br />
Pacific Northwest. This research looked<br />
at four different seeding rates for two<br />
different varieties in two different climatic<br />
areas of wheat production in<br />
Washington State. The seeding rates<br />
were 50, 75, 100, and 125 percent of<br />
“normal” for the different growing areas.<br />
Some of the factors that were measured<br />
were number of plants established in the<br />
spring, the number of heads per plant,<br />
the kernels per head, the 1000 kernel<br />
weights, and yields. The planting areas<br />
were considered to be a ‘high rainfall”<br />
around Pullman and a medium rainfall<br />
area around Davenport.<br />
The number of plants per foot of row<br />
increased only at the highest seeding<br />
rate at Davenport and there was no difference<br />
between seeding rates at<br />
Pullman except for the lowest rate. The<br />
number of heads per plant was highest<br />
for the lower seeding rates for “Madsen”<br />
at Davenport and at Pullman. There was<br />
no difference for “Eltan” at either location.<br />
The numbers of kernels per head<br />
were not significantly different for<br />
“Eltan” at either location, while the<br />
lower seeding rates had greater seed<br />
numbers for “Madsen” at both locations.<br />
Yield at Davenport for “Eltan” was<br />
greater for the 75,100, and 125 percent<br />
seeding rates compared to the 50 percent<br />
seeding rate while there was no<br />
difference between the higher three<br />
seeding rates. There was no difference<br />
in Yield for “Madsen” between the 100<br />
and 125 percent seeding rates which<br />
were both greater than the lower<br />
seeding rates.<br />
Errors and Omission <strong>Insurance</strong><br />
For Your Agency<br />
Full lines of coverage including MPCI <strong>Crop</strong> <strong>Insurance</strong><br />
We will work diligently to offer you quotes with<br />
reputable companies at competitive prices<br />
To obtain a quote for your agency call 1-800-769-6015<br />
American <strong>Insurance</strong> <strong>Services</strong>, LLC.<br />
Premium financing is available<br />
We have over 35 years experience in all lines of insurance<br />
www.tomstanleyinsurance.com<br />
20 AUGUST <strong>2012</strong>
TODAYcrop insurance<br />
RMA/AIP<br />
Data Mining<br />
Steering Committee<br />
By Troy Brady and David Hall, NCIS<br />
The Agricultural Risk Protection Act of<br />
2000 (ARPA) required the Secretary of<br />
Agriculture to use data technologies to<br />
administer and enforce crop insurance program<br />
compliance and integrity initiatives.<br />
The Risk Management Agency’s (RMA)<br />
Office of Strategic Data Acquisition and<br />
Analysis (SDAA) was established to manage<br />
the Agency’s data warehousing and<br />
data mining program. SDAA partnered with<br />
the Center for Agribusiness Excellence<br />
(CAE) at Tarleton State University in<br />
Stephenville, Texas to carry out its responsibilities.<br />
Since 2001, CAE has developed<br />
and managed RMA’s data warehouse and<br />
data mining initiatives. As RMA’s data mining<br />
function has grown over the years,<br />
Approved <strong>Insurance</strong> Providers (AIPs) have<br />
begun to take a more active role in the data<br />
mining program.<br />
Background on Current<br />
Data Mining Structure<br />
and Activities<br />
Data mining assists RMA in identification<br />
and elimination of program fraud,<br />
waste and abuse by targeting program<br />
weaknesses and identifying agents, loss<br />
adjusters and producers that may need to<br />
be monitored or investigated. CAE is also<br />
responsible for delivering an annual spot<br />
check list of producers to the Farm<br />
Service Agency (FSA) as part of their<br />
monitoring program required by ARPA.<br />
These are producers whose data are<br />
indicative of anomalous behavior.<br />
Similarly, CAE provides AIPs with a spot<br />
check list of anomalous producers, agents<br />
and loss adjusters each year.<br />
CAE has developed a relational database<br />
that contains records from multiple<br />
RMA and FSA data tables (Figure 1). It<br />
includes all Federal <strong>Crop</strong> <strong>Insurance</strong><br />
Corporation (FCIC) reinsurance year policyholder<br />
data from 1991 through the present.<br />
The data warehouse and data mining<br />
techniques are used to identify agents, loss<br />
Figure 1. The Data Mining Process<br />
Agency<br />
data<br />
Other<br />
federal data<br />
Data from<br />
public<br />
sources<br />
Data from<br />
the private<br />
sector<br />
Input<br />
Collected, linked,<br />
validated,and<br />
formatted<br />
Data<br />
warehouse<br />
Source: GAO, adapted from Vipin Kumar and Mohammed J. Zaki.<br />
adjusters and producers that exhibit<br />
“anomalous” claim outcomes. Anomalous<br />
outcomes are defined as outcomes that are<br />
equal to or greater than 150 percent of the<br />
mean claim outcome in a designated area.<br />
Although anomalous behavior is not considered<br />
evidence of fraud, waste and<br />
abuse, it is an indicator of situations that<br />
may warrant further examination.<br />
Extensive Data<br />
Warehouse<br />
RMA and FSA program data are only a<br />
portion of the information within RMA’s<br />
Analysis<br />
Iterative query<br />
Pattern-based query<br />
Subject-based query<br />
Iterative query<br />
Analysis can be iterative with the<br />
results of one query being used to<br />
define criteria for a subsequent query<br />
Output<br />
Results<br />
Results<br />
Results<br />
Results<br />
Results can be in<br />
printed or electronic<br />
format<br />
CROP INSURANCE TODAY 23
data warehouse (Figure 2). CAE regularly<br />
collects, stores and analyzes weather, soils<br />
and flood data from numerous public and<br />
government sources. Data sources include:<br />
NEXRAD radar reflectivity data, used to verify<br />
hail, tornado and hurricane damage<br />
claims; long term historical and current temperature,<br />
precipitation, hail and other meteorological<br />
data from weather stations<br />
around the country, which is used to validate<br />
hail, excess moisture heat, flooding,<br />
drought and freeze claims; gridded<br />
Quantitatively controlled Precipitation<br />
Estimate (QPE) data that uses multiple<br />
sources (radar, weather stations, and<br />
satellite data) to estimate precipitation,<br />
which is used for excess moisture, flood,<br />
and drought claims; and satellite data<br />
from the Moderate-Resolution Imaging<br />
Spectroradiometer (MODIS) sensor aboard<br />
two satellites, which is used to validate prevented<br />
planting, flood and drought claims.<br />
Additional weather data is obtained from<br />
the Parameter-elevation Regressions on<br />
Independent Slopes Model (PRISM)<br />
Climate Group at Oregon State University<br />
(OSU). Soils data is obtained from the<br />
<strong>National</strong> Resources Conservation Service<br />
(NRCS). Many of these data are collected in<br />
real-time and stored for future analysis<br />
within the data warehouse and spatial data<br />
marts. Collectively these data represent<br />
over twenty-five terabytes of storage space<br />
within RMA’s data warehouse and spatial<br />
data marts.<br />
Impetus for and<br />
Expectations of the Data<br />
Mining Steering<br />
Committee<br />
Prior to 2011, SDAA had hosted an<br />
annual meeting with AIPs to update them<br />
on data mining activities. Three AIPs had<br />
participated in SDAA’s Users Group, which<br />
met quarterly to discuss data mining initiatives.<br />
In addition, over the past few years<br />
several AIPs have submitted work orders<br />
to SDAA for data mining assistance on controversial<br />
claims and similar issues.<br />
Under the 2011 Standard Reinsurance<br />
Agreement (SRA), RMA and the AIPs<br />
agreed to expand the use of data mining<br />
for program integrity and compliance.<br />
Figure 2. An Overview of the RMA System<br />
Government data from systems of record<br />
- <strong>Crop</strong> insurance program records<br />
- <strong>Insurance</strong> agents records<br />
- <strong>Insurance</strong> adjuster records<br />
Public data<br />
- Public available information including<br />
information found on public Web sites<br />
Government data NOT from systems of record<br />
- Public land survey data<br />
- <strong>National</strong> Resources Conservation Service soils data<br />
- <strong>National</strong> Oceanic Atmospheric Administration weather data<br />
Risk Management<br />
Agency (RMA)<br />
Scenario<br />
concept<br />
Scenario concept for<br />
developing checklists<br />
for fraud and abuse<br />
Structured<br />
scheme to<br />
defraud<br />
CAC data<br />
warehouse<br />
cleans data<br />
Specifically, Section III (b) (1) of the SRA<br />
Appendix IV (A-IV) specifies the scope of<br />
the data mining reviews to be conducted<br />
by AIPs and establishes a formal consultative<br />
framework between RMA and AIPs for<br />
data mining activities.<br />
In response to this new SRA provision,<br />
RMA and the AIPs have established a standing<br />
RMA/AIP Data Mining Steering<br />
Committee (Committee). The Committee<br />
first met in October 2010, and continues to<br />
meet on a periodic basis throughout the<br />
year. The Committee focuses on increasing<br />
the use of data mining to:<br />
• Enhance program integrity—reduce<br />
program fraud, waste, abuse;<br />
• Obtain greater administrative efficiencies—make<br />
more effective use of limited<br />
RMA and AIP resources for assuring<br />
program compliance and integrity; and<br />
From its inception, the<br />
Committee has strived<br />
to achieve a proactive<br />
quality control (QC)<br />
program premised on<br />
an active partnership<br />
between AIPs and RMA.<br />
Center for Agribusiness Excellence (CAE)<br />
Data needed to test scenario are<br />
extracted from CAE data warehouse<br />
Scenario tested<br />
Scenario refined<br />
Oracle<br />
data mart<br />
Presented to<br />
Product Review<br />
Meeting team<br />
Scenario rejected<br />
Data containing personal identifiers<br />
Data NOT containing personal identifiers<br />
Location of data mining<br />
Source: GAO analysis of agency data.<br />
Access includes<br />
a data query<br />
function<br />
Spot check list<br />
or other product<br />
developed<br />
Scenario accepted<br />
Scenario abandoned<br />
Accessed by<br />
- RMA regional compliance offices<br />
- RMA underwriters<br />
- RMA data quality office<br />
- Other authorized users<br />
Access to<br />
- Name<br />
- Address<br />
- Phone number<br />
- Social Security number<br />
CAE sends spot check<br />
list to RMA Regional<br />
Compliance Offices<br />
Letter sent<br />
to insurance<br />
company<br />
Sent to USDAʼs<br />
Farm Service<br />
Agency (FSA)<br />
Letter<br />
and/or visit<br />
to individual<br />
farmer<br />
• Achieve program improvements—critically<br />
assess identified or suspected program/policy<br />
deficiencies and evaluate<br />
potential solutions.<br />
The membership of the Committee consists<br />
of representatives from RMA’s Office<br />
of the Administrator, the Deputy<br />
Administrator for Compliance, and the<br />
SDAA Director, as well as AIP and NCIS<br />
representatives. The Committee is chaired<br />
by an AIP representative selected by the<br />
AIP Committee members. NCIS provides<br />
coordination and communication of the<br />
Committee’s activities with all AIPs.<br />
Data Mining Steering<br />
Committee Activities<br />
From its inception, the Committee has<br />
strived to achieve a proactive quality control<br />
(QC) program premised on an active<br />
partnership between AIPs and RMA. In that<br />
spirit, the Committee has been active in<br />
addressing many aspects of implementing<br />
the new QC initiatives outlined in the 2011<br />
A-IV. Several of the QC initiatives tackled<br />
by the Committee include: reviewing and<br />
fine-tuning scenarios for development of<br />
the annual spot check lists; obtaining RMA’s<br />
concurrence to clarify the QC requirements<br />
outlined in A-IV, which resulted in a revised<br />
A-IV starting with the <strong>2012</strong> reinsurance<br />
year; development of QC review procedures<br />
for AIPs use in standardizing their<br />
24 AUGUST <strong>2012</strong>
eview efforts; and streamlining the FSA<br />
spot check review process while augmenting<br />
that process with a parallel AIP spot<br />
check review process that focuses on a second<br />
layer of anomalous policies.<br />
RMA and CAE have developed several<br />
scenarios to generate their annual spot<br />
check lists. Scenarios employed in the<br />
development of the annual spot check lists<br />
includes: use of new entities being created,<br />
switching entities, and utilizing different<br />
tax IDs to lose prior adverse yield history;<br />
late modification of acreage reports or<br />
claims to increase the indemnity payment;<br />
adding or dropping yields, incorrect copying<br />
of yields to new APH databases, yield<br />
switching, excessive yields and changing<br />
yields when the unit has a loss; as well as<br />
repetitive and severe losses. The<br />
Committee identified excessive yields,<br />
yield switching, and repetitive and severe<br />
losses scenarios as being most beneficial in<br />
AIPs’ QC efforts. Concentrating mandatory<br />
data mining reviews based on these scenarios<br />
would yield more effective results<br />
than employing simple random samples as<br />
required in prior reinsurance years.<br />
Committee discussions that focused on<br />
ways to address minor discrepancies and a<br />
more precise definition of what constituted<br />
an “inspection” resulted in a clarification to<br />
A-IV beginning with the <strong>2012</strong> reinsurance<br />
year. For instance, the Committee focused<br />
on ways to minimize the need for additional<br />
review of an insured’s certified second<br />
and third prior year production records<br />
when relatively minor discrepancies were<br />
found in the initial prior year’s record<br />
review. Similarly, the Committee also<br />
focused on the application of the SRA’s<br />
definition of an inspection. The Committee<br />
sought better clarification of when only<br />
limited, specific items would be required<br />
for review versus when a full “inspection”<br />
would be required. Since specifically<br />
defined requirements accompanying a<br />
review notification would take precedence<br />
over the general A-IV procedures, RMA<br />
will provide AIPs better clarity and consistency<br />
in their accompanying instructions<br />
on future reviews.<br />
Discussions of this nature demonstrated<br />
the need for development of procedures<br />
that would facilitate uniform QC reviews<br />
by all AIPs. The Committee took the lead in<br />
defining a set of spot check list procedures<br />
that would facilitate consistent application<br />
of those procedures by all AIPs. RMA<br />
released the final Spot Check List<br />
Procedures on July 12, <strong>2012</strong>. Also at the<br />
Committee’s recommendation, SDAA is<br />
implementing a release notification process<br />
so that all AIP QC managers are aware of<br />
the ongoing enhancements to the QC<br />
review process.<br />
The FSA Spot Check list developed by<br />
CAE encompasses a broad range of scenarios<br />
and generally yields a large number of<br />
anomalous observations. To limit the number<br />
of false positives, in which a producer<br />
ends up on the spot check list when there<br />
are legitimate reasons for the producer to<br />
differ from other producers in the area,<br />
CAE uses criteria that limit the probability<br />
of this occurring to less than 1 in 10,000. In<br />
addition, to avoid overburdening FSA<br />
county offices, the list is further pared<br />
down such that there are no more than 10<br />
producers on the spot check list for any<br />
FSA County Office to review. Per the agreement<br />
between FSA and RMA, FSA County<br />
Offices should: 1) notify each policyholder<br />
on the spot check list of their placement on<br />
the list; and 2) conduct a field inspection of<br />
each policyholder placed on the spot<br />
check list. The Committee advocated that<br />
the process used for generating the FSA<br />
spot check list should also be used for initial<br />
year data mining review identification.<br />
PRISM and HyDRA<br />
A desire to become more proactive<br />
rather than reactive has been a central<br />
focus of the Committee. RMA had already<br />
begun work with climatologists at OSU to<br />
tailor their PRISM climate mapping system<br />
for AIP use. As a compliment to the SDAA<br />
data mining activities, it was thought that<br />
individual AIPs would be able to better<br />
conduct some of their own monitoring<br />
activities if they had access to certain sets<br />
of data that has been assembled by CAE.<br />
So in addition to providing feedback to<br />
RMA and OSU on the deployment of the<br />
PRISM system, the Committee pressed for<br />
access to various individual or layered sets<br />
of climate data, such as rainfall and temperature,<br />
satellite imagery, soil types and<br />
Figure 3. Sample PRISM Screens<br />
yield trends that could be made available<br />
to AIPs via RMA’s CAE developed dashboard<br />
system.<br />
So what is PRISM? Principal causes of<br />
crop insurance claims include an inability<br />
to plant due to excessively wet conditions,<br />
crop failure due to insufficient moisture,<br />
delay in harvesting, and reduction in crop<br />
quality due to cold and wet weather or<br />
unusually hot weather. So how do claims<br />
Principal causes of crop<br />
insurance claims include an<br />
inability to plant due to<br />
excessively wet conditions,<br />
crop failure due to insufficient<br />
moisture, delay in harvesting,<br />
and reduction in crop quality<br />
due to cold and wet weather<br />
or unusually hot weather.<br />
managers evaluate whether it was too<br />
wet, too dry, too cold or too hot in determining<br />
if an indemnity should be paid?<br />
That is the central theme of OSU’s new<br />
PRISM web portal (Figure 3) developed<br />
under contract with RMA to provide AIPs<br />
access to more than 30 years of climate<br />
data that is tailored to making crop insurance<br />
loss determinations.<br />
Why are the spatial aspects of weather<br />
and climate important? The location of<br />
CROP INSURANCE TODAY ® 25
a field with a potential crop loss is not<br />
always represented by a specific weather<br />
station, or variations in geographic factors<br />
can create large differences in climate<br />
or weather over small distances,<br />
and having continuous spatial data in the<br />
form of maps allows many locations to<br />
be analyzed and compared at one time.<br />
In short, we need accurate weather and<br />
climate maps so that we can see what’s<br />
happening on any given field at any<br />
given time.<br />
PRISM’s digital climate maps utilize<br />
the world’s most advanced climate mapping<br />
science. PRISM accounts for variations<br />
in climate due to elevation, rain<br />
shadows, coastal effects, temperature<br />
inversions, and more. As PRISM is rolled<br />
NCIS staff provides a critical<br />
communication link between<br />
the Committee and other<br />
AIPs. One method of<br />
ensuring the Committee’s<br />
efforts are communicated to<br />
all AIPs is through utilization<br />
of current NCIS standing<br />
committees and Board<br />
of Directors.<br />
out, RMA and OSU will be providing<br />
more information on its availability<br />
and use.<br />
CAE’s web based dashboard system<br />
for accessing data mining products is<br />
called the Hyper Dynamic Reporting<br />
Application, or HyDRA (Figure 4).<br />
HyDRA was initially only available for<br />
RMA use. The Committee early on<br />
identified that access to HyDRA could<br />
facilitate AIP analysis of potential claim<br />
situations. The AIP HyDRA system will<br />
be one of RMA’s primary tools for providing<br />
critical information directly to<br />
claims and QC managers for their use in<br />
loss determinations.<br />
Integral to HyDRA are crop reports,<br />
Figure 4. Sample HyDRA Screens<br />
access to weather data assembled by<br />
CAE, location information and numerous<br />
other features, all while ensuring that personally<br />
identifiable information is safeguarded.<br />
HyDRA features more than 20<br />
years of data and AIP users can analyze<br />
multiple sources of data in one report<br />
that is customizable for each user’s selections.<br />
Also facilitated in HyDRA is access<br />
to weather data, spatial reference data,<br />
and multiple years of NAIP aerial photography<br />
for any location in the continental<br />
United States and the ability to download<br />
and print reports, while ensuring the<br />
most current data is always available for<br />
AIP use. HyDRA for AIP use is nearing its<br />
implementation phase, and RMA and CAE<br />
will be providing more information on its<br />
availability and use, including requirements<br />
to use USDA’s eAuthentication<br />
security system, in the very near future.<br />
AIP Input and<br />
Communication<br />
A process that assures input into the<br />
Committee from all AIPs, as well as providing<br />
AIP feedback from the<br />
Committee’s efforts was an early consideration<br />
for the Committee. NCIS staff<br />
provides a critical communication link<br />
between the Committee and other AIPs.<br />
One method of ensuring the Committee’s<br />
efforts are communicated to all AIPs is<br />
through utilization of current NCIS standing<br />
committees and Board of Directors.<br />
NCIS staff regularly briefs the MPCI<br />
Policy, Procedure and Loss Adjustment<br />
Committee, the Technology and<br />
Information Processing Committee, the<br />
Program Development Committee and<br />
ultimately the NCIS Board of Directors<br />
on activities of the Committee. Meeting<br />
summaries of each Committee meeting<br />
are also provided to all AIP QC Managers<br />
and other AIP contacts. Regular updates<br />
for all AIPs are scheduled in conjunction<br />
with the NCIS <strong>National</strong> Claims Managers<br />
or Update Conferences. Effective input<br />
and communication with all AIPs is key<br />
to the continued successful efforts of the<br />
Committee.<br />
Future Data Mining<br />
Initiatives<br />
In addition to continued efforts in<br />
each of the areas outlined within this<br />
article, the Committee will continue to<br />
monitor and provide feedback on new<br />
data mining analyses developed by RMA<br />
and CAE. For example, at a meeting of<br />
the Committee held in Stephenville,<br />
Texas in May <strong>2012</strong>, CAE outlined additional<br />
analysis underway to determine if<br />
program procedures are being correctly<br />
applied, as well as CAE’s continuing<br />
efforts to improve their data sources and<br />
availability within the data warehouse.<br />
Future CAE data mining efforts will<br />
involve verifying added land determinations<br />
and application of crop rotation<br />
requirements through the use of satellite<br />
imagery and spatial data analysis.<br />
Another area of focus will be furthering<br />
research on changes to unit structure<br />
after a claim has been filed. CAE is also<br />
actively working on methods to verify<br />
drought, hurricane, flood, and prevented<br />
planting claims through improved<br />
weather, radar and satellite sources.<br />
The Committee will continue to monitor<br />
each new data mining effort<br />
throughout its development, while continuing<br />
to find ways to enhance AIP<br />
quality control efforts by capitalizing on<br />
RMA’s significant investment in data<br />
mining capabilities. The Committee’s<br />
efforts will benefit not only AIPs, but<br />
will also provide long-term benefit to<br />
producers who are not penalized in the<br />
form of higher rates due to fraudulent<br />
claims, which results in significant savings<br />
for the American taxpayer.<br />
26 AUGUST <strong>2012</strong>
Continued from President’s Message<br />
We Know There Are No<br />
Guarantees<br />
Some folks disdain the line it is what<br />
it is. Well, agriculture is inherently risky.<br />
From planting to harvest, from marketing<br />
to financing, there are risks every step of<br />
the way—no guarantees. The purpose of<br />
insurance is to minimize the disruptions<br />
along the way. Farmers pay crop insurance<br />
premiums, a relatively fixed amount<br />
of money every year, knowing they will<br />
recover a significant portion of their economic<br />
crop losses in years like this one.<br />
Even so, not all risks or losses will be<br />
covered, even for farmers who purchase<br />
higher levels of coverage—no guarantees.<br />
The Midwest corn and soybean sector<br />
is expected to rebound after <strong>2012</strong> in<br />
large part due to an effective crop insurance<br />
program. The final outcome for the<br />
Midwest will vary by state and individual<br />
farmer. There will be winners and losers.<br />
Similarly, the financial outcome for the<br />
crop insurance industry is not guaranteed,<br />
contrary to critics of the program.<br />
Both the USDA and the crop insurance<br />
companies share in the financial gains<br />
and losses of the program, depending<br />
upon the severity of losses by state.<br />
Industry earnings are neither certain or<br />
guaranteed.<br />
What Should Never Be<br />
The drought of <strong>2012</strong> and the uncertainty<br />
of the Farm Bill process should<br />
never be an opportunity for critics of the<br />
program to take advantage of the hardships<br />
farmers are currently experiencing.<br />
Starting in about March of this year, the<br />
crop insurance industry came under siege<br />
from a series of premeditated attacks as<br />
the Farm Bill moved through the Senate<br />
and along to the House. Since that time,<br />
the crop insurance industry and its supporters<br />
in Congress continue to come<br />
under a barrage of unwarranted criticisms<br />
on a weekly, if not daily basis. Critics<br />
state the program is flawed and recommend<br />
crop insurance reform. These criticisms<br />
are in the face of an infrastructure<br />
of 16 companies located nationwide, a<br />
workforce of approximately 20,000 crop<br />
insurance professionals, including<br />
licensed agents and-adjusters, as well as<br />
company staff and personnel. Moreover,<br />
program participation rates are in excess<br />
of 80 percent of total acres, much of this<br />
acreage covered at the 70 percent level.<br />
The current drought and political climate<br />
puts an enormous spotlight on the<br />
agricultural safety net, and crop insurance<br />
in particular. The crop insurance<br />
industry will be tested on all levels; operationally,<br />
financially, and politically. Our<br />
critics should reflect, however, the industry<br />
has always responded positively and<br />
adapted well. Over time, the industry has<br />
taken on increasing levels of risk.<br />
Currently, 80 percent of the premium and<br />
85 percent of the liability in the business<br />
is privately insured. Over time, the industry<br />
delivery system has become more<br />
efficient. In the early years of the program,<br />
delivery expense as a percent of<br />
premiums written was in excess of 30<br />
percent. Today, delivery expense is less<br />
than 15 percent of premiums. In 1988,<br />
approximately 56 million acres were<br />
insured. In 2011, approximately 266 million<br />
acres were insured.<br />
Critics of the program insist crop<br />
insurance is disaster aid. But, no. <strong>Crop</strong><br />
insurance is risk management at the farm<br />
level and with respect to agricultural policy.<br />
At the farm level, farmers make<br />
deliberate risk management decisions<br />
with their licensed crop insurance agent<br />
as to the level of coverage and the type<br />
of insurance product. Not so with disaster<br />
aid, where assistance is after the fact<br />
and out of farmers’ control. Farmers<br />
share in the premium cost of their decisions.<br />
Not so with disaster aid, which is<br />
all borne by the taxpayer.<br />
With respect to agricultural policy, the<br />
USDA, working together with private<br />
insurance companies, manage the<br />
nation’s agricultural risk through a reinsurance<br />
agreement, in which both the<br />
private and public sectors share in the<br />
risk of the agricultural sector. By utilizing<br />
the private sector crop insurance agency<br />
force, sales of crop insurance are incentivized<br />
encouraging higher levels of participation<br />
and improving actuarial performance<br />
over the long haul. By utilizing<br />
professionally trained loss adjusters, we<br />
are assured that crop losses are paid uniformly,<br />
accurately and in a timely manner.<br />
Given what I have just described, I<br />
simply fail to see how crop insurance can<br />
be considered a disaster program. Rather,<br />
the disaster is that critics of crop insurance<br />
choose to ignore the essential<br />
strengths of the program, and the overall<br />
public sector benefit in providing financial<br />
stability to agriculture, rural areas and<br />
consumers.<br />
We Should Never Fail to<br />
Learn From Our Past<br />
George Santayana is quoted as saying,<br />
“Those that fail to learn from history are<br />
doomed to repeat it.”<br />
Taken as a whole, we can<br />
view these as positive<br />
developments for farmers<br />
and taxpayers. Having said<br />
that, it is important to keep<br />
learning from our past,<br />
learning from our mistakes<br />
and keep moving in a<br />
positive direction.<br />
Agricultural policy and crop insurance<br />
continue to follow a series of natural progressions.<br />
In general, we can observe that<br />
overall federal outlays for agricultural<br />
support have been declining in real terms<br />
over time. Moreover, we find a progression<br />
in policy, moving from more to less<br />
direct income support, greater market orientation,<br />
and more reliance on agricultural<br />
risk management in the form of crop<br />
insurance versus direct income support<br />
programs. Taken as a whole, we can view<br />
these as positive developments for farmers<br />
and taxpayers. Having said that, it is<br />
CROP INSURANCE TODAY ® 27
important to keep learning from our past,<br />
learning from our mistakes and keep<br />
moving in a positive direction. According<br />
to a Congressional Research Service<br />
study, there have been 42 individual<br />
pieces of supplemental disaster legislation<br />
with $70 billion in taxpayer outlays<br />
since 1989. Due to Congressional action<br />
in 1994 and 2000, we have seen the<br />
development of the modern crop insurance<br />
program. Years such as 1988, 1993,<br />
and <strong>2012</strong> are teachable moments. We<br />
have an opportunity to learn from our<br />
past in order to improve our policies for<br />
the future.<br />
Our mettle will be sorely tested in the<br />
coming months as we face what is, the<br />
challenge of the drought conditions of<br />
<strong>2012</strong>, the uncertainty regarding Farm Bill<br />
deliberations, and the continued and<br />
increasing demands on our agricultural<br />
productive capacity. As we confront what<br />
is, we must also confront what should<br />
never be. Opportunism by some in the<br />
face of hardship of others and the possible<br />
inclination to revert to policies of the<br />
past did not succeed then, and will not<br />
succeed now.<br />
The Final What Is<br />
What is true is that within the publicprivate<br />
partnership there will always be a<br />
political dimension; it is the reality of any<br />
system that enlists taxpayers’ dollars and<br />
political support. What should never be is<br />
politics trumping or subverting the safety<br />
net for the American farmer, or a stable<br />
and safe food supply for the American<br />
people, and those that depend on our ability<br />
to export. What should never be is a<br />
return to the vagaries of disaster relief policies<br />
that leaves the American farmer, businesses,<br />
and the American taxpayer always<br />
at the mercy of the politics of the moment.<br />
Because we have built a crop insurance<br />
program that is characterized by<br />
wide-scale farmer participation, and<br />
builds on the strengths of both the private<br />
and public sectors, farmers can know<br />
their insurance claims will be covered.<br />
Taxpayers can know they will not be<br />
expected to bear the entire burden of<br />
weather and market disasters in agriculture.<br />
Lastly, we can all know agriculture<br />
will be ready and in a position to meet<br />
the demands placed upon it for the years<br />
ahead. That is As It Should Be.<br />
In this issue you will find articles relating<br />
to the industry’s rate of return; NCIS’<br />
work with RMA to help educate limited<br />
resource and socially disadvantaged farmers<br />
about crop insurance and risk management<br />
tools available for them; and an<br />
in-depth look at the specialty crops insurance<br />
coverage through the federal crop<br />
insurance program.<br />
28 AUGUST <strong>2012</strong>
Providing the claim service your policyholders deserve.<br />
e.<br />
A hail storm devastated southern Minnesota on June 19, <strong>2012</strong>.<br />
On the morning of June 20, FMH adjusters were on the scene to<br />
service policyholder claims.<br />
“My fields were badly damaged in the storm, but FMH adjusters<br />
were here right away. My father always carried FMH insurance<br />
because they are consistent and professional. Now I do too.”<br />
Brian Pettis, Policyholder<br />
Securing Success for America’s Farmer Since 1893®<br />
www.fmh.com<br />
Aftermath of the June 19, <strong>2012</strong> hail storm that hit southern Minnesota.<br />
Farmers Mutual Hail <strong>Insurance</strong> Company of Iowa is an equal opportunity provider and prohibits discrimination in all its programs<br />
and activities. © <strong>2012</strong> Farmers Mutual Hail <strong>Insurance</strong> Company of Iowa. All rights reserved.
TODAYcrop insurance<br />
NCIS<br />
Adjuster Training<br />
in Full Swing<br />
The gentleman standing in the back of the<br />
pickup is the apricot grower who allowed<br />
adjusters to utilize his orchards for hands-on<br />
training. Here he is describing his management<br />
practices and growth characteristics of<br />
the apricots. Also discussed were perils that<br />
could cause a loss, such as hail, early frost, etc.<br />
NCIS Schools<br />
Each year during the growing season,<br />
and all across the U.S., NCIS conducts<br />
classroom and hands-on field training for<br />
loss adjusters. The schools, which cover a<br />
wide variety of crops, are important<br />
because they ensure that all adjusters are<br />
trained on industry approved loss procedures.<br />
This provides consistency among all<br />
companies and assures farmers that their<br />
losses are adjusted accurately and fairly.<br />
The schools are run through the NCIS<br />
Regional/State Committees, and we can’t<br />
thank them enough for their commitment<br />
to the educational process and in providing<br />
their time and energy to ensure each<br />
school is successful.<br />
NCIS <strong>2012</strong> School/Field Day Schedule<br />
Date School Location<br />
June 12-13 <strong>Crop</strong>-Hail Wheat and Corn Columbia, Missouri<br />
June 19-20<br />
<strong>Crop</strong>-Hail & MPCI Dry Peas,<br />
Lentils & Small Grains<br />
Moccasin, Montana<br />
June27-28 Blueberry & Stonefruit Kennewick, Washington<br />
July 12<br />
<strong>Crop</strong>-Hail Corn, Soybeans &<br />
Oats/MPCI Forage<br />
Bereford, South Dakota<br />
MPCI Florida Citrus Fruit,<br />
July 17-18 Fresh Market Sweet Corn & Kissimmee, Flordia<br />
Fresh Market Tomato<br />
July 23 New Adjuster Fargo, North Dakota<br />
July 24 <strong>Crop</strong>-Hail Fargo, North Dakota<br />
July 25 MPCI Fargo, North Dakota<br />
July 25-26<br />
<strong>Crop</strong>-Hail Corn & Soyben<br />
Field Day/Wheat Classroom<br />
Champaign, Illinois<br />
<strong>August</strong> TBA Kansas<br />
<strong>August</strong> 1-2 <strong>Crop</strong>-Hail Soybean & Corn Ames, Iowa<br />
<strong>August</strong> 1 New Adjuster Lamberton, Minnesota<br />
<strong>August</strong> 2 Experienced Adjusters Lamberton, Minnesota<br />
<strong>August</strong> 7<br />
<strong>August</strong> 14-15<br />
<strong>August</strong> 28-29<br />
MPCI & <strong>Crop</strong>-Hail Corn<br />
Advanced <strong>Crop</strong>ping<br />
MPCI & <strong>Crop</strong>-Hail Sunflower<br />
Advanced <strong>Crop</strong>ping<br />
<strong>Crop</strong>-Hail & MPCI Cotton &<br />
Grain Sorghum<br />
Huntley, Montana<br />
Scottsbluff, Nebraska<br />
Lubbock, Texas<br />
30 AUGUST <strong>2012</strong>
Adjusters at the Blueberry and Stonefruit<br />
School/Field Day pick blueberries from<br />
four consecutive plants for hand-harvested<br />
appraisals (also cover photo).<br />
Participants at the Columbia, Missouri, <strong>Crop</strong>-Hail<br />
Wheat and Corn School count missing kernels in<br />
wheat for the shatter method appraisal.<br />
CROP ANALYSIS SERVICES<br />
Complete analytical testing services with quick and accurate results available online 24/7<br />
Pesticide residue testing for soil, crops and produce<br />
<br />
Plant analysis for fertility<br />
Quality system with documentation and validation<br />
SGS NORTH AMERICA<br />
241 34th Avenue, Brookings SD 57006<br />
P: 877-692-7611 ext. 5; F: 605-692-5908<br />
E: analytical.brookings@sgs.com<br />
www.sgs.com/us-pesticideresidue<br />
SGS IS THE WORLD’S LEADING INSPECTION, VERIFICATION, TESTING AND CERTIFICATION COMPANY<br />
CROP INSURANCE TODAY 31
TODAYcrop insurance<br />
Industry Support of FFA<br />
For almost 20 years, NCIS, on behalf of<br />
its member companies, has given financial<br />
support to the <strong>National</strong> FFA Organization.<br />
Along with additional support directly<br />
from private insurance companies in the<br />
form of scholarships and proficiency<br />
award support, the crop insurance industry<br />
has given hundreds of thousands of dollars<br />
to support agriculture education throughout<br />
the United States. In addition, NCIS<br />
staff and others from the crop insurance<br />
companies serve as judges for the <strong>National</strong><br />
Proficiency Awards at the annual FFA<br />
Convention. The award co-sponsored by<br />
NCIS is the Diversified <strong>Crop</strong> Production-<br />
Placement Award.<br />
Judging requires reviewing the four<br />
finalist’s documentation of their respective<br />
Supervised Agriculture Experiences (SAE)<br />
prior to the convention, and once there,<br />
interviewing each candidate to determine<br />
the scope of their knowledge and skills<br />
they have learned while completing their<br />
four year project. SAEs include activities<br />
such as starting a business or working for<br />
an established company. Classroom learning<br />
and SAEs are further reinforced<br />
through curriculum-enhancing programs<br />
within the community.<br />
“It’s a great opportunity to see agriculture<br />
first-hand in the lives of high school<br />
students from all across the country,” said<br />
Laurie Langstraat, NCIS. “I’m always<br />
impressed with their skill level and passion<br />
for working in agriculture.”<br />
Each year NCIS receives dozens of thank you notes from students who receive the<br />
Diversified <strong>Crop</strong> Production - Placement Awards at the state and regional levels. Here<br />
are a few of them . . .<br />
“I just wanted to take a moment to express my sincere gratitude for your generous<br />
recognition of my excellence in the area of diversified crop production. Over the<br />
past four years, working in itself has been a blessing helping me to develop a great<br />
work ethic, people skills, initiative, and develop myself as an individual in general.<br />
However, being recognized for what is considered my job or an everyday thing is<br />
quite a bonus and something my family is very proud of and for that I thank you. I<br />
appreciate the positive influence you are having on agriculture. On behalf of any<br />
other student you have and will award, I thank you.”<br />
—R. Martin, New Milford, Connecticut<br />
“Thanks for your sponsorship of the Diversified <strong>Crop</strong> Production Proficiency<br />
Award. As a state winner, I am very grateful for your support and sponsorship of FFA.<br />
Your financial support will assist me with my future educational endeavors. Your support<br />
of FFA is greatly appreciated and I hope you will continue supporting the FFA<br />
through students like me.”<br />
—B. Hollier, Arnaudville, Louisiana<br />
“I am A. Ariail and I won 1st place in the Diversified <strong>Crop</strong> Production. I just want<br />
to thank you for helping out in this act of kindness. This will help me in so many ways.<br />
Again, thank you.”<br />
—A. Ariail, Carnesville, Georgia<br />
32 AUGUST <strong>2012</strong>
What is the <strong>National</strong> FFA Organization?<br />
FFA is a positive example of what works in education. The<br />
<strong>National</strong> FFA Organization is a dynamic youth organization that<br />
changes lives and prepares students for premier leadership, personal<br />
growth, and career success. More than a half-million student<br />
members are engaged in a wide range of agricultural education<br />
activities, leading to more than 300 professional career opportunities.<br />
Student success remains the primary mission of FFA.<br />
How Does FFA Make an Impact?<br />
FFA uses agricultural education to create real-world success.<br />
Agriculture teachers become advisors to local FFA chapters, which<br />
students join. There are currently more than 7,000 FFA chapters in<br />
existence; their programs are managed on a local, state and national<br />
level. Each chapter’s Program of Activities is designed with the<br />
needs of the students in mind. Activities vary greatly from school to<br />
school, but are based on a well-integrated curriculum. Chapter<br />
activities and FFA programs concentrate on three areas of the FFA<br />
mission: premier leadership, personal growth, and career success.<br />
“TWI makes sense.<br />
We pay for our weather<br />
if it is good, and get<br />
compensated if it isn’t.<br />
It takes risk out of<br />
the equation.”<br />
Keith Schmidt (left)<br />
TWI 2011 and <strong>2012</strong> Insured<br />
Pictured with son Jeff<br />
Offer Total Weather <strong>Insurance</strong> SM<br />
TWI lets your clients lock in profits<br />
by insuring against key weather<br />
perils that can cause yield shortfalls.<br />
TWI complements federal crop<br />
insurance, differentiates your<br />
offerings, and grows your business.<br />
To learn more about becoming<br />
a TWI agent, visit<br />
climate.com/agents<br />
or call 888.924.7475<br />
© <strong>2012</strong> The Climate Corporation All Rights Reserved. Policies underwritten by State<br />
<strong>National</strong> <strong>Insurance</strong> Company, Inc. and administered by The Climate <strong>Insurance</strong> Agency LLC.<br />
CROP INSURANCE TODAY 33
TODAYcrop insurance<br />
<strong>Crop</strong> <strong>Insurance</strong> &<br />
Specialty <strong>Crop</strong>s<br />
By Keith Collins, NCIS<br />
This article provides a brief examination<br />
of how well crop insurance is providing<br />
coverage for specialty crops. The role<br />
of specialty crops in the farm economy is<br />
identified, trends in crop insurance coverage<br />
for specialty crops are presented using<br />
a series of tables and graphs and challenges<br />
facing the crop insurance industry<br />
in product development and sales for specialty<br />
crops are discussed. While a number<br />
of small-acreage specialty crops remain<br />
uninsurable, and continuing efforts are<br />
needed to improve availability and coverage<br />
levels, crop insurance is available for a<br />
wide variety of specialty crops and participation<br />
is generally high.<br />
Growing Focus on<br />
Specialty <strong>Crop</strong>s<br />
Specialty crops have garnered enormous<br />
attention in agriculture policy development<br />
in recent years, with the current<br />
Farm Bill (the Food, Conservation, and<br />
Energy Act of 2008, or 2008 Farm Bill) containing<br />
the first-ever title for specialty crops<br />
(Title X. Horticulture and Organic<br />
Agriculture). The interest stems from many<br />
interrelated factors, starting with diet and<br />
health concerns and including such varied<br />
elements as the increase in obesity, rapid<br />
growth in organic production, interest in<br />
local food production and the rise of farmers’<br />
markets. The policy focus has been on<br />
addressing producer needs, such as technical<br />
trade assistance, providing block grants<br />
to improve competitiveness, expanding<br />
Table 1.<br />
research, and on increasing demand<br />
through various food programs.<br />
The effectiveness of crop insurance for<br />
specialty crops has also been under review.<br />
For example, the 2002 Farm Bill (Section<br />
10006 of the Farm Security and Rural<br />
Investment Act of 2002) directed USDA to<br />
conduct a study of crop insurance and specialty<br />
crops, which was completed in May<br />
2004 (Report on Specialty <strong>Crop</strong> <strong>Insurance</strong>).<br />
USDA has also been required to report to<br />
Congress on the progress in covering new<br />
and specialty crops (Section 508(a)(6)(B) of<br />
the Federal <strong>Crop</strong> <strong>Insurance</strong> Act). In<br />
response to this requirement the Federal<br />
<strong>Crop</strong> <strong>Insurance</strong> Corporation published in<br />
November 2010, Report to Congress:<br />
Specialty <strong>Crop</strong> Report.<br />
The Senate-passed version of the <strong>2012</strong><br />
Farm Bill (the Agriculture Reform, Food,<br />
and Jobs Act of <strong>2012</strong>) continues the interest<br />
in specialty crop coverage. For example,<br />
Section 11015 of the bill would make<br />
new product proposals offered under<br />
Section 508(h) of the Federal <strong>Crop</strong><br />
<strong>Insurance</strong> Act eligible for additional<br />
advance funding if the products are for<br />
“under-served agricultural commodities,<br />
including...specialty crops.” The bill also<br />
calls for development of a Whole Farm<br />
Diversified Risk Management <strong>Insurance</strong><br />
Plan for selected specified products,<br />
including specialty crops (Section 11016),<br />
makes both research and financial benchmarking<br />
for specialty crop products a priority<br />
(Sections 11019 and 11022, respectively)<br />
and includes some other initiatives<br />
identified in the last section of this article.<br />
What is a Specialty<br />
<strong>Crop</strong>?<br />
When USDA released its 2004 specialty<br />
crop report, it defined specialty crops using<br />
a definition in the Agricultural Economic<br />
Specialty <strong>Crop</strong>s in U.S. Farm Cash Receipts for <strong>Crop</strong>s<br />
Cash Receipts, % of Cash Receipts, % of<br />
2000 Total 2010 Total<br />
(bil $) (bil $)<br />
Fruits & Nuts 12.3 13.3 21.5 12.3<br />
Vegetables & Melons 15.8 17.1 19.9 11.4<br />
Greenhouse & Nursery 13.7 14.8 15.6 8.9<br />
Grains & Feed <strong>Crop</strong>s 27.1 29.3 66.4 37.9<br />
Oil <strong>Crop</strong>s 13.5 14.6 35.1 20.1<br />
Cotton, Tobacco, Other 10.1 10.9 16.5 9.4<br />
Total <strong>Crop</strong>s 92.5 100.0 175.0 100.0<br />
Source: Economic Research Service, USDA, farm income database.<br />
CROP INSURANCE TODAY 35
Assistance Act of 2001, which was “any<br />
agricultural crop, except wheat, feed grains,<br />
oilseeds, cotton, rice, peanuts, and tobacco”<br />
(Report on Specialty <strong>Crop</strong> <strong>Insurance</strong>, p.<br />
viii). The Specialty <strong>Crop</strong>s Competitiveness<br />
Act of 2004 narrowed the definition for various<br />
Federal programs, and its definition<br />
remains current today for some programs.<br />
However, for the Specialty <strong>Crop</strong> Block<br />
Grant Program, the 2008 Farm Bill added<br />
the word “horticulture” to the definition,<br />
making its definition of specialty crops<br />
“fruits and vegetables, tree nuts, dried fruits,<br />
horticulture, and nursery crops (including<br />
floriculture)” (Section 10109 of the 2008<br />
Farm Bill). In this article, specialty crops are<br />
considered fruits, vegetables, tree nuts, melons<br />
and nursery. Even with this definition,<br />
there are difficulties in assigning specific<br />
crops to each category and different analysts<br />
may make different decisions.<br />
Role of Specialty <strong>Crop</strong>s<br />
in the Farm Economy<br />
The value of U.S. farm cash receipts<br />
from the sale of fruits, nuts, vegetables,<br />
melons, greenhouse and nursery in 2010<br />
was $57 billion, up from $42 billion in 2000<br />
(Table 1). These crops now account for<br />
one-third of the cash receipts of all U.S.<br />
crops, thus presenting a significant opportunity<br />
for the sale of crop insurance. Their<br />
share of cash receipts has declined since<br />
2000, primarily because of the significant<br />
increase in the price of field crops due to<br />
strong foreign food demand and demand<br />
for crops to be used in energy production.<br />
The geographic distribution of fruit and<br />
vegetable acreage is illustrated in Figures 1<br />
and 2. Orchards, such as citrus, are heavily<br />
concentrated in the west coast states and<br />
across the south and southeast. There is<br />
also varied production in the northeast,<br />
especially apples. Vegetable acreage is similarly<br />
concentrated in the west coast states,<br />
the southeast and northeast. However,<br />
there is also considerable acreage in the<br />
northern corn belt states. The value of<br />
nursery production, not illustrated, is similarly<br />
distributed to vegetable acreage, however,<br />
it is much more widespread nationally,<br />
showing significant acreage through the<br />
midwest and southwest, such as in<br />
Colorado and New Mexico.<br />
Figure 1. Total Acres in Orchards, 2007<br />
0 100<br />
Miles<br />
0 100<br />
Miles<br />
Role of Specialty <strong>Crop</strong>s<br />
in <strong>Crop</strong> <strong>Insurance</strong><br />
Table 2 shows the share of specialty<br />
crops in total U.S. farm cash receipts for<br />
crops in 2011, compared with the share of<br />
specialty crops in total crop insurance premiums<br />
for the 2011 crops. The data indicate<br />
that major field crops, such as corn,<br />
0 100<br />
Miles<br />
1 Dot = 1,000 Acres<br />
United States Total - 5,039,476<br />
07-M233, U.S. Department of Agriculture. <strong>National</strong> Agricultural Statistics Service<br />
Figure 2. Total Acres in Vegetables, 2007<br />
0 100<br />
Miles<br />
0 100<br />
Miles<br />
0 100<br />
Miles<br />
1 Dot = 1,000 Acres<br />
United States Total - 4,682,588<br />
07-M233, U.S. Department of Agriculture. <strong>National</strong> Agricultural Statistics Service<br />
soybeans, wheat and cotton, have a higher<br />
share in total premiums than in U.S.<br />
cash receipts, while specialty crops<br />
account for a smaller portion of crop insurance<br />
premiums than of U.S. farm cash<br />
receipts. In 2011—excluding nursery—<br />
fruits, nuts, vegetables and melons<br />
accounted for nearly 22 percent of cash<br />
36 AUGUST <strong>2012</strong>
Table 2.<br />
Specialty <strong>Crop</strong>s in U.S. Farm Cash Receipts and<br />
<strong>Crop</strong> <strong>Insurance</strong>, 2011<br />
Cash Receipts, % of <strong>Crop</strong> <strong>Insurance</strong> % of<br />
<strong>Crop</strong> 2011 Est. Total Premiums, 2011 Total<br />
(bil $) (bil $)<br />
Fruits & Nuts 22.2 11.3 0.35 2.9<br />
Vegetables & Melons 20.9 10.6 0.24 2.0<br />
Corn 58.8 29.9 4.76 39.8<br />
Soybeans 33.9 17.2 2.62 21.9<br />
Wheat 13.9 7.1 1.80 15.1<br />
Up. Cotton 8.0 4.1 1.21 10.1<br />
Other <strong>Crop</strong>s 39.2 19.9 0.99 8.3<br />
Total <strong>Crop</strong>s 196.9 100.0 11.97 100.0<br />
Source: Economic Research Service, USDA, farm income database; greenhouse & nursery cash<br />
receipts not reported separately for 2011 and are included in “Other <strong>Crop</strong>s.” Premium data<br />
from RMA’s Summary of Business.<br />
receipts but only about five percent of crop<br />
insurance premiums. While this disproportionate<br />
share of premiums mainly reflects<br />
lower participation and coverage levels as<br />
discussed next, there are some additional<br />
comparisons that favor specialty crops.<br />
One comparison of interest is acreage<br />
enrolled in crop insurance and the liability<br />
insured under the program (Figure<br />
3). In aggregating enrolled acres in specialty<br />
crops, no acreage is available for<br />
crops enrolled in AGR and AGR-Lite<br />
plans of insurance, and no acreage is<br />
reported for the nursery plan of insurance.<br />
For simplicity, this article assumes<br />
crops covered under AGR and AGR-Lite<br />
Figure 3. Specialty <strong>Crop</strong>s in <strong>Crop</strong> <strong>Insurance</strong>, 2011<br />
Mil. Ac. or Bil. $<br />
300<br />
250<br />
200<br />
150<br />
100<br />
50<br />
0<br />
Insured Acres<br />
3% share<br />
˜ ˜<br />
are all specialty crops. Specialty crops<br />
accounted for about 6.8 million insured<br />
acres in 2011, about 2.6 percent of total<br />
insured acres. But specialty crops<br />
accounted for about $11.8 billion in<br />
insured liability, about 10.3 percent of<br />
2011’s total insured liability of $114.2 billion.<br />
This much higher share of liability<br />
is due to the high value per acre of specialty<br />
crops. The average liability per<br />
acre of all insured crops in the United<br />
States in 2011 was $430, but the average<br />
liability of specialty crops was over<br />
$1,730 per acre (including $2,155 per<br />
acre for fruits and nuts and $675 per acre<br />
for vegetables and melons).<br />
Liability<br />
Source: Aggregated from RMA’s Summary of Business.<br />
10% share<br />
All <strong>Crop</strong>s<br />
Specialty <strong>Crop</strong>s<br />
The insured liability of specialty crops<br />
has trended up over the past decade,<br />
reflecting the growth in production and<br />
consumption (Figure 4). Liability has<br />
increased from less than $8 billion in 2000<br />
to nearly $12.7 billion in 2009. However<br />
coverage declined the past two years,<br />
falling to about $11.8 billion by 2011.<br />
Coverage of fruits and nuts has shown the<br />
strongest growth, rising in both 2010 and<br />
2011. Coverage of vegetables and melons<br />
and AGR and AGR-Lite have also shown<br />
steady increases until 2011, when both categories<br />
declined slightly. Nursery accounts<br />
for most of the overall decline in liability in<br />
2010 and 2011. Nursery coverage is primarily<br />
for wholesale nurseries and was affected<br />
by the sharp financial downturn in 2009<br />
and the decline in housing construction<br />
and sales. In addition, nursery insurance<br />
involves substantial inventory record keeping,<br />
and complexity has been cited by<br />
some producers as a contributing factor in<br />
lower participation.<br />
A concern sometimes expressed about<br />
specialty crop insurance is that coverage<br />
levels are low relative to major field crops.<br />
One way to assess that issue is to examine<br />
the premium and enrolled acres for specialty<br />
crops insured under CAT (Catastrophic<br />
Coverage, the lowest level of coverage<br />
which protects 50 percent of yield at 55 percent<br />
of price) as a share of total premium<br />
and enrolled acres. The specialty crop<br />
shares can then be compared with CAT participation<br />
of all crops. Figure 5 presents<br />
those comparisons for 2011. For all U.S.<br />
insured crops, only 2.4 percent of total premium<br />
and a little over seven percent of total<br />
insured acreage was enrolled in CAT.<br />
Breaking down specialty crops into its<br />
components, 12 percent of the total vegetables<br />
and melons premium and 21 percent<br />
of acreage was in CAT. These levels are<br />
higher than the levels of all crops, but are<br />
not excessive and suggest generally high<br />
coverage levels for vegetables and melons.<br />
However, for fruits and nuts, nearly 20 percent<br />
of total fruits and nuts premium and<br />
46 percent of acreage was in CAT. These<br />
data indicate much lower purchases of<br />
buy-up coverage for fruits and nuts producers<br />
than for producers of vegetables or<br />
the major field crops. For nursery, an even<br />
CROP INSURANCE TODAY ® 37
Figure 4. Insured Liability of Specialty <strong>Crop</strong>s<br />
Bil. $ in Liability<br />
AGR Vegetables & Melons Nursery Fruits & Nuts<br />
14<br />
12<br />
10<br />
8<br />
6<br />
4<br />
2<br />
0<br />
2000 2001 2002 2003 2004 2005 2006 2007 2008 2009 2010 2011<br />
Source: 2001-2008 from RMA’s Report to Congress: Specialty <strong>Crop</strong> Report, Nov. 2010; 2009-<br />
2011 aggregated from RMA’s Summary of Business.<br />
higher 50 percent of premium is at the CAT<br />
level of coverage, far above the U.S. average<br />
for all crops. Since acreage data is not<br />
relevant for nurseries, no acreage comparison<br />
is available.<br />
A point to be made about the relatively<br />
higher use of CAT and lower use of buyup<br />
by specialty crop producers is that<br />
lower coverage levels, and lower participation<br />
for that matter, do not necessarily indicate<br />
a problem with crop insurance or that<br />
crop insurance is not working well. For<br />
Figure 5. Coverage Levels: CAT versus Buy-up, 2011<br />
100<br />
80<br />
60<br />
40<br />
20<br />
0<br />
Share of Premium<br />
CAT Buy-up<br />
Nursery<br />
Fruits & Nuts<br />
Veg. & Melons<br />
All <strong>Crop</strong>s<br />
example, for specialty crops in the west or<br />
the south, weather may be better than in<br />
other areas, irrigation may be heavily used,<br />
producers may be highly diversified and<br />
plant multiple crops in a calendar year and<br />
planting dates may be flexible, so that yield<br />
risk may be less important than it is for<br />
other crops and regions. In addition, much<br />
of the price risk for some specialty crops<br />
may be offset using contracts with handlers<br />
or processors. Some of the key risks some<br />
farms or crops face may not be related to<br />
100<br />
80<br />
60<br />
40<br />
20<br />
Source: Aggregated from RMA’s Summary of Business.<br />
0<br />
Share of Acres<br />
CAT Buy-up<br />
NA<br />
Nursery<br />
Fruits & Nuts<br />
Veg. & Melons<br />
All <strong>Crop</strong>s<br />
natural disasters or price. Consequently, if<br />
a producer chooses not to participate in<br />
crop insurance, or to participate at low<br />
coverage levels, that may be an optimal<br />
decision for the producer and not represent<br />
a deficiency in crop insurance.<br />
Participation in crop insurance varies<br />
widely among individual specialty crops.<br />
Participation is measured as acres enrolled<br />
in the program as a share of total acres<br />
planted (for vegetables and melons) or<br />
bearing acres (for orchards for fruit and<br />
nut production). The planted and bearing<br />
acreage data are from USDA’s <strong>National</strong><br />
Agricultural Statistics Service (NASS) and<br />
may overstate the acres eligible for crop<br />
insurance coverage. Figure 6 shows the<br />
enrolled acreage of principal insured specialty<br />
crops as a share of planted or bearing<br />
acres in 2011. The participation rates<br />
range from three percent for fresh beans<br />
(2011 is the first year of coverage for fresh<br />
beans) to over 95 percent for dry peas and<br />
beans. Overall, insurable specialty crops<br />
enrolled 75 percent of their planted or<br />
bearing acres in crop insurance in 2011.<br />
While this participation level is below the<br />
84 percent of U.S. principal crop acres<br />
enrolled in crop insurance in 2011, it nevertheless<br />
represents a high level of participation.<br />
While insurable specialty crops are<br />
well represented in crop insurance, there<br />
are specialty crops that do not have insurance<br />
available, and overall program participation<br />
would be reduced, if the<br />
acreage of these crops was considered in<br />
estimating participation. Table 3 presents<br />
specialty crops whose acreage is reported<br />
by NASS and that did not have crop insurance<br />
available in 2011. The table shows<br />
the reported level of acreage planted or<br />
bearing acreage in 2011 for each crop.<br />
Some of these crops had crop insurance<br />
available at some point in the past, such<br />
as processing cucumbers, raspberries and<br />
watermelons, and some will have policies<br />
available for the first time in <strong>2012</strong>, such as<br />
olives and pistachios. Just because there<br />
are crops that do not have insurance<br />
available does not mean that immediate<br />
efforts should be made to implement new<br />
policies for these crops. Many issues must<br />
be considered to determine the efficacy<br />
38 AUGUST <strong>2012</strong>
of a new crop insurance product introduction<br />
and these issues are discussed in<br />
the next section.<br />
Challenges in Expanding<br />
<strong>Insurance</strong> Coverage for<br />
Specialty <strong>Crop</strong>s<br />
Developing, improving and expanding<br />
specialty crop insurance faces special challenges.<br />
These challenges explain why<br />
some specialty crops are not insurable,<br />
their plans of insurance and coverage levels<br />
are often limited, and participation levels<br />
are lower than for major field crops.<br />
Here are some key issues that must be<br />
addressed:<br />
* Small acreages. Many specialty crops<br />
have small levels of acreage. Small<br />
acreage and production means the<br />
potential market for selling crop insurance<br />
is also small. This reduced marketability<br />
reduces the sales incentive. In<br />
addition, since delivery costs and agent<br />
commissions are based on the premium<br />
earned by sale of the policy, small<br />
acreage means small premium, thus the<br />
cost of selling and servicing that policy<br />
may exceed the income to the company<br />
and agent from the sale. Small<br />
acreages also affect the overall costs<br />
and benefits of developing and approving<br />
a new policy for sale. Any new policy<br />
comes with substantial variable and<br />
overhead costs, including development<br />
of underwriting standards and actuarial<br />
ratings, IT development, agent and<br />
company training and sales and marketing.<br />
If the potential market is very small,<br />
the benefits of developing and selling<br />
the product may fall short of the costs.<br />
* Complex farming practices. While<br />
farming methods are similar for major<br />
field crops that occupy tens of millions<br />
of acres, practices for many specialty<br />
crops are unique and vary from crop to<br />
crop. For example, some crops may<br />
need to be planted in raised beds, use<br />
plastic, or have stringent requirements<br />
for crop rotations, inter-planting, row<br />
width, etc. These practices must be<br />
known and their effects on yields must<br />
be understood. These practices are the<br />
basis for establishing the required good<br />
farming practices and underwriting<br />
Percent<br />
Figure 6. Specialty <strong>Crop</strong>s: Insured Share of Planted or<br />
Bearing Acres, 2011<br />
100<br />
90<br />
80<br />
70<br />
60<br />
50<br />
40<br />
30<br />
20<br />
10<br />
0<br />
Citrus Fruit<br />
Almonds<br />
Cranberries<br />
Macadamia Nuts<br />
Potatoes<br />
Dry Beans & Peas<br />
Tomatoes, Processing<br />
Prunes<br />
Table Grapes<br />
Blueberries<br />
Dry Beans<br />
All Insurable Specialty<br />
Cherries<br />
Apples<br />
standards that determine what is insurable.<br />
In addition, the complexity of<br />
valuing production has led to complex<br />
products such as AGR, AGR-Lite and the<br />
nursery plan of insurance, which discourage<br />
some producers from buying<br />
coverage. The Senate-passed <strong>2012</strong> Farm<br />
Bill seeks to create a simpler whole<br />
farm insurance product to mitigate<br />
Plums<br />
Peaches<br />
Figs<br />
Avocados<br />
Nectarines<br />
Sweet Corn<br />
Grapes<br />
Onions 1/<br />
Pears<br />
Apricots<br />
Walnuts<br />
Tomatoes, Fresh<br />
Pumpkins 1/<br />
Chile Peppers 1/<br />
Peppers 1/<br />
Sweet Potatoes<br />
Fresh Beans, Snap<br />
Processing Beans<br />
Cabbage<br />
Fresh Sweet Corn<br />
1/ Includes fresh and processing.<br />
Source: RMA’s Summary of Business and USDA/ NASS <strong>Crop</strong> Production 2011 Summary,<br />
Vegetables 2011 Summary, Citrus 2011 Summary and Non-Citrus Fruit and Nuts 2011 Summary.<br />
Table 3.<br />
some of these concerns (Section 11016).<br />
* Loss adjustment. Determining losses is<br />
a very complex task. Much research<br />
must be conducted to provide loss<br />
adjusters with the tools needed to accurately<br />
assess the effects of weather on<br />
crop production. Highly varied crops,<br />
varieties, perennial trees, etc. add to the<br />
difficulty and costs in establishing loss<br />
Uninsurable Specialty <strong>Crop</strong>s in 2011 and NASS 2011 Acreage<br />
<strong>Crop</strong> Acres <strong>Crop</strong> Acres<br />
Carrots, processing 12,790 Squash 1/ 50,200<br />
Cucumbers, processing 85,000 Watermelons, fresh 138,600<br />
Spinach, processing 10,200 Blackberries 7,300<br />
Artichokes 1/ 7,400 Boysenberries 500<br />
Asparagus 1/ 28,900 Raspberries 17,500<br />
Broccoli 1/ 133,300 Strawberries 58,660<br />
Cantaloupes, fresh 72,590 Tart cherries 36,000<br />
Carrots, fresh 75,400 Dates 8,200<br />
Cauliflower 1/ 37,680 Guavas 110<br />
Celery 1/ 28,700 Kiwi fruit 4,200<br />
Cucumbers, fresh 42,850 Olives 41,500<br />
Garlic 1/ 25,650 Papayas 1,300<br />
Honeydews, fresh 14,750 Hazelnuts 29,500<br />
Lettuce, fresh 273,000 Pistachios 153,000<br />
Spinach, fresh 35,700 Total 1,157.480<br />
1/ Includes fresh and processing.<br />
Source: NASS Vegetables 2011 Summary and Non-citrus Fruits and Nuts 2011 Summary.<br />
CROP INSURANCE TODAY ® 39
adjustment standards for specialty<br />
crops. Understanding, measuring, valuing<br />
and insuring quality losses are also<br />
major challenges.<br />
While there are numerous<br />
challenges in designing,<br />
selling and servicing specialty<br />
crop insurance compared with<br />
more homogeneous, largeacreage<br />
field crops, excellent<br />
progress has been made in<br />
expanding coverage and<br />
participation for specialty crops.<br />
* Price discovery. For many specialty<br />
crops, the only plan of insurance available<br />
is Actual Production History<br />
(APH). Some producers would like<br />
revenue insurance such as the<br />
Revenue Protection (RP) plan of insurance.<br />
However, revenue plans that<br />
guarantee expected revenue require<br />
forecasted prices that are transparently<br />
and appropriately determined. Many<br />
specialty crops do not have organized<br />
exchanges where such prices may be<br />
discovered, preventing the use of revenue<br />
insurance, such as RP. Some specialty<br />
crops are sold at retail prices, so<br />
a loss of production may have an<br />
insurance value that is well below the<br />
producer’s loss of revenue. Valueadded<br />
on-farm activities are not normally<br />
covered under the Federal <strong>Crop</strong><br />
<strong>Insurance</strong> Act. Other crops, such as<br />
organic crops, may be sold at a price<br />
premium. The Senate-passed <strong>2012</strong><br />
Farm Bill partially addresses price<br />
issues by calling for wholesale and<br />
retail prices to be used for organic<br />
crops (Section 11021).<br />
* <strong>Insurance</strong> effects on production.<br />
Because production volumes are small<br />
for many specialty crops, to the extent<br />
that crop insurance might encourage<br />
more production by reducing production<br />
risk, the price and producer income<br />
effects could be magnified because of<br />
the thinness of these markets. (One<br />
example of research in this area is by<br />
Ligon, E., Supply and Effects of Specialty<br />
<strong>Crop</strong> <strong>Insurance</strong>. NBER Working Paper<br />
No. 16709, January 2011.)<br />
* Grower interest. Some specialty crop<br />
producers have many alternative risk<br />
reduction methods available, such as<br />
irrigation and diversification, which<br />
reduce their interest in multi-peril crop<br />
insurance, and they may prefer to selfinsure.<br />
Some specialty crop producers<br />
simply do not want crop insurance to<br />
be made available for their commodity,<br />
fearing that crop insurance may<br />
result in new production in their markets.<br />
The Senate-passed <strong>2012</strong> Farm Bill<br />
partially addresses this concern with a<br />
provision requiring that new products<br />
must involve a “consultation with<br />
groups representing producers of commodities<br />
in all major producing areas<br />
for the commodities to be served or<br />
potentially impacted, either directly or<br />
indirectly” (Section 11009).<br />
* Rating and adverse selection/moral<br />
hazard. The unique features of many<br />
specialty crops may make premium<br />
rating difficult. Misrating leads to<br />
charging too much and causing low<br />
participation and adverse selection or<br />
charging too little causing adverse<br />
selection and excessive program costs.<br />
Often incomplete crop and market<br />
information and uncertainty in product<br />
performance results in coverage limitations,<br />
such as setting the maximum<br />
coverage level at 75 percent.<br />
* Specific perils. Because some specialty<br />
crop producers have alternative<br />
risk reduction methods, they may face<br />
only one or two primary perils, such as<br />
a freeze affecting fruit trees in April,<br />
and insurance against a specific peril<br />
would be preferable to more costly<br />
multi-peril insurance. Some single peril<br />
products are available from the private<br />
sector outside of the Federal crop<br />
insurance program.<br />
* Non-weather risks. The major risks<br />
for some specialty crop producers are<br />
from perils that are not natural disasters,<br />
such as food safety scares that disrupt<br />
demand or labor shortages that<br />
disrupt planting or harvesting. Such<br />
risks are not insurable under the<br />
Federal <strong>Crop</strong> <strong>Insurance</strong> Act. The<br />
Senate-passed <strong>2012</strong> Farm Bill does<br />
contain a provision requiring a study<br />
on insurance for producer losses due<br />
to food safety and contamination<br />
issues (Section 11017).<br />
Conclusion<br />
Specialty crop agriculture is a very significant<br />
part of the farm economy.<br />
Specialty crops are increasingly important<br />
in addressing diet and health issues.<br />
While there are numerous challenges in<br />
designing, selling and servicing specialty<br />
crop insurance compared with more<br />
homogeneous, large-acreage field crops,<br />
excellent progress has been made in<br />
expanding coverage and participation for<br />
specialty crops. Considering the different<br />
perils faced and the available alternative<br />
risk management approaches, the average<br />
participation rate for insurable specialty<br />
crops is a respectable 75 percent. There<br />
are excellent new product development<br />
processes that have been responsive to<br />
the needs of specialty crop producers.<br />
The Section 508(h) process and USDA’s<br />
Risk Management Agency’s (RMA’s) own<br />
authority to contract for new and<br />
improved products have resulted in over<br />
50 new product introductions since 2000.<br />
For <strong>2012</strong> alone, seven new or improved<br />
products were introduced: popcorn,<br />
strawberries, tangerine trees, citrus,<br />
camelina, pistachios and olives.<br />
Specialty crops are an important and<br />
growing sales opportunity for the crop<br />
insurance industry. The industry would<br />
welcome any improvements in specialty<br />
crop insurance products that increase customer<br />
satisfaction. The <strong>2012</strong> Farm Bill is<br />
likely to feature a number of provisions<br />
directed at specialty crops that should<br />
complement the strong new product<br />
processes in place and help crop insurance<br />
to be even more effective in meeting<br />
the risk management needs of the nation’s<br />
specialty crop producers.<br />
40 AUGUST <strong>2012</strong>
Grubs, Grapes and Grain.<br />
A <strong>Crop</strong> policy from Great American <strong>Insurance</strong> Group will<br />
protect your harvest from the pests that threaten it, whether<br />
bug, beast or budget. Our expertise is deep and our coverage is<br />
letter-perfect. To learn more about the Strength of Specialization,<br />
contact your local Independent <strong>Insurance</strong> Agent or visit<br />
GreatAmerican<strong>Insurance</strong>Group.com.<br />
<strong>Crop</strong> <strong>Insurance</strong> Division<br />
www.GreatAmerican<strong>Crop</strong>.com<br />
Great American <strong>Insurance</strong> Group I 301 E. Fourth Street I Cincinnati, OH 45202
PRSRT. STD.<br />
U.S. POSTAGE<br />
PAID<br />
Permit No. 116<br />
LAWRENCE, KS<br />
8900 Indian Creek Parkway, Suite 600<br />
Overland Park, Kansas 66210<br />
Thank you<br />
from Rain and Hail.<br />
Since 1919, we’ve been serving America’s<br />
farmers. Thank you to each of our loyal<br />
agents, policyholders and independent<br />
adjusters. You are a valuable part of<br />
our ability to deliver risk management<br />
products through a trusted network of<br />
people who understand agriculture.<br />
To learn more, visit www.RainHail.com or<br />
call 1-800-776-4045.<br />
Rain and Hail<br />
Agricultural <strong>Insurance</strong><br />
The ACE Group of Companies<br />
www.RainHail.com<br />
Rain and Hail is an equal opportunity provider.