download pdf file - Eastech Flow Controls
download pdf file - Eastech Flow Controls
download pdf file - Eastech Flow Controls

Create successful ePaper yourself
Turn your PDF publications into a flip-book with our unique Google optimized e-Paper software.
TECHNICAL OVERVIEW<br />
COSTVIEW<br />
SMART<br />
WASTEWATER<br />
SYSTEMS<br />
iTRACKER ®<br />
SMART INFLOW & INFILTRATION<br />
DETECTION MONITORS<br />
A Major Technological and<br />
Economic Breakthrough in Detecting<br />
and Locating Inflow & Infiltration
During the past 5 years, the average National<br />
wastewater treatment rate to U.S. taxpayers<br />
has risen 28.6%.*<br />
There are approximately 18,500 municipalities in the United States producing<br />
40 billion gallons of wastewater per day at a taxpayer cost of $150,000,000 or<br />
$55 billion dollars annually. A study by the Association of Metropolitan Sewage<br />
Agencies claims that 25% of this 40 billion gallons per day, or $14 billion<br />
annually, is due to inflow and infiltration (I&I) of ground and storm water, the<br />
cause of which is directly linked to our aging and faulty sewer infrastructure.<br />
NUS Consulting Group 2007<br />
iTRACKER ®<br />
SMART INFLOW & INFILTRATION<br />
DETECTION MONITORS
iTracker Ushers in a New Age of<br />
Wastewater Infrastructure Analysis<br />
iTracker Inflow and Infiltration (I&I) Detection Systems from <strong>Eastech</strong> <strong>Flow</strong><br />
<strong>Controls</strong> introduce a breakthrough technology that now makes it economically<br />
feasible for every municipality in the country to cost-effectively reduce their<br />
wastewater treatment charges. iTracker’s advanced technology is based upon<br />
a unique algorithm designated as “Delta Q”. Delta Q (patent pending) provides<br />
for the ability to compute volumetric differences in wastewater flows between<br />
dry and wet days, except without the requirement for ascertaining pipe slopes<br />
and coefficients of roughness.<br />
This single proprietary feature allows for the elimination of confined<br />
space entry, installation in 20 minutes, zero maintenance and immediate<br />
cost savings of up to 80%.<br />
COMPARATIVE COST ANALYSIS<br />
iTRACKER ®<br />
CONVENTIONAL FLOW STUDY<br />
(Doppler Portable Meters)<br />
Five I&I Detection Monitors<br />
w/ CostView Analysis Program<br />
$13,500<br />
Five Portable <strong>Flow</strong> Meters<br />
w/<strong>Flow</strong> Analysis Software<br />
$22,500<br />
Installation (5 units)<br />
Non-Confined Space<br />
$750<br />
Installation (5 units)<br />
Confined Space Entry<br />
$5,000<br />
Yearly Maintenance<br />
Contract (5 units)<br />
$0<br />
Yearly Maintenance<br />
($800/Unit/Month)<br />
$48,000<br />
TOTAL COST<br />
$14,250<br />
TOTAL COST<br />
$75,500<br />
iTracker I&I Detection Monitor<br />
TOTAL FIRST YEAR SAVINGS (80%)<br />
TOTAL SAVINGS PER YEAR GOING FORWARD (98%)<br />
$61,250<br />
$52,250<br />
CostView’s unique ability for cost-effectively locating I&I creates the<br />
potential for ultimately reducing a municipality's wastewater treatment<br />
charges by hundreds of thousands of dollars.<br />
COST BENEFIT ANALYSIS<br />
COST-EFFECTIVE ANALYSIS FOR REHABILITATION<br />
SUB-SYSTEM NO. 17 (3/15 – 6/15 2009)<br />
Ranking<br />
Segment<br />
(manhole to<br />
manhole)<br />
Sewer<br />
Length<br />
(Ft.)<br />
Pipe<br />
Diam.<br />
(In.)<br />
Delta Q 1<br />
50%<br />
Removable I&I<br />
(Avg. Gal/Day)<br />
Cost<br />
Savings<br />
Per Year 2<br />
CostView Cost Analysis Software<br />
1<br />
2<br />
3<br />
4<br />
13 - 15<br />
17 - 20<br />
5 - 7<br />
28 - 30<br />
1,000<br />
1,150<br />
1,100<br />
950<br />
1<br />
Delta Q represents the average change in wastewater volume due to the effects of Inflow and infiltration.<br />
2<br />
Cost Savings Per Year is based upon a wastewater treatment rate of $3.88/1000 Gallons.<br />
12<br />
12<br />
12<br />
10<br />
1.82<br />
1.54<br />
1.12<br />
1.07<br />
20,000<br />
14,000<br />
8,000<br />
5,100<br />
$28,324<br />
$19,826<br />
$11,329<br />
$7,420<br />
POTENTIAL TOTAL COST SAVINGS OVER 10 YEARS (10 x $66,900) $669,000<br />
3
Inflow & Infiltration<br />
Detection Systems<br />
iTracker paves the way for municipalities to begin the process of realizing<br />
substantial decreases in their wastewater treatment charges at a<br />
fraction of the cost of conventional methods. The major economic<br />
advantage of iTracker lies in its ability to detect and locate at a minimal<br />
cost millions of additional gallons of ground and storm water that enter<br />
the collection system due to inflow and infiltration. This unique ability for<br />
locating I&I creates the potential for reducing a municipality’s treatment<br />
costs by hundred of thousands of dollars.<br />
The Establishment of an Advanced Concept<br />
There are approximately 18,500 municipalities in the United States<br />
producing 40 billion gallons of wastewater per day at a taxpayer cost of<br />
$150,000,000 or $55 billion dollars annually. 40 billion gallons per day, or<br />
$14 billion annually, is due to inflow and infiltration (I&I) of ground and<br />
storm water, the cause of which is directly linked to our aging and faulty<br />
sewer infrastructure*. Obviously, if a clever combination of software and<br />
hardware were to be developed that was capable of quickly and inexpensively<br />
recognizing and locating the source of these extraneous flows,<br />
billions of dollars could be saved by communities throughout the world.<br />
The discovery by <strong>Eastech</strong>’s engineering group of a unique algorithm<br />
designated as “Delta Q” provided the cornerstone for just such a solution.<br />
Once <strong>Eastech</strong>’s engineers realized that they now had the ability to compute<br />
volumetric differences in wastewater flows between periods of dry and wet<br />
weather and that those differences were exactly identical to the ones<br />
calculated by the globally accepted Manning’s Equation (except without<br />
the requirement for confined space entry in order to ascertain pipe slopes<br />
and coefficients of roughness), an entirely new methodology for reducing<br />
wastewater treatment costs began to evolve.<br />
4<br />
*Association of Metropolitan Sewage Agencies
The Solution<br />
to an Age Old Problem<br />
A seamless combination of iTracker I&I detection field monitors<br />
operating in conjunction with CostView’s flow and cost analysis<br />
software program incorporating the Delta Q algorithm<br />
®<br />
Summary Table of Inflow & Infiltration<br />
Cost Effective Analysis for Rehabilitation<br />
Period: 3/15/09 to 6/15/09<br />
PHASE 2<br />
Segment<br />
Ranking<br />
(manhole to manhole)<br />
Summary Table of Inflow & Infiltration<br />
Cost Effective 1Analysis for Rehabilitation 13 - 15<br />
Period: 3/15/09 2 to 6/15/09<br />
SSES PHASE 2<br />
4<br />
Ranking<br />
1<br />
2<br />
3<br />
4<br />
3<br />
Segment<br />
(manhole to manhole)<br />
13 - 15<br />
17 - 20<br />
4 - 7<br />
27 - 30<br />
17 - 20<br />
5 - 7<br />
SUB-BASIN NO. 17<br />
Sewer Length<br />
(Ft.)<br />
SUB-BASIN NO. 17<br />
28 - 30<br />
950<br />
Sewer Length<br />
(Ft.)<br />
1,000<br />
1,150<br />
1,150<br />
1,125<br />
1,000<br />
1,150<br />
1,100<br />
Pipe Diam.<br />
(In.)<br />
810<br />
8<br />
12<br />
10<br />
Pipe Diam.<br />
(In.)<br />
10<br />
10<br />
10<br />
12<br />
REPORT NO. 12<br />
REPORT NO. 103% 12<br />
Delta Q<br />
630%<br />
480%<br />
108%<br />
170%<br />
Delta Q<br />
180%<br />
124%<br />
107%<br />
CostView ® Collection System Analysis Reports provide<br />
municipalities with a clear picture of exactly what is<br />
transpiring within their wastewater infrastructure grid.<br />
Detailed reports are provided that:<br />
4<br />
4<br />
4<br />
4<br />
4<br />
4<br />
Locate areas of I&I by volume.<br />
Breakdown costs associated with I&I.<br />
Locate illegal sump pump and roof drain connections.<br />
Provide data for infrastructure Cost/Benefit studies.<br />
Locate areas of highest I&I for efficient use of<br />
camera surveillance.<br />
Identify pipe capacity and maintenance issues.<br />
®<br />
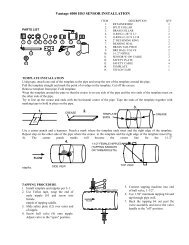
iTracker ® I&I Detection Monitors are strategically placed within designated<br />
manholes of each Sub-System (major basin) comprising the overall collection<br />
system. An onboard data logger records the differences in wastewater<br />
levels between specified periods of dry and combined dry and wet<br />
weather. An internal flash card within each iTracker stores the pertinent<br />
information for easy transfer to a PC running CostView’s analysis software.<br />
The CostView software program initiates both a volumetric and cost<br />
analysis report of the effects of any extraneous flows that have entered the<br />
Sub-System during the designated monitoring period. Once the Sub-<br />
Systems contributing the highest rate of inflow and infiltration are revealed,<br />
the iTrackers are removed and repositioned (again without the need for<br />
confined space entry) in order to detect and locate those segments within<br />
each Sub-System contributing to the majority of unwanted ground and<br />
storm water.<br />
5
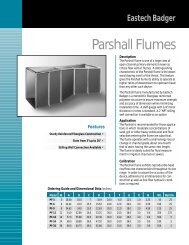
Performance Mapping the Wastewater Collection Grid<br />
Since both the EPA and the American Water Works Association suggest a “Systems Approach”<br />
for locating major sources of inflow and infiltration (I&I), <strong>Eastech</strong>’s Engineering Group decided to<br />
follow this identical approach. Wastewater collection systems selected for investigation are<br />
initially divided into separate Sub-Systems (major basins) and then again into Mini-Systems in<br />
order to cost-effectively ascertain the most prevalent areas of unwanted ingress.<br />
I&I Location, Volume and Cost Analysis<br />
Extensive international studies of inflow and infiltration have proven in case after case that the<br />
80/20 Principle usually applies (approximately 20% of the wastewater infrastructure network<br />
contributes 80% of the I&I). These extensive studies only confirm the economic value of<br />
implementing a structured Performance Mapping approach.<br />
Initially, a portable iTracker I&I Detection Monitor is placed at the base of each major Sub-System<br />
within the overall collection grid. iTracker level monitoring is conducted for a minimum period of<br />
five consecutive dry days in order to establish a “dry weather” baseline for calculating a pattern<br />
of diurnal flows completely absent of I&I. The identical procedure is then repeated for a period of<br />
three consecutive months of combined dry and wet weather. Once the collected data is gathered<br />
and transferred through flash card technology to CostView’s Analysis Program, Delta Q algorithms<br />
categorize by volume and cost the extent of I&I effecting each major Sub-System.<br />
Municipal managers are now capable of initiating the process of pinpointing the probable<br />
20% of the collection grid contributing the major portions of inflow and infiltration.<br />
iTracker<br />
I&I Detection<br />
Monitor<br />
Sub-System Isolation<br />
One iTracker is placed at the base<br />
of each major Sub-System<br />
Mini-System Isolation<br />
One iTracker is placed in<br />
every 10th manhole<br />
40<br />
30<br />
1 10<br />
20<br />
6<br />
Manhole with iTracker
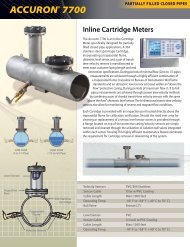
CostView Analysis Reports<br />
REPORT 1<br />
As can clearly be ascertained from<br />
Report 1, 50% of the total I&I is<br />
contributed by Sub-Systems 1 and 7.<br />
I&I CONTRIBUTION ANALYSIS<br />
DELTA Q CALCULATION SUB-SYSTEMS 1 - 8 (APRIL 1 - JUNE 30 2009)<br />
Sub-System<br />
1<br />
2<br />
3<br />
4<br />
5<br />
6<br />
7<br />
8<br />
Sewer<br />
Length<br />
(Ft.)<br />
20,000<br />
19,000<br />
22,000<br />
21,000<br />
20,000<br />
24,000<br />
18,000<br />
20,000<br />
Pipe<br />
Diam.<br />
(In.)<br />
12<br />
10<br />
8<br />
12<br />
15<br />
18<br />
10<br />
8<br />
Avg. Dry<br />
Day Level<br />
(% Full Pipe)<br />
25%<br />
25%<br />
25%<br />
25%<br />
27%<br />
28%<br />
30%<br />
25%<br />
Avg. Dry+Wet<br />
Day Level<br />
(% Full Pipe)<br />
33%<br />
31%<br />
27%<br />
27%<br />
29%<br />
30%<br />
43%<br />
26%<br />
DELTA Q<br />
Avg. Change in Volume<br />
Due to I & I<br />
1.67<br />
1.52<br />
1.21<br />
1.14<br />
1.15<br />
1.16<br />
1.95<br />
1.10<br />
REPORT 2<br />
If only 50% of the I&I discovered in<br />
Sub-Systems 1 and 7 is eliminated, a<br />
municipality will realize annual savings<br />
of $83,000, or $830,000 over a ten year<br />
period. By eliminating the same percentage<br />
of I&I generated by all 8 Sub-<br />
Systems, taxpayers will see a decrease in<br />
their wastewater treatment charges of<br />
$1,545,000 over the same ten year period.<br />
I&I CONTRIBUTION ANALYSIS<br />
VOLUME & COST CALCULATION SUB-SYSTEMS 1 - 8 (APRIL 1 - JUNE 30 2009)<br />
Sub-System<br />
1<br />
2<br />
3<br />
4<br />
5<br />
6<br />
7<br />
8<br />
Residents<br />
Served 1<br />
1120<br />
1050<br />
910<br />
1121<br />
1400<br />
1680<br />
980<br />
840<br />
Avg. Dry<br />
Day Volume<br />
(Gallons/Day)<br />
78,800<br />
73,000<br />
64,000<br />
83,000<br />
98,000<br />
118,000<br />
68,000<br />
59,000<br />
Avg. Dry+Wet<br />
Day Volume<br />
(Gallons/Day)<br />
131,000<br />
110,000<br />
77,000<br />
95,000<br />
113,000<br />
136,000<br />
133,000<br />
65,000<br />
Avg. Cost/Year<br />
Avg. Cost/Day<br />
($) 2 ($) 2<br />
Due to I & I Due to I & I<br />
$202<br />
$144<br />
$50<br />
$46<br />
$58<br />
$70<br />
$252<br />
$23<br />
$74,000<br />
$53,000<br />
$18,000<br />
$17,000<br />
$21,000<br />
$26,000<br />
$92,000<br />
$8,000<br />
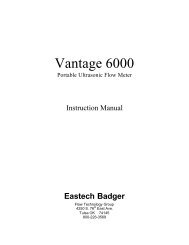
REPORT 4<br />
Further isolation of I&I on a 10 Mini-<br />
System basis is now separately<br />
conducted for each of the major Sub-<br />
Systems (1&7) having contributed the<br />
highest percentages of extraneous flow<br />
as identified by Reports 1 & 2. Repeating<br />
the identical procedure as previously<br />
employed within each major Sub-System,<br />
iTrackers continuously monitor both dry<br />
and dry/wet day wastewater levels within<br />
each 10 manhole Mini-System. Since the<br />
goal has been set to initially eliminate only<br />
50% of the total I&I within Sub-System 1<br />
(50% of $74,000), then according to<br />
Report 4, the volume in question is<br />
located somewhere between manhole 30<br />
and 50 (Mini-Systems D&E). Prior to<br />
instituting camera surveillance equipment,<br />
the investigation can now be narrowed<br />
down even further by repeating the above<br />
process for Mini-Systems D&E.<br />
I&I CONTRIBUTION ANALYSIS<br />
VOLUME & COST CALCULATION MINI-SYSTEMS A - F (OCT. 1 - DEC. 31 2009)<br />
Mini-System<br />
A (MH 1-10)<br />
B (MH 10-20)<br />
C (MH 20-30)<br />
D (MH 30-40)<br />
E (MH 40-50)<br />
F (MH 50-60)<br />
Residents<br />
Served 1<br />
187<br />
192<br />
182<br />
178<br />
199<br />
188<br />
Avg. Dry<br />
Day Volume<br />
(Gallons/Day)<br />
13,090<br />
13,440<br />
12,740<br />
12,460<br />
13,930<br />
13,160<br />
Avg. Dry+Wet<br />
Day Volume<br />
(Gallons/Day)<br />
16,088<br />
15,437<br />
14,751<br />
34,458<br />
31,924<br />
18,158<br />
1<br />
Using survey data from local records and the EPA, USGS and the AWWA, one can quickly ascertain the number of<br />
homes being serviced by each Sub-System, the average number of individuals per household within that Sub-System,<br />
the daily water usage per average household (the EPA, USGS and AWWA have all confirmed that average daily water<br />
usage by an individual in the United States is 70 Gal/Day) and the municipality’s wastewater treatment rate per 1000<br />
gallons. Once these figures are imported into the CostView software program, reports are generated describing each<br />
Sub-System by actual increases in volume and cost due to inflow and infiltration.<br />
2<br />
Average National Wastewater Treatment Rate (2007): $3.88/1000 Gal. (NUS Consulting Group)<br />
Avg. Cost/Year<br />
Avg. Cost/Day<br />
($) 2 ($) 2<br />
Due to I & I Due to I & I<br />
$11.60<br />
$7.75<br />
$7.80<br />
$85.35<br />
$69.80<br />
$19.40<br />
$4,234<br />
$2,829<br />
$2,847<br />
$31,152<br />
$25,477<br />
$7,081<br />
7
SMART SYSTEMS GROUP<br />
201-818-0800<br />
800-226-3569<br />
Fax: 201-818-0811<br />
20 Industrial Avenue<br />
Upper Saddle River, NJ 07458<br />
email: info@eastechflow.com<br />
www.eastechflow.com