

Technical Memorandum 1.0 Introduction 2.0 Approachto Evaluation
Technical Memorandum 1.0 Introduction 2.0 Approachto Evaluation
Technical Memorandum 1.0 Introduction 2.0 Approachto Evaluation

You also want an ePaper? Increase the reach of your titles
YUMPU automatically turns print PDFs into web optimized ePapers that Google loves.
CDNI<br />
<strong>Technical</strong> <strong>Memorandum</strong><br />
To:<br />
From:<br />
Date:<br />
Subject:<br />
Town of Marion, MA<br />
CDM<br />
April 2, 2008<br />
<strong>Evaluation</strong> of Wastewater Treatment Plant Flows and Loads and<br />
A vailable Capacity<br />
<strong>1.0</strong> <strong>Introduction</strong><br />
The upgraded Marion wastewater treatment plant (WWTP) became operational in late<br />
September 2005. In the 2-plus years since startup, the plant has been operated in a consistent,<br />
stable manner, and a considerable amount of data has been collected that allows for a detailed<br />
evaluation of the actual flows and loads the plant is treating, the operating criteria of the key<br />
unit processes, and the overall efficiency of the plant in meeting its permitted discharge<br />
criteria.<br />
The design of the upgraded WWTP was based on flow and load projections that were<br />
included in the Town's Comprehensive Wastewater Management Plan (CWMP). These<br />
projections were made circa 2000-2001, and were based on flow and load data that were<br />
available at the time, as well as an accounting of existing and projected new sewer<br />
connections that contribute to the plant and per-capita estimates for flow and load. In the 2<br />
plus year period of operation of the upgraded WWTP, it is seems apparent that the flows to<br />
the plant have been higher than projected and influent loads have been lower than projected.<br />
The purpose of this technical memorandum is to evaluate the actual influent flows and loads<br />
and plant operation, and determine the available remaining treatment capacity of the plant.<br />
The Town has requested this evaluation so it has the information necessary to consider future<br />
growth and development opportunities.<br />
<strong>2.0</strong> <strong>Approachto</strong> <strong>Evaluation</strong><br />
The first step of this evaluation will be to summarize the design criteria for the upgraded<br />
WWTP. This includes the influent flows and loads, the required effluent quality, and each<br />
unit process design. Second, the actual operation of the plant since startup will be<br />
summarized.<br />
Comparison of the original design criteria and the measured operating criteria will allow for a<br />
determination of available treatment plant capacity. This determination will include
<strong>Evaluation</strong> of Wastewater Treatment Plant Flows and Loads and Available Capacity<br />
April 2, 2008<br />
Page 2<br />
discussion of process capacity, hydraulic constraints and key design assumptions. Infiltration<br />
and inflow (1/1) has significant impacts on permit compliance and plant operations, and these<br />
impacts will be addressed.<br />
The Town has historically tracked the number of sewer connections contributing wastewater<br />
to the plant, and this memorandum includes an accounting of these connections. The<br />
available plant capacity will be presented in terms of available remaining connections.<br />
3.0 WWTP Design Criteria<br />
Table 1 summarizes the design criteria for the upgraded WWTP. The following paragraphs<br />
describe key aspects of the design criteria as they relate to the plant's capacity. Refer to the<br />
figure to the end of this memorandum for a process schematic of the treatment plant.<br />
• The average annual day flow (0.588mgd) is defined as the total flow treated in a calendar<br />
year, divided by the number of days in the year. The average annual day flow is NOT the<br />
key criterion with regards to the design of the treatment plant, but is one of the plant's<br />
discharge permit limits - if the 12-month rolling average flow exceeds 0.588 mgd, the plant<br />
is technically in violation.<br />
• The maximum-day flow rate (WWTP flow-through capacity) of 1.18 mgd is the design peak<br />
process capacity of the plant downstream of preliminary treatment. The biological system,<br />
effluent filters, and UV disinfection processes are designed to handle a peak flow of 1.18<br />
mgd.<br />
• Flow that exceeds the maximum-day capacity of the biological and subsequent treatment<br />
plant processes (1.18 mgd) up to the peak hour influent flow rate (3.0 mgd) is not meant to<br />
be treated through the plant. After passing through the preliminary treatment process, it is<br />
sent to the lagoon system for storage and later treatment once influent flows subside.<br />
• The peak flow rate to the plant (3.0 mgd) is also the peak design capacity of the Main Pump<br />
Station and discharge force main that feeds all of the Town's wastewater flow to the plant.<br />
• The maximum-month design loads, and more specifically the BOD load, are the key criteria<br />
used to size the biological system. The maximum-month load is defined as the maximum<br />
30-day running average load to the plant. Since the plant must meet its discharge permit<br />
on a monthly basis, this represents the maximum load that the plant must be able to handle<br />
during any reporting period.<br />
• The key effluent water quality requirements are related to the treatment capability of the<br />
SBRsystem, and hence this evaluation, are BOD, TSS, ammonia-nitrogen and total<br />
nitrogen.<br />
technical memorandum TO 7-2.doc
<strong>Evaluation</strong> of Wastewater Treatment Plant Flows and Loads and Available Capacity<br />
April 2, 2008<br />
Page 3<br />
• The inlet tanks, influent screen and grit tank are designed based on peak hydraulic<br />
requirements (i.e., flow, not load). Therefore, these preliminary treatment processes, and all<br />
of their interconnecting channels, are sized to handle the projected peak hour flow of 3.0<br />
mgd.<br />
• The design of the upgraded plant utilizes the pre-existing lagoon system for peak flow<br />
equalization. These lagoons have more than ample storage volume to meet the plant's<br />
needs, and do not limit the peak flow handling capability of the plant in any way. The<br />
presence of the lagoons is one factor that makes the wastewater load - as opposed to the<br />
flow - the key determinant of plant capacity.<br />
• The sequencing batch reactors (SBRs)are the key process that enables the plant to meet its<br />
discharge permit. As stated above, the SBRs are designed based on the maximum-month<br />
loads. Because the biological system performance varies with wastewater temperature, the<br />
capacity of the system differs in summer and winter as shown in Table 1. Generally, the<br />
SBRprocess must be designed considering both flow and load, since it functions as both a<br />
biological reactor and a clarifier. However, in the case of the Marion WWTP - with the<br />
lagoons available for peak flow equalization - the load controlled the sizing of the tanks.<br />
• In order to meet the plant's effluent permit limit for ammonia-nitrogen, and the target goals<br />
for effluent total nitrogen, the process is designed to provide year-round nitrification<br />
(ammonia removal). Selection of the design aerobic solids retention time (SRT)of 10.6 days<br />
is one of the key considerations of the design. The design aerobic SRT of 10.6 days provides<br />
a process safety factor of <strong>2.0</strong>, which is typical practice, in the coldest temperature condition.<br />
• The post-SBR equalization tank is needed to dampen the peak discharges from the SBRs<br />
during the decant phase. Flow from this tank is pumped to the effluent filters. This<br />
pumping system is designed to pump up to the maximum plant throughput (1.18 mgd)<br />
with one pump on standby.<br />
• The effluent filters were originally installed to treat lagoon effluent, before the SBR process<br />
became operational. Assuming that the SBRprocess functions properly the capacity of<br />
these units is based on hydraulic loading (i.e., flow).<br />
• The UV disinfection system is also sized on flow, assuming the filtered effluent quality is<br />
sufficiently high to enable the UV system to provide an adequate dose for disinfection.<br />
• The waste activated sludge (WAS) generated as a product of treatment is pumped for<br />
storage and further biological breakdown in the lagoons. Projection of the amount of<br />
sludge generated per pound of BOD removed (referred to as "Net Yield") is a key<br />
consideration in the sizing and capacity of the SBRs, and this is discussed below.<br />
technical memorandum TO 7-2.doc
Design Flows and Loads<br />
) Wastewater BOD Inlet Tanks<br />
BOD Average Number<br />
Flows monthly Day<br />
of<br />
(mgjL)<br />
Annual<br />
Tanks<br />
(mgd) Day<br />
concentration, (mgfL) (mgjL) May I-May 31 (mgjL)<br />
neglect 1202 1036 1144<br />
909 191 992 247 330<br />
880 218 25'x3.75'x7.83'<br />
56 0.588 7-10 1.74 3.00 1.18 1.84 2.6 42<br />
9<br />
2<br />
CDNI<br />
Table 1<br />
Marion WWTP Design Criteria
Volume (gal)<br />
Number Diameter Lagoon Air TypeRequirements<br />
1<br />
Sequencing Average Length High Water Batch<br />
ofunits<br />
Units Level Reactors (HWL) (sefm)<br />
Mechanical Rotary 1150 19.9 7.17 660 620 15 52 99 33 38<br />
37<br />
Rotary PD 10980 4,700 3,760 0.73 0.25 10.6 2.97<br />
375 150 2.5<br />
1<br />
2 Bar PD<br />
Screen<br />
CDNI<br />
Table 1<br />
Marion WWTP Design Criteria
Motor Horsepower Low-pressure Soda 10.597,800<br />
108 216 3.8 1.9 83 12 20 54 60 15cloth-disk<br />
Ash 1,165 1,000 137 576 879 150 1.2<br />
7.5<br />
48<br />
1246<br />
(Na2C03) amalgam<br />
Length Average Diameter per Chemical<br />
Filter Type<br />
disk Type Day<br />
Tanks<br />
Waste Number Annual ActivatedAverage<br />
ofSludge Pumps<br />
Quantity (lbs/ day)<br />
CONI<br />
Table 1<br />
Marion WWTP Design Criteria
<strong>Evaluation</strong> of Wastewater Treatment Plant Flows and Loads and Available Capacity<br />
April 2, 2008<br />
Page 7<br />
4.0 Summary of WWTP Operation<br />
The upgraded WWTP has been operational for more than two years and sufficient data has<br />
been collected to evaluate the actual loading conditions and the unit processes. Attached to<br />
this memorandum are Figures 1-10, which are useful in assessing the actual operating data.<br />
The following paragraphs address key findings from the data assessment.<br />
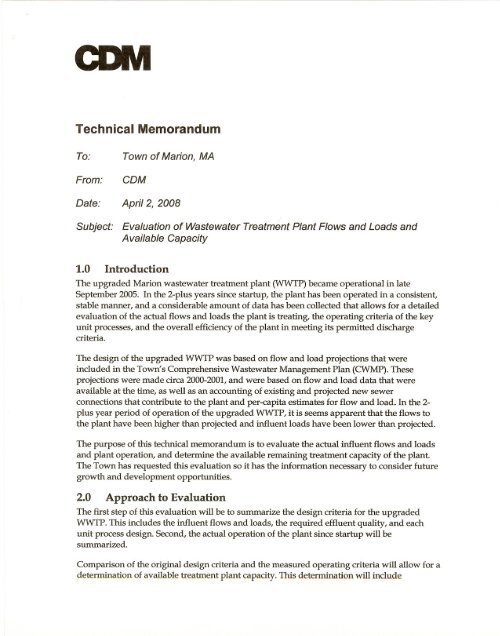
• Figures 1 and 2 present plant influent flows from October 2005 through December 2007.<br />
Figure 1 presents monthly averages during that period, and shows significant fluctuations,<br />
from a high of 0.924 mgd in January 2006 down to 0.285 mgd in September 2007, at the<br />
peak of the recent very dry spell. The average influent daily flow over this period was 0.602<br />
mgd, slightly higher than the permitted 12-month moving average flow of 0.588 mgd.<br />
Figure 2 presents the historical influent flow daily, and shows that except for extreme<br />
storms, the daily flow reaches maximums in the range of <strong>1.0</strong> mgd during wet periods to<br />
less than 0.3 mgd during very dry periods. This illustrates the extent of the 1/1issue in<br />
Marion, which is addressed later in this memorandum.<br />
• Figure 3 presents influent BOD loads from October 2005 through December 2007. This data<br />
also shows wide fluctuations, though all of the monthly averages are less than the<br />
maximum-month design loads (1,036lbs/ day in the winter, 1,202lbs/ day in the summer)<br />
The average monthly influent BOD load over this period was 581lbs/ day. The measured<br />
maximum-month (winter) BOD load to date is 1,009lb/ day (April 2007);however, further<br />
investigation of this value indicates that it is mostly the result of one particular day of<br />
sample results, which appears to be an outlier. If that one data point is removed from the<br />
evaluation set of data, the resulting corrected maximum-month (winter) BOD load in that<br />
month is reduced from 1,009lbs/ day to 902lbs/ day. This is a more reasonable maximummonth<br />
peak, and is similar to the next highest monthly load (March 2006) of 904lbs/ day.<br />
Therefore, the data indicates a maximum-month (winter) BOD load of 904lbs/ day.<br />
• Figures 4 through 7 present effluent quality achieved from October 2005 through December<br />
2007. These data show that the plant's effluent quality has been equal or better than<br />
anticipated throughout the period. Figure 4 shows that the effluent BOD concentration has<br />
typically been in the range of 2-7 mg/L, versus the target concentration of 5 mg/L and the<br />
plant's effluent average monthly permit concentration of 9 mg/L. The plant also has a BOD<br />
effluent monthly load limit of 42lbs/ day, and Figure 5 shows with occasional exception<br />
(due to high flow) that the actual effluent BOD load has been below this limit. Figure 6<br />
presents effluent ammonia-nitrogen concentrations, which are almost always below the<br />
effluent target of 1 mg/L and always are below the effluent permit limits. Figure 7 shows<br />
the effluent total nitrogen concentration variation. Since startup, the plant has consistently<br />
performed better than the target range of 7-10 mg/L. The plant currently has no total<br />
nitrogen limit, but the ability to remove nitrogen was included for its process and<br />
technical memorandum TO 7-2.doc
<strong>Evaluation</strong> of Wastewater Treatment Plant Flows and Loads and Available Capacity<br />
April 2, 2008<br />
Page 8<br />
environmental benefit, and the anticipation that there will be a total nitrogen limit at some<br />
point in the future .<br />
• Figure 8 presents the variation of aerobic SRT since plant startup, and shows that fairly<br />
tight control has been maintained, typically within the range of 10-15 days. The average<br />
aerobic SRT over the entire period was 11.5 days, almost 10 percent longer than the design<br />
aerobic SRT of 10.6 days .<br />
• Figure 9 presents the variation in mixed liquor suspended solids (MLSS) concentration<br />
within each SBRsince startup of the upgraded plant. In both SBRs, the MLSS concentration<br />
has ranged from 1,000 to 1,800 mg/L, which is well below the design MLSS concentration<br />
of 4,700 mg/L. This is consistent with the lower-than-anticipated influent BOD loading<br />
discussed earlier. The wasting data shown in Figure 10 is also consistent, as the daily<br />
wasting has typically ranged from 300-500 lbs/ day, below the anticipated average wasting<br />
rate of 8791bs/ day.<br />
5.0 Available WWfP Capacity<br />
Determination of Available Process Capacity<br />
The capacity of the Marion WWTP is dictated by its ability to successfully treat the maximummonth<br />
influent BOD load in the winter months. Therefore, determination of available<br />
capacity must consider the actual measured BOD load versus the design BOD load. In<br />
addition, the original design of the biological process to treat the influent BOD load involved<br />
the selection of two key parameters: the aerobic SRT and the net yield. Determination of<br />
available capacity must consider these two parameters in light of plant data collected since<br />
startup.<br />
Table 2 presents a line-by-line determination of the available WWTP capacity in terms of<br />
maximum-month influent BOD load. Line 1 indicates the tank volume (at low water level) is<br />
0.73 million gallons. Line 2 indicates that design MLSS concentration is 4,700 mg/L, which<br />
dictates the total biological mass within the reactors (Line 3), which is also the solids<br />
inventory capacity of the tank.<br />
Line 4 indicates the percent of time in the SBR treatment cycle during which the contents are<br />
designed to be in aerobic conditions. In order to meet the nitrogen-removal goal under<br />
maximum load conditions, this aerobic time was designed to be 38% of the total cycle time.<br />
Currently the plant is operating with about 48% of the cycle under aerobic conditions, which<br />
gives a cushion for maintaining nitrification; however, as the design capacity of the process is<br />
reached, a reduction back to 38% will likely be required and should be planned for. Therefore,<br />
the lower aerobic fraction of 38% is used in this calculation. Line 5, the mass under aeration,<br />
is the product of Lines 3 and 4.<br />
Line 6 includes the design aerobic SRT of 10.6 days. While the plant currently operates at 11.5<br />
days, the design value of 10.6 days will provide sufficient process safety factor and allows for<br />
technical memorandum TO 7-2.doc
<strong>Evaluation</strong> of Wastewater Treatment Plant Flows and Loads and Available Capacity<br />
April 2, 2008<br />
Page 9<br />
treatment of more load. Given the aerobic biomass and the aerobic SRT, the amount of solids<br />
removed from the system, mostly by wasting but with a small amount in the process effluent,<br />
is calculated in Line 7.<br />
Line 8 presents the net yield used in this calculation. During design, the selection of net yield<br />
is based on many factors, including the design SRT of the system and the particular<br />
characteristics of the wastewater being treated. The actual measured net yield has varied<br />
considerably since plant startup; however, in the months from May 2007 through December<br />
2007, the net yield has been relatively stable, averaging 0.88 lbs WAS/lb BOD removed on a<br />
monthly average basis. This value is reasonable and is suitable for determination of the<br />
available capacity of the plant, and results in the BOD removal capacity of 1,166Ibs/ day<br />
shown in Line 9.<br />
Lines 10 and 11 illustrate that the plant influent BOD load under maximum-month (winter)<br />
conditions can increase by (i.e., the plant can successfully treat) 2621bs/ day more than the<br />
current condition. In Lines 12 and 13, using a maximum-month to average month BOD load<br />
peaking factor of 1.56 (based on plant data), this translates into an allowable average BOD<br />
load increase of 1681bs/ day.<br />
Since the new treatment plant went into service, the number of service connections has<br />
increased from 1,166 to 1,593. Over that time, the average per-capita BOD load has varied<br />
between 0.145 and 0.20 lb/ day/person. Lines 14 and 15 utilize the average between these two<br />
values, 0.17Ibs/ day/person, to equate 1681bs/ day of BOD with a population of 987. (Note<br />
that this per-capita BOD load of 0.17Ibs/ day/person is consistent the value recommended by<br />
TR-16, Guides for the Design ofWasteu;ater Treatment Works as representing typical conditions.)<br />
The 2000 US Census indicates that the average-per-residence population in the Town of<br />
Marion is 2.51. Lines 16 and 17 therefore show that the plant has the capacity to add the<br />
equivalent of 393 typical residential connections to its current loading. Lines 18 and 19 show<br />
that at the per-capital flow rate of 69 gpd, the estimated total average flow from these<br />
connections is about 68,000 gpd.<br />
technical memorandum TO 7-2.doc
12<br />
14<br />
Allowable Additional Additional<br />
SBR Condition Volume Comment<br />
BOD load Max under Month average BODconditiom<br />
Load<br />
TSS Net Aerobic Total BOD Biomass Design Avg Connections Current Per Max Population Yield capita (WAS additional Month:Avg Removal Biomass MLSS SRT % Max Adequate Based Under goals Per Based Existing (Ibs of flow BOD + per Equiv. Total (@LWL) Eff (days) Month 2000 TSSI Concentration available (Ibs) Capacity flow connection Aeration TSS) load BOD two maximum-month Additional Cycle d/BODr) plant US treatment average (average) SBR Load (million Produced census. (Ibs/day) (Ibs) data. Time Load tanks Peaking per-connection (mg/L) BOD can (904/581 gal) (Ibs/day) be loads, Factor maintained = 1.56). it is<br />
BOD 10874 28615 Value 68000 4700 1166 1026 2.51 0.17 0.88 1.56 38% 0.73 10.6 987 904 393 69<br />
262 168<br />
would load however, estimated need<br />
Line<br />
10.6 since days. tothat plant maintain be aerobic startup. reduced nitrogen percentage to 38%. removal<br />
Current plant operation is at 11.5 days.<br />
Current plant operation is about 48%;<br />
CONI<br />
Table 2<br />
Marion WWTP Determination of Available Capacity
<strong>Evaluation</strong> of Wastewater Treatment Plant Flows and Loads and Available Capacity<br />
April 2, 2008<br />
Page 11<br />
Plant Impacts due to Increased Flow<br />
It has been determined that the WWTP has the process capacity to handle an additional load<br />
equivalent to 393 typical residential connections, and that the corresponding increase in<br />
average wastewater flow is 68,000 gpd. This increase in flow needs to be checked for impacts<br />
throughout the plant, especially due to the peaking factors associated with this average flow.<br />
Table 3 summarizes the revised flow criteria that would result from adding 68,000 gpd of<br />
average flow, assuming that the peaking factors for flow will not change and that the influent<br />
pump station capacity of 3.0 mgd is not increased. It should be noted that for the peak hour<br />
flow of 3.0 mgd to not increase (while adding more average flow), there will have to be a<br />
decrease in extraneous flow (III). This would be very important, as the recent upgrade to the<br />
existing Main Pump Station peak capacity to provide a peak capacity of 3.0 mgd maximized<br />
the feasible capacity of the pump station structure, power supply available to the site and the<br />
existing force main system.<br />
Table 3<br />
0.656 <strong>2.0</strong>5 1.31 3.0 mgd<br />
low-through Revised capacity) Influent Average Flow Criteria Annual w/Added Day Connections<br />
The flow increase would have the following impacts on the plant:<br />
• The preliminary treatment processes (the inlet tanks, the influent screen and the grit tank)<br />
will not be impacted.<br />
• The lagoons, used for influent flow equalization during high peak flows and for disposal of<br />
waste activated sludge and filter backwash, will be utilized more. The quantity of WAS<br />
flow and filter backwash is roughly proportional to the treated flow rate, so increasing the<br />
average flow treated from 0.588 mgd to 0.656 mgd will increase these recycle flows by<br />
about 12 percent. The lagoon systems have more than ample capacity and this should have<br />
only a small impact on operation.<br />
• At the operators' discretion, the lagoons also may be used more frequently for peak-flow<br />
equalization. We have determined that the SBRs have an additional capacity, up to a<br />
technical memorandum TO 7-2.doc
<strong>Evaluation</strong> of Wastewater Treatment Plant Flows and Loads and Available Capacity<br />
April 2, 2008<br />
Page 12<br />
maximum-day flow of 1.31 mgd. As currently designed, flow that exceeds a rate of 1.18<br />
mgd is diverted to the lagoons for later treatment, and this maximum flow rate before<br />
diversion could be increased to 1.31 mgd. However, it should also be noted that operators<br />
have the ability to begin diversion at a lower flow rate if conditions require it (for example,<br />
if the SBRs are not running optimally). This discretion will continue, such that it will be<br />
possible to cap peak flow through the plant at a rate less than 1.31 mgd if desired.<br />
• Much of the SBRsystem is operated automatically, including cycle control and water level<br />
alarm checkpoints. To enable the SBRsystem to process the maximum-day flow of 1.31<br />
mgd, the automatic settings of the existing system will have to be reviewed and perhaps<br />
reprogrammed to suit.<br />
• The post-SBR equalization tank is sized to dampen the peak SBRdecant rate and allow for<br />
a maximum withdrawal rate equivalent to 1.18 mgd. The equalization tank would still be<br />
sufficient in size to handle up to 1.31 mgd, as long as it is possible to pump from the tank at<br />
that rate, and to filter and disinfect the effluent. The two existing withdrawal pumps are<br />
each nominally rated at about 1.18 mgd. During maximum-day conditions it may be<br />
therefore be necessary to run more than one pump for brief periods of time.<br />
• Increasing the treated average flow from 0.588 mgd to 0.656 mgd, and the maximum-day<br />
flow from 1.18 mgd to 1.31 mgd, will increase the loading rate to the effluent filters. Under<br />
current conditions, the filters are loaded at 1.9 gpm/ sf average and 3.8 gpm/ sf peak.<br />
Increasing the flow will increase loading to 2.1 gpm/ sf average and 4.2 gpm/ sf peak.<br />
Though higher, these are still within the nominal filter loading rates for the cloth filtration<br />
media, which are 3.25 gpm/ sf average and 6.5 gpm/ sf peak. At typical filter inlet TSS<br />
concentrations, the filters will also still be well within the allowable solids loading rate.<br />
Therefore, no modifications to the effluent filter system will be required.<br />
• The UV system is designed to disinfect up to 1.2 mgd and meet the plant's effluent coliform<br />
limits of 14 MPN/I00 m1 geometric mean and 43 MPN/I00 m1maximum. The installed<br />
UV system is very robust and has been able to maintain compliance with these limits with<br />
capacity to spare. Though impossible to know without field testing, is seems apparent that<br />
the UV system would be able to successfully disinfect the effluent up to a flow rate of 1.31<br />
mgd without requiring modifications.<br />
• The capacity of the plant's effluent pipe was increased during the recent plant upgrade,<br />
and tested at up to 1.8 mgd. The pipe will not be impacted by increasing the maximum<br />
flow throughput to 1.31 mgd.<br />
In summary, increasing the plant flow by an average of 68,000 gpd will require some<br />
operational adjustments, including some automatic control system programming changes,<br />
but should not require capital improvements. To truly minimize any impacts to the treatment<br />
plant processes, the lagoons can be used somewhat more frequently during high-flow days.<br />
technical memorandum TO 7-2.doc
<strong>Evaluation</strong> of Wastewater Treatment Plant Flows and Loads and Available Capacity<br />
April 2, 2008<br />
Page 13<br />
Permit and Regulatory Considerations<br />
The Marion WWTP operates and discharges effluent under the conditions of its NPDES<br />
permit. This permit places conditions on effluent quality and quantity, and any increase in<br />
flow must consider the following impacts of the permit.<br />
Flow<br />
The plant's permitted discharge is currently limited to a 12-month rolling average of 0.588<br />
mgd. Since the upgraded WWTP was placed into service, the effluent flow rate has averaged<br />
slightly higher than the permitted rate, at 0.602 mgd. <strong>Technical</strong>ly, this is a permit violation.<br />
As such, the Town could be subject to penalties and enforcement action, though the<br />
regulators have not acted on this matter to date.<br />
However, the agencies can be expected to balk at allowing additional sewer connections that<br />
would increase the plant's average discharge by an additional 68,000 gpd. Approval of this<br />
increase could not be obtained without going through an extensive permitting process, and<br />
even then there is no guarantee of eventual approval. Achieving successful flow reduction<br />
with the Town's Ifl removal program would almost surely be a condition of any approval.<br />
Effluent Load<br />
The plant's effluent is required to meet effluent BOD and TSS standards for concentration,<br />
and also for load. The average monthly limits for both BOD and TSS are currently a<br />
concentration of 9 mglL and an effluent load of 42lbsl day. In past permit renewal<br />
discussions, the regulatory agencies indicated that no increase in effluent load would be<br />
permitted, even if flows were allowed to increase. This means that if flow were to increase<br />
from 0.588 mgd to 0.656 mgd, the required effluent concentrations for both BOD and TSS<br />
would decrease from 9 mglL to 7.7 mg/L. These concentrations are achievable, but<br />
obviously reduce the margin by which compliance can be maintained. This indicates another<br />
benefit of successfully reducing III.<br />
Summary<br />
The Marion WWTP has the process capacity to handle an additional 262 lbsl day of influent<br />
BOD under maximum-month (winter) conditions, and this equates to the equivalent of 393<br />
typical residential sewer connections beyond current loading. The plant operation would be<br />
only minimally impacted due largely to the existence of the lagoons to equalize peak flows.<br />
The average flow would increase by an estimated 68,000 gpd as a result of adding these<br />
connections. The increase in flow has permitting hurdles and impacts that must be<br />
considered. The Town's upcoming III removal program, to be addressed below, perhaps can<br />
be used to reduce or negate the increase in flow and the resulting issues.<br />
6.0 InfiltrationjInflow Considerations<br />
As has been documented elsewhere, the Marion collection system is subject to a significant<br />
amount of extraneous flow from infiltration and inflow (III). The Town's 2007 Annual III<br />
technical memorandum TO 7-2.doc
<strong>Evaluation</strong> of Wastewater Treatment Plant Flows and Loads and Available Capacity<br />
April 2, 2008<br />
Page 14<br />
report states that the estimated average annual infiltration was 260,000 gallons per day (gpd),<br />
and that 1/1 peaked during worst-case conditions at 780,000 gpd. The Town has begun a<br />
multi-phased process designed to cost-effectively reduce the quantity of If I.<br />
The discussion presented in Section 5.0 re-emphasizes the importance of removing 1/1 from<br />
the system. Though the treatment capacity of the plant is not impacted, because of the loadcontrolling<br />
design of the SBRs, and the presence of the lagoons, the system's high flow rates<br />
are causing the plant to be in violation of its NPDES permit flow for flow, and are responsible<br />
for its occasional load-based effluent violations.<br />
The plant's permitted 12-month moving average flow rate is 0.588 mgd; since the new plant<br />
was placed into service, the plant's average flow of 0.602 mgd has exceeded that limit.<br />
Adding more connections - resulting in 68,000 gpd of additional wastewater (with additional<br />
potential sources for more 1/1), will only exacerbate this permit compliance issue. We would<br />
not expect that the Town could obtain approval to increase the permitted discharge flow rate<br />
without demonstrating a certain amount of successful 1/1 removal.<br />
In addition to alleviating the existing permit compliance issues and perhaps making new<br />
connections possible, 1/1 removal would provide the following benefits:<br />
• Reduced O&M cost due to power usage. Every gallon of 1/1 increases the power<br />
requirements due to influent pumping at the Main Pump Station, SBR effluent pumping<br />
and UV disinfection, which are all flow-based power demands.<br />
• Reduced chemical cost. The plant currently doses soda ash to the SBRprocess in order to<br />
maintain the necessary alkalinity for treatment. Future permit requirements may dictate<br />
addition of other chemicals for phosphorus removal. This chemical addition is typically<br />
controlled by flow-pacing, so extraneous flows results in more (unnecessary) chemical<br />
usage.<br />
• Reduced maintenance cost. Higher flows require many of the plants processes to work<br />
harder, and therefore accelerate maintenance frequency. These processes include the<br />
influent screens and grit removal systems, the effluent filters and the UV disinfection<br />
system.<br />
7.0 Sewer Connection Summary<br />
Table 4 presents a summary of existing, reserved and available sewer connections. Line 1<br />
indicates that when the new plant became operational in October 2005, there were a total of<br />
1,166 sewer connections in service. Lines 2 through 8 summarize connections that have been<br />
added since October 2005. As shown, most of the new connections resulted from the new<br />
pressure sewers installed in the three needs areas identified in the Town's wastewater<br />
management plan (the Berry neighborhood, South Converse and Dexter Beach). An<br />
additional 15 connections were made outside these three neighborhoods, and four previous<br />
technical memorandum TO 7-2.doc
<strong>Evaluation</strong> of Wastewater Treatment Plant Flows and Loads and Available Capacity<br />
April 2, 2008<br />
Page 15<br />
connections were changed to inactive status. Line 8 shows that as of March 2008, there are<br />
1,593 connections being serviced.<br />
Line 9 shows that the Marion WWTP has the process capacity to connect the equivalent of 393<br />
typical residential sewer connections, beyond those currently being serviced, as was<br />
determined in Section 5.0. Lines 10-15 show that there are a total of 121 reserved, or<br />
"grandfathered" connections that the Town will be obligated to connect at some point in the<br />
future. Line 16 represents difference between Line 9 and Line 15, and shows that there are a<br />
total of 272 available connections in terms of treatment plant capacity. These would be typical<br />
residential connections.<br />
Line 17 shows that the plant has a total capacity to handle 1,986 typical residential sewer<br />
connections.<br />
8.0 Summary of Conclusions<br />
The evaluations described in this memorandum<br />
indicate that:<br />
• The plant has the capacity to add the equivalent of 393 typical residential connections to its<br />
current loading. At the per-capital flow rate of 69 gpd, the estimated total average flow<br />
from these connections is about 68,000 gpd.<br />
• There are a total of 272 available residential connections, beyond those currently connected<br />
and reserved or grandfathered, in terms of treatment plant capacity. The plant has a total<br />
capacity to handle 1,986 typical residential sewer connections.<br />
• Increasing the plant flow by an average of 68,000 gpd may require some operational<br />
adjustments to the plant's processes, including some automatic control system<br />
programming changes to the SBRprocess, but should not require significant capital<br />
improvements. To truly minimize any impacts to the treatment plant processes, the<br />
lagoons can be used during high-flow days.<br />
• The plant's permitted discharge is currently limited to a 12-month rolling average of 0.588<br />
mgd. Since the upgraded WWTP was placed into service, the effluent flow rate has<br />
averaged slightly higher than the permitted rate, at 0.602 mgd. It may prove very difficult<br />
for the Town to obtain regulatory approval to allow additional sewer connections that<br />
would increase the plant's average discharge by an additional 68,000 gpd. Achieving<br />
successful flow reduction with the Town's If I removal program would almost surely be a<br />
condition of any approval.<br />
• Implementation of a successful III removal program would provide significant benefit to<br />
the Town in terms of: 1) avoiding permit violations for high flow and flow-caused high<br />
discharge loads; 2) more probable regulatory approval to add sewer connections to the<br />
collection system; 3) reduced O&M cost.<br />
technical memorandum TO 7-2.doc
11 3<br />
Properties Connections Total Reserved Description<br />
Additional Reserved "Available" Connections Properties South Other Berry Dexter "Grandfathered"<br />
Added Neighborhood Properties Converse Beach WWTP Removed/Changed (March Connections Since Allowable before 2008) October Connections October WWTP 1, 2005 to1, Allowed Inactive 2005 109 169 138 82 18 -4 15 14 7 Value 1166 1986 1593 272 393 121<br />
Line<br />
CONI<br />
Table 4<br />
Marion WWTP Determination of Available Connections
0 •• 0.588 MGo<br />
ill<br />
Q- OIo4GD<br />
INFLUOO<br />
Q- 0.58I! MOD<br />
SPUmR<br />
BOX<br />
GRIT CHMIBER<br />
B"I'PASS<br />
Q- 0.588 IroIOD<br />
SBRI<br />
lAGOON RECYCLE Q•• 0 WOO<br />
WAS![<br />
•..•..<br />
.......<br />
""""'-'<br />
••••••<br />
0- 0.011 10100<br />
"'II'<br />
EMERGENCY POWER GENERATOR PROVIDES BACKUP FOR<br />
ENTIRES'I'S'1nI.<br />
_ASH<br />
"""<br />
(fUTURE)<br />
"""""<br />
••••••<br />
0- 0.28i WGO<br />
» '<br />
"""<br />
fl.".<br />
No.1<br />
W-ctWl£l. No.1<br />
(Off LtiQ<br />
EfF1.U[NT<br />
Q_ 0.518 MOD<br />
0. 0.586 IIIOD<br />
•••<br />
No.2<br />
Q- 0.577 10100<br />
SBRE<br />
,-<br />
POST-'"<br />
EQIIAU2A1IQN<br />
Qooo O.28i MOO<br />
"""<br />
fl.".<br />
No.2<br />
1N-WHl.<br />
No.2<br />
•••<br />
••••••••• toWN F'LOW<br />
---..- Slot STREAW f1JJW<br />
i;<br />
--1> !iAMPLE POWT<br />
a<br />
~ CHEl.UCAl.fEEDPOiNT<br />
PUI.4P (GENERAL TYPE)<br />
~Wr,GHETlCFLOWIoIETER<br />
5' AUro AWJ,.YZER<br />
FlOW f'1GURES SHOWN AAE ON<br />
AV£RNJ£ DESIGN DAY.<br />
CDM<br />
TOWN OF MARION. MASSACHUSETTS<br />
WASTEWATER TREATMENT PLANT UPGRADE<br />
PROCESS FLOW DIAGRAM<br />
FIGURE
«<br />
90-AON 90-1:>0<br />
•••..... ro<br />
-<br />
r::<br />
c: _:J<br />
co I- 80-uer<br />
~ LO-AON<br />
:E~ 0<br />
Qj Lo-:>aa<br />
.Q "- o<br />
0<br />
LL ~ §, ~ £ c: .r::<br />
2Q)<br />
>. I- LO-daS LO-Inr Lo-6n'11<br />
90-daS 90-6n'11 90-unr LO-Jd'11 LO-qa:l LO-uer 90-:>aa 90-~ew 90-Jd'11 90-qa:l 90-uer so-:>aa LO-JeW 90-lnr 90-JeW<br />
I t ILO-unr Lo-~ew<br />
« rnr £0-1"0<br />
s:::<br />
o<br />
+:i<br />
CO<br />
".:<br />
CO<br />
><br />
3=<br />
o-LLs:::<br />
(I)<br />
~<br />
~<br />
s:::<br />
-<br />
~<br />
.s:::<br />
-s:::<br />
o<br />
:E<br />
(p6w) MOI:l<br />
N<br />
ci<br />
.•..<br />
o<br />
SO-AON<br />
SO-I:>O<br />
SO-daS<br />
o<br />
ci
~~ ------------------------------------------- --------~<br />
~<br />
N<br />
(p6w) MOI:l<br />
90-AoN 90-:J:>O<br />
-<br />
0~<br />
90-daS 90-6n" 90-lnr 90-unr LO-daS Lo-6n" LO-Inr Lo-~ew LO-Jd" LO-qa::l LO-uer 90-:>aa 90-~ew 90-Jd" 90-qa::l 90-uer so-:>aa SO-AON SO-daS Lo-:>aa LO-AON LO-unr 90-JeW SO-~:>O LO-:J:>O LO-JeW<br />
c<br />
.c<br />
C0<br />
.•...<br />
~C!<br />
80-uer<br />
c<br />
o<br />
;;<br />
ca<br />
'i:<br />
ca<br />
> ~ o-u.<br />
- c<br />
(I)<br />
~<br />
:;:<br />
c-<br />
~,-<br />
ca<br />
~<br />
C '(3<br />
ro<br />
c..<br />
rou<br />
a:::<br />
CD<br />
- (/)<br />
ro .<br />
~ S: S:<br />
§ .Q.Q<br />
-< LLLL<br />
(]) »»<br />
C> ro ro<br />
ro 00<br />
Qj E E<br />
> ~ ~<br />
~ EE<br />
S:<br />
o<br />
'x'x<br />
ro ro<br />
u: ~~<br />
t:"Ct:t:<br />
.2> (]) .2>.2><br />
oEoo<br />
(/) ~ (/) (/)<br />
(]) ;;:: (]) (])<br />
1111
80-uer<br />
90-1.:>0<br />
90-dag<br />
90-6nV<br />
90-lnr<br />
.c:<br />
-<br />
90-J\ON g :!<br />
90-JeW<br />
90-uer<br />
so-:>aa<br />
SO-J\oN<br />
Lo-uer<br />
90-:>aa<br />
LO-JeW<br />
Lo-unr<br />
Lo-~ew<br />
LO-JdV<br />
Lo-:>aa<br />
LO-J\ON<br />
LO-1.:>O<br />
Lo-dag<br />
LO-6nV<br />
LO-Inr<br />
- 90-unr<br />
90-~ew<br />
9Q-JdV<br />
oN<br />
o'<br />
"C<br />
CO<br />
o<br />
...J<br />
C<br />
o<br />
m<br />
-<br />
-c::<br />
(I)<br />
::::s<br />
it:<br />
c::<br />
-<br />
~<br />
.s::<br />
-c::<br />
o<br />
:!<br />
(pdd) peol a08 Juanuul
s:::<br />
o<br />
+:i<br />
ctI<br />
••<br />
ctI<br />
><br />
s:::<br />
o<br />
+:i<br />
ctI<br />
••<br />
-s:::<br />
CI)<br />
CJ<br />
s:::<br />
o<br />
o<br />
c<br />
o<br />
m-s:::<br />
CI)<br />
:::s<br />
E<br />
w<br />
.qo<br />
CI)<br />
••<br />
:::s<br />
C)<br />
LL<br />
~oN<br />
~ >. ~<br />
>.<br />
-.s::. -<br />
~<br />
c <br />
o <br />
E 3=<br />
<br />
OJ<br />
('\J<br />
'-<br />
<br />
~<br />
CO<br />
.•..<br />
OJ<br />
ro<br />
•...<br />
> ><br />
~~<br />
:::J:!::::!::::<br />
-- E E<br />
OJ .- .-<br />
E.~~<br />
o E E<br />
0 •...•...<br />
<br />
(QQ..Q..<br />
. II<br />
I<br />
•<br />
o<br />
-.:i<br />
.•..<br />
o<br />
Ṇ •..<br />
o<br />
ọ •..<br />
o<br />
cO<br />
•<br />
1'1<br />
= I•<br />
•I<br />
1'1<br />
•<br />
•<br />
I<br />
I<br />
• I<br />
[<br />
I<br />
II<br />
I I<br />
••<br />
•<br />
I<br />
• I<br />
I<br />
•<br />
II<br />
•<br />
I<br />
+<br />
I<br />
•<br />
•<br />
II<br />
• II<br />
•<br />
•<br />
I<br />
I I<br />
·~ .<br />
• II<br />
• iii !<br />
••<br />
Ii<br />
I<br />
o<br />
N<br />
~<br />
I<br />
80-uer<br />
Lo-~aa<br />
LO-AON<br />
LO-1.:>O<br />
d LO-daS<br />
- LO-6nV<br />
I90-60'"<br />
90-lnr<br />
90-unr<br />
• 90-qa.:l<br />
I<br />
LO-JeW<br />
LO-qa.:l<br />
LO-uer<br />
• 90-:>aa -5<br />
90-AON c: o<br />
~<br />
90-1.:>0<br />
90-~ew<br />
90-JdV<br />
90-JeW<br />
90-uer<br />
~ so-:>aa<br />
SO-AON<br />
o<br />
LO-Inr<br />
,LO-unr<br />
Lo-~ew<br />
• LO-JdV<br />
I<br />
90-daS<br />
SO-1.:>O<br />
SO-daS
•<br />
I :!:::: ...-<br />
L- •<br />
£I aID -L-<br />
••• D<br />
::C2::-<br />
I•<br />
II.••<br />
:-<br />
•~ 0)<br />
a.. ••••<br />
oC 0) E a.. "E<br />
ca rn :!::: rn<br />
••.•.•<br />
•'R 0 0) "s 0)<br />
"E<br />
~<br />
•<br />
I •<br />
••flJ-' I<br />
.11<br />
••<br />
• I ~ iii<br />
ICI<br />
"<br />
,<br />
• II II<br />
.II.<br />
II "<br />
•<br />
-<br />
•<br />
Bo-uer<br />
0<br />
90-AoN 90-}:>0<br />
:E<br />
LO-AON LO-daS Lo-6n\f LO-unr Lo-~ew LO-Jd\f LO-qa.:l 90-:>aa 90-daS 90-6n\f 90-unr 90-~ew 90-Jd\f 90-qa.:l so-:>aa SO-AoN So-das Lo-:>aa LO-}:>O LO-Inr LO-uer 90-lnr 90-uer SO-}:>O LO-JeW 90-JeW<br />
c<br />
.c:<br />
r::<br />
o<br />
+:i<br />
m<br />
"i:<br />
m<br />
><br />
"C m<br />
o<br />
...J<br />
C<br />
o m<br />
-r::<br />
CD<br />
::s<br />
ew<br />
II)<br />
CD<br />
•••<br />
::s<br />
C)<br />
u..<br />
oit)<br />
N<br />
oN<br />
(pdd) sa08<br />
ọ ,..<br />
oit)<br />
o
Sep-05<br />
Oct-05<br />
Nov-05<br />
Dec-05<br />
o<br />
(:)<br />
iii<br />
..•.<br />
(:)<br />
N<br />
(:)<br />
I<br />
w<br />
(:)<br />
Ammonia-N<br />
~<br />
(:)<br />
•<br />
U1<br />
(:)<br />
(mg/L)<br />
en<br />
(:)<br />
"'"<br />
(:)<br />
co<br />
(:)<br />
co<br />
(:)<br />
..•.<br />
o<br />
(:)<br />
Jan-06<br />
Feb-06<br />
Mar-06<br />
Apr-06 ~<br />
•<br />
May-06<br />
Jun-06<br />
I!I<br />
•<br />
•<br />
I<br />
'TI<br />
CO<br />
r::<br />
..,<br />
CD<br />
0')<br />
..<br />
m<br />
3r::<br />
CD<br />
::::I-»<br />
Jul-06<br />
Aug-06<br />
Sep-06 ~<br />
Oct-06<br />
s:<br />
g Nov-06<br />
::r<br />
Dec-06<br />
Jan-07<br />
Feb-07<br />
II<br />
•<br />
Mar-07 -I I!I<br />
Apr-07<br />
May-07<br />
Jun-07<br />
Jul-07<br />
Aug-07<br />
Sep-07<br />
Oct-07<br />
Nov-07 Dec-07<br />
Jan-08<br />
II<br />
-1 II<br />
'II<br />
lIB "f II<br />
•<br />
I<br />
~ \J ~<br />
~ 3 3<br />
j::i: 0<br />
r :J<br />
~rijr<br />
;:;: Z<br />
W'3<br />
CD (Q<br />
r<br />
.., --<br />
DJ<br />
(Q~<br />
CD<br />
3<br />
o :J<br />
5'<br />
:$<br />
3 3<br />
o<br />
::::I<br />
i •<br />
z<br />
;::;:<br />
..,<br />
o<br />
CO<br />
CD<br />
::::I<br />
o<br />
o<br />
::::I<br />
(')<br />
CD<br />
::::I<br />
..,<br />
Q)-<br />
o<br />
::::I<br />
<<br />
Q)<br />
::::!.<br />
Q)<br />
~<br />
o<br />
::::I
-05<br />
Oet-06<br />
..•. N<br />
..•. :T Nov-06<br />
• Dee-06 I<br />
Aug-06 Aug-07 Nov-05 May-06 May-07 Nov-07 Mar-06 Mar-07 Dee-07 Jan-08 Dee-05 Jan-06 Feb-06 Apr-D6 Jan-07 Apr-07 Sep-06 Sep-07 Jun-06 Jun-07 Oet-07 Oet-05 Jul-06 Jul-D7 I<br />
:::J<br />
0 0<br />
0<br />
s:<br />
0<br />
I<br />
w<br />
o<br />
Total N (mg/L)<br />
~<br />
o<br />
UI<br />
o<br />
a><br />
o<br />
•<br />
•<br />
•<br />
•<br />
•<br />
•<br />
•<br />
•<br />
•<br />
••<br />
•<br />
•<br />
.....•<br />
o<br />
00<br />
o<br />
,fl~!:~~?<br />
CD<br />
o<br />
II,<br />
.LC. -~c.-· '-<br />
_f~:"<br />
~;0tt~+~~:~<br />
:~-~--::::--::~-._-~-~_. --.:<br />
~7C~.<br />
...... _-<br />
- --<br />
,-...-~z=..'<br />
.~-......--. ...,.,.".... ---<br />
..•.<br />
o<br />
__ .=,:'=yo-,,_c<br />
_~t~t~~~<br />
:=:'4J>.-;;:.<br />
-.<br />
."<br />
cc c:<br />
""'II<br />
co<br />
..<br />
••••••<br />
m<br />
:B<br />
c:<br />
co<br />
::::J--I<br />
o-D)-Z<br />
•<br />
•<br />
1:,-",· . : :<br />
;:;:<br />
""'II<br />
o<br />
CC<br />
co<br />
::::J<br />
oo<br />
::::J<br />
o<br />
co<br />
::::J""'II<br />
I I·<br />
•• ~ I. I<br />
D)-o<br />
::::J<br />
<<br />
D)<br />
""'II<br />
su'<br />
~<br />
o<br />
::::J<br />
II<br />
•<br />
•<br />
•<br />
-- --
Aerobic<br />
SRT (days)<br />
0<br />
(:)<br />
Sep-05<br />
Oct-05<br />
Nov-05<br />
Dec-05<br />
Jan-06<br />
Feb-06<br />
Mar-06<br />
Apr-06<br />
May-06<br />
Jun-06<br />
Jul-06<br />
Aug-06 ~<br />
Sep-06<br />
s:<br />
Oct-06<br />
0<br />
Nov-06<br />
::s<br />
••<br />
::r<br />
Dec-06<br />
Jan-07<br />
Feb-07<br />
Mar-07<br />
Apr-07<br />
May-07<br />
Jun-07<br />
Jul-07<br />
Aug-07<br />
Sep-07<br />
Oct-07<br />
Nov-07<br />
Dec-07<br />
Jan-08<br />
U'I<br />
(:)<br />
..•.<br />
o<br />
(:)<br />
..•.<br />
U'I<br />
(:)<br />
No<br />
(:)<br />
I I<br />
» 0<br />
(") CD<br />
•..•••<br />
(f)<br />
c: _.<br />
w<br />
(,Q<br />
- :J<br />
N<br />
U'I<br />
(:)<br />
'T1<br />
-.<br />
(Q c:<br />
.,<br />
CD<br />
co<br />
:t><br />
CD<br />
.,<br />
o<br />
C"<br />
n<br />
(J)<br />
:;0<br />
-I<br />
t<br />
•• t t ,.,..- I<br />
) SSlW<br />
I<br />
J,<br />
90-uer<br />
..Q ~~ ~ LO-AONI<br />
·x O(/)(/) E<br />
0E III~r"<br />
LO-Inr<br />
;1t~<br />
OJ =It: "I"""" I~I 'i:<br />
IDCCCC<br />
I<br />
~ =It: Lo-~ew<br />
I~ Lo-:>aa<br />
LO-daS Lo-6n"<br />
LO-Jd"<br />
III<br />
I<br />
LO-JeW I<br />
> Ir LO-qa::J I<br />
0<br />
I It<br />
t<br />
<strong>1.0</strong> -<br />
ril<br />
C LO-uer<br />
s: 'OtMN..•..<br />
cit)<br />
~<br />
«I<br />
90-:>aa 0<br />
t<br />
I<br />
90-AON 90-1:>0<br />
90-lnr 90-das<br />
~ :E<br />
LL en :E,, Q)<br />
90-~ew 9Q-Jd" 90-6n"<br />
90-qa::J 90-uer 90-:>aa 90-AON 90-daS 90-JeW 90-1:>0<br />
I<br />
~<br />
I 19~unr<br />
tL~~O I L~unr~


