Drop impact of yield-stress fluids - iusti
Drop impact of yield-stress fluids - iusti
Drop impact of yield-stress fluids - iusti

You also want an ePaper? Increase the reach of your titles
YUMPU automatically turns print PDFs into web optimized ePapers that Google loves.
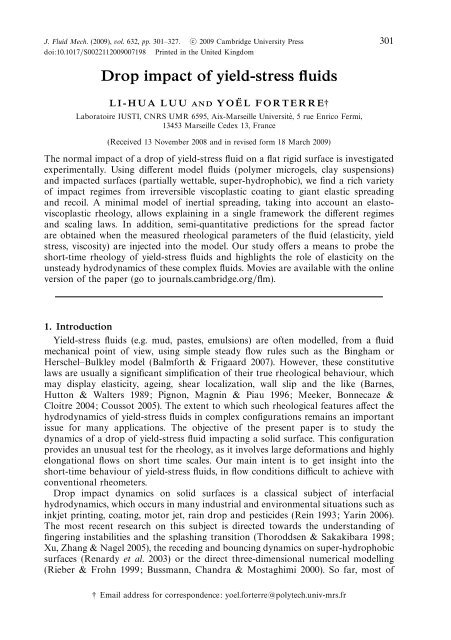
J. Fluid Mech. (2009), vol. 632, pp. 301–327. c○ 2009 Cambridge University Press<br />
doi:10.1017/S0022112009007198 Printed in the United Kingdom<br />
301<br />
<strong>Drop</strong> <strong>impact</strong> <strong>of</strong> <strong>yield</strong>-<strong>stress</strong> <strong>fluids</strong><br />
L I - H U A L U U AND YOË L F O R T E R R E†<br />
Laboratoire IUSTI, CNRS UMR 6595, Aix-Marseille Université, 5 rue Enrico Fermi,<br />
13453 Marseille Cedex 13, France<br />
(Received 13 November 2008 and in revised form 18 March 2009)<br />
The normal <strong>impact</strong> <strong>of</strong> a drop <strong>of</strong> <strong>yield</strong>-<strong>stress</strong> fluid on a flat rigid surface is investigated<br />
experimentally. Using different model <strong>fluids</strong> (polymer microgels, clay suspensions)<br />
and <strong>impact</strong>ed surfaces (partially wettable, super-hydrophobic), we find a rich variety<br />
<strong>of</strong> <strong>impact</strong> regimes from irreversible viscoplastic coating to giant elastic spreading<br />
and recoil. A minimal model <strong>of</strong> inertial spreading, taking into account an elastoviscoplastic<br />
rheology, allows explaining in a single framework the different regimes<br />
and scaling laws. In addition, semi-quantitative predictions for the spread factor<br />
are obtained when the measured rheological parameters <strong>of</strong> the fluid (elasticity, <strong>yield</strong><br />
<strong>stress</strong>, viscosity) are injected into the model. Our study <strong>of</strong>fers a means to probe the<br />
short-time rheology <strong>of</strong> <strong>yield</strong>-<strong>stress</strong> <strong>fluids</strong> and highlights the role <strong>of</strong> elasticity on the<br />
unsteady hydrodynamics <strong>of</strong> these complex <strong>fluids</strong>. Movies are available with the online<br />
version <strong>of</strong> the paper (go to journals.cambridge.org/flm).<br />
1. Introduction<br />
Yield-<strong>stress</strong> <strong>fluids</strong> (e.g. mud, pastes, emulsions) are <strong>of</strong>ten modelled, from a fluid<br />
mechanical point <strong>of</strong> view, using simple steady flow rules such as the Bingham or<br />
Herschel–Bulkley model (Balmforth & Frigaard 2007). However, these constitutive<br />
laws are usually a significant simplification <strong>of</strong> their true rheological behaviour, which<br />
may display elasticity, ageing, shear localization, wall slip and the like (Barnes,<br />
Hutton & Walters 1989; Pignon, Magnin & Piau 1996; Meeker, Bonnecaze &<br />
Cloitre 2004; Coussot 2005). The extent to which such rheological features affect the<br />
hydrodynamics <strong>of</strong> <strong>yield</strong>-<strong>stress</strong> <strong>fluids</strong> in complex configurations remains an important<br />
issue for many applications. The objective <strong>of</strong> the present paper is to study the<br />
dynamics <strong>of</strong> a drop <strong>of</strong> <strong>yield</strong>-<strong>stress</strong> fluid <strong>impact</strong>ing a solid surface. This configuration<br />
provides an unusual test for the rheology, as it involves large deformations and highly<br />
elongational flows on short time scales. Our main intent is to get insight into the<br />
short-time behaviour <strong>of</strong> <strong>yield</strong>-<strong>stress</strong> <strong>fluids</strong>, in flow conditions difficult to achieve with<br />
conventional rheometers.<br />
<strong>Drop</strong> <strong>impact</strong> dynamics on solid surfaces is a classical subject <strong>of</strong> interfacial<br />
hydrodynamics, which occurs in many industrial and environmental situations such as<br />
inkjet printing, coating, motor jet, rain drop and pesticides (Rein 1993; Yarin 2006).<br />
The most recent research on this subject is directed towards the understanding <strong>of</strong><br />
fingering instabilities and the splashing transition (Thoroddsen & Sakakibara 1998;<br />
Xu, Zhang & Nagel 2005), the receding and bouncing dynamics on super-hydrophobic<br />
surfaces (Renardy et al. 2003) or the direct three-dimensional numerical modelling<br />
(Rieber & Frohn 1999; Bussmann, Chandra & Mostaghimi 2000). So far, most <strong>of</strong><br />
† Email address for correspondence: yoel.forterre@polytech.univ-mrs.fr
302 L.-H. Luu and Y. Forterre<br />
the studies have concerned Newtonian <strong>fluids</strong>. More recently, non-Newtonian effects<br />
(e.g. normal <strong>stress</strong>es, elasticity) have also been investigated by adding polymers or<br />
surfactants in the fluid (Cooper-White, Crooks & Boger 2002; Bartolo et al. 2007).<br />
However, in some practical circumstances, the fluid used is more complex and may<br />
display a flow threshold: at low <strong>stress</strong>es the fluid behaves like a solid, but above a<br />
critical <strong>stress</strong>, it <strong>yield</strong>s and flows. A few examples are spray painting and inkjet printing<br />
<strong>of</strong> three-dimensional structures, using colloidal gels (Lewis 2006). On the other hand,<br />
the study <strong>of</strong> <strong>impact</strong>s <strong>of</strong> <strong>yield</strong>-<strong>stress</strong> <strong>fluids</strong> may be regarded as a laboratory model for<br />
investigating high-speed collision <strong>of</strong> solids, such as ballistic <strong>impact</strong> (Yarin, Rubin &<br />
Roisman 1995), <strong>impact</strong> crater formation (Melosh 1989) and explosive welding<br />
(Crossland 1982). In this case, an important parameter is the ratio <strong>of</strong> the <strong>impact</strong>ing<br />
dynamic pressure ρV0 2 (ρ is the object density and V 0 is the <strong>impact</strong>ing velocity) to<br />
the material <strong>yield</strong> <strong>stress</strong> τ c (Johnson 1985). Since typical <strong>yield</strong>-<strong>stress</strong> <strong>fluids</strong> (gels, clays,<br />
emulsions) have strengths millions <strong>of</strong> times below those <strong>of</strong> metals or soils (few tens<br />
<strong>of</strong> Pa compared to few tens <strong>of</strong> MPa), their <strong>impact</strong> at low velocities (V 0 ∼ ms −1 )<br />
could mimic the extreme collision speeds (V 0 ∼ km s −1 ) for which the classical solid<br />
flows (Awerbuch & Bodner 1974).<br />
To date, there have been very few controlled studies <strong>of</strong> drop <strong>impact</strong>s involving<br />
threshold <strong>fluids</strong>. In a recent paper, Nigen (2005) has investigated the spreading<br />
dynamics <strong>of</strong> droplets <strong>of</strong> Vaseline <strong>impact</strong>ing a smooth Plexiglas surface. However,<br />
the experimental conditions were such (small drop diameter, high viscosity, low<br />
<strong>yield</strong> <strong>stress</strong>) that viscous effects mostly dominated the spreading dynamics. Yet, an<br />
interesting observation was that the <strong>yield</strong> <strong>stress</strong> could inhibit the capillary recoil<br />
and ‘freeze’ the drop shape at its maximal deformation. This suggests that, unlike<br />
Newtonian <strong>fluids</strong>, the <strong>impact</strong> dynamics <strong>of</strong> a <strong>yield</strong>-<strong>stress</strong> fluid may be mainly controlled<br />
by its intrinsic rheology rather than by capillary effects or surface wetting properties.<br />
To test this, we will study drop <strong>impact</strong>s <strong>of</strong> <strong>yield</strong>-<strong>stress</strong> <strong>fluids</strong> for a wide range <strong>of</strong> rheological<br />
parameters (elasticity, <strong>yield</strong> <strong>stress</strong>, viscosity) and <strong>impact</strong>ed surfaces (partially<br />
wetting, super-hydrophobic). We will mainly focus on the physical mechanisms that<br />
control the maximal spread factor, defined as the maximal drop extension during the<br />
<strong>impact</strong> L m divided by the drop initial size L 0 . For Newtonian <strong>fluids</strong>, empirical scaling<br />
laws have been proposed, depending on whether the initial kinetic energy is mostly<br />
converted into surface energy or dissipated by viscosity (Chandra & Avedisian 1991;<br />
Clanet et al. 2004). For <strong>yield</strong>-<strong>stress</strong> <strong>fluids</strong>, two obvious complications arise. First, the<br />
existence <strong>of</strong> a threshold introduces an additional plastic-like dissipation mechanism.<br />
Second, these <strong>fluids</strong> usually display a non-Newtonian shear-rate-dependent viscosity,<br />
which should modify the classical viscous-spreading laws.<br />
A more complex issue concerns the role <strong>of</strong> the elastic deformations in the spreading<br />
dynamics. For most flow problems involving <strong>yield</strong>-<strong>stress</strong> <strong>fluids</strong>, elasticity is neglected<br />
as soon as the material is above the flow threshold. However, this is far from<br />
being obvious in the case <strong>of</strong> <strong>impact</strong>ing drops in which highly time-dependant and<br />
elongational flows are considered. This interplay between flow, elasticity and viscosity<br />
is well known in polymer fluid mechanics (Bird, Armstrong & Hassager 1987) but has<br />
been less investigated for <strong>yield</strong>-<strong>stress</strong> <strong>fluids</strong>. Recently, elasto-viscoplastic constitutive<br />
laws have been proposed that consistently take into account this coupling for s<strong>of</strong>t<br />
disordered materials such as foams, emulsions and polymer pastes (Takeshi &<br />
Sekimoto 2005; Marmottant & Graner 2007; Saramito 2007; Bénito et al. 2008).<br />
They have proven promising in capturing interesting features <strong>of</strong> s<strong>of</strong>t viscoplastic<br />
<strong>fluids</strong> such as normal <strong>stress</strong>, transient flows and localization in Couette geometries<br />
(Cheddadi et al. 2008).
<strong>Drop</strong> <strong>impact</strong> <strong>of</strong> <strong>yield</strong>-<strong>stress</strong> <strong>fluids</strong> 303<br />
In this paper, we gain from these approaches to understand, within a single<br />
framework, the different regimes and scaling laws that control the drop <strong>impact</strong><br />
dynamics <strong>of</strong> a <strong>yield</strong>-<strong>stress</strong> fluid. We first present the experimental set-up and <strong>yield</strong><strong>stress</strong><br />
<strong>fluids</strong> used in § 2. The different <strong>impact</strong> regimes observed on partially wetting<br />
and super-hydrophobic surfaces are presented in § 3. We show that elasticity may<br />
play a crucial role in the spreading dynamics, even when the drop deformations are<br />
far above the flow threshold. To explain this observation, a minimal temporal model<br />
<strong>of</strong> spreading is built, where drop inertia is balanced by an elasto-viscoplastic basal<br />
<strong>stress</strong> (§ 4). The comparison between experiments and the simplified model is given in<br />
§ 5, focusing more specifically on the maximal spread factor. A discussion and some<br />
questions raised by this study are given in the conclusion (§ 6).<br />
2. Experimental methods<br />
2.1. Yield-<strong>stress</strong> <strong>fluids</strong><br />
Three different kinds <strong>of</strong> <strong>yield</strong>-<strong>stress</strong> <strong>fluids</strong> were used to perform the experiments:<br />
two colloidal suspensions <strong>of</strong> clay (kaolin and bentonite; van Olphen 1977) and one<br />
polymer micro-gel suspension (Carbopol dispersion; Oppong et al. 2006; Piau 2007).<br />
These <strong>fluids</strong> are known to present a <strong>yield</strong> <strong>stress</strong> above a critical concentration and are<br />
widely used as model viscoplastic <strong>fluids</strong> in the literature (Coussot 1994; Osmond &<br />
Griffiths 2001; de Bruyn, Habdas & Kim 2002; Peixinho et al. 2005; Tabuteau,<br />
Coussot & de Bruyn 2007; Chambon, Ghemmour & Laigle 2008). In addition, they<br />
allow spanning a broad range <strong>of</strong> mechanical and rheological parameters by changing<br />
the concentration <strong>of</strong> the suspension. In the following, we will focus on the elastic<br />
and viscoplastic properties <strong>of</strong> clays and Carbopol suspensions. We will disregard<br />
other rheological features that may affect these <strong>fluids</strong> close the flow threshold, such<br />
as creeping, thixotropy and microstructural orientation effects (Pignon, Magnin &<br />
Piau 1997; Coussot 2005; Piau 2007). We will see that the knowledge <strong>of</strong> the elastoviscoplastic<br />
parameters indeed is sufficient to describe the main features <strong>of</strong> the drop<br />
<strong>impact</strong> dynamics observed in our experiments.<br />
The slurries <strong>of</strong> kaolin (supplied by Miniere Kaolins Morbihan, France) and<br />
bentonite (supplied by VWR Prolabo) were prepared by gradually adding a given<br />
mass <strong>of</strong> clay powder with de-ionized water under continuous and active mixing. The<br />
suspensions were then stored for 72 h to ensure a complete hydration and dispersion<br />
<strong>of</strong> the clay particles. Prior to any test, the slurries were mixed again for 1 h. Note that,<br />
compared to kaolin, benonite suspensions are strongly thixotropic, meaning that their<br />
mechanical properties (elasticity, <strong>yield</strong> <strong>stress</strong>) evolve at rest. In this study, we used<br />
two different concentrations <strong>of</strong> kaolin and bentonite suspensions (see table 1, where<br />
the weight percentage gives the ratio between the total mass <strong>of</strong> particles to the total<br />
mass <strong>of</strong> particles and water initially mixed). Carbopol dispersions (Carbopol ETD<br />
2050 supplied by Noveon) were prepared by adding slowly Carbopol powder into<br />
de-ionized water at 50 ◦ C, under continuous stirring during several hours at 500 rpm.<br />
Sodium hydroxide solution at 18 % was then progressively added to bring the pH<br />
up to 7. A post-mixing at 700 rpm during 9 h was required to eliminate lumps and<br />
air bubbles, resulting in a transparent gel. For the experiments, we used six different<br />
concentrations <strong>of</strong> Carbopol from 0.2 % to 3 % in weight (see table 1). In all cases, the<br />
final suspension density was measured by weighting 10 syringes <strong>of</strong> 30 ml accurately<br />
filled with the fluid (table 1; accuracy better than 1 %). Finally, the surface tension σ<br />
<strong>of</strong> the <strong>fluids</strong>, which are aqueous dispersions without any surfactant, was assumed to be<br />
equal to that <strong>of</strong> pure water, σ =0.07 N m −1 . We did not determine directly the surface
304 L.-H. Luu and Y. Forterre<br />
Weight<br />
Fluid (%) τ c (Pa) K (Pa s n ) n G (Pa) G ′′ (Pa) ρ (kg m −3 ) L 0 (mm) D (mm)<br />
Carbopol<br />
C02 0.2 3.9 3.2 0.50 28 5.0 1010 7.6 8<br />
C035 0.35 8.4 5.1 0.50 47 7.3 1010 8.0 8<br />
C05 0.5 14 8.0 0.50 61 8.9 1020 8.7 8<br />
C1 1 24 11 0.50 85 12 1020 12 12<br />
C2 2 52 18 0.50 135 21 1020 17.5 17<br />
C3 3 92 32 0.50 270 36 1020 25 27<br />
Bentonite<br />
B13 13 68 0.12 0.96 2400 60 1090 16 14<br />
B15 15 124 0.16 0.96 3800 120 1090 29.5 27<br />
Kaolin<br />
K51 51 50 36 0.36 37 000 6500 1630 20 20<br />
K55 55 91 68 0.36 200 000 69 000 1630 26.5 27<br />
Table 1. Properties <strong>of</strong> the <strong>fluids</strong>, drop size L 0 and syringe diameters D.<br />
tension because most measurement methods are corrupted by the fluid <strong>yield</strong> <strong>stress</strong><br />
and elasticity. However, recent measurements in agar gels using surface-deformation<br />
spectroscopy confirm that the surface tension <strong>of</strong> aqueous gels is close to (but<br />
slightly lower than) that <strong>of</strong> water (Yoshitake et al. 2008). The value σ =0.07 N m −1<br />
should therefore be taken as an upper bound for the real surface tension <strong>of</strong> our<br />
<strong>fluids</strong>.<br />
Bulk rheological measurements <strong>of</strong> each fluid were made in a rotational Anton Paar<br />
MCR 501 controlled-<strong>stress</strong> rheometer. The samples were contained within a plateand-cone<br />
geometry 5 cm in diameter. The tool surfaces were roughened to minimize<br />
wall slip, and special care was taken to avoid evaporation during the tests (Magnin &<br />
Piau 1990). We performed both steady-state shear and oscillatory measurements.<br />
In the steady-state measurements, the shear <strong>stress</strong> τ was measured as function <strong>of</strong><br />
the applied shear rate ˙γ , by decreasing the shear rate step-by-step in the range<br />
10 −1 –10 3 s −1 and averaging the measured shear <strong>stress</strong> over 100 s. In the oscillatory<br />
measurements, a small sinusoidal shear strain was applied and the resulting shear<br />
<strong>stress</strong> measured. The in-phase and out-<strong>of</strong>-phase components <strong>of</strong> the response give the<br />
elastic shear modulus G and the viscous loss modulus G ′′ , respectively.<br />
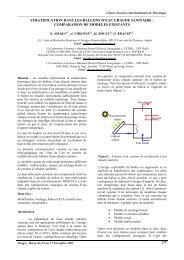
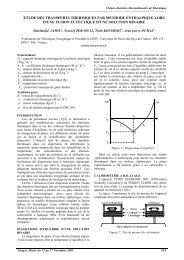
Figure 1 presents typical steady-state flow curves for the three kinds <strong>of</strong> <strong>fluids</strong>. Each<br />
point represents an average over two samples (see § 2.2). We observe that all <strong>fluids</strong><br />
display a <strong>yield</strong> <strong>stress</strong> and are shear-thinning above the flow threshold. The flow curves<br />
are fairly well represented by a Herschel–Bulkley model: τ = τ c + K ˙γ n , where τ c is<br />
the fluid <strong>yield</strong> <strong>stress</strong>, K the fluid consistency and n the flow index (Barnes et al.<br />
1989). For bentonite, the Herschel–Bulkley model is less accurate, especially at low<br />
shear rates at which the <strong>stress</strong> appears to increase when the shear rate decreases.<br />
This <strong>stress</strong> minimum in the flow curve has been documented before and is likely<br />
related to the thixotropic nature <strong>of</strong> this fluid, which may cause flow inhomogeneities<br />
inside the sample at low shear rates (Pignon et al. 1996). Determinations <strong>of</strong> the<br />
Herschel–Bulkley parameters were obtained using a nonlinear parameter fitting, by<br />
fixing the value <strong>of</strong> n for each fluid. For bentonite, only the monotonic part <strong>of</strong> the<br />
flow curve has been fitted. We have checked that fitting the whole flow curve only<br />
results in small changes <strong>of</strong> the rheological parameters that do not modified the main<br />
results <strong>of</strong> the study. Values <strong>of</strong> the rheological parameters obtained for all <strong>fluids</strong> are
<strong>Drop</strong> <strong>impact</strong> <strong>of</strong> <strong>yield</strong>-<strong>stress</strong> <strong>fluids</strong> 305<br />
500<br />
500<br />
400<br />
400<br />
300<br />
200<br />
300<br />
100<br />
τ (Pa)<br />
200<br />
0<br />
0<br />
200<br />
400<br />
γ˙ (s –1 )<br />
600<br />
800<br />
1000<br />
100<br />
0<br />
0.1 1 10 10 2 10 3<br />
γ˙ (s –1 )<br />
Figure 1. Examples <strong>of</strong> steady-state flow curves for each fluid in semi-log coordinates:<br />
kaolin 51 % (△), Carbopol 1 % (○), bentonite 13 % (). The continuous lines give the<br />
Herschel–Bulkley fit (see table 1). Inset: same data in lin–lin coordinates.<br />
collected in table 1. As expected, both the <strong>yield</strong> <strong>stress</strong> and the consistency increase<br />
with the material concentration. All <strong>fluids</strong> show a similar <strong>yield</strong> <strong>stress</strong>, bentonite being<br />
less ‘viscous’ than kaolin and Carbopol. Note that the overall uncertainty on τ c and<br />
K is about 10 % due to material reproducibility and fitting procedure.<br />
The elastic shear modulus G obtained from the oscillatory measurement is also<br />
given in table 1. It was shown to depend only weakly on the applied frequency (in<br />
the range 0.1–10 Hz) and strain amplitude, up to a critical strain γ c corresponding<br />
to the flow threshold. Below the threshold, we may thus assume the shear modulus<br />
constant for each fluid and define the critical strain by γ c ≡ τ c /G. Both the shear<br />
modulus and critical strain strongly depend on the material. Carbopol is very s<strong>of</strong>t<br />
and typically remains elastic up to 25 % strain, whereas bentonite is more rigid and<br />
starts to flow above 3 % strain. The kaolin slurry is the most rigid material with a<br />
critical strain less than 0.1 %. Values for G in table 1 are obtained at frequency 1<br />
Hz and amplitude strain 1 % (Carbopol) or 0.01 % (kaolin, bentonite). Uncertainties<br />
for G are about 7 % for Carbopol and 20 % for kaolin and bentonite. Note that<br />
below the flow threshold, the loss modulus G ′′ for all <strong>fluids</strong> was 3–40 times smaller<br />
than the elastic shear modulus, showing that these materials are essentially elastic at<br />
low <strong>stress</strong>es (table 1; the values for the loss modulus are given at the same strain<br />
amplitudes and frequency than for the elastic modulus).<br />
In the following, we will use the mechanical and rheological properties given in<br />
table 1 to analyse our <strong>impact</strong> experiments. However, for complex <strong>fluids</strong>, it is not<br />
obvious a priori that parameters deduced from simple shear flows are sufficient to<br />
describe more complex flow configurations such as drop <strong>impact</strong>s, which involve both<br />
shear and elongational flows. We have not performed elongational measurements <strong>of</strong>
306 L.-H. Luu and Y. Forterre<br />
(a)<br />
LED screen<br />
Translation<br />
stage<br />
Diffusing<br />
screen<br />
Spotlight<br />
High-speed camera<br />
Mirror<br />
Glass surface/<br />
super-hydrophobic<br />
surface<br />
(b)<br />
100<br />
Number <strong>of</strong> particles<br />
80<br />
60<br />
40<br />
20<br />
0<br />
50 130 210 290 370<br />
Effective diameter (µm)<br />
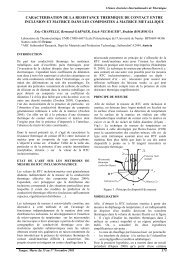
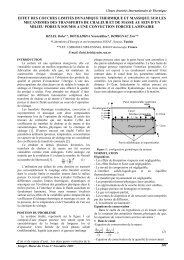
Figure 2. (a) Sketch <strong>of</strong> the experimental set-up and typical image obtained on the smooth<br />
glass surface. Scale bars, 12 mm. (b) Close-up view <strong>of</strong> the super-hydrophobic surface, made by<br />
gluing one layer <strong>of</strong> hydrophobic sand on the glass plane. The plot gives the distribution over<br />
460 sand particles <strong>of</strong> the effective diameter, defined as √ 4a/π, where a is the projected area <strong>of</strong><br />
the grain. Scale bars, 0.4 mm.<br />
our <strong>fluids</strong>. However, several studies on clays and Carbopol suggest that rheological<br />
parameters measured in simple shear and uniaxial extension closely agree for these<br />
<strong>yield</strong>-<strong>stress</strong> <strong>fluids</strong> (O’Brien & Mackay 2002; Yarin et al. 2004; Mohamed Abdelhaye,<br />
Chaouche & Van Damme 2008).<br />
2.2. Impact experimental set-up<br />
The experimental set-up <strong>of</strong> drop <strong>impact</strong> is sketched in figure 2(a). <strong>Drop</strong>s are slowly<br />
extruded from a cut plastic syringe (inner diameter D =8−27 mm), using a motorized<br />
translation stage (1 mm s −1 ). After a fall height 1–145 cm (giving an <strong>impact</strong>ing velocity
<strong>Drop</strong> <strong>impact</strong> <strong>of</strong> <strong>yield</strong>-<strong>stress</strong> <strong>fluids</strong> 307<br />
V 0 =0.4−5.6ms −1 ), drops impinge on to a 1 cm thick and 50 cm wide rigid horizontal<br />
glass plate. The <strong>impact</strong> dynamics are visualized using a high-speed camera (Photron<br />
Fastcam APX RS, 5000 Hz, 512 × 1024 pixels) with a microlens (Sigma 24–70 mm<br />
1:2.8 EX DG). An inclined mirror settled under the glass surface allows monitoring<br />
both the side and bottom views at the same time. The drop is backlighted using<br />
an LED lighting screen (Phlox) and a 500 W spotlight through a diffusing paper.<br />
A typical image obtained with Carbopol 1 wt % is shown in figure 2(a). From the<br />
bottom view, the instantaneous drop’s contact area A(t) is extracted using standard<br />
threshold and edge-detection algorithms (s<strong>of</strong>tware ImageJ, http://rsbweb.nih.gov/ij/).<br />
It is worth noting that in most experiments the Laplace pressure due to the surface<br />
tension σ/D is small compared to the fluid <strong>yield</strong> <strong>stress</strong> τ c . In this case, the shape<br />
and size <strong>of</strong> the extruded drop are not controlled by the surface tension but given<br />
by a complex balance between gravity, <strong>yield</strong> <strong>stress</strong> and extrusion speed (Coussot &<br />
Gaulard 2005), resulting in bottle-shaped drops (figure 2a). To define the initial drop<br />
size L 0 , we thus averaged over 20 launches the drop weight m and defined L 0 as<br />
the diameter <strong>of</strong> the equivalent sphere <strong>of</strong> same volume: L 0 ≡ (6m/πρ) 1/3 (table 1; the<br />
dispersion for each value ranges from 3 % to 13 %). Note that this quantity gives no<br />
information about the drop shape. In all the experiments, we have adjusted for each<br />
fluid the syringe diameter D, in order to get an aspect ratio L 0 /D always close to 1<br />
(table 1).<br />
We performed experiments using two kinds <strong>of</strong> <strong>impact</strong>ed surfaces: a partially wetting<br />
surface and a super-hydrophobic surface. The partially wetting surface was made <strong>of</strong><br />
smooth float glass, with a water static contact angle <strong>of</strong> about 42 ◦ . The superhydrophobic<br />
surface was made by gluing one layer <strong>of</strong> hydrophobic sand (supplied<br />
by the toys fabricant Tobar under the name ‘Underwater Sculpting Sand’) with a<br />
transparent spray on the glass surface (figure 2b). The sand-grain size distribution<br />
measured with a digital imaging system was observed to be approximately Gaussian<br />
with a mean effective diameter <strong>of</strong> 265 ± 55 µm (the error corresponds to the standard<br />
deviation; see figure 2b). The compactness <strong>of</strong> the glued granular layer, defined as the<br />
ratio between the projected area <strong>of</strong> the grains to the total area, was about 0.8 ± 0.05.<br />
The resulting textured surface was highly hydrophobic with a water contact angle<br />
close to 180 ◦ . It was also highly non-adhesive for all the <strong>yield</strong>-<strong>stress</strong> <strong>fluids</strong> used.<br />
In this study, we adopted the following procedure in order to obtain reproducible<br />
measurements: First, to restrain structural ageing and/or external contamination,<br />
<strong>fluids</strong> were used by the week following their making and thoroughly mixed before the<br />
experiments. Their rheological properties were then averaged before and after each<br />
set <strong>of</strong> experiments, with typical fluctuations less than 10 %. Finally, for experiments<br />
with bentonite, which is thixotropic, suspensions were mixed and allowed to rest 1<br />
min before filling the syringe and releasing the drop. Note that we did not change the<br />
resting time before the experiments systematically. The main effect <strong>of</strong> increasing the<br />
resting time is to increase the <strong>stress</strong> needed to start the flow and hence to modify<br />
the size and shape <strong>of</strong> the extruded bentonite drop (Coussot & Gaulard 2005). The<br />
interplay between this ageing and the rapid fluid rejuvenation during the <strong>impact</strong> is<br />
an interesting question that we leave for future studies.<br />
3. Main observations<br />
3.1. Spreading dynamics and maximal drop deformation<br />
Typical <strong>impact</strong> regimes observed with Carbopol drops on the smooth glass surface<br />
are shown in figure 3, where the <strong>impact</strong> velocity increases from top to bottom.
308 L.-H. Luu and Y. Forterre<br />
(a)<br />
(b)<br />
(c)<br />
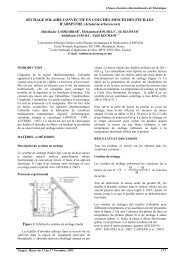
Figure 3. Typical <strong>impact</strong> sequences on a glass surface with Carbopol drops: (a) 1 wt%,<br />
V 0 =0.5 ms −1 ;(b) 1 wt%, V 0 =2.1 ms −1 ;(c) 0.2 wt%, V 0 =4.3 ms −1 . Time interval between<br />
the pictures: (a) 4 ms, (b) 5.6 ms, (c) 0.7 ms. Scale bars, 5 mm.<br />
At low velocities, the drop only weakly deforms, and one observes elastic ringing<br />
waves propagating along the free surface after the <strong>impact</strong> (figure 3a). For higher<br />
velocities, the drop spreads out radially along the surface. A thin liquid layer first<br />
jets out sideways from beneath the drop, while the rest <strong>of</strong> the drop keeps collapsing<br />
downward. After a few ms, the drop shape takes the form <strong>of</strong> a flattened disc that<br />
continues to spread until it reaches a maximal diameter L m (figure 3b). The free surface<br />
<strong>of</strong> the drop then flows back and oscillates, while the contact line remains anchored<br />
to the plane (figure 3b). Note that for kaolin and bentonite, similar behaviours are<br />
observed, except that the drops abruptly ‘freeze’ as soon as they reach their maximal<br />
deformation. Finally, for the largest velocities and/or lowest fluid concentrations, the<br />
spreading lamella may undergo a front instability that eventually <strong>yield</strong>s to a splash<br />
<strong>of</strong> the drop (figure 3c). For Newtonian <strong>fluids</strong>, the splashing transition is complex<br />
and depends on many features such as surface roughness, wetting properties, fluid<br />
viscosity and even surrounding gas pressure (Rein 1993; Yarin 2006). Understanding<br />
this transition for <strong>yield</strong>-<strong>stress</strong> <strong>fluids</strong> is beyond the scope <strong>of</strong> this study. In the following,<br />
we rather focus on the stable spreading regime, where the drop has an axisymmetric<br />
shape. Note that in some cases, a slight asymmetry <strong>of</strong> the spreading layer is observed<br />
because the drop is tilted when <strong>impact</strong>ing the surface (see for example figure 6).<br />
This initial inclination may promote the splashing transition but does not modify the<br />
spread factor. In the following, the instantaneous spread diameter <strong>of</strong> the drop L(t)<br />
will be accurately computed by L(t) ≡ √ 4A(t)/π, where A(t) is the measured drop’s<br />
contact area from below.<br />
Although the spreading scenario is common to all <strong>fluids</strong> used, the maximal extent<br />
reached by an impinging drop does depend on the fluid characteristics and not only<br />
on the <strong>impact</strong> velocity. Figure 4 presents the maximal spread factor, L m /L 0 , as a<br />
function <strong>of</strong> <strong>impact</strong> velocity V 0 for all <strong>fluids</strong>, drop sizes and <strong>impact</strong>ed surfaces studied.<br />
The maximal spread factor varies from approximately 1.2 to 6 for the velocity range<br />
investigated. For a given material and velocity, the spread factor tends to decrease
<strong>Drop</strong> <strong>impact</strong> <strong>of</strong> <strong>yield</strong>-<strong>stress</strong> <strong>fluids</strong> 309<br />
7<br />
6<br />
5<br />
Capillary limit<br />
L m<br />
4<br />
3<br />
2<br />
1<br />
0<br />
L 0<br />
g sh g sh<br />
C02<br />
C035<br />
C05<br />
C1<br />
C2<br />
C3<br />
B13<br />
B15<br />
K51<br />
K55<br />
0 1 2 3 4 5 6<br />
V 0 (m s –1 )<br />
Figure 4. Maximal spread factor as a function <strong>of</strong> <strong>impact</strong> velocity for all <strong>fluids</strong> and <strong>impact</strong>ed<br />
surfaces investigated: g, glass smooth surface; sh, super-hydrophobic surface. The error bars<br />
represent the dispersion over three drops. The dotted line gives a lower bound for the<br />
maximal spread factor limited by capillarity: L max /L 0 | cap = [(4 + We/3)/(1 − cos θ)] 1/2 , where<br />
We= ρV0 2L<br />
0/σ is the Weber number and θ the contact angle (Chandra & Avedisian 1991).<br />
To compute this theoretical limit, we take L 0 =7.6 mm, ρ = 1020 kg m −3 and θ = 180 ◦ , which<br />
correspond to the lowest values <strong>of</strong> L max /L 0 | cap in our case.<br />
when the suspension concentration increases. This concentration dependance is clear<br />
for Carbopol (see also figure 12a) but less obvious for clays, for which variations<br />
are within the experimental errors at low velocities (V 0 < 2ms −1 ). In figure 4, we<br />
also plot the maximal spread factor predicted when capillarity is the only mechanism<br />
that balances the initial kinetic energy (Chandra & Avedisian 1991). All data are well<br />
below this capillary limit, suggesting that bulk rheological properties, and not the<br />
surface tension, are controlling the arrest <strong>of</strong> drop spreading in our case. To confirm<br />
this hypothesis, we have performed further experiments using super-hydrophobic<br />
surfaces.<br />
3.2. Viscoplastic coating versus giant elastic recoil<br />
Figure 5 presents a typical dynamical sequence <strong>of</strong> a kaolin and a Carbopol drop<br />
<strong>impact</strong>ing a super-hydrophobic surface at moderate velocity. We first observe that<br />
the spreading dynamics are very similar to the one observed on the smooth glass<br />
surface. In particular, the maximal drop deformation is identical in both cases. This<br />
result is general: as long as <strong>impact</strong> velocity is not too large, the spreading phase is<br />
independent <strong>of</strong> the <strong>impact</strong>ed surface. For larger velocities, differences arise between<br />
the adhesive and non-adhesive surfaces; in particular, on super-hydrophobic surfaces,<br />
the splashing transition occurs sooner, and larger maximal deformations are observed<br />
(figure 4). We leave this point for future investigations.
310 L.-H. Luu and Y. Forterre<br />
(a)<br />
(b)<br />
Figure 5. (a) Viscoplastic coating versus (b) giant elastic recoil on a super-hydrophobic<br />
surface: (a) 55 wt% kaolin drop, time interval between the pictures 7 ms; (b) 1 wt% Carbopol<br />
drop, time interval between the pictures 6 ms. In both cases, the <strong>impact</strong> velocity is V 0 =2.8<br />
ms −1 . Scale bar, 1 cm.<br />
Figure 6. Bouncing <strong>of</strong> a 2 wt% Carbopol drop on a super-hydrophobic surface (V 0 =2.4<br />
ms −1 ). Time interval between the pictures is 8 ms. Scale bars, 10 mm.<br />
Although the spreading phase weakly depends upon the <strong>impact</strong>ed surface and fluid<br />
used, the receding dynamics on super-hydrophobic surfaces reveal striking differences<br />
between the clay and Carbopol drops. For clay drops, we observe no receding at<br />
all, as shown in figure 5(a) (see online movie 1, go to journals.cambridge.org/flm).<br />
Once it has reached its maximal extension, the drop maintains its flattened shape<br />
and irreversibly coats the plane, even though the surface is super-hydrophobic. This<br />
viscoplastic coating is peculiar to <strong>yield</strong>-<strong>stress</strong> <strong>fluids</strong> and confirms that in our cases the<br />
flow threshold is high enough to prevent the capillary retraction <strong>of</strong> the drop. However,<br />
<strong>impact</strong>s with Carbopol drops strongly contrast with this behaviour as shown in figure<br />
5(b) (see online movie 2). In this case, after the spreading phase, strong and rapid<br />
recoil is always observed, which may even be followed by a complete rebound (figure 6<br />
and online movie 3). A first possibility for this recoiling mechanism is the surface<br />
tension, as for Newtonian <strong>fluids</strong>. However, this is unlikely, since Carbopol drops<br />
have <strong>yield</strong> <strong>stress</strong>es comparable to those <strong>of</strong> the clays. A more appealing hypothesis<br />
is that Carbopol drops deform and retract elastically, much like a bouncing ball<br />
<strong>of</strong> gel (Tanaka, Yamazaki & Okumura 2003). However, within the range <strong>of</strong> <strong>impact</strong><br />
velocity considered, the drop deformations are between 100 % and 500 %, which is<br />
much beyond the flow threshold deduced from the steady rheological measurements<br />
(γ c ≈ 25 %). This suggests that for Carbopol drops, viscoelastic effects occur: during
<strong>Drop</strong> <strong>impact</strong> <strong>of</strong> <strong>yield</strong>-<strong>stress</strong> <strong>fluids</strong> 311<br />
Slow<br />
3<br />
(a)<br />
L(t)<br />
Fast<br />
2<br />
L(t)<br />
L 0<br />
1<br />
0<br />
0<br />
(b)<br />
3.0<br />
2.5<br />
2.0<br />
1.5<br />
1.0<br />
t (ms)<br />
0 5 10 15 20<br />
0.5 1.0 1.5 2.0<br />
t (min.)<br />
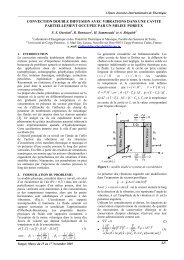
Figure 7. (a) Sketch <strong>of</strong> the experiment used to support the viscoelastic behaviour <strong>of</strong> Carbopol.<br />
A drop <strong>of</strong> Carbopol is quasi-statically squeezed between two super-hydrophobic surfaces and<br />
released by suddenly removing the upper plate. (b) Time evolution <strong>of</strong> the diameter <strong>of</strong> the<br />
drop during the experiment. The arrow indicates the sudden motion <strong>of</strong> the upper plate. For<br />
comparison, we give in the inset the dynamics <strong>of</strong> the same Carbopol drop (1 wt%) <strong>impact</strong>ing<br />
a super-hydrophobic surface and reaching an identical maximal spread factor (V 0 =2.8 ms −1 ).<br />
η ε el γ(t)<br />
τ c<br />
Figure 8. Mechanical representation <strong>of</strong> an elasto-viscoplastic fluid.<br />
G<br />
the rapid spreading phase, flow is faster than the fluid relaxation time, <strong>yield</strong>ing giant<br />
elastic deformations on short time scales.<br />
Further experiments on quasi-static squeezed drops supported this mechanism. To<br />
this end, Carbopol drops were slowly compressed between two super-hydrophobic<br />
surfaces up to a given spread factor (figure 7a). The upper plate was then suddenly<br />
removed, and the subsequent dynamics were recorded. We observe that, unlike<br />
impinging drops, these flattened drops never retract and keep their final shape<br />
(figure 7b). This experiment confirms that the surface tension alone cannot overcome<br />
the <strong>yield</strong> <strong>stress</strong> to recoil the drop. Besides, it highlights the crucial role <strong>of</strong> viscoelasticity<br />
in the case <strong>of</strong> Carbopol.<br />
A simple mechanical analogue to this elasto-viscoplastic behaviour is presented in<br />
figure 8, where the fluid is represented by an elastic spring together with a solid<br />
friction and viscous elements in parallel. When displacements γ (t) occur on time<br />
scales much larger than the relaxation time scale η/G, the response is either purely<br />
elastic (below the threshold) or fully viscoplastic (above the threshold). By contrast,<br />
when γ (t) varies on time scales much shorter than the relaxation time, the response<br />
is always dominated by the elastic component, even far beyond the flow threshold.<br />
In the following, we extend this simple model to predict the different <strong>impact</strong> regimes<br />
and spreading laws observed.
312 L.-H. Luu and Y. Forterre<br />
4. Elasto-viscoplastic model <strong>of</strong> inertial spreading<br />
Our experimental observations imply that in order to predict the drop <strong>impact</strong><br />
dynamics for all <strong>yield</strong>-<strong>stress</strong> <strong>fluids</strong> used, both the viscoplasticity and the elasticity<br />
<strong>of</strong> the material have to be taken into account within a time-dependant framework.<br />
Our aim in this section is to build a minimal model containing these ingredients.<br />
To this end, we will substitute the complex spatio-temporal <strong>impact</strong> dynamics for a<br />
much simpler, purely temporal model, where drop inertia is balanced by an elastoviscoplastic<br />
basal <strong>stress</strong> inspired by recent works on the rheology <strong>of</strong> s<strong>of</strong>t materials.<br />
4.1. Inertial spreading <strong>of</strong> a shallow disc<br />
Most theoretical descriptions <strong>of</strong> Newtonian drops <strong>impact</strong>ing a solid surface rely<br />
either on semi-empirical energy balances or on direct numerical simulations (Rein<br />
1993; Yarin 2006). Simplified spatio-temporal models have also been proposed, based<br />
on lubrication equations (Yarin 2006) or variational methods (Kim & Chun 2001).<br />
To our knowledge, no such model exists in the case <strong>of</strong> <strong>yield</strong>-<strong>stress</strong> <strong>fluids</strong>.<br />
Here, we consider the simplest time-dependent model <strong>of</strong> inertial spreading. The drop<br />
is modelled by a shallow disc (thickness h(t), radius R(t)) that spreads radially along<br />
the surface. Assuming the disc aspect ratio to be small (lubrication approximation)<br />
and integrating the mass and radial momentum balance across the depth gives<br />
(Appendix A)<br />
dh<br />
dt +2Uh =0, (4.1)<br />
R<br />
ρh dU = −τ b , (4.2)<br />
dt<br />
where U ≡ dR/dt is the front velocity and τ b is the basal shear <strong>stress</strong> between the<br />
spreading drop and the solid plane. The first equation is the mass conservation for<br />
an incompressible disc. The second equation is the radial momentum balance, where<br />
the drop inertia is simply balanced by the basal shear <strong>stress</strong>. Here both the gravity<br />
spreading term and the surface tension force arising at the circumferential surface <strong>of</strong><br />
the disc have been neglected. Those assumptions are reasonable in our case <strong>of</strong> high<br />
Froude numbers and high values <strong>of</strong> viscosity, <strong>yield</strong> <strong>stress</strong> and elasticity compared<br />
with the surface tension. We have also neglected any wetting phenomenon, such as<br />
hysteresis and dissipation at the contact line, that may affect the receding dynamics.<br />
We will return to this point in the conclusion.<br />
Within this simple model, the spreading dynamics are mainly controlled by the<br />
expression <strong>of</strong> the basal shear <strong>stress</strong>, while the contribution <strong>of</strong> the radial and hoop<br />
<strong>stress</strong> is neglected. This is valid as long as the spreading drop is thin (lubrication<br />
approximation) and does not slip at the solid plane, such that the dominant shear<br />
is across the layer. For complex <strong>fluids</strong>, the no-slip assumption could be addressed,<br />
as these <strong>fluids</strong> <strong>of</strong>ten exhibit a slip velocity on smooth surfaces (Meeker et al. 2004).<br />
However, slip velocities usually reported in <strong>yield</strong>-<strong>stress</strong> <strong>fluids</strong> (about 0.1 mm s −1 ) are<br />
much smaller than the <strong>impact</strong> velocities (about 1 m s −1 ). This means that the shear<br />
rate at the base scales as ˙γ ≈ U/h, which is much larger than the elongation rate<br />
U/R in the shallow limit. In the following, we thus assume the shear across the layer<br />
to be the dominant mode <strong>of</strong> the flow and discuss the choice <strong>of</strong> the basal shear <strong>stress</strong>,<br />
which embodies the fluid rheology.
<strong>Drop</strong> <strong>impact</strong> <strong>of</strong> <strong>yield</strong>-<strong>stress</strong> <strong>fluids</strong> 313<br />
4.2. Choice <strong>of</strong> the rheology<br />
Constitutive laws for viscoplastic <strong>fluids</strong> that incorporate elasticity have been the<br />
subjects <strong>of</strong> several studies in the past (e.g. Schwed<strong>of</strong>f 1890; Tyabin & Trusov<br />
1970; White 1979). Recently, there has been a renewal <strong>of</strong> such elasto-viscoplastic<br />
formulations applied to the rheology <strong>of</strong> s<strong>of</strong>t disordered materials such as foams,<br />
emulsions and gels (Takeshi & Sekimoto 2005; Marmottant & Graner 2007; Saramito<br />
2007; Bénito et al. 2008). The most classical way to introduce elasticity in a <strong>yield</strong><strong>stress</strong><br />
fluid is to suppose a purely elastic behaviour below the <strong>yield</strong> <strong>stress</strong> and a<br />
purely viscoplastic behaviour above the <strong>yield</strong> <strong>stress</strong> (see for example Mujumdar,<br />
Beris & Metzner 2002 and the references therein). However, this description does not<br />
account for viscoelastic-like effects allowing the material to transiently store large<br />
elastic deformations, as observed in our case <strong>of</strong> drop <strong>impact</strong>s with Carpobol. To<br />
circumvent this, several studies have extended the classical description <strong>of</strong> viscoelastic<br />
<strong>fluids</strong> used in polymers solutions (Bird et al. 1987) to <strong>yield</strong>-<strong>stress</strong> materials. The<br />
most advanced models are those <strong>of</strong> Saramito 2007 and Bénito et al. 2008. In these<br />
approaches, the constitutive law is composed <strong>of</strong> two parts. First, the <strong>stress</strong> tensor<br />
is given by an elastic law. Secondly, there is a transport equation for the elastic<br />
deformation, stipulating that the deformation relaxes only when it is above a critical<br />
strain (i.e. a <strong>yield</strong> <strong>stress</strong>). These equations constitute a tensorial generalization <strong>of</strong> the<br />
mechanical model given in figure 8. In addition, Saramito’s (2007) model is built to<br />
recover a Bingham constitutive law in the rigid limit. The great advantage <strong>of</strong> these<br />
full tensorial approaches is that they properly account for nonlinear effects such as<br />
finite deformations, elongational flows and normal <strong>stress</strong>es. They have been applied<br />
to simple unidirectional flows, such as uniaxial flows and simple or oscillatory shear<br />
flows (Saramito 2007; Bénito et al. 2008). However, these are difficult to solve in<br />
higher dimensions, even in basic configurations (Cheddadi et al. 2008). Moreover,<br />
they do not describe the Herschel–Bulkley shear-thinning observed in steady shear<br />
with our <strong>fluids</strong>.<br />
Here we use a simple scalar version <strong>of</strong> Saramito’s (2007) model for the basal shear<br />
<strong>stress</strong>, which we modify in order to recover a Herschel–Bulkley behaviour for steady<br />
flows. The basal shear <strong>stress</strong> τ b is written as<br />
with<br />
⎧<br />
⎪⎨<br />
⎪⎩<br />
dɛ el<br />
dt<br />
= ˙γ if |ɛ el | < γ c ,<br />
= ˙γ − 1 λ<br />
τ b = Gɛ el , (4.3)<br />
|ɛ el | − γ c<br />
ɛ el if |ɛ el | > γ<br />
|ɛ el c .<br />
|<br />
(4.4)<br />
The first equation assumes that the basal shear <strong>stress</strong> is given by an elastic Hooke<br />
law, where G is the elastic shear modulus and ɛ el the elastic shear deformation<br />
at the base; γ is the total shear strain such that γ = ɛ el + ɛ vp , where ɛ vp is the<br />
irreversible (viscoplastic) part <strong>of</strong> the total deformation. The second equation is a<br />
transport equation for the elastic deformation, where ˙γ ≈ U/h is the basal shear rate.<br />
It indicates that as long as the elastic deformation is below the critical strain given<br />
by γ c = τ c /G, the fluid behaves like an elastic solid. On the other hand, above the<br />
flow threshold, the evolution <strong>of</strong> the stored elastic deformation is decomposed into an<br />
advection term and a creeping term, where λ is a relaxation time scale.<br />
This scalar law constitutes a straightforward extension to shear flows <strong>of</strong> the<br />
mechanical model presented in figure 8. For γ c = 0 (no <strong>yield</strong> <strong>stress</strong>), one recovers<br />
the usual Maxwell model for viscoelastic <strong>fluids</strong>: ˙τ b +(G/η)τ b = G˙γ , where η ≡ Gλ
314 L.-H. Luu and Y. Forterre<br />
is the fluid viscosity. On the other hand, for a steady flow (d/dt = 0, ɛ el > γ c ),<br />
˙γ =(ɛ el − γ c )/λ, and the basal shear <strong>stress</strong> reduces to a simple viscoplastic flow<br />
rule: τ b = Gγ c +(Gλ)˙γ = τ c + η˙γ . For a constant relaxation time λ, the viscosity is<br />
constant, and one recovers a Bingham flow rule for steady flows (Saramito 2007).<br />
However, our <strong>fluids</strong> exhibit a Herschel–Bulkley behaviour for steady shear flows, such<br />
that η = K ˙γ n−1 . This is possible if the relaxation time satisfies Gλ = K((ɛ el − γ c )/λ) n−1 .<br />
To be compatible with the Herschel–Bulkley rheology <strong>of</strong> our <strong>fluids</strong> in steady shear,<br />
we therefore choose the following expression for the relaxation time:<br />
λ =(K/G) 1/n (|ɛ el | − γ c ) (n−1)/n if |ɛ el | > γ c , (4.5)<br />
where K is the fluid consistency and n is the flow index deduced from steady-state<br />
shear measurements. This choice is reminiscent <strong>of</strong> the White–Metzner model for<br />
describing shear-thinning in polymer solutions (Bird et al. 1987), where the relaxation<br />
time scales as λ =(K/G)˙γ n−1 .<br />
The full <strong>impact</strong> model is therefore given by the mass and momentum equations<br />
((4.7) and (4.8)) together with the elasto-viscoplastic law ((4.3)–(4.5)). To integrate this<br />
system <strong>of</strong> ordinary differential equations, we assume that the drop is initially <strong>stress</strong><br />
free, ɛ el | 0 = 0, with an initial shape R| 0 = L 0 /2 and h| 0 = (2/3)L 0 (to ensure volume<br />
conservation). Assuming that the initial drop vertical velocity is equal to the <strong>impact</strong><br />
velocity, dh/dt| 0 = V 0 , and using the mass balance (4.7) gives the initial lateral velocity<br />
U| 0 =(R| 0 /2h| 0 )V 0 = (3/8)V 0 . In the following, we non-dimensionalize the equations<br />
using the dimensionless variables<br />
R = L 0 ˆR, h = L 0 ĥ, t = L 0<br />
V 0<br />
ˆt, U = V 0 Û. (4.6)<br />
After dropping the hats, the dimensionless model is written as<br />
⎧<br />
⎪⎨<br />
⎪⎩<br />
dɛ el<br />
dt<br />
dh<br />
dt +2Uh =0, (4.7)<br />
R<br />
h dU<br />
dt<br />
= − ɛel<br />
M 2 , (4.8)<br />
= U if |ɛ el | < γ c ,<br />
h<br />
= U h − 1<br />
De (|ɛel 1/n ɛel<br />
| − γ c )<br />
|ɛ el |<br />
if |ɛ el | > γ c ,<br />
(4.9)<br />
ɛ el | 0 =0, R| 0 =1/2, h| 0 =2/3, U| 0 =3/8, at t = 0. (4.10)<br />
We note that the drop dynamics are entirely governed by three dimensionless<br />
numbers, plus n, given by<br />
M = V 0<br />
√ , G/ρ<br />
γ c = τ c<br />
G , De = V 0(K/G) 1/n<br />
L 0<br />
. (4.11)<br />
The elastic Mach number M gives the ratio <strong>of</strong> the <strong>impact</strong> velocity V 0 to the speed<br />
<strong>of</strong> the elastic shear waves √ G/ρ. The critical strain γ c is the ratio <strong>of</strong> the fluid <strong>yield</strong><br />
<strong>stress</strong> to the elastic shear modulus. Finally, the Deborah number De is the ratio<br />
<strong>of</strong> a characteristic fluid relaxation time (K/G) 1/n to a characteristic <strong>impact</strong> time<br />
L 0 /V 0 . In the limit <strong>of</strong> small Deborah numbers, the elastic deformations relax on<br />
time scales much shorter than the <strong>impact</strong> time, meaning that the flow behaviour is<br />
mainly viscoplastic. On the other hand, in the limit <strong>of</strong> large Deborah numbers, elastic
<strong>Drop</strong> <strong>impact</strong> <strong>of</strong> <strong>yield</strong>-<strong>stress</strong> <strong>fluids</strong> 315<br />
deformations have no time to relax during the <strong>impact</strong>. In this case, the behaviour is<br />
mainly elastic, even above the flow threshold.<br />
Our model <strong>of</strong> inertial spreading therefore contains the main physical ingredients<br />
that control the drop <strong>impact</strong> dynamics <strong>of</strong> a <strong>yield</strong>-<strong>stress</strong> fluid: the balance between<br />
inertia and bulk <strong>stress</strong>es, together with an elasto-viscoplastic rheology. However, we<br />
emphasize that this purely temporal approach constitutes a very rough simplification<br />
<strong>of</strong> the complex spatio-temporal dynamics observed during the drop <strong>impact</strong>. In<br />
particular, the assumed cylindrical drop shape and the shallow-water hypothesis<br />
are not satisfied at early times, where strong thickness gradients and finite aspect<br />
ratios occur. Another crude simplification concerns the expression for the basal <strong>stress</strong>.<br />
We estimated all flow fields at the plane in a dimensional way (e.g. ˙γ ≈ U/h), without<br />
solving the flow within the spreading layer. In addition, when computing the rate<br />
<strong>of</strong> elastic deformations, we have omitted the nonlinear time derivatives (e.g. upperconvected)<br />
arising at finite deformations (Bird et al. 1987; Saramito 2007; Bénito<br />
et al. 2008). These points will be briefly addressed in the conclusion.<br />
4.3. Predicted dynamics and <strong>impact</strong> regimes<br />
Before comparing our model with the experimental results, we discuss in this section<br />
its main predictions. For simplicity, the flow index is fixed to n =0.6. Figure 9(a–c)<br />
presents three typical time evolutions <strong>of</strong> the normalized drop diameter predicted by<br />
the model and obtained for different values <strong>of</strong> the elastic Mach number M, critical<br />
strain γ c and Deborah number De. These dynamics correspond to the three main<br />
<strong>impact</strong> regimes predicted by the model. In figure 9(a), the elastic Mach number is<br />
small and the critical strain is large, so that the <strong>yield</strong> <strong>stress</strong> is never reached during the<br />
spreading dynamics (γ = ɛ el , ɛ vp = 0). In this case, the drop remains in the solid–elastic<br />
regime and undergoes small oscillations about its initial diameter. These oscillations<br />
do not decay, since no damping exists in the model below the threshold. At the other<br />
extreme, figure 9(b) illustrates a large irreversible spreading <strong>of</strong> the drop obtained<br />
when the elastic Mach number is large, the critical strain small and the Deborah<br />
number small. In this case, the shear <strong>stress</strong> far exceeds the <strong>yield</strong> <strong>stress</strong>, and most<br />
<strong>of</strong> the initial kinetic energy is dissipated by viscoplasticity (γ ≈ ɛ vp ≫ ɛ el ). The last<br />
regime is presented in figure 9(c). In this case, the elastic Mach number is large as<br />
well, so that the shear <strong>stress</strong> exceeds the <strong>yield</strong> <strong>stress</strong> during the spreading phase.<br />
However, the Deborah number is no longer small. As a consequence, the drop no<br />
longer stops once it reaches its maximal extension but strongly recoils up to its initial<br />
diameter, before oscillating with a smaller amplitude. This situation corresponds to<br />
the case in which the spreading time is short compared to the relaxation time, so that<br />
elastic deformations dominate the flow even above the <strong>yield</strong> <strong>stress</strong>. (In figure 9c, the<br />
maximal elastic deformation ɛm el = 270 % is larger than the irreversible deformation<br />
at the maximal drop extension ɛm vp = 150 %.) This regime is called the liquid–elastic<br />
regime in the following. Note that in this case <strong>of</strong> large elastic recoils, the drop<br />
diameter may reach negative values during the receding phase for some parameters.<br />
This unphysical prediction <strong>of</strong> the model results from the lubrication assumption,<br />
which neglects the terms that prevent the drop collapsing when R → 0.<br />
A closer investigation <strong>of</strong> the model shows that the transition between the different<br />
regimes are controlled by two important dimensionless groups (figure 9d). First,<br />
as long as √ the ratio between the elastic Mach number and the critical strain,<br />
M/γ c = V 0 ρ G/τc , is below a critical value (solid line in figure 9d), the drop is<br />
below the flow threshold, and the behaviour is purely elastic (solid-elastic regime). On<br />
the other hand, for M/γ c > 2, the basal <strong>stress</strong> overcomes the <strong>yield</strong> <strong>stress</strong> during
316 L.-H. Luu and Y. Forterre<br />
3.5<br />
1.1<br />
3.0<br />
2.5<br />
L(t)<br />
L 0<br />
1.0<br />
0.9<br />
0<br />
0.5<br />
1.0<br />
(a)<br />
1.5 2.0<br />
2.5<br />
2.0<br />
1.5<br />
1.0<br />
0.5<br />
0<br />
1<br />
2<br />
3<br />
4<br />
5<br />
6<br />
(b)<br />
7<br />
8<br />
2.0<br />
1.5<br />
1.0<br />
0<br />
5<br />
10<br />
15<br />
20<br />
(c)<br />
25<br />
V 0<br />
t<br />
L 0<br />
V 0<br />
t<br />
L 0<br />
V 0<br />
L 0<br />
t<br />
(d)<br />
10 4<br />
10 3<br />
γ c<br />
M<br />
10 2<br />
10<br />
Viscoplastic<br />
Liquid--elastic<br />
1<br />
Solid--elastic<br />
10 –1 10 –5 10 –3 10 –1 10 10 3<br />
Figure 9. Time evolutions <strong>of</strong> the normalized drop diameter (a–c) and <strong>impact</strong> regimes<br />
(d) predicted by the model (n =0.6). (a) Solid–elastic regime: M =0.2, γ c = 1, De =0.1.<br />
(b) Viscoplastic regime: M = 1, γ c =0.01, De = 10 −6 .(c) Liquid–elastic regime: M = 10, γ c =0.1,<br />
De = 4. (d) The solid line is the solid–liquid transition (below this line, ɛ vp = 0). The dotted<br />
line is the boundary between the viscoplastic and liquid–elastic regime given by ɛm el = ɛm vp .<br />
D e<br />
M<br />
the spreading phase. The viscoplastic or liquid–elastic regime observation then<br />
depends on the ratio between the Deborah number and the elastic Mach number:<br />
De/M = K 1/n /(ρL 2 0 G2−n/n ) 1/2 . For small De/M, the <strong>impact</strong> kinetic energy is mostly<br />
dissipated by the fluid viscoplasticity, <strong>yield</strong>ing irreversible spreading and coating<br />
(viscoplastic regime). By contrast, for large De/M, the drop deformations remain<br />
elastic and reversible above the flow threshold due to viscoelastic effects (liquid–elastic<br />
regime). In figure 9(d), the boundary between the viscoplastic and liquid–elastic regime<br />
is plotted for n =0.6 (dotted line). In this case, the boundary does not depend on the<br />
value <strong>of</strong> the critical strain γ c . For other values <strong>of</strong> n, the previous discussion remains<br />
valid, but the boundary depends upon γ c (see § 5.1 and figure 11).<br />
Our analysis shows that the transition between the viscoplastic and liquid–elastic<br />
regime is essentially controlled by De/M, which does not depend on the <strong>impact</strong><br />
velocity. This number may be interpreted as the ratio between the viscous relaxation<br />
time (K/G) 1/n and the elastic mode <strong>of</strong> vibration <strong>of</strong> the drop L 0 / √ G/ρ. In this<br />
sense, this number is an elastic analogue to the so-called Ohnesorge number<br />
Oh= η/(ρσL 0 ) 1/2 , which compares the viscous damping time to the capillary period
<strong>Drop</strong> <strong>impact</strong> <strong>of</strong> <strong>yield</strong>-<strong>stress</strong> <strong>fluids</strong> 317<br />
2.5<br />
2.5<br />
L(t)<br />
L 0<br />
2.0<br />
1.5<br />
2.0<br />
1.5<br />
1.0<br />
(a)<br />
0 1 2 3 4<br />
1.0<br />
(b)<br />
0 1 2 3 4<br />
2.5<br />
2.5<br />
2.0<br />
2.5<br />
L(t)<br />
L 0<br />
2.0<br />
1.5<br />
1.5<br />
1.0<br />
0 20 40 60 80100<br />
2.0<br />
1.5<br />
1.0<br />
(c)<br />
1.0<br />
(d)<br />
0 5 10 15<br />
V 0<br />
t<br />
L 0<br />
0 2 4 6<br />
V 0<br />
t<br />
L 0<br />
Figure 10. Comparison between the spreading dynamics predicted by the model (a, c) and the<br />
experimental measurements (b, d) for two set <strong>of</strong> parameters: M =0.357, γ c =0.0014, De =3.7<br />
10 −7 , n =0.36 (a and b, kaolin 51 wt%, V 0 =1.7 ms −1 ) and M =7.95, γ c =0.28, De =3.26,<br />
n =0.5 (c and d, Carbopol 1 wt%, V 0 =2.3 m.s −1 ).<br />
<strong>of</strong> oscillation <strong>of</strong> a drop. The Ohnesorge number is well known to play an important<br />
role in characterizing the recoiling motion <strong>of</strong> Newtonian drops (Kim & Chun 2001;<br />
Yarin 2006). It is therefore not surprising that De/M plays a similar role for the<br />
irreversible coating versus receding transition in our case.<br />
5. Comparison with experiments<br />
In this section, we compare the previous model with the experimental measurements.<br />
To this end, the elastic Mach number M, the critical strain γ c , the Deborah number<br />
De and the flow index n introduced in the model are computed from the measured<br />
<strong>impact</strong> velocity V 0 and fluid properties given in table 1. Therefore, no fitting parameter<br />
exists when we compare the model with the experimental results.<br />
5.1. Typical dynamics and phase diagram<br />
Typical comparisons between the model and the experiments for the spreading<br />
dynamics are given in figure 10 for two sets <strong>of</strong> dimensionless parameters.<br />
Experimentally, the first set <strong>of</strong> parameters corresponds to the <strong>impact</strong> <strong>of</strong> a kaolin drop,<br />
while the second corresponds to the <strong>impact</strong> <strong>of</strong> a Carbopol drop, both measured on the<br />
super-hydrophobic surface (to avoid wetting issues not included in the model). The
318 L.-H. Luu and Y. Forterre<br />
main result is that the model captures both kinds <strong>of</strong> dynamics when the experimental<br />
values <strong>of</strong> the dimensionless numbers are introduced in the simulations. For the kaolin<br />
case, the drop spreads up to a maximum radius and no longer evolves: all the initial<br />
kinetic energy has been dissipated by the viscoplastic friction at the base (figure<br />
10a, b). By contrast, for the Carbopol drop, strong recoil is predicted and observed<br />
(figure 10c, d). This corresponds to the liquid–elastic regime, where most <strong>of</strong> the initial<br />
kinetic energy has been converted into elastic energy; though the <strong>stress</strong> far exceeds<br />
the <strong>yield</strong> <strong>stress</strong> in this case (the maximal total deformation is γ m ≈ 330 %, while the<br />
maximal elastic deformation is ɛm el ≈ 220 %, to be compared with the critical strain for<br />
Carbopol γ c = 28 %). Despite this similitude between the model and the experiments,<br />
the prediction is not quantitative. In particular, the spreading time is systematically<br />
overestimated in the theory. The model also lacks a damping mechanism to suppress<br />
the elastic ringing below the flow threshold (figure 10c, inset). Nevertheless, the<br />
agreement may be regarded as reasonable, considering the simplicity <strong>of</strong> the model<br />
and the fact that no free parameters exists.<br />
In figure 11, we present the phase diagrams predicted by the model for the three<br />
kinds <strong>of</strong> <strong>fluids</strong> used. In all cases, the solid–liquid transition is the same; however the<br />
boundary between the viscoplastic and liquid–elastic regime differs due to different<br />
values <strong>of</strong> γ c and n. In these diagrams, we also indicate the values <strong>of</strong> M/γ c and De/M<br />
for all <strong>fluids</strong> and <strong>impact</strong> velocities investigated experimentally. We first observe that all<br />
experiments (except one) occur above the solid–liquid transition. This means that the<br />
<strong>impact</strong> velocity is always large enough to overcome the <strong>yield</strong> <strong>stress</strong> in our experimental<br />
conditions. In addition, we observe that kaolin and bentonite drop <strong>impact</strong>s all belong<br />
to the viscoplastic regime, whereas most <strong>of</strong> the experiments with Carbopol belong to<br />
the liquid–elastic regime.<br />
5.2. Liquid–elastic regime: Carbopol<br />
The previous phase diagrams suggest that Carbopol <strong>impact</strong>s are mainly controlled<br />
by elasticity. To test this, we present in figure 12 the maximal spread factor measured<br />
for Carbopol <strong>impact</strong>s on the glass surface as a function <strong>of</strong> the elastic Mach number<br />
M = V 0 / √ G/ρ, for all concentrations and <strong>impact</strong> velocities investigated. The main<br />
result is that all data collapse on a master curve. This demonstrates the crucial role <strong>of</strong><br />
elasticity in the case <strong>of</strong> Carbopol, even though the flow threshold is greatly exceeded<br />
during the <strong>impact</strong>s. In addition, we observe a rather good quantitative agreement<br />
between the model prediction and the experiments.<br />
We can understand the relation between the maximal spread factor and the elastic<br />
Mach number M, using simple dimensional arguments and energy conservation.<br />
Assuming that the initial kinetic energy is entirely converted into elastic energy, we<br />
obtain ρL 3 0 V 0 2 ∼ GL3 0 ɛel<br />
2 m , where ɛm el ∼ L m /h is the elastic shear strain at the maximal<br />
deformation and h the thickness <strong>of</strong> the maximal drop. Using volume conservation<br />
(L 3 0 ∼ hL2 m) <strong>yield</strong>s<br />
L m ∼ L 0 M 1/3 . (5.1)<br />
The predicted scaling is close to the one obtained experimentally and in the model:<br />
L m ∼ L 0 M 0.35 ± 0.01 (dashed line in figure 12b). The slight difference with the ideal elastic<br />
prediction likely results from viscous dissipation. (The Carbopol domain is close to<br />
the viscoplastic/liquid–elastic transition; see figure 11.) However, this is difficult to<br />
assess owing to the limited range <strong>of</strong> elastic Mach numbers experimentally accessible.<br />
It is worth noting that the M 1/3 law is a priori valid when the elastic deformations<br />
are dominated by the thickness <strong>of</strong> the drop h, i.e. for a material that adheres to the
<strong>Drop</strong> <strong>impact</strong> <strong>of</strong> <strong>yield</strong>-<strong>stress</strong> <strong>fluids</strong> 319<br />
γ c<br />
M<br />
10 4<br />
10 0<br />
10 4<br />
10 0 Solid--elastic<br />
Kaolin<br />
Bentonite<br />
Viscoplastic<br />
10 3<br />
10 3<br />
Viscoplastic<br />
10 2<br />
10 1<br />
10 2<br />
Liquid--<br />
Liquid--<br />
elastic<br />
elastic<br />
10 1<br />
Solid--elastic<br />
10 0<br />
Solid--elastic<br />
10 –9 10 –7 10 –5 10 –3 10 –1 10 1 10 3 10 –9 10 –7 10 –5 10 –3 10 –1 10 1 10 3<br />
10 4<br />
Carbopol<br />
K51<br />
10 3<br />
K55<br />
B13<br />
B15<br />
M<br />
γ c<br />
10 2 Viscoplastic<br />
C02<br />
Liquid--<br />
C035<br />
elastic<br />
C05<br />
C1<br />
10 1<br />
C2<br />
C3<br />
10 –9 10 –7 10 –5 10 –3 10 –1 10 1 10 3<br />
D e<br />
M<br />
Figure 11. Impact regimes predicted by the model in the (M/γ c –De/M) plane together with<br />
experimental values <strong>of</strong> M/γ c and De/M for kaolin, bentonite and Carbopol (symbols). The<br />
boundary between the viscoplastic and liquid–elastic regime (dotted line) is computed for<br />
each fluid using: γ c =0.001, n =0.36 (kaolin); γ c =0.03, n =0.96 (bentonite); γ c =0.25, n =0.5<br />
(Carbopol).<br />
plane and for large deformations (M ≫ 1). For smaller deformations (M ∼ 1) and/or<br />
large slip velocity, the elastic deformation should rather scale as ɛm el ∼ (L m − L 0 )/L 0 ,<br />
<strong>yield</strong>ing (L m − L 0 )/L 0 ∼ M (Tanaka et al. 2003). Finally, in the low-velocity limit<br />
(M ≪ 1), elastic deformations are localized within the contact area, and <strong>impact</strong><br />
dynamics strongly depend on the precise geometry <strong>of</strong> the object (Johnson 1985).<br />
5.3. Viscoplastic regime: clays<br />
Unlike Carbopol, experiments with clays and the phase diagrams in figure 11 suggest<br />
that during the spreading phase all the initial kinetic energy is irreversibly dissipated.<br />
For Newtonian <strong>fluids</strong>, this ‘viscous’ regime <strong>of</strong> spreading is controlled by the Reynolds<br />
number, Re ≡ ρV 0 L 0 /η (η is the fluid viscosity), and the maximal spread factor is<br />
predicted to scale as L m ∼ L 0 Re 1/5 (Chandra & Avedisian 1991; Rein 1993). In our<br />
case, this classical viscous law <strong>of</strong> spreading should be modified because the <strong>fluids</strong> are
320 L.-H. Luu and Y. Forterre<br />
(a)<br />
3.0<br />
2.5<br />
2.0<br />
Experimental model<br />
C02<br />
C035<br />
C05<br />
C1<br />
C2<br />
C3<br />
3.0<br />
(b)<br />
4<br />
3<br />
L m – L 0<br />
1.5<br />
1.0<br />
0.5<br />
L 0<br />
2.5<br />
2.0<br />
1.5<br />
1.0<br />
0.5<br />
0<br />
1<br />
2<br />
3<br />
4<br />
5<br />
6<br />
L m<br />
L 0<br />
2<br />
1<br />
1 10<br />
M<br />
1/3<br />
L 0<br />
L m – L 0<br />
V 0 (m s –1 )<br />
0 5 10 15 20 25 30 35<br />
M<br />
Figure 12. (a) Relative deformation (L m − L 0 )/L 0 versus the elastic Mach number M, for<br />
Carbopol drops on glass smooth surface, measured in experiments (symbols) and predicted by<br />
the model (lines). Inset : relative deformation as a function <strong>of</strong> <strong>impact</strong> velocity. (b) Same data<br />
for the maximal spread factor versus the elastic Mach number in log–log. The solid line is the<br />
experimental data fit giving the law L m ∼ L 0 M 0.35 ± 0.01 .<br />
shear-thinning above the threshold. Assuming η = K ˙γ n−1 ∼ K(V 0 /h) n−1 , where h is<br />
the thickness <strong>of</strong> the maximal drop, and using volume conservation (L 3 0 ∼ hL2 m) <strong>yield</strong>s<br />
L m ∼ L 0 Re n 1/(2n+3) , (5.2)<br />
where Re n ≡ ρV0 2−n L n 0 /K is a generalized Reynolds number.<br />
1/(2n + 3)<br />
In figure 13, we present the maximal spread factor as a function <strong>of</strong> Re n<br />
for kaolin and bentonite drops, together with previous (see Clanet et al. 2004) and<br />
new experiments with Newtonian <strong>fluids</strong>. The main result is that both kaolin and<br />
Newtonian fluid data present a straight line <strong>of</strong> slope 1 in log–log, showing the<br />
relevance <strong>of</strong> the generalized viscous law (5.2). However, they do not collapse on the<br />
same curve, the maximal spread factor <strong>of</strong> kaolin drops being systematically higher<br />
( ∼ 25 %) than those <strong>of</strong> Newtonian drops. A similar discrepancy is obtained when<br />
one compares the model predictions to the experiments with kaolin. Again, the<br />
model underestimates the spreading by 30 % but predicts the correct scaling law<br />
with the generalized Reynolds number. This quantitative difference could result from<br />
the model approximations. However, the fact that the model quantitatively agrees<br />
with Newtonian <strong>fluids</strong> suggests a more fundamental explanation. In particular, kaolin<br />
viscosity during <strong>impact</strong> could be actually lower than the one we measured in steadystate<br />
rheometry, due to transient effects such as coupling between microstructure<br />
orientation and flow (Pignon et al. 1997).<br />
The second main observation in figure 13 is that bentonite does not follow the<br />
generalized viscous law (5.2). In this case, the velocity dependence <strong>of</strong> the maximal<br />
0.50 ± 0.1<br />
spread factor ( ∼ V0 ) is much higher than the one expected for a spreading<br />
2−n/2n +3<br />
limited by viscosity ( ∼ V0 ∼ V0 0.21 with n =0.96). A plausible explanation for<br />
this behaviour is that, unlike kaolin, <strong>impact</strong>s with bentonite are dominated by the <strong>yield</strong>
<strong>Drop</strong> <strong>impact</strong> <strong>of</strong> <strong>yield</strong>-<strong>stress</strong> <strong>fluids</strong> 321<br />
4<br />
3<br />
Experimental model<br />
K51<br />
K55<br />
1<br />
B13<br />
B15<br />
G98<br />
G75<br />
Clanet et al. (2004)<br />
L m<br />
L 0<br />
2<br />
1<br />
1<br />
2 3 4<br />
Re 1/(2n+3)<br />
n<br />
5<br />
Figure 13. Maximal spread factor versus Re n<br />
1/(2n + 3) , for kaolin and bentonite clays (open<br />
symbols) and for Newtonian drops (filled symbols) <strong>of</strong> two glycerol aqueous solutions<br />
concentrated at 75 % (η = 44 mPa s, G75) and 98 % (η = 472 mPa s, G98), and results<br />
imported from Clanet et al. 2004. The dashed lines are the model predictions for the kaolin.<br />
The solid lines are power law fit <strong>of</strong> the experiments for kaolin (slope 1.0 ± 0.05) and bentonite<br />
(slope 2.1 ± 0.1).<br />
<strong>stress</strong>, leading to a shear-rate-independent dissipation mechanism. Such hypothesis is<br />
supported by the estimation <strong>of</strong> the <strong>impact</strong> Bingham number Bi ≡ τ c L n 0 /KV 0 n for both<br />
<strong>fluids</strong>, which compares the <strong>yield</strong> <strong>stress</strong> to the typical <strong>impact</strong> viscous <strong>stress</strong>. For kaolin<br />
drops, we always have Bi < 0.5, whereas for bentonite drops Bi > 3. For a spreading<br />
controlled by the <strong>yield</strong> <strong>stress</strong> (‘plastic’ regime), the maximal spread factor can simply<br />
be predicted by balancing the initial kinetic energy with the plastic work (<strong>of</strong> order<br />
τ c L 3 m), <strong>yield</strong>ing<br />
L m ∼ L 0 Y 2/3 , (5.3)<br />
where Y ≡ V 0 / √ τ c /ρ.<br />
The number Y (or its square) is well known in strength-dominated <strong>impact</strong> <strong>of</strong> solids<br />
and compares the typical <strong>impact</strong> pressure to the material <strong>yield</strong> <strong>stress</strong> (Johnson 1985).<br />
In figure 14, we plot the data for bentonite as a function <strong>of</strong> this new dimensionless<br />
number together with the model prediction. The agreement between the model and<br />
the experiments is reasonable. Moreover, the spread factor velocity dependence is<br />
closer to the ideal plastic regime predicted by (5.3).<br />
We expect the transition between the plastic and viscous regimes to occur when the<br />
spread factor predicted by the plastic law (5.3) equates the one given by the viscous<br />
law (5.2) (by analogy with the capillary/viscous transition discussed by Clanet et al.<br />
(2n + 3)/7n<br />
2004). This defines a critical velocity V c ≡ τ c L 3/7<br />
0<br />
K −3/7n ρ −2/7 above which the<br />
spreading is limited by viscosity and below which it is limited by plasticity. The<br />
transition between the plastic and viscous regimes is shown in figure 15, where we
322 L.-H. Luu and Y. Forterre<br />
5<br />
4<br />
Experimental model<br />
B13<br />
B15<br />
3<br />
L m<br />
L 0<br />
2<br />
2/3<br />
1<br />
1 10<br />
Y<br />
Figure 14. Maximal spread factor versus the number Y ≡ V 0 / √ τ c /ρ for bentonite drops,<br />
measured (symbols) and predicted (dashed lines). The solid line is the power law fit <strong>of</strong> the<br />
experimental data (slope 0.5 ± 0.1).<br />
2.0<br />
B13<br />
B15<br />
K51<br />
K55<br />
L m<br />
L 0 Re1/(2n+3)<br />
n<br />
1.0<br />
0.9<br />
0.8<br />
0.7<br />
0.6<br />
0.5<br />
0.4<br />
0.3<br />
0.1 1 10 10 2<br />
V 0<br />
Figure 15. Dimensionless viscous extension (where the maximal spreading L m is normalized<br />
by the maximal spreading in the viscous regime L 0 Re n<br />
1/(2n + 3) ) versus the <strong>impact</strong> velocity<br />
normalized by the critical viscoplastic velocity V 0 /V c , for kaolin and bentonite drops. The<br />
transition occurs for V 0 ≈ 4V c .<br />
V c
<strong>Drop</strong> <strong>impact</strong> <strong>of</strong> <strong>yield</strong>-<strong>stress</strong> <strong>fluids</strong> 323<br />
plot the dimensionless viscous extension L m /(L 0 Re n<br />
1/(2n + 3) ) as function <strong>of</strong> V 0 /V c<br />
for all experiments with bentonite and kaolin. We observe that the transition is well<br />
defined and occurs for V 0 /V c ≈ 4. As expected, data corresponding to bentonite belong<br />
to the plastic regime (V 0 < 4V c ), whereas data for kaolin all belong to the viscous<br />
regime (V 0 > 4V c ).<br />
6. Conclusion<br />
In this paper, the dynamics <strong>of</strong> drops <strong>of</strong> <strong>yield</strong>-<strong>stress</strong> <strong>fluids</strong> <strong>impact</strong>ing solid surfaces<br />
have been investigated using different model <strong>fluids</strong> (clay suspensions, Carbopol<br />
microgel) and <strong>impact</strong>ed surfaces (partially wetting, super-hydrophobic). We first show<br />
that very different <strong>impact</strong> regimes may be observed, depending on the rheological<br />
and mechanical properties <strong>of</strong> the <strong>fluids</strong>. For ‘stiff’ materials (clays), viscoplastic effects<br />
dissipate most <strong>of</strong> the initial kinetic energy during the spreading phase. If the <strong>yield</strong><br />
<strong>stress</strong> is large enough to overcome the surface tension, the spreading drop irreversibly<br />
coats the surface, irrespective <strong>of</strong> its wetting property. By contrast, for ‘s<strong>of</strong>t viscous’<br />
materials (Carbopol), deformations during the <strong>impact</strong> remain elastic even far above<br />
the <strong>yield</strong> <strong>stress</strong>, leading to giant elastic spreading and recoil on the super-hydrophobic<br />
surfaces. The second main result is that a simple temporal model <strong>of</strong> spreading<br />
combining the drop inertia with an elasto-viscoplastic rheology allows predicting the<br />
different regimes observed within a single framework. In addition, semi-quantitative<br />
agreements between theory and experiments have been obtained for the maximal<br />
spread factor without any fitting parameter, when the measured <strong>impact</strong> velocity, drop<br />
size and fluid rheology were introduced in the model. Our results could therefore be<br />
useful to design applications involving the drop <strong>impact</strong> <strong>of</strong> <strong>yield</strong>-<strong>stress</strong> materials, such<br />
as coating processes and solid inkjet printing (Lewis 2006).<br />
Impact experiments with Carbopol have shown that elasticity may play a crucial<br />
role in the hydrodynamics <strong>of</strong> <strong>yield</strong>-<strong>stress</strong> <strong>fluids</strong>, even when the flow deformations<br />
are far above the <strong>yield</strong> <strong>stress</strong>. This is caused by the highly unsteady flow during the<br />
<strong>impact</strong>, which prevents the elastic deformations to relax. Such viscoelastic-like effects,<br />
typical <strong>of</strong> polymer solutions, are quite difficult to measure for <strong>yield</strong>-<strong>stress</strong> <strong>fluids</strong> in<br />
standard rheometers. In this sense, our study <strong>of</strong> drop <strong>impact</strong>s has <strong>of</strong>fered a means<br />
to probe the short-time rheology <strong>of</strong> these complex <strong>fluids</strong>. It is worth noting that the<br />
coupling between elasticity and flow deformation is not restricted to transient flows.<br />
Normal <strong>stress</strong>es and extensional viscosity are other consequences <strong>of</strong> this interplay that<br />
could affect the flow <strong>of</strong> <strong>yield</strong>-<strong>stress</strong> <strong>fluids</strong> in complex configurations. Recent works<br />
have begun to investigate this issue in confined geometries (Cheddadi et al. 2008). It<br />
would be interesting to extend these studies to free surface flows, such as avalanches<br />
down inclined planes and free surface instabilities.<br />
Among the different issues raised by our study, the first one concerns the<br />
improvement <strong>of</strong> the model used to describe the drop <strong>impact</strong> dynamics. Our first<br />
approach intended to capture the main physical ingredients. However, it oversimplified<br />
the complex spatio-temporal dynamics observed during <strong>impact</strong>. In particular, the<br />
assumed cylindrical drop shape and the shallow-water hypothesis are not valid at<br />
early stages, where high vertical velocities and strong thickness gradients are observed.<br />
A first improvement <strong>of</strong> the model could be to split the collapsing drop into a central<br />
zone, where the vertical velocity dominates, and a lateral zone, where the shallowwater<br />
hypothesis applies (Roisman, Rioboo & Tropea 2002; Larrieu, Staron & Hinch<br />
2006). Another possibility could be to use modified depth-averaged equations that<br />
take into account the vertical momentum balance (Boussinesq-type models). However,
324 L.-H. Luu and Y. Forterre<br />
all these approaches eventually require the knowledge <strong>of</strong> the internal velocity field,<br />
which may be obtained only by direct numerical simulations. The second improvement<br />
concerns the rheology. In this study, we used the simplest elasto-viscoplastic scalar<br />
law compatible with a shear-thinning behaviour. However, this approach does not<br />
take into account the nonlinear (e.g. upper-convected) derivatives arising in a full<br />
tensorial formulation (Bird et al. 1987; Saramito 2007). These terms generate a<br />
coupling between the shear flow and extensional flow that could strongly affect the<br />
<strong>impact</strong> dynamics. In addition, more complicated choices for the elastic tensor law<br />
and the relaxation term could be foreseen (Bénito et al. 2008). Finally, we have not<br />
considered other rheological features such as thixotropy and coupling between flow<br />
and microstructure orientation, which may affect the dynamics <strong>of</strong> unsteady flows<br />
(Coussot et al. 2005; Balmforth, Forterre & Pouliquen 2008). Clearly, incorporating<br />
all these rheological refinements in a full numerical simulation represents a serious<br />
challenge. However, we believe that the relative success <strong>of</strong> our simple model constitutes<br />
an encouragement to test more realistic constitutive laws in precise numerical<br />
modelling.<br />
Another question brought up by this study concerns the influence <strong>of</strong> wetting<br />
properties on the interfacial flows <strong>of</strong> <strong>yield</strong>-<strong>stress</strong> <strong>fluids</strong>. In the beginning <strong>of</strong> the<br />
paper, we suggested that these properties might play a minor role due to the flow<br />
threshold. However, our results undermine this assertion. First, the receding dynamics<br />
<strong>of</strong> Carbopol <strong>impact</strong>s are clearly affected by the wetting properties <strong>of</strong> the <strong>impact</strong>ed<br />
surface. On super-hydrophobic surfaces we observe a strong elastic recoil, whereas on<br />
partially wetting surfaces this elastic recoil is inhibited by the contact line dynamics,<br />
which remains anchored at the plane. This extra dissipation at the contact line could<br />
be enhanced for such a complex fluid due to a subtle interplay between the contact<br />
line hysteresis and normal <strong>stress</strong> differences (Bartolo et al. 2007). Secondly, we observe<br />
that the spreading dynamics at high <strong>impact</strong> speeds are also affected by the wetting<br />
properties <strong>of</strong> the <strong>impact</strong>ed surface. Besides promoting the splashing transition as in<br />
classical Newtonian <strong>fluids</strong>, <strong>impact</strong>s on super-hydrophobic surfaces show a striking<br />
phenomenon with Carbopol: above a critical speed, the spread factor becomes much<br />
larger than on the glass surface. To our knowledge, this behaviour has never been<br />
reported with Newtonian <strong>fluids</strong>, for which the <strong>impact</strong> spread factor is unaffected<br />
by the use <strong>of</strong> textured hydrophobic surfaces (Clanet et al. 2004). Is this ‘superspreading’<br />
the signature <strong>of</strong> a giant slip velocity between the <strong>yield</strong>-<strong>stress</strong> fluid and<br />
the super-hydrophobic surface? Does it result from the stabilization <strong>of</strong> the splashing<br />
instability due to viscoelastic effects? We will address these questions in a future<br />
work.<br />
Finally, it would be interesting to extend the present study to <strong>yield</strong>-<strong>stress</strong> fluid<br />
<strong>impact</strong>s on s<strong>of</strong>t surfaces made <strong>of</strong> the same material. In this case, both the projectile<br />
and the hitting ground may liquefy during the collision, before solidifying again<br />
once the kinetic energy is dissipated. This behaviour is reminiscent <strong>of</strong> <strong>impact</strong> crater<br />
formation in geophysics or in ballistic <strong>impact</strong>, although other phenomena such as<br />
heating, melting and fracture complicate the picture (Melosh 1989). Assuming an<br />
<strong>impact</strong>ing body <strong>of</strong> size L 0 ≈ 1 km and speed V 0 ≈ 1 km s −1 striking a surface planet<br />
<strong>of</strong> density ρ ≈ 3000 kg m −3 , <strong>yield</strong>-strength τ c ≈ 10 7 Pa, Young modulus G ≈ 10 9 Pa<br />
and viscosity η ≈ 10 9 Pa s (Melosh 1989) gives an elastic Mach number M ≈ 20, a<br />
critical strain γ c ≈ 10 −2 and a Deborah number De ≈ 1. In this study, we have seen<br />
that such parameters are easily obtained with standard <strong>yield</strong>-<strong>stress</strong> <strong>fluids</strong>. Investigating<br />
the hydrodynamics <strong>of</strong> crater formation with those materials could therefore help to<br />
get insight into the complex process <strong>of</strong> <strong>impact</strong> cratering in planetary science.
<strong>Drop</strong> <strong>impact</strong> <strong>of</strong> <strong>yield</strong>-<strong>stress</strong> <strong>fluids</strong> 325<br />
We thank Pierre Philippe (CEMAGREF, Aix-en-Provence) for providing us the<br />
kaolin clay and Jean-Michel Perret who performed several preliminary measurements.<br />
It is also a pleasure to thank Pascale Aussilous, Guillaume Chambon, Sergey<br />
Gavrilyuk, Assia Ghemmour, Guillaume Ovarlez, Olivier Pouliquen and Pierre<br />
Saramito for enlightening discussions.<br />
Appendix A. Derivation <strong>of</strong> the inertial spreading model<br />
The axisymmetric Saint-Venant mass and momentum conservation equations for<br />
an incompressible flow read (without gravity and surface tension)<br />
ρ<br />
∂h<br />
∂t + 1 ∂ruh<br />
=0, (A 1)<br />
(<br />
r ∂r<br />
∂hu<br />
+ 1 )<br />
∂rhu 2<br />
= −τ b , (A 2)<br />
∂t r ∂r<br />
where h(r, t) is the local thickness, u(r, t) the depth-averaged velocity and τ b the<br />
basal shear <strong>stress</strong> (de Saint-Venant 1871; Witham 1974; Larrieu et al. 2006). The<br />
main assumption to derive these equations is that the drop aspect ratio h/R is small<br />
(shallow-water hypothesis). This allows to neglect both the inertial pressure terms<br />
and the radial and hoop <strong>stress</strong>es. In addition, the acceleration term is simplified<br />
assuming (1/h) ∫ h<br />
0 ũ2 (r, z, t)dz ≈ u 2 (r, t), where ũ(r, z, t) is the depth velocity pr<strong>of</strong>ile.<br />
In this paper, we model the spreading drop by a disc <strong>of</strong> radius R(t) and uniform<br />
thickness h(t). In this case, the mass conservation equation implies (since there is no<br />
divergence <strong>of</strong> velocity at r = 0)<br />
u(r, t) =− r dh<br />
. (A 3)<br />
2h dt<br />
Substituting this expression into the Saint-Venant equations (A 1)–(A 2) at r = R(t)<br />
<strong>yield</strong>s<br />
where U = u(R(t),t) is the front velocity.<br />
dh<br />
dt +2hU =0, (A 4)<br />
R<br />
ρh dU = −τ b , (A 5)<br />
dt<br />
REFERENCES<br />
Awerbuch, N. J. & Bodner, S. R. 1974 Experimental investigation <strong>of</strong> normal perforation <strong>of</strong><br />
projectile in metallic plates. Intl J. Solids Struct. 10, 685–699.<br />
Balmforth, N. J., Forterre, Y. & Pouliquen, O. 2009 The viscoplastic Stokes layer. J. Non-Newton.<br />
Fluid Mech. 158, 46–53.<br />
Balmforth, N. J. & Frigaard, I. 2007 Viscoplastic <strong>fluids</strong>: from theory to application. J. Non-Newton.<br />
Fluid Mech. 142, 1–244.<br />
Barnes, H. A., Hutton, J. F. & Walters, K. 1989 An Introduction to Rheology. Elsevier.<br />
Bartolo, D., Boudaoud, A., Narcy, G. & Bonn, D. 2007 Dynamics <strong>of</strong> non-Newtonian droplets.<br />
Phys. Rev. Lett. 99, 174502.<br />
Bénito, S., Bruneau, C.-H., Colin, T., Gay, C. & Molino, F. 2008 An elasto-visco-plastic model<br />
for immortal foams or emulsions. Eur. Phys. J. E 25, 225–251.<br />
Bird, R. B., Armstrong, R. C. & Hassager, O. 1987 Dynamics <strong>of</strong> Polymeric Liquids: Fluid<br />
Mechanics, vol. 1. John Wiley.
326 L.-H. Luu and Y. Forterre<br />
Bussmann, M., Chandra, S. & Mostaghimi, J. 2000 Modeling the splash <strong>of</strong> a droplet <strong>impact</strong>ing a<br />
solid surface. Phys. Fluids 12, 3121–3132.<br />
de Bruyn, J. R., Habdas, P. & Kim, S. 2002 Fingering instability <strong>of</strong> a sheet <strong>of</strong> <strong>yield</strong>-<strong>stress</strong> fluid.<br />
Phys. Rev. E 66, 031504.<br />
Chambon, G., Ghemmour, A. & Laigle, D. 2009 Gravity-driven surges <strong>of</strong> a viscoplastic fluid: an<br />
experimental study. J. Non-Newton. Fluid Mech. 158, 54–62.<br />
Chandra, S. & Avedisian, C. T. 1991 On the collision <strong>of</strong> a droplet with a solid surface. Proc. R.<br />
Soc. Lond. A 432, 13–41.<br />
Cheddadi, I., Saramito, P., Raufaste, C., Marmottant, P. & Graner, F. 2008 Numerical modelling<br />
<strong>of</strong> foam Couette flows. Eur. Phys. J. E 432, 123–133.<br />
Clanet, C., Béguin, C., Richard, D. & Quéré, D. 2004 Maximal deformation <strong>of</strong> an <strong>impact</strong>ing<br />
drop. J. Fluid Mech. 517, 199–208.<br />
Cooper-White, J. J., Crooks, R. C. & Boger, D. V. 2002 A drop <strong>impact</strong> study <strong>of</strong> worm-like<br />
viscoelastic surfactants solutions. Colloids Surf. A 210, 105–123.<br />
Coussot, P. 1994 Steady, laminar, flow <strong>of</strong> concentrated mud suspension in open channel. J. Hydraul.<br />
Res. 32, 535–559.<br />
Coussot, P. 2005 Rheometry <strong>of</strong> Pastes, Suspensions and Granular Materials. Wiley Interscience.<br />
Coussot, P. & Gaulard, F. 2005 Gravity flow instability <strong>of</strong> viscoplastic materials: The ketchup<br />
drip. Phys. Rev. E 72, 031409.<br />
Coussot, P., Roussel, N., Jarny, S. & Chanson, H. 2005 Continuous or catastrophic solid–liquid<br />
transition in jammed systems. Phys. Fluids 17, 011704.<br />
Crossland, B. 1982 Explosive Welding <strong>of</strong> Metals and Its Applications. Oxford Science.<br />
Johnson, K. L. 1985 Contact Mechanics. Cambridge University Press.<br />
Kim, H.-Y. & Chun, J.-H. 2001 The recoiling <strong>of</strong> liquid droplets upon collision with solid surfaces.<br />
Phys. Fluids 13, 643–659.<br />
Larrieu, E., Staron, L. & Hinch, E. J. 2006 Raining into shallow water as a description <strong>of</strong> the<br />
collapse <strong>of</strong> a column <strong>of</strong> grains. J. Fluid Mech. 554, 259–270.<br />
Lewis, J. A. 2006 Direct ink writing <strong>of</strong> three-dimensional functional materials. Adv. Funct. Mater.<br />
16, 2193–2204.<br />
Magnin, A. & Piau, J. M. 1990 Cone-and-plate rheometry <strong>of</strong> <strong>yield</strong> <strong>stress</strong> <strong>fluids</strong>: study <strong>of</strong> an aqueous<br />
gel. J. Non-Newton. Fluid Mech. 36, 85–108.<br />
Marmottant, P. & Graner, F. 2007 An elastic, plastic, viscous model for slow shear <strong>of</strong> a liquid<br />
foam. Eur. Phys. J. E 23, 337–347.<br />
Meeker, S. P., Bonnecaze, R. T. & Cloitre, M. 2004 Slip and flow in s<strong>of</strong>t particle pastes. Phys.<br />
Rev. Lett. 92, 198302.<br />
Melosh, H. J. 1989 Impact Cratering: A Geologic Process. Oxford University Press.<br />
Mohamed Abdelhaye, Y. O., Chaouche, M. & Van Damme, H. 2008 The tackiness <strong>of</strong> smectite<br />
muds. Part 1. The dilute regime. Appl. Clay Sci. 42, 163–167.<br />
Mujumdar, A., Beris, A. N. & Metzner, A. B. 2002 Transient phenomena in thixotropic systems.<br />
J. Non-Newton. Fluid Mech. 102, 157–178.<br />
Nigen, S. 2005 Experimental investigation <strong>of</strong> the <strong>impact</strong> <strong>of</strong> an (apparent) <strong>yield</strong>-<strong>stress</strong> material.<br />
Atom. Sprays 15, 103–117.<br />
O’Brien, V. T. & Mackay, M. 2002 Shear and elongation flow properties <strong>of</strong> kaolin suspensions. J.<br />
Rheol. 46, 557–572.<br />
van Olphen, H. 1977 An Introduction to Clay Colloid Chemistry, 2nd edn. Wiley.<br />
Oppong, F. K., Rubatat, L., Friskein, B. J., Bailey, A. E. & de Bruyn, J. R. 2006 Microrheology<br />
and structure <strong>of</strong> a <strong>yield</strong>-<strong>stress</strong> polymer gel. Phys. Rev. E 73, 041405.<br />
Osmond, D. I. & Griffiths, R. W. 2001 The static shape <strong>of</strong> <strong>yield</strong> strength <strong>fluids</strong> slowly emplaced<br />
on slopes. J. Geophys. Res. 106, 16241–16250.<br />
Peixinho, J., Nouar, C., Desaubry, C. & Théron, B. 2005 Laminar transitional and turbulent flow<br />
<strong>of</strong> <strong>yield</strong> <strong>stress</strong> fluid in a pipe. J. Non-Newton. Fluid Mech. 128, 172–184.<br />
Piau, J. M. 2007 Carbopol gels: elastoviscoplastic and slippery glasses made <strong>of</strong> individual swollen<br />
sponges; meso-and macroscopic properties, constitutive equations and scaling laws. J. Non-<br />
Newton. Fluid Mech. 144, 1–29.<br />
Pignon, F., Magnin, A. & Piau, J.-M. 1996 Thixotropic colloidal suspensions and flow curves with<br />
minimum: identification <strong>of</strong> flow regimes and rheometric consequences. J. Rheol. 40, 573–587.
<strong>Drop</strong> <strong>impact</strong> <strong>of</strong> <strong>yield</strong>-<strong>stress</strong> <strong>fluids</strong> 327<br />
Pignon, F., Magnin, A. & Piau, J.-M. 1997 Butterfly light scattering pattern and rheology <strong>of</strong> a<br />
sheared thixotropic clay gel. Phys. Rev. Lett. 79, 4689–4692.<br />
Rein, M. 1993 Phenomena <strong>of</strong> liquid drop <strong>impact</strong> on solid and liquid surfaces. Fluid. Dyn. Res. 12,<br />
61–93.<br />
Renardy, Y., Popinet, S., Duchemin, L., Renardy, M., Zaleski, S., Josserand, C., Drumwright-<br />
Clarke, M. A., Richard, D., Clanet, C. & Quéré, D. 2003 Pyramidal and toroidal water<br />
drops after <strong>impact</strong> a solid surface. J. Fluid Mech. 484, 69–83.<br />
Rieber, M. & Frohn, A. 1999 A numerical study <strong>of</strong> the mechanism <strong>of</strong> splashing. Intl J. Heat Fluid<br />
Flow 20, 455–461.<br />
Roisman, I. V., Rioboo, R. & Tropea, C. 2002 Normal <strong>impact</strong> <strong>of</strong> a liquid drop on dry surface:<br />
model for spreading and receding. Proc. R. Soc. Lond. A 458, 1411–1430.<br />
de Saint-Venant, A. J. C. 1871 Théorie du mouvement non-permanent des eaux, avec application<br />
aux crues des rivières et à l’introduction des marées dans leur lit. C. R. Acad. Sci. Paris 73,<br />
147–154.<br />
Saramito, P. 2007 A new constitutive equation for elastoviscoplastic fluid flows J. Non-Newton. Fluid<br />
Mech. 145, 1–14.<br />
Schwed<strong>of</strong>f, T. 1890 Experimental researches on the cohesion <strong>of</strong> liquids. Part 2. Viscosity <strong>of</strong> liquids.<br />
J. Phys. 9, 34–46.<br />
Tabuteau, H., Coussot, P. & de Bruyn, J. R. 2007 Drag force on a sphere in steady motion<br />
through a <strong>yield</strong>-<strong>stress</strong> fluid. J. Rheol. 51, 125–137.<br />
Tanaka, Y., Yamazaki. Y. & Okumura, K. 2003 Bouncing gel balls: <strong>impact</strong> <strong>of</strong> s<strong>of</strong>t gels onto rigid<br />
surface. Europhys. Lett. 63, 149–155.<br />
Takeshi, O. & Sekimoto, K. 2005 Internal <strong>stress</strong> in a model elastoplastic fluid. Phys. Rev. Lett. 95,<br />
108301.<br />
Thoroddsen, S. T. & Sakakibara, J. 1998 Evolution <strong>of</strong> the fingering pattern <strong>of</strong> an <strong>impact</strong>ing drop.<br />
Phys. Fluids 10, 1359–1373.<br />
Tyabin, N. V. & Trusov, S. A. 1970 Theory <strong>of</strong> the flow <strong>of</strong> an elastoviscoplastic medium. J. Engng<br />
Thermophys. 18, 716–723.<br />
White, J. L. 1979 A plastic-viscoelastic constitutive equation to represent the rheological behaviour<br />
<strong>of</strong> concentrated suspensions <strong>of</strong> small particles in polymer melts J. Non-Newton. Fluid Mech.<br />
5, 177.<br />
Witham, G. B. 1974 Linear and Nonlinear Waves. Wiley Interscience.<br />
Xu, L., Zhang, W. W. & Nigel, S. R. 2005 <strong>Drop</strong> splashing on a dry smooth surface. Phys. Rev.<br />
Lett. 94, 184505.<br />
Yarin, A. L. 2006 <strong>Drop</strong> <strong>impact</strong> dynamics: splashing, spreading, receding, bouncing . . . Annu. Rev.<br />
Fluid. Mech. 38, 159–192.<br />
Yarin, A. L., Rubin, M. B. & Roisman, I. V. 1995 Penetration <strong>of</strong> a rigid projectile into an<br />
elastic-plastic target <strong>of</strong> finite thickness. Intl J. Impact Engng 16, 801–831.<br />
Yarin, A. L., Zussman, E., Theron, A., Rahimi, S., Sobe, Z. & Hasan D. 2004 Elongational<br />
behaviour <strong>of</strong> gelled propellant simulants. J. Rheol. 48, 101–116.<br />
Yoshitake, Y., Mitani, S., Sakai, K. & Takagi, K. 2008 Surface tension and elasticity <strong>of</strong> gel studied<br />
with laser-induced surface deformation spectroscopy. Phys. Rev. E 78, 041405.