HSBC PMI Polish Manufacturing report
HSBC PMI Polish Manufacturing report
HSBC PMI Polish Manufacturing report

Create successful ePaper yourself
Turn your PDF publications into a flip-book with our unique Google optimized e-Paper software.
<strong>HSBC</strong> Purchasing Managers’ Index ® 2011<br />
Embargoed until: 09:00 (WARSAW), 1 June 2011<br />
<strong>HSBC</strong> Poland <strong>Manufacturing</strong> <strong>PMI</strong> ®<br />
<strong>Polish</strong> manufacturing production rose at slower pace in May.<br />
Key findings:<br />
• Output and new orders grew at weakest rates for ten months.<br />
• Input price inflation slowed sharply.<br />
• Manufacturers continued to expand workforces.<br />
<strong>HSBC</strong> survey data for May, compiled by Markit, signalled a further<br />
overall improvement in manufacturing business conditions in<br />
Poland. But the pace of growth slowed markedly, with output, new<br />
orders and input buying all rising at weaker rates compared to April.<br />
The loss of momentum was accompanied by an unprecedented<br />
easing in the rate of input cost inflation in the sector, although<br />
companies continued to take on staff at a solid pace.<br />
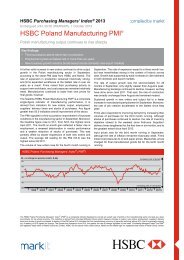
The headline <strong>HSBC</strong> Poland <strong>Manufacturing</strong> <strong>PMI</strong> ® is a composite<br />
single-figure indicator of manufacturing performance, tracking<br />
changes in new orders, output, employment, suppliers’ delivery<br />
times and stocks of purchases. Any figure greater than 50.0<br />
represents an overall improvement in business conditions. The<br />
<strong>PMI</strong> fell from 54.4 in April to 52.6 in May, the lowest since last<br />
July. The decline primarily reflected weaker contributions from<br />
the output and new orders components and, to a lesser extent,<br />
stocks of purchases. That said, the <strong>PMI</strong> has been above 50.0 for<br />
nineteen months in a row, and remained above its long-run<br />
average in the latest period.<br />
New order inflows at <strong>Polish</strong> manufacturers continued to rise in<br />
May. This extended the current sequence to twenty months.<br />
That said, the rate of expansion slowed to the weakest since July<br />
2010. Moreover, new export orders barely rose at all compared<br />
to April.<br />
The slower rise in new orders resulted in a moderation of output<br />
growth in May. The pace of expansion has slowed three times so<br />
<strong>HSBC</strong> Poland Purchasing Managers’ Index ® (<strong>PMI</strong> ® )<br />
far in 2011, and the latest data signalled the weakest growth<br />
since last July. Nevertheless, the rise remained sharp in<br />
comparison to the long-run survey average.<br />
May data signalled a substantial easing of cost inflationary<br />
pressure in the manufacturing economy. The rate of input price<br />
inflation slowed for the fourth month running – and to a greater<br />
extent than in any previous survey period – to the weakest since<br />
last August. That said, it remained steeper than the long-run<br />
survey average, reflecting supply shortages.<br />
The rate at which manufacturers raised their prices also slowed<br />
sharply in May. Output price inflation eased for the second month<br />
running, to the weakest since last November.<br />
<strong>Manufacturing</strong> employment in Poland rose at the fastest rate in<br />
three months in May, despite the weaker rise in production.<br />
Workforces have expanded on average for the past ten months.<br />
Although pressure on manufacturing capacity eased somewhat<br />
in May, the volume of outstanding business in the sector rose.<br />
This was the seventh time in the past eight months that backlogs<br />
had increased. Firms linked rising levels of outstanding work to<br />
insufficient production capacity and delays from suppliers.<br />
In line with the trends seen for output and new orders, the rate<br />
of purchasing growth slowed in May. The latest expansion was<br />
the weakest since last August. Even so, suppliers’ delivery times<br />
continued to lengthen during the month.<br />
50 = no change on previous month, S.Adj.<br />
60<br />
Increasing rate of growth<br />
55<br />
50<br />
45<br />
40<br />
35<br />
Increasing rate of contraction<br />
1999 2000 2001 2002 2003 2004 2005 2006 2007 2008 2009 2010<br />
The <strong>HSBC</strong> Poland Purchasing Managers’ Index ® (<strong>PMI</strong> ® ) is a composite indicator designed to provide an overall view of activity in the manufacturing sector and acts as a leading<br />
indicator for the whole economy. The indicator is derived from individual diffusion indices which measure changes in output, new orders, employment, suppliers’ delivery times<br />
and stocks of goods purchased. A reading of the <strong>PMI</strong> below 50.0 indicates that the manufacturing economy is generally declining; above 50.0, that it is generally expanding. A<br />
reading of 50.0 signals no change. The greater the divergence from 50.0, the greater the rate of change signalled by the index. Purchasing Managers’ Index ® and <strong>PMI</strong> ® are registered<br />
trade marks of Markit Economics Limited, <strong>HSBC</strong> use the above marks under licence. Markit and the Markit logo are registered trade marks of Markit Group Limited.
<strong>HSBC</strong> Poland <strong>Manufacturing</strong> <strong>PMI</strong> ®<br />
Output Index<br />
Q. Please compare your production/output this month with the situation one month ago.<br />
50 = no change on previous month, S.Adj.<br />
6 5<br />
6 0<br />
Increasing rate of growth<br />
% L o w er<br />
% H ig h er<br />
5 5<br />
5 0<br />
4 5<br />
4 0<br />
3 5<br />
Increasing rate of contraction<br />
1 9 9 9 2 0 0 0 2 0 0 1 2 0 0 2 2 0 0 3 2 0 0 4 2 0 0 5 2 0 0 6 2 0 0 7 2 0 0 8 2 0 0 9 2 0 1 0<br />
% S am e<br />
<strong>Polish</strong> manufacturing output rose for the twenty-second successive month in May. The seasonally adjusted Output Index remained above its<br />
long-run average, indicating a relatively sharp pace of expansion. That said, the rate of growth slowed for the fourth time in the past six months,<br />
to the weakest since July 2010.<br />
New Orders Index<br />
Q. Please compare the level of new orders received this month with the situation one month ago.<br />
50 = no change on previous month, S.Adj.<br />
Increasing rate of growth<br />
6 5<br />
6 0<br />
5 5<br />
5 0<br />
4 5<br />
4 0<br />
3 5<br />
Increasing rate of contraction<br />
3 0<br />
1 9 9 9 2 0 0 0 2 0 0 1 2 0 0 2 2 0 0 3 2 0 0 4 2 0 0 5 2 0 0 6 2 0 0 7 2 0 0 8 2 0 0 9 2 0 1 0<br />
% L o w er<br />
% S am e<br />
% H ig h er<br />
Remaining above the no-change mark of 50.0 in May, the seasonally adjusted New Orders Index signalled a further expansion of new work<br />
received by <strong>Polish</strong> manufacturers. The current sequence of growth now stretches to twenty months. The Index fell since April, however, and<br />
signalled the weakest rate of expansion since July 2010. Nevertheless, it was still greater than its long-run trend level of 51.0 during the latest<br />
period.<br />
New Export Orders Index<br />
Q. Please compare the level of new export orders received this month with the situation of one month ago.<br />
50 = no change on previous month, S.Adj.<br />
Increasing rate of growth<br />
6 5<br />
6 0<br />
5 5<br />
5 0<br />
4 5<br />
4 0<br />
3 5<br />
3 0<br />
Increasing rate of contraction<br />
2 5<br />
1 9 9 9 2 0 0 0 2 0 0 1 2 0 0 2 2 0 0 3 2 0 0 4 2 0 0 5 2 0 0 6 2 0 0 7 2 0 0 8 2 0 0 9 2 0 1 0<br />
% L o w er<br />
% S am e<br />
% H ig h er<br />
Growth of new export business stagnated in May. The seasonally adjusted New Export Orders Index fell sharply, and was only marginally above<br />
the no-change mark of 50.0 that divides expansion from contraction. The month-on-month fall in the Index was the fourth-largest in the thirteenyear<br />
history of the survey. Firms that <strong>report</strong>ed lower new export work cited the loss of business to rival low-cost suppliers, falling orders from<br />
the Middle East and softening demand generally.<br />
Backlogs of Work Index<br />
Q. Please compare the level of outstanding business in your company this month with the situation one month ago.<br />
50 = no change on previous month, S.Adj.<br />
Increasing rate of growth<br />
6 0<br />
5 5<br />
5 0<br />
4 5<br />
4 0<br />
3 5<br />
3 0<br />
Increasing rate of contraction<br />
2 5<br />
1 9 9 9 2 0 0 0 2 0 0 1 2 0 0 2 2 0 0 3 2 0 0 4 2 0 0 5 2 0 0 6 2 0 0 7 2 0 0 8 2 0 0 9 2 0 1 0<br />
% L o w er<br />
% S am e<br />
% H ig h er<br />
The volume of work-in-progress in the <strong>Polish</strong> manufacturing sector rose in May, following a contraction in the previous month. The seasonally<br />
adjusted Backlogs of Work Index was at a level indicative of a modest rate of growth, remaining above its long-run average of 48.7. A number of<br />
firms <strong>report</strong>ed capacity issues and delays to production during the month.<br />
All Intellectual Property Rights owned by Markit Economics Limited 2
1 June 2011<br />
Stocks of Finished Goods Index<br />
Q. Please compare your stocks of finished goods (in units) this month with the situation one month ago.<br />
50 = no change on previous month, S.Adj.<br />
6 0<br />
Increasing rate of growth<br />
% L o w er<br />
% H ig h er<br />
5 5<br />
5 0<br />
4 5<br />
4 0<br />
Increasing rate of contraction<br />
1 9 9 9 2 0 0 0 2 0 0 1 2 0 0 2 2 0 0 3 2 0 0 4 2 0 0 5 2 0 0 6 2 0 0 7 2 0 0 8 2 0 0 9 2 0 1 0<br />
% S am e<br />
<strong>Polish</strong> manufacturers’ inventories of post-production goods declined on average in May. The seasonally adjusted Stocks of Finished Goods Index<br />
fell below neutrality, having signalled a slight accumulation in the previous month. However, the rate of contraction signalled by the latest figure<br />
was weaker than that indicated during the first quarter of 2011. Some firms <strong>report</strong>ed selling from existing stock during the month.<br />
Employment Index<br />
Q. Please compare the level of employment at your unit with the situation one month ago.<br />
50 = no change on previous month, S.Adj.<br />
5 5<br />
Increasing rate of growth<br />
% L o w er<br />
% H ig h er<br />
5 0<br />
4 5<br />
4 0<br />
3 5<br />
Increasing rate of contraction<br />
1 9 9 9 2 0 0 0 2 0 0 1 2 0 0 2 2 0 0 3 2 0 0 4 2 0 0 5 2 0 0 6 2 0 0 7 2 0 0 8 2 0 0 9 2 0 1 0<br />
% S am e<br />
<strong>Manufacturing</strong> employment in Poland rose for the tenth month running in May. Firms attributed recruitment to rising output requirements.<br />
Posting a higher reading than in the previous month, the seasonally adjusted Employment Index signalled the fastest rate of job creation for three<br />
months. Moreover, the Index was greater than its long-run trend level during the month.<br />
Output Prices Index<br />
Q. Please compare the average price that you charge per unit of output (volume weighted) this month with the situation one month ago.<br />
50 = no change on previous month, S.Adj.<br />
6 5<br />
Increasing rate of inflation<br />
% L o w er<br />
% H ig h er<br />
6 0<br />
5 5<br />
5 0<br />
4 5<br />
4 0<br />
Increasing rate of deflation<br />
1 9 9 9 2 0 0 0 2 0 0 1 2 0 0 2 2 0 0 3 2 0 0 4 2 0 0 5 2 0 0 6 2 0 0 7 2 0 0 8 2 0 0 9 2 0 1 0<br />
% S am e<br />
The rate at which manufacturers raised their output prices slowed sharply in May. The seasonally adjusted Output Prices Index posted its fifthlargest<br />
one-month fall since data were first collected in January 2003, and the latest figure indicated the weakest rate of charge inflation since<br />
November 2010. That said, the overall increase in prices for <strong>Polish</strong> manufactured goods remained sharp in the context of historic data, and<br />
charges have risen every month since April 2010.<br />
Input Prices Index<br />
Q. Please compare the average price of your purchases (volume weighted) this month with the situation one month ago.<br />
50 = no change on previous month, S.Adj.<br />
8 0<br />
Increasing rate of inflation<br />
% L o w er<br />
7 0<br />
% H ig h er<br />
6 0<br />
5 0<br />
4 0<br />
3 0<br />
Increasing rate of deflation<br />
1 9 9 9 2 0 0 0 2 0 0 1 2 0 0 2 2 0 0 3 2 0 0 4 2 0 0 5 2 0 0 6 2 0 0 7 2 0 0 8 2 0 0 9 2 0 1 0<br />
% S am e<br />
May data signalled an easing in cost inflationary pressures for the fourth successive month. Having reached a record high in January, the<br />
seasonally adjusted Input Prices Index fell to a nine-month low in the latest period. Moreover, the month-on-month fall in the Index was the<br />
steepest in the history of the series. Input price inflation remained stronger than the long-run trend, however, with a number of firms <strong>report</strong>ing<br />
higher supplier prices for a range of raw materials and fuel.<br />
3
1 June 2011<br />
Suppliers’ Delivery Times Index<br />
Q. Please compare your suppliers’ delivery times (volume weighted) this month with the situation one month ago.<br />
50 = no change on previous month, S.Adj.<br />
5 5<br />
Increasing rate of shortening<br />
% L o w er<br />
% H ig h er<br />
5 0<br />
4 5<br />
4 0<br />
3 5<br />
Increasing rate of lengthening<br />
1 9 9 9 2 0 0 0 2 0 0 1 2 0 0 2 2 0 0 3 2 0 0 4 2 0 0 5 2 0 0 6 2 0 0 7 2 0 0 8 2 0 0 9 2 0 1 0<br />
% S am e<br />
<strong>Polish</strong> manufacturers continued to <strong>report</strong> worsening supplier performance in May. The average time taken to deliver inputs has lengthened in<br />
every month since September 2009. Firms linked delays to shortages of raw materials, transport problems and insufficient capacity at suppliers.<br />
That said, the overall extent of the latest deterioration in vendor performance was the least marked in seventeen months.<br />
Quantity of Purchases Index<br />
Q. Please compare the quantity of items purchased (in units) this month with the situation one month ago.<br />
50 = no change on previous month, S.Adj.<br />
6 5<br />
6 0<br />
Increasing rate of growth<br />
% L o w er<br />
% H ig h er<br />
5 5<br />
5 0<br />
4 5<br />
4 0<br />
3 5<br />
Increasing rate of contraction<br />
1 9 9 9 2 0 0 0 2 0 0 1 2 0 0 2 2 0 0 3 2 0 0 4 2 0 0 5 2 0 0 6 2 0 0 7 2 0 0 8 2 0 0 9 2 0 1 0<br />
% S am e<br />
May data signalled a further increase in purchasing activity by <strong>Polish</strong> manufacturers. The seasonally adjusted Quantity of Purchases Index<br />
remained above the no-change mark of 50.0 for the sixteenth successive month, remaining favourable in the context of historic survey data.<br />
Firms linked rising input volumes to higher output requirements. In line with the trends seen for output and new orders, however, the rate of<br />
growth slowed in the latest period to the weakest since August 2010.<br />
Stocks of Purchases Index<br />
Q. Please compare your stocks of purchases (in units) with the situation one month ago.<br />
50 = no change on previous month, S.Adj.<br />
6 0<br />
Increasing rate of growth<br />
% L o w er<br />
% H ig h er<br />
5 5<br />
5 0<br />
4 5<br />
4 0<br />
3 5<br />
Increasing rate of contraction<br />
1 9 9 9 2 0 0 0 2 0 0 1 2 0 0 2 2 0 0 3 2 0 0 4 2 0 0 5 2 0 0 6 2 0 0 7 2 0 0 8 2 0 0 9 2 0 1 0<br />
% S am e<br />
The level of inputs held in stock at <strong>Polish</strong> goods producers declined in May, as it has done in every month of 2011 so far. Moreover, a fall<br />
in the seasonally adjusted Stocks of Purchases Index signalled a faster rate of contraction. The pace at which inventories declined was the<br />
sharpest since February 2010. Some firms <strong>report</strong>ed that rising input prices had limited their ability to increase purchasing volumes, and delayed<br />
deliveries.<br />
Notes on the Data and Method of Presentation<br />
The Purchasing Managers’ Index ® is based on data compiled from monthly replies to questionnaires sent to purchasing executives in over 200 manufacturing companies.<br />
The panel is stratified geographically and by Standard Industrial Classification (SIC) group, based on regional and industry contribution to <strong>Polish</strong> Industrial Production. Survey<br />
responses reflect the change, if any, in the current month compared to the previous month based on data collected mid-month. For each of the indicators the ‘Report’ shows<br />
the percentage <strong>report</strong>ing each response, the net difference between the number of higher/better responses and lower/worse responses, and the ‘diffusion’ index. This index is<br />
the sum of the positive responses plus a half of those responding ‘the same’.<br />
The Purchasing Managers’ Index (<strong>PMI</strong> ® ) is a composite index based on five of the individual indexes with the following weights derived from the Chartered Institute of<br />
Purchasing & Supply’s survey of the UK economy: New Orders - 0.3, Output - 0.25, Employment - 0.2, Suppliers’ Delivery Times - 0.15, Stock of Items Purchased - 0.1, with the<br />
Delivery Times index inverted so that it moves in a comparable direction.<br />
Diffusion indexes have the properties of leading indicators and are convenient summary measures showing the prevailing direction of change. An index reading<br />
above 50 indicates an overall increase in that variable, below 50 an overall decrease. Markit do not revise underlying survey data after first publication, but seasonal<br />
adjustment factors may be revised from time to time as appropriate which will affect the seasonally adjusted data series.<br />
Warning<br />
The intellectual property rights to the <strong>HSBC</strong> Poland <strong>Manufacturing</strong> <strong>PMI</strong> provided herein is owned by Markit Economics Limited. Any unauthorised use, including but not limited<br />
to copying, distributing, transmitting or otherwise of any data appearing is not permitted without Markit’s prior consent. Markit shall not have any liability, duty or obligation for or<br />
relating to the content or information (“data”) contained herein, any errors, inaccuracies, omissions or delays in the data, or for any actions taken in reliance thereon. In no event<br />
shall Markit be liable for any special, incidental, or consequential damages, arising out of the use of the data. Purchasing Managers’ Index ® and <strong>PMI</strong> ® are registered trade marks<br />
of Markit Economics Limited, <strong>HSBC</strong> use the above marks under licence. Markit and the Markit logo are registered trade marks of Markit Group Limited.<br />
All Intellectual Property Rights owned by Markit Economics Limited 4


![[the zone of great potential] - KSSE](https://img.yumpu.com/43384797/1/190x134/the-zone-of-great-potential-ksse.jpg?quality=85)