HSBC Poland Manufacturing PMI (English) - 1310
HSBC Poland Manufacturing PMI (English) - 1310
HSBC Poland Manufacturing PMI (English) - 1310

Create successful ePaper yourself
Turn your PDF publications into a flip-book with our unique Google optimized e-Paper software.
<strong>HSBC</strong> Purchasing Managers’ Index ® 2013<br />
Embargoed until: 09:00 (WARSAW), 1 October 2013<br />
<strong>HSBC</strong> <strong>Poland</strong> <strong>Manufacturing</strong> <strong>PMI</strong> ®<br />
Polish manufacturing output continues to rise sharply<br />
Key findings:<br />
• Third successive above-trend rise in production<br />
• Employment grows at fastest rate in more than six years<br />
• New business growth remains broad-based across domestic and export markets<br />
A further solid increase in new orders continued to drive output<br />
growth in the Polish manufacturing sector in September,<br />
according to the latest <strong>PMI</strong> data from <strong>HSBC</strong> and Markit. The<br />
rate of expansion in production remained historically strong,<br />
and firms expanded workforces at the fastest rate in over six<br />
years as a result. Firms raised their purchasing activity to<br />
support new workloads, and cost pressures remained relatively<br />
weak. Manufacturers continued to lower their own prices for<br />
final goods, however.<br />
The headline <strong>HSBC</strong> <strong>Poland</strong> <strong>Manufacturing</strong> <strong>PMI</strong> ® is a composite<br />
single-figure indicator of manufacturing performance. It is<br />
derived from indicators for new orders, output, employment,<br />
suppliers’ delivery times and stocks of purchases. Any figure<br />
greater than 50.0 indicates overall improvement of the sector.<br />
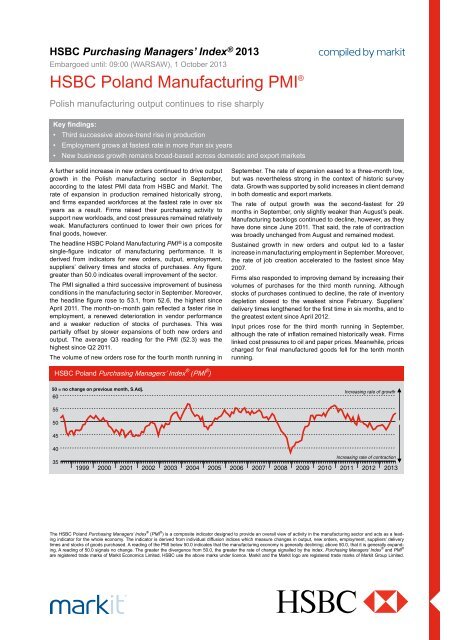
The <strong>PMI</strong> signalled a third successive improvement of business<br />
conditions in the manufacturing sector in September. Moreover,<br />
the headline figure rose to 53.1, from 52.6, the highest since<br />
April 2011. The month-on-month gain reflected a faster rise in<br />
employment, a renewed deterioration in vendor performance<br />
and a weaker reduction of stocks of purchases. This was<br />
partially offset by slower expansions of both new orders and<br />
output. The average Q3 reading for the <strong>PMI</strong> (52.3) was the<br />
highest since Q2 2011.<br />
The volume of new orders rose for the fourth month running in<br />
September. The rate of expansion eased to a three-month low,<br />
but was nevertheless strong in the context of historic survey<br />
data. Growth was supported by solid increases in client demand<br />
in both domestic and export markets.<br />
The rate of output growth was the second-fastest for 29<br />
months in September, only slightly weaker than August’s peak.<br />
<strong>Manufacturing</strong> backlogs continued to decline, however, as they<br />
have done since June 2011. That said, the rate of contraction<br />
was broadly unchanged from August and remained modest.<br />
Sustained growth in new orders and output led to a faster<br />
increase in manufacturing employment in September. Moreover,<br />
the rate of job creation accelerated to the fastest since May<br />
2007.<br />
Firms also responded to improving demand by increasing their<br />
volumes of purchases for the third month running. Although<br />
stocks of purchases continued to decline, the rate of inventory<br />
depletion slowed to the weakest since February. Suppliers’<br />
delivery times lengthened for the first time in six months, and to<br />
the greatest extent since April 2012.<br />
Input prices rose for the third month running in September,<br />
although the rate of inflation remained historically weak. Firms<br />
linked cost pressures to oil and paper prices. Meanwhile, prices<br />
charged for final manufactured goods fell for the tenth month<br />
running.<br />
<strong>HSBC</strong> <strong>Poland</strong> Purchasing Managers’ Index ® (<strong>PMI</strong> ® )<br />
50 = no change on previous month, S.Adj.<br />
60<br />
Increasing rate of growth<br />
55<br />
50<br />
45<br />
40<br />
35<br />
Increasing rate of contraction<br />
1999 2000 2001 2002 2003 2004 2005 2006 2007 2008 2009 2010 2011 2012 2013<br />
The <strong>HSBC</strong> <strong>Poland</strong> Purchasing Managers’ Index ® (<strong>PMI</strong> ® ) is a composite indicator designed to provide an overall view of activity in the manufacturing sector and acts as a leading<br />
indicator for the whole economy. The indicator is derived from individual diffusion indices which measure changes in output, new orders, employment, suppliers’ delivery<br />
times and stocks of goods purchased. A reading of the <strong>PMI</strong> below 50.0 indicates that the manufacturing economy is generally declining; above 50.0, that it is generally expanding.<br />
A reading of 50.0 signals no change. The greater the divergence from 50.0, the greater the rate of change signalled by the index. Purchasing Managers’ Index ® and <strong>PMI</strong> ®<br />
are registered trade marks of Markit Economics Limited, <strong>HSBC</strong> use the above marks under licence. Markit and the Markit logo are registered trade marks of Markit Group Limited.
<strong>HSBC</strong> <strong>Poland</strong> <strong>Manufacturing</strong> <strong>PMI</strong> ®<br />
Output Index<br />
Q. Please compare your production/output this month with the situation one month ago.<br />
50 = no change on previous month, S.Adj.<br />
6 5<br />
6 0<br />
5 5<br />
5 0<br />
4 5<br />
Increasing rate of growth<br />
% L o w er<br />
% H ig h er<br />
4 0<br />
3 5<br />
Increasing rate of contraction<br />
1 9 9 9 2 0 0 0 2 0 0 1 2 0 0 2 2 0 0 3 2 0 0 4 2 0 0 5 2 0 0 6 2 0 0 7 2 0 0 8 2 0 0 9 2 0 1 0 2 0 1 1 2 0 1 2 2 0 1 3<br />
% S am e<br />
<strong>Poland</strong>’s manufacturers raised output for the third month in succession in September. The rate of expansion eased slightly from August’s 28-month<br />
record, but was sharp nevertheless. The seasonally adjusted Output Index remained well above its long-run average of 51.8. Firms mainly linked<br />
higher production to rising new business receipts.<br />
New Orders Index<br />
Q. Please compare the level of new orders received this month with the situation one month ago.<br />
50 = no change on previous month, S.Adj.<br />
Increasing rate of growth<br />
6 5<br />
6 0<br />
5 5<br />
5 0<br />
4 5<br />
4 0<br />
3 5<br />
Increasing rate of contraction<br />
3 0<br />
1 9 9 9 2 0 0 0 2 0 0 1 2 0 0 2 2 0 0 3 2 0 0 4 2 0 0 5 2 0 0 6 2 0 0 7 2 0 0 8 2 0 0 9 2 0 1 0 2 0 1 1 2 0 1 2 2 0 1 3<br />
% L o w er<br />
% S am e<br />
% H ig h er<br />
The seasonally adjusted New Orders Index remained above the no-change mark of 50.0 for the fourth month running in September, indicating<br />
growth of new work at Polish goods producers. The rate of expansion was the weakest since June, but strong in the context of historic data. Firms<br />
reported that new customers and improving demand from both domestic and export markets led to new order growth.<br />
New Export Orders Index<br />
Q. Please compare the level of new export orders received this month with the situation of one month ago.<br />
50 = no change on previous month, S.Adj.<br />
Increasing rate of growth<br />
6 5<br />
6 0<br />
5 5<br />
5 0<br />
4 5<br />
4 0<br />
3 5<br />
3 0<br />
Increasing rate of contraction<br />
2 5<br />
1 9 9 9 2 0 0 0 2 0 0 1 2 0 0 2 2 0 0 3 2 0 0 4 2 0 0 5 2 0 0 6 2 0 0 7 2 0 0 8 2 0 0 9 2 0 1 0 2 0 1 1 2 0 1 2 2 0 1 3<br />
% L o w er<br />
% S am e<br />
% H ig h er<br />
The current sequence of export growth in the Polish manufacturing sector was extended to four months in September. Moreover, the rate of<br />
expansion was strong, and only slightly weaker than August’s 28-month peak. Anecdotal evidence mentioned new customers and improving<br />
demand in Asian and US markets.<br />
Backlogs of Work Index<br />
Q. Please compare the level of outstanding business in your company this month with the situation one month ago.<br />
50 = no change on previous month, S.Adj.<br />
Increasing rate of growth<br />
6 0<br />
5 5<br />
5 0<br />
4 5<br />
4 0<br />
3 5<br />
3 0<br />
Increasing rate of contraction<br />
2 5<br />
1 9 9 9 2 0 0 0 2 0 0 1 2 0 0 2 2 0 0 3 2 0 0 4 2 0 0 5 2 0 0 6 2 0 0 7 2 0 0 8 2 0 0 9 2 0 1 0 2 0 1 1 2 0 1 2 2 0 1 3<br />
% L o w er<br />
% S am e<br />
% H ig h er<br />
Goods producers in <strong>Poland</strong> continued to work through existing contracts in September, as backlogs declined for the twenty-eighth consecutive<br />
month. Reflecting the recent strength of new order growth, however, the pace of depletion remained only modest in the latest period. The seasonally<br />
adjusted Backlogs of Work Index has registered a broadly stable trend since June.<br />
All Intellectual Property Rights owned by Markit Economics Limited 2
1 October 2013<br />
Stocks of Finished Goods Index<br />
Q. Please compare your stocks of finished goods (in units) this month with the situation one month ago.<br />
50 = no change on previous month, S.Adj.<br />
6 0<br />
Increasing rate of growth<br />
% L o w er<br />
% H ig h er<br />
5 5<br />
5 0<br />
4 5<br />
4 0<br />
Increasing rate of contraction<br />
1 9 9 9 2 0 0 0 2 0 0 1 2 0 0 2 2 0 0 3 2 0 0 4 2 0 0 5 2 0 0 6 2 0 0 7 2 0 0 8 2 0 0 9 2 0 1 0 2 0 1 1 2 0 1 2 2 0 1 3<br />
% S am e<br />
The seasonally adjusted Stocks of Finished Goods Index remained below the no-change mark of 50.0 for the seventh successive month in<br />
September, signalling declining post-production inventories in the Polish manufacturing sector. Anecdotal evidence linked the latest destocking<br />
to rising sales demand. The rate of contraction eased since August, but remained historically sharp.<br />
Employment Index<br />
Q. Please compare the level of employment at your unit with the situation one month ago.<br />
50 = no change on previous month, S.Adj.<br />
5 5<br />
Increasing rate of growth<br />
% L o w er<br />
% H ig h er<br />
5 0<br />
4 5<br />
4 0<br />
3 5<br />
Increasing rate of contraction<br />
1 9 9 9 2 0 0 0 2 0 0 1 2 0 0 2 2 0 0 3 2 0 0 4 2 0 0 5 2 0 0 6 2 0 0 7 2 0 0 8 2 0 0 9 2 0 1 0 2 0 1 1 2 0 1 2 2 0 1 3<br />
% S am e<br />
<strong>Manufacturing</strong> employment in <strong>Poland</strong> rose for the second month running in September. Moreover, the rate of job creation accelerated sharply, to<br />
the fastest registered since May 2007. The seasonally adjusted Employment Index rose to its fourth-highest level since data were first collected in<br />
June 1998. Firms linked recruitment to rising workloads and expanded product ranges.<br />
Output Prices Index<br />
Q. Please compare the average price that you charge per unit of output (volume weighted) this month with the situation one month ago.<br />
50 = no change on previous month, S.Adj.<br />
6 5<br />
Increasing rate of inflation<br />
% L o w er<br />
% H ig h er<br />
6 0<br />
5 5<br />
5 0<br />
4 5<br />
4 0<br />
Increasing rate of deflation<br />
1 9 9 9 2 0 0 0 2 0 0 1 2 0 0 2 2 0 0 3 2 0 0 4 2 0 0 5 2 0 0 6 2 0 0 7 2 0 0 8 2 0 0 9 2 0 1 0 2 0 1 1 2 0 1 2 2 0 1 3<br />
% S am e<br />
Output charges set by Polish manufacturers declined for the tenth consecutive month in September. Moreover, factory gate prices have not<br />
increased since June 2012. Firms linked lower output prices to pressure from clients for discounts, and reduced prices for some raw materials.<br />
That said, fewer than 8% of surveyed firms reported lowering their charges since August, and the overall rate of discounting was only modest as a<br />
result.<br />
Input Prices Index<br />
Q. Please compare the average price of your purchases (volume weighted) this month with the situation one month ago.<br />
50 = no change on previous month, S.Adj.<br />
8 0<br />
Increasing rate of inflation<br />
% L o w er<br />
% H ig h er<br />
7 0<br />
6 0<br />
5 0<br />
4 0<br />
3 0<br />
Increasing rate of deflation<br />
1 9 9 9 2 0 0 0 2 0 0 1 2 0 0 2 2 0 0 3 2 0 0 4 2 0 0 5 2 0 0 6 2 0 0 7 2 0 0 8 2 0 0 9 2 0 1 0 2 0 1 1 2 0 1 2 2 0 1 3<br />
% S am e<br />
Polish manufacturers paid higher prices for their inputs, on average, in September compared with one month previously. Around 14% of firms<br />
reported growing cost pressures, linked to higher oil and paper prices in particular. But the overall rate of input price inflation was relatively weak,<br />
as the seasonally adjusted Input Prices Index remained well below its long-run average of 57.0.<br />
3
1 October 2013<br />
Suppliers’ Delivery Times Index<br />
Q. Please compare your suppliers’ delivery times (volume weighted) this month with the situation one month ago.<br />
50 = no change on previous month, S.Adj.<br />
5 5<br />
Increasing rate of shortening<br />
% L o w er<br />
% H ig h er<br />
5 0<br />
4 5<br />
4 0<br />
3 5<br />
Increasing rate of lengthening<br />
1 9 9 9 2 0 0 0 2 0 0 1 2 0 0 2 2 0 0 3 2 0 0 4 2 0 0 5 2 0 0 6 2 0 0 7 2 0 0 8 2 0 0 9 2 0 1 0 2 0 1 1 2 0 1 2 2 0 1 3<br />
% S am e<br />
Average lead times for inputs in the Polish manufacturing sector lengthened in September. That followed a five-month period of shortening delivery<br />
times, the longest sequence of improvement in four years. Anecdotal evidence mainly attributed longer times to rising production demand and<br />
shortages of some raw materials at suppliers.<br />
Quantity of Purchases Index<br />
Q. Please compare the quantity of items purchased (in units) this month with the situation one month ago.<br />
50 = no change on previous month, S.Adj.<br />
6 5<br />
6 0<br />
Increasing rate of growth<br />
% L o w er<br />
% H ig h er<br />
5 5<br />
5 0<br />
4 5<br />
4 0<br />
3 5<br />
Increasing rate of contraction<br />
1 9 9 9 2 0 0 0 2 0 0 1 2 0 0 2 2 0 0 3 2 0 0 4 2 0 0 5 2 0 0 6 2 0 0 7 2 0 0 8 2 0 0 9 2 0 1 0 2 0 1 1 2 0 1 2 2 0 1 3<br />
% S am e<br />
Purchasing activity by Polish manufacturers rose for the third month running in September. The seasonally adjusted Quantity of Purchases Index<br />
fell from August’s 29-month high, but still signalled a robust rate of expansion. The main reason provided by survey respondents for higher input<br />
volumes was rising new orders.<br />
Stocks of Purchases Index<br />
Q. Please compare your stocks of purchases (in units) with the situation one month ago.<br />
50 = no change on previous month, S.Adj.<br />
6 0<br />
Increasing rate of growth<br />
% L o w er<br />
% H ig h er<br />
5 5<br />
5 0<br />
4 5<br />
4 0<br />
3 5<br />
Increasing rate of contraction<br />
1 9 9 9 2 0 0 0 2 0 0 1 2 0 0 2 2 0 0 3 2 0 0 4 2 0 0 5 2 0 0 6 2 0 0 7 2 0 0 8 2 0 0 9 2 0 1 0 2 0 1 1 2 0 1 2 2 0 1 3<br />
% S am e<br />
The seasonally adjusted Stocks of Purchases Index remained below the no-change mark of 50.0 for the eighteenth consecutive month in September,<br />
signalling ongoing warehouse streamlining at Polish manufacturers. That said, the rate of stock depletion was the slowest since February, reflecting<br />
renewed growth in purchasing activity.<br />
Notes on the Data and Method of Presentation<br />
The Purchasing Managers’ Index ® is based on data compiled from monthly replies to questionnaires sent to purchasing executives in over 200 manufacturing companies. The<br />
panel is stratified geographically and by Standard Industrial Classification (SIC) group, based on industry contribution to Polish GDP. Survey responses reflect the change, if any,<br />
in the current month compared to the previous month based on data collected mid-month. For each of the indicators the ‘Report’ shows the percentage reporting each response,<br />
the net difference between the number of higher/better responses and lower/worse responses, and the ‘diffusion’ index. This index is the sum of the positive responses plus a<br />
half of those responding ‘the same’.<br />
The Purchasing Managers’ Index ® (<strong>PMI</strong> ® ) is a composite index based on five of the individual indexes with the following weights derived from Markit’s survey of the UK<br />
manufacturing economy: New Orders - 0.3, Output - 0.25, Employment - 0.2, Suppliers’ Delivery Times - 0.15, Stock of Items Purchased - 0.1, with the Delivery Times index<br />
inverted so that it moves in a comparable direction.<br />
Diffusion indexes have the properties of leading indicators and are convenient summary measures showing the prevailing direction of change. An index reading<br />
above 50 indicates an overall increase in that variable, below 50 an overall decrease. Markit do not revise underlying survey data after first publication, but seasonal<br />
adjustment factors may be revised from time to time as appropriate which will affect the seasonally adjusted data series.<br />
Warning<br />
The intellectual property rights to the <strong>HSBC</strong> <strong>Poland</strong> <strong>Manufacturing</strong> <strong>PMI</strong> provided herein is owned by Markit Economics Limited. Any unauthorised use, including but not limited<br />
to copying, distributing, transmitting or otherwise of any data appearing is not permitted without Markit’s prior consent. Markit shall not have any liability, duty or obligation for or<br />
relating to the content or information (“data”) contained herein, any errors, inaccuracies, omissions or delays in the data, or for any actions taken in reliance thereon. In no event<br />
shall Markit be liable for any special, incidental, or consequential damages, arising out of the use of the data. Purchasing Managers’ Index ® and <strong>PMI</strong> ® are registered trade marks<br />
of Markit Economics Limited, <strong>HSBC</strong> use the above marks under licence. Markit and the Markit logo are registered trade marks of Markit Group Limited.<br />
All Intellectual Property Rights owned by Markit Economics Limited 4


![[the zone of great potential] - KSSE](https://img.yumpu.com/43384797/1/190x134/the-zone-of-great-potential-ksse.jpg?quality=85)