Optimum Sample Size to Detect Perturbation Effects: The ...
Optimum Sample Size to Detect Perturbation Effects: The ...
Optimum Sample Size to Detect Perturbation Effects: The ...

Create successful ePaper yourself
Turn your PDF publications into a flip-book with our unique Google optimized e-Paper software.
Power analysis for sample size estimations 7<br />
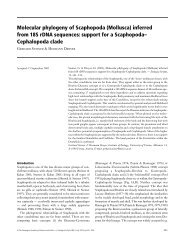
Fig. 3. Power curves for ANOVA design for rocky shores east habitat with a. 10 % (n = 130) and b. 25 %<br />
(n = 21) of variability (dispersion coefficient). Dotted line represents the minimum acceptable power of 0.80.<br />
Thus, an incorrect sampling program <strong>to</strong> assess a potential impact could have negative<br />
consequences on the marine natural systems, especially when the null hypothesis (e.g.,<br />
non-perturbation) was not rejected and simultaneously a posteriori statistical power<br />
was not determined, which finally determines the quality of our conclusions. However,<br />
in those cases when the null hypothesis was not rejected with low power, it is strongly<br />
recommended <strong>to</strong> use the precautionary principle as an important decision-making <strong>to</strong>ol<br />
for improving management polices.