Optimum Sample Size to Detect Perturbation Effects: The ...
Optimum Sample Size to Detect Perturbation Effects: The ...
Optimum Sample Size to Detect Perturbation Effects: The ...

Create successful ePaper yourself
Turn your PDF publications into a flip-book with our unique Google optimized e-Paper software.
6 Ortiz<br />
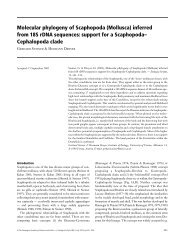
Fig. 2. Power curves for ANOVA design for rocky shores south habitat with a. 10 % (n = 112) and b. 25 %<br />
(n = 18) of variability (dispersion coefficient). Dotted line represents the minimum acceptable power of 0.80.<br />
Based on these considerations, it is demonstrated that the procedure for estimating<br />
the sample size is more complex than that proposed by Mouillot et al. (1999). Definitively,<br />
estimating the magnitude of perturbation, i. e. effect sizes, becomes essential not<br />
only <strong>to</strong> increase the robustness of the statistical test, but also <strong>to</strong> optimise the costs of the<br />
sampling program. For instance, in a situation with large magnitudes of effect size (e.g.,<br />
0.40) it would only be necessary <strong>to</strong> have a maximum variability of 25 %. This would<br />
significantly reduce the costs of sampling and study time. Finally, once effect size rates<br />
are roughly estimated, based on previous sampling or a detailed review of the scientific<br />
literature (for comparable situations), a priori power analysis can be implemented <strong>to</strong><br />
estimate the optimum sample size (Cohen, 1988; Peterman, 1990a; Underwood, 1997).