Optimum Sample Size to Detect Perturbation Effects: The ...
Optimum Sample Size to Detect Perturbation Effects: The ...
Optimum Sample Size to Detect Perturbation Effects: The ...

You also want an ePaper? Increase the reach of your titles
YUMPU automatically turns print PDFs into web optimized ePapers that Google loves.
Power analysis for sample size estimations 5<br />
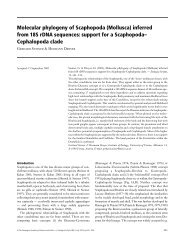
Fig. 1. Power curves for ANOVA design for seagrass west habitat with a. 10 % (n = 118) and b. 25 %<br />
(n = 19) of variability (dispersion coefficient). Dotted line represents the minimum acceptable power of 0.80.<br />
Re-evaluation of data<br />
Figures 1, 2 and 3 show that for the seagrass, rocky shores south and rocky shores west<br />
habitats, respectively, independent of the coefficient of variability, the magnitude of a<br />
possible perturbation (effect size) must always be large, that is ³ 0.40, <strong>to</strong> ensure a high<br />
robustness of the statistical test (ANOVA) in assessing the hypothesis. In a situation<br />
where the putative perturbation is small (effect size = 0.10), no sample size proposed by<br />
Mouillot et al. (1999) is sufficient. Additionally, if the effect size is < 0.10, more than<br />
1000 samples must be taken for an ANOVA design.