Nature Biotechnologytrawls
Nature Biotechnologytrawls
Nature Biotechnologytrawls

Create successful ePaper yourself
Turn your PDF publications into a flip-book with our unique Google optimized e-Paper software.
volume 28 number 8 august 2010<br />
editorials<br />
761 Wrong numbers?<br />
761 MAQC-II: analyze that!<br />
© 2010 <strong>Nature</strong> America, Inc. All rights reserved.<br />
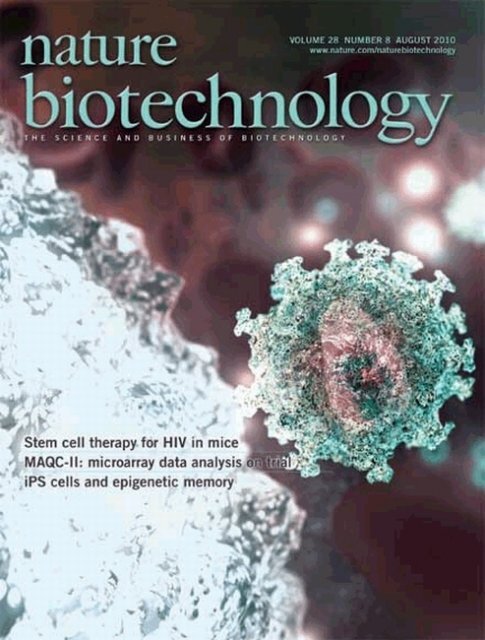
A computer-generated representation<br />
of HIV on the surface of a<br />
T lymphocyte. Holt et al. block the<br />
entry of HIV into blood cells by using<br />
zinc finger nucleases to knock out<br />
CCR5 in hematopoietic stem cells<br />
(p 839). Credit: ANIMATE4.com/<br />
SciencePhotoLibrary<br />
Jackson Lab’s legal woes, p 768<br />
news<br />
763 Industry makes strides in melanoma<br />
765 Firms combine experimental cancer drugs to speed development<br />
767 FDA transparency rules could hit small companies hardest<br />
767 Supremes rule on Bilski<br />
768 Lawsuits rock Jackson<br />
769 Food firms test fry Pioneer’s trans fat–free soybean oil<br />
769 Anti-CD20 patent battle ends<br />
769 EU states free to ban GM crops<br />
770 GM alfalfa—who wins?<br />
770 Biofuel ‘Made in China’<br />
771 data page: 2Q10—spreading the wealth<br />
772 News feature: Drugmakers dance with autism<br />
Bioentrepreneur<br />
Building a business<br />
775 At ground level<br />
Julian Bertschinger<br />
opinion and comment<br />
CORRESPONDENCE<br />
778 Waking up and smelling the coffee<br />
779 Genetic stability in two commercialized transgenic lines (MON810)<br />
780 Distances needed to limit cross-fertilization between GM and conventional<br />
maize in Europe<br />
<strong>Nature</strong> Biotechnology (ISSN 1087-0156) is published monthly by <strong>Nature</strong> Publishing Group, a trading name of <strong>Nature</strong> America Inc. located at 75 Varick Street,<br />
Fl 9, New York, NY 10013-1917. Periodicals postage paid at New York, NY and additional mailing post offices. Editorial Office: 75 Varick Street, Fl 9, New York,<br />
NY 10013-1917. Tel: (212) 726 9335, Fax: (212) 696 9753. Annual subscription rates: USA/Canada: US$250 (personal), US$3,520 (institution), US$4,050<br />
(corporate institution). Canada add 5% GST #104911595RT001; Euro-zone: €202 (personal), €2,795 (institution), €3,488 (corporate institution); Rest of world<br />
(excluding China, Japan, Korea): £130 (personal), £1,806 (institution), £2,250 (corporate institution); Japan: Contact NPG <strong>Nature</strong> Asia-Pacific, Chiyoda Building,<br />
2-37 Ichigayatamachi, Shinjuku-ku, Tokyo 162-0843. Tel: 81 (03) 3267 8751, Fax: 81 (03) 3267 8746. POSTMASTER: Send address changes to <strong>Nature</strong><br />
Biotechnology, Subscriptions Department, 342 Broadway, PMB 301, New York, NY 10013-3910. Authorization to photocopy material for internal or personal<br />
use, or internal or personal use of specific clients, is granted by <strong>Nature</strong> Publishing Group to libraries and others registered with the Copyright Clearance Center<br />
(CCC) Transactional Reporting Service, provided the relevant copyright fee is paid direct to CCC, 222 Rosewood Drive, Danvers, MA 01923, USA. Identification<br />
code for <strong>Nature</strong> Biotechnology: 1087-0156/04. Back issues: US$45, Canada add 7% for GST. CPC PUB AGREEMENT #40032744. Printed by Publishers<br />
Press, Inc., Lebanon Junction, KY, USA. Copyright © 2010 <strong>Nature</strong> America, Inc. All rights reserved. Printed in USA.<br />
i
volume 28 number 8 august 2010<br />
COMMENTARY<br />
783 case study: India’s billion dollar biotech<br />
Justin Chakma, Hassan Masum, Kumar Perampaladas, Jennifer Heys &<br />
Peter A Singer<br />
784 DNA patents and diagnostics: not a pretty picture<br />
Julia Carbone, E Richard Gold, Bhaven Sampat, Subhashini Chandrasekharan,<br />
Lori Knowles, Misha Angrist & Robert Cook-Deegan<br />
Rapid bacterial engineering, p 812<br />
feature<br />
793 Public biotech 2009—the numbers<br />
Brady Huggett, John Hodgson & Riku Lähteenmäki<br />
© 2010 <strong>Nature</strong> America, Inc. All rights reserved.<br />
State<br />
H3K14ac<br />
H3K23ac<br />
H4K12ac<br />
H2AK9ac<br />
H4K16ac<br />
H2AK5ac<br />
H4K91ac<br />
H3K4ac<br />
H2BK20ac<br />
H3K18ac<br />
H2BK120ac<br />
H3K27ac<br />
H2BK5ac<br />
H2BK12ac<br />
H3K36ac<br />
H4K5ac<br />
H4K8ac<br />
H3K9ac<br />
PolII<br />
CTCF<br />
H2AZ<br />
H3K4me3<br />
H3K4me2<br />
H3K4me1<br />
H3K9me1<br />
H3K79me3<br />
H3K79me2<br />
H3K79me1<br />
H3K27me1<br />
H2BK5me1<br />
H4K20me1<br />
H3K36me3<br />
H3K36me1<br />
H3R2me1<br />
H3R2me2<br />
H3K27me2<br />
H3K27me3<br />
H4R3me2<br />
H3K9me2<br />
H3K9me3<br />
H4K20me3<br />
1<br />
2<br />
3<br />
4<br />
5<br />
6<br />
7<br />
8<br />
9<br />
10<br />
11<br />
12<br />
13<br />
14<br />
15<br />
16<br />
17<br />
18<br />
19<br />
20<br />
21<br />
22<br />
23<br />
24<br />
25<br />
26<br />
Epigenetic marks define chromatin<br />
states, p 817<br />
patents<br />
801 Bilski v. Kappos: the US Supreme Court broadens patent subject-matter eligibility<br />
William J Simmons<br />
806 Recent patent applications in proteomics<br />
NEWS AND VIEWS<br />
807 Can HIV be cured with stem cell therapy?<br />
Steven G Deeks & Joseph M McCune see also p 839<br />
810 Microarrays in the clinic<br />
Guy W Tillinghast see also p 827<br />
812 Shaking up genome engineering<br />
Kim A Tipton & John Dueber see also p 856<br />
813 The expanding family of dendritic cell subsets<br />
Hideki Ueno, A Karolina Palucka & Jacques Banchereau<br />
816 Research highlights<br />
computational biology<br />
analysis<br />
817 Discovery and characterization of chromatin states for systematic annotation of<br />
the human genome<br />
Jason Ernst & Manolis Kellis<br />
0.982 0.910 0.845 0.748 0.575 0.557 0.311 0.323 0.244 0.193<br />
0.973 0.918 0.829 0.792 0.493 0.437 0.322 0.306 0.307 0.202<br />
0.965 0.801 0.816 0.652 0.514 0.349 0.383 0.360 0.217 0.243<br />
0.991 0.752 0.750 0.778 0.509 0.483 0.345 0.305 0.295 0.193<br />
0.973 0.869 0.825 0.755 0.403 0.413 0.321 0.275 0.193 0.266<br />
0.982 0.762 0.823 0.702 0.533 0.557 0.284 0.203 0.143 0.257<br />
0.982 0.871 0.445 0.728 0.472 0.249 0.429 0.353 0.295 0.293<br />
0.930 0.838 0.805 0.773 0.542 0.386 0.345 0.289 0.225 0.181<br />
0.982 0.847 0.835 0.737 0.488 0.344 0.118 0.324 0.110 0.176<br />
0.973 0.860 0.829 0.690 0.371 0.376 0.344 0.229 0.057 0.243<br />
0.956 0.815 0.847 0.773 0.491 0.202 0.185 0.385 −0.014 0.187<br />
0.982 0.847 0.780 0.755 0.377 0.423 0.313 −0.042 0.198 0.241<br />
0.725 0.782 0.824 0.770 0.531 0.344 0.168 0.349 −0.096 0.165<br />
0.982 0.707 0.782 0.466 0.499 0.184 0.271 0.000 −0.062 0.203<br />
0.636 0.761 0.454 0.748 0.247 0.377 0.062 0.324 0.043 0.085<br />
0.856 0.054 0.709 0.751 0.455 −0.213 −0.078 0.114 0.479 −0.096<br />
0.982 0.830 0.595 0.544 0.036 −0.090 −0.027 0.336 −0.143 −0.030<br />
0.973 0.830 0.816 0.748 0.491 0.376 0.311 0.306 0.193 0.193<br />
0.982 0.891 0.829 0.732 0.403 0.479 0.429 0.301 0.217 0.162<br />
Evaluating microarray classifiers,<br />
p 827<br />
research<br />
ARTICLES<br />
827 The MicroArray Quality Control (MAQC)-II study of common practices for the<br />
development and validation of microarray-based predictive models<br />
MAQC Consortium see also p 810<br />
839 Human hematopoietic stem/progenitor cells modified by zinc-finger nucleases<br />
targeted to CCR5 control HIV-1 in vivo<br />
N Holt, J Wang, K Kim, G Friedman, X Wang, V Taupin, G M Crooks, D B Kohn,<br />
P D Gregory, M C Holmes & P M Cannon see also p 807<br />
nature biotechnology<br />
iii
volume 28 number 8 august 2010<br />
848 Cell type of origin influences the molecular and functional properties of mouse<br />
induced pluripotent stem cells<br />
J M Polo, S Liu, M E Figueroa, W Kulalert, S Eminli, K Yong Tan, E Apostolou,<br />
M Stadtfeld, Y Li, T Shioda, S Natesan, A J Wagers, A Melnick, T Evans &<br />
K Hochedlinger<br />
856 Rapid profiling of a microbial genome using mixtures of barcoded oligonucleotides<br />
J R Warner, P J Reeder, A Karimpour-Fard, L B A Woodruff & R T Gill<br />
see also p 812<br />
letters<br />
Epigenetics of iPS cells, p 848<br />
863 Implications of the presence of N-glycolylneuraminic acid in recombinant<br />
therapeutic glycoproteins<br />
D Ghaderi, R E Taylor, V Padler-Karavani, S Diaz & A Varki<br />
868 Global analysis of lysine ubiquitination by ubiquitin remnant immunoaffinity<br />
profiling<br />
G Xu, J S Paige & S R Jaffrey<br />
© 2010 <strong>Nature</strong> America, Inc. All rights reserved.<br />
careers and recruitment<br />
875 Second quarter biotech job picture<br />
Michael Francisco<br />
876 people<br />
nature biotechnology<br />
v
in this issue<br />
© 2010 <strong>Nature</strong> America, Inc. All rights reserved.<br />
MAQC-II: evaluating microarray<br />
classifiers<br />
Building on its original work<br />
assessing the technical performance<br />
of DNA microarray technology (http://<br />
www.nature.com/nbt/focus/maqc/<br />
index.html), the Microarray Quality<br />
Control (MAQC) consortium, a<br />
partnership of research groups from<br />
the US Food and Drug Administration<br />
(FDA), academia, industry and other government agencies, has<br />
set out to investigate the capabilities and limitations of microarray<br />
data analysis with respect to disease diagnosis or choice of<br />
therapies. Although numerous methods for analyzing microarray<br />
data have been developed, there remains a lack of consensus<br />
regarding best practices in terms of their use in identifying gene<br />
signatures that are representative of a pathological condition.<br />
Such practices are becoming increasingly important, especially<br />
as the FDA receives many proposals to use microarrays to support<br />
medical product development and testing. In the present paper, 36<br />
data analysis teams applied a variety of analytic methods to build<br />
classifiers to predict the toxicity of chemicals in rodent models and<br />
to predict clinical outcomes in human patients with breast cancer,<br />
multiple myeloma or neuroblastoma. The experience gained during<br />
this large project may be useful for developing classifiers for data<br />
from other high-throughput assays. This is important in light of<br />
the study’s finding that microarrays perform poorly at making<br />
certain clinical predictions, suggesting that technologies that<br />
assay additional aspects of human physiology may be needed to<br />
formulate better clinical treatment plans. [Articles, p. 827;<br />
News and Views p. 810]<br />
CM<br />
Engineered stem cells control HIV<br />
Cannon and colleagues present an anti-HIV strategy in which human<br />
hematopoietic stem/progenitor cells are modified with zinc-finger<br />
nucleases to knock out C-C chemokine receptor 5 (CCR5), the principal<br />
co-receptor for HIV. CCR5 has been a target of exceptional interest<br />
ever since the 1996 discovery that a homozygous 32-bp deletion in<br />
the gene confers resistance to HIV infection without any apparent<br />
ill effects on health. Most previous work has used small molecules,<br />
ribozymes or siRNA to inhibit CCR5 protein or mRNA. In contrast,<br />
Cannon and colleagues nucleofect plasmids expressing two zincfinger<br />
nucleases into human CD34 + stem/progenitor cells to permanently<br />
knock out the CCR5 gene. The modified cells are transplanted<br />
into irradiated, immunodeficient mice and allowed to engraft for<br />
8–12 weeks before the mice are challenged with CCR5-tropic HIV.<br />
Although human T cell counts initially decline, by week 8 they have<br />
recovered to their original levels. By weeks 10 and 12, HIV RNA in<br />
Written by Kathy Aschheim, Markus Elsner, Michael Francisco,<br />
Peter Hare, Craig Mak, & Lisa Melton<br />
the intestine is undetectable. Because hematopoietic stem cells can<br />
reconstitute the entire hematopoietic system, the authors propose that<br />
modified CD34 + cells could provide long-term HIV resistance in all<br />
the lymphoid and myeloid cell types that the virus infects. In support<br />
of this hypothesis, a transplant of allogeneic CCR5Δ32 hematopoietic<br />
stem cells in an HIV + individual with acute myeloid leukemia may<br />
have cured the HIV infection (N. Engl. J. Med. 360, 724–725, 2009).<br />
[Articles, p. 839; News and Views, p. 807]<br />
KA<br />
Epigenetic marks stand together<br />
State 2<br />
State 3<br />
State 5<br />
State 37<br />
State 38<br />
Coding Exon<br />
Spliced ESTs<br />
Mammalian<br />
Conservation<br />
With over 100 known<br />
histone modifications<br />
that can occur in<br />
thousands of possible<br />
combinations, it is challenging<br />
to identify specific combinations that have distinct biological<br />
functions. Ernst and Kellis describe an algorithm that deduces<br />
chromatin states (reoccurring, spatially coherent combinations of<br />
epigenetic marks) from experimental data on the distribution of different<br />
modifications. Using a multivariate Hidden Markov Model to<br />
analyze data on the position of 41 different marks in human T cells,<br />
they define 51 distinct chromatin states. The authors correlate these<br />
states with prior genome annotation and find that individual states<br />
are associated with specific functional regions such as gene promoters,<br />
transcriptionally active genes, large-scale repressed regions or<br />
intergenic active regions. The identification of chromatin states will<br />
facilitate genome annotation, the discovery of functional elements,<br />
and mechanistic studies of gene regulation by epigenetic marks.<br />
[Analysis, p. 817]<br />
ME<br />
Faster trait-to-gene mapping<br />
chr1:<br />
242959000 242959500 242960000 242960500 242961000 242961500<br />
low-expression promoter state<br />
new exon prediction<br />
Gill and colleagues describe an approach for creating rationally modified<br />
collections of Escherichia coli in which every strain contains the<br />
same defined mutation but in a different gene. Such collections are<br />
valuable tools for mapping the genetic basis of traits, but until now<br />
have been labor intensive to construct. The method creates thousands<br />
of modified strains in parallel by transforming bacteria with<br />
pools of oligonucleotides that each recombine with a single gene<br />
to introduce a mutation. Barcode sequence tags uniquely identify<br />
each oligo and thus each strain. The collection of strains is grown<br />
in a condition of interest that selects for genetic modifications that<br />
confer fitness advantages. Fitter strains are recovered and identified<br />
by sequencing or by microarray detection of their barcodes. To demonstrate<br />
the method, Gill and colleagues created collections of E. coli<br />
with strains in which single genes were either up- or downregulated.<br />
Growing these strains in cellulosic hydrolysates—a toxic intermediate<br />
of biofuel processing—or in the presence of valine, d-fucose or<br />
methyglyoxal revealed unexpected genes that influenced growth in<br />
these industrially relevant conditions. The identified genes could<br />
form the basis for subsequent combinatorial genetic engineering.<br />
[Articles, p. 856; News and Views, p. 812]<br />
CM<br />
nature biotechnology volume 28 number 8 august 2010<br />
vii
in this issue<br />
© 2010 <strong>Nature</strong> America, Inc. All rights reserved.<br />
Ubiquitination sites in the crosshairs<br />
Immunoaffinity-based approaches have been<br />
key to enabling proteome-wide analysis of<br />
post-translational modifications such as phosphorylation.<br />
However, attempts to selectively<br />
purify ubiquitinated peptides on a large scale<br />
have been frustrated by the difficulty of isolating and identifying peptides<br />
tagged with the 76-amino-acid ubiquitin protein. Jaffrey and colleagues<br />
simplify such analyses by generating a monoclonal antibody that selectively<br />
recognizes sites of protein ubiquitination. When protein lysates are digested<br />
with trypsin, ubiquitin adducts are trimmed to a diglycine stub. The ability<br />
of the antibody to recognize these ubiquitin remnants conjugated to the<br />
side chains of ubiquitinated lysines in a range of sequence contexts enables<br />
the authors to enrich for peptides carrying sites of ubiquitination and then<br />
identify them using tandem mass spectrometry. Working with cells expressing<br />
hexahistidine-tagged ubiquitin, the authors use this strategy to extend<br />
the catalog of mammalian ubiquitinated proteins and further illustrate the<br />
strength of the approach by demonstrating differential regulation of ubiquitination<br />
at distinct sites within the same protein. [Letters, p. 868] PH<br />
Neu5Gc content and biologics<br />
Much effort has been devoted to reducing the immunogenicity of protein<br />
biologics caused by peptide epitopes. However, far less attention has been<br />
Patent Roundup<br />
The US Food and Drug Administration is proposing new<br />
transparency rules to increase the information it discloses<br />
about product applications. The rules could compromise trade<br />
secret protection and put small companies at a competitive<br />
disadvantage. [News Analysis, p. 767]<br />
LM<br />
The US Supreme Court’s long-awaited decision on Bilski v.<br />
Kappos rules against patenting only inventions transformed by<br />
a machine. But the ruling leaves several questions unanswered,<br />
especially with regard to the eligibility of patents for diagnostic<br />
methods. [News in brief, p. 767]<br />
LM<br />
The not-for-profit Jackson Laboratory has been caught up in<br />
patent disputes, for the first time in its 80-year history. If the<br />
expense of such litigation escalates, the lab may have to cover its<br />
costs by charging researchers higher prices for access to mouse<br />
strains in its repository. [News in brief, p. 768]<br />
LM<br />
A four-year dispute over a European patent for an anti-CD20<br />
monoclonal antibody to treat rheumatoid arthritis has ended in<br />
favor of Trubion, based in Seattle, and against Genentech and<br />
Biogen Idec. The decision frees up the patent space for anyone<br />
contemplating a CD20 program, according to Trubion. [News in<br />
brief, p. 769]<br />
LM<br />
Both sides are claiming victory following the US Supreme Court’s<br />
verdict in Monsanto v. Geerston Seed Farms over future sales of<br />
Roundup Ready alfalfa seeds. Monsanto (St. Louis, MO) cheered<br />
the court’s decision to reverse a previous injunction banning the<br />
transgenic alfalfa, but the seeds’ commercialization is still subject<br />
to an environmental impact statement by the US Department of<br />
Agriculture. [News in brief, p. 770]<br />
LM<br />
The US Supreme Court recently broadened the definition of<br />
patent-eligible subject matter. In this issue, Simmons parses Bilski<br />
v. Kappos and what the far-reaching decision means for biotech<br />
and pharmaceutical patent seekers. [Patent Article, p. 801] MF<br />
Recent patent applications in proteomics. [New Patents, p. 806]MF<br />
GG<br />
K<br />
paid to the possibility of untoward effects caused by immune reactions to<br />
glycans on glycoprotein therapeutics. Varki and colleagues present evidence<br />
suggesting that it may be necessary to revisit whether the presence<br />
of the sialic acid N-glycolylneuraminic acid (Neu5Gc) on certain glycoprotein<br />
drugs may influence their immunogenicity and half-lives in vivo.<br />
Unlike other mammals studied to date, humans lack the ability to make<br />
Neu5Gc. Nonetheless, recent studies have revealed that most of us have<br />
variable—and sometimes relatively high—levels of circulating antibodies<br />
against Neu5Gc. The authors demonstrate the presence of Neu5Gc<br />
on only one of two clinically approved monoclonal antibodies directed<br />
against the same target. In vitro, antibodies or antisera against Neu5Gc<br />
from healthy humans generate immune complexes only in the presence<br />
of the Neu5Gc-containing drug. Moreover, antibodies to Neu5Gc in mice<br />
with a human-like defect in Neu5Gc synthesis promote the clearance of<br />
only the Neu5Gc-containing drug. Injection of this drug also promotes<br />
the production of preexisting antibodies against Neu5Gc. If further studies<br />
support the possibility that antibodies against Neu5Gc might influence<br />
the immunogenicity and efficacy of therapeutic glycoproteins in<br />
humans, production using cultured human cells may not resolve the issue,<br />
as Neu5Gc could still be incorporated from animal-derived products in<br />
culture media. Varki and colleagues show that a better solution would be<br />
to displace Neu5Gc from being incorporated into recombinant proteins<br />
by inclusion of an excess of the human sialic acid N-acetylneuraminic acid<br />
in culture media. [Letters, p. 863]<br />
PH<br />
Epigenetic memory in iPS cells<br />
All induced pluripotent stem (iPS)<br />
cells from different tissues are not<br />
created equal. That is the conclusion<br />
of a study comparing mouse<br />
iPS cells derived from four tissues—<br />
tail-tip fibroblasts, splenic B cells,<br />
bone marrow–derived granulocytes and skeletal muscle precursors.<br />
Hochedlinger and colleagues use a ‘secondary’ system for reprogramming<br />
(Nat. Biotechnol. 26, 916–924, 2008) so that all iPS cells have identical<br />
integrations of the four transgenes, eliminating this confounding variable.<br />
They find that early-passage iPS cells retain an epigenetic memory of their<br />
cell type of origin and that this memory alters the cells’ gene expression<br />
and differentiation potential. Notably, these epigenetic, transcriptional and<br />
functional differences can be attenuated by extended passaging. Several<br />
lines of evidence suggest that this erasure of epigenetic memory occurs<br />
not though the selection of rare, fully reprogrammed cells but through<br />
gradual epigenetic changes in the majority of cells. Epigenetic memory<br />
in iPS cells can be considered desirable or not depending on one’s experimental<br />
goals. In studies aimed at producing a specific cell type, it could be<br />
beneficial—suggesting, for example, that a project to generate blood cells<br />
should begin by reprogramming blood cells rather than an unrelated cell<br />
type. [Articles, p. 848]<br />
KA<br />
Next month in<br />
• Castor bean genome<br />
• Benchmarking dynamic mass redistribution<br />
• Measuring protein-DNA interactions at equilibrium<br />
• Metabolic modeling made easier<br />
viii<br />
volume 28 number 8 august 2010 nature biotechnology
© 2010 <strong>Nature</strong> America, Inc. All rights reserved.<br />
www.nature.com/naturebiotechnology<br />
EDITORIAL OFFICE<br />
biotech@us.nature.com<br />
75 Varick Street, Fl 9, New York, NY 10013-1917<br />
Tel: (212) 726 9200, Fax: (212) 696 9635<br />
Chief Editor: Andrew Marshall<br />
Senior Editors: Laura DeFrancesco (News & Features), Kathy Aschheim (Research),<br />
Peter Hare (Research), Michael Francisco (Resources and Special Projects)<br />
Business Editor: Brady Huggett<br />
Associate Business Editor: Victor Bethencourt<br />
News Editor: Lisa Melton<br />
Associate Editors: Markus Elsner (Research), Craig Mak (Research)<br />
Editor-at-Large: John Hodgson<br />
Contributing Editors: Mark Ratner, Chris Scott<br />
Contributing Writer: Jeffrey L. Fox<br />
Senior Copy Editor: Teresa Moogan<br />
Managing Production Editor: Ingrid McNamara<br />
Senior Production Editor: Brandy Cafarella<br />
Production Editor: Amanda Crawford<br />
Senior Illustrator: Katie Vicari<br />
Illustrator/Cover Design: Kimberly Caesar<br />
Senior Editorial Assistant: Ania Levinson<br />
MANAGEMENT OFFICES<br />
NPG New York<br />
75 Varick Street, Fl 9, New York, NY 10013-1917<br />
Tel: (212) 726 9200, Fax: (212) 696 9006<br />
Publisher: Melanie Brazil<br />
Executive Editor: Linda Miller<br />
Chief Technology Officer: Howard Ratner<br />
Head of <strong>Nature</strong> Research & Reviews Marketing: Sara Girard<br />
Circulation Manager: Stacey Nelson<br />
Production Coordinator: Diane Temprano<br />
Head of Web Services: Anthony Barrera<br />
Senior Web Production Editor: Laura Goggin<br />
NPG London<br />
The Macmillan Building, 4 Crinan Street, London N1 9XW<br />
Tel: 44 207 833 4000, Fax: 44 207 843 4996<br />
Managing Director: Steven Inchcoombe<br />
Publishing Director: Peter Collins<br />
Editor-in-Chief, <strong>Nature</strong> Publications: Philip Campbell<br />
Marketing Director: Della Sar<br />
Director of Web Publishing: Timo Hannay<br />
NPG <strong>Nature</strong> Asia-Pacific<br />
Chiyoda Building, 2-37 Ichigayatamachi, Shinjuku-ku, Tokyo 162-0843<br />
Tel: 81 3 3267 8751, Fax: 81 3 3267 8746<br />
Publishing Director — Asia-Pacific: David Swinbanks<br />
Associate Director: Antoine E. Bocquet<br />
Manager: Koichi Nakamura<br />
Operations Director: Hiroshi Minemura<br />
Marketing Manager: Masahiro Yamashita<br />
Asia-Pacific Sales Director: Kate Yoneyama<br />
Asia-Pacific Sales Manager: Ken Mikami<br />
DISPLAY ADVERTISING<br />
display@us.nature.com (US/Canada)<br />
display@nature.com (Europe)<br />
nature@natureasia.com (Asia)<br />
Global Head of Advertising and Sponsorship: Dean Sanderson, Tel: (212) 726 9350,<br />
Fax: (212) 696 9482<br />
Global Head of Display Advertising and Sponsorship: Andrew Douglas, Tel: 44 207 843 4975,<br />
Fax: 44 207 843 4996<br />
Asia-Pacific Sales Director: Kate Yoneyama, Tel: 81 3 3267 8765, Fax: 81 3 3267 8746<br />
Display Account Managers:<br />
New England: Sheila Reardon, Tel: (617) 399 4098, Fax: (617) 426 3717<br />
New York/Mid-Atlantic/Southeast: Jim Breault, Tel: (212) 726 9334, Fax: (212) 696 9481<br />
Midwest: Mike Rossi, Tel: (212) 726 9255, Fax: (212) 696 9481<br />
West Coast: George Lui, Tel: (415) 781 3804, Fax: (415) 781 3805<br />
Germany/Switzerland/Austria: Sabine Hugi-Fürst, Tel: 41 52761 3386, Fax: 41 52761 3419<br />
UK/Ireland/Scandinavia/Spain/Portugal: Evelina Rubio-Hakansson, Tel: 44 207 014 4079,<br />
Fax: 44 207 843 4749<br />
UK/Germany/Switzerland/Austria: Nancy Luksch, Tel: 44 207 843 4968, Fax: 44 207 843 4749<br />
France/Belgium/The Netherlands/Luxembourg/Italy/Israel/Other Europe: Nicola Wright,<br />
Tel: 44 207 843 4959, Fax: 44 207 843 4749<br />
Asia-Pacific Sales Manager: Ken Mikami, Tel: 81 3 3267 8765, Fax: 81 3 3267 8746<br />
Greater China/Singapore: Gloria To, Tel: 852 2811 7191, Fax: 852 2811 0743<br />
NATUREJOBS<br />
naturejobs@us.nature.com (US/Canada)<br />
naturejobs@nature.com (Europe)<br />
nature@natureasia.com (Asia)<br />
US Sales Manager: Ken Finnegan, Tel: (212) 726 9248, Fax: (212) 696 9482<br />
European Sales Manager: Dan Churchward, Tel: 44 207 843 4966, Fax: 44 207 843 4596<br />
Asia-Pacific Sales & Business Development Manager: Yuki Fujiwara, Tel: 81 3 3267 8765,<br />
Fax: 81 3 3267 8752<br />
SPONSORSHIP<br />
g.preston@nature.com<br />
Global Head of Sponsorship: Gerard Preston, Tel: 44 207 843 4965, Fax: 44 207 843 4749<br />
Business Development Executive: David Bagshaw, Tel: (212) 726 9215, Fax: (212) 696 9591<br />
Business Development Executive: Graham Combe, Tel: 44 207 843 4914, Fax: 44 207 843 4749<br />
Business Development Executive: Reya Silao, Tel: 44 207 843 4977, Fax: 44 207 843 4996<br />
SITE LICENSE BUSINESS UNIT<br />
Americas: Tel: (888) 331 6288<br />
institutions@us.nature.com<br />
Asia/Pacific: Tel: 81 3 3267 8751<br />
institutions@natureasia.com<br />
Australia/New Zealand: Tel: 61 3 9825 1160<br />
nature@macmillan.com.au<br />
India: Tel: 91 124 2881054/55<br />
npgindia@nature.com<br />
ROW: Tel: 44 207 843 4759<br />
institutions@nature.com<br />
CUSTOMER SERVICE<br />
www.nature.com/help<br />
Senior Global Customer Service Manager: Gerald Coppin<br />
For all print and online assistance, please visit www.nature.com/help<br />
Purchase subscriptions:<br />
Americas: <strong>Nature</strong> Biotechnology, Subscription Dept., 342 Broadway, PMB 301, New York, NY 10013-<br />
3910, USA. Tel: (866) 363 7860, Fax: (212) 334 0879<br />
Europe/ROW: <strong>Nature</strong> Biotechnology, Subscription Dept., Macmillan Magazines Ltd., Brunel Road,<br />
Houndmills, Basingstoke RG21 6XS, United Kingdom. Tel: 44 1256 329 242, Fax: 44 1256 812 358<br />
Asia-Pacific: <strong>Nature</strong> Biotechnology, NPG <strong>Nature</strong> Asia-Pacific, Chiyoda Building,<br />
2-37 Ichigayatamachi, Shinjuku-ku, Tokyo 162-0843. Tel: 81 3 3267 8751, Fax: 81 3 3267 8746<br />
India: <strong>Nature</strong> Biotechnology, NPG India, 3A, 4th Floor, DLF Corporate Park, Gurgaon 122002, India.<br />
Tel: 91 124 2881054/55, Tel/Fax: 91 124 2881052<br />
REPRINTS<br />
reprints@us.nature.com<br />
<strong>Nature</strong> Biotechnology, Reprint Department, <strong>Nature</strong> Publishing Group, 75 Varick Street, Fl 9,<br />
New York, NY 10013-1917, USA.<br />
For commercial reprint orders of 600 or more, please contact:<br />
UK Reprints: Tel: 44 1256 302 923, Fax: 44 1256 321 531<br />
US Reprints: Tel: (617) 494 4900, Fax: (617) 494 4960
Editorial<br />
© 2010 <strong>Nature</strong> America, Inc. All rights reserved.<br />
Wrong numbers?<br />
With biotech infiltrating multiple industries and fewer<br />
life science ventures listing on stock exchanges, what<br />
do we really learn from surveying the set of public<br />
biotech companies?<br />
Each year, <strong>Nature</strong> Biotechnology trawls through the accounts of publicly<br />
quoted biotech companies and pulls out some numbers that characterize<br />
this part of the commercial life science landscape. Perhaps the most<br />
surprising statistic this year was that most of the companies that appeared<br />
in last year’s survey are still there. The current straitened circumstances<br />
took their toll, of course, but total revenues were up 10%, R&D was only<br />
down 4% and the group collectively was profitable for another year. But<br />
what, if anything, does the survey tell us about the general health of the<br />
innovative life science sector?<br />
Back in the 1990s, the answer seemed clear. Thanks to much freer flows<br />
of capital then, the annual audit measured the progress of a specialized,<br />
self-reliant and relatively independent industrial endeavor. It assessed the<br />
rapid churn of companies listing newly on exchanges. Companies could<br />
float much earlier; some were even able to go public without products in<br />
human trials. Buoyant stock markets took valuations to ecstatic heights<br />
and poured money into the sector. Product for product and dollar for dollar,<br />
biotech companies were valued much more highly than ‘traditional’<br />
pharma companies.<br />
That differential was unsustainable. As Amgen and Genentech and<br />
Biogen Idec and others climbed up the pharmaceutical league standings,<br />
reality dawned. Innovators metamorphosed into drugmakers. And as the<br />
pharma sponge absorbed more biotech, the boundaries between the two<br />
spheres faded.<br />
The consequence of this merging is that much, if not most, of the<br />
biological products and biological techniques now resides outside the<br />
group of independent public companies that we survey. Pharma spends<br />
$65 billion a year on R&D, 25–40% of it either devoted to biological<br />
products or using the techniques of biotech. Thus, pharma outspends<br />
‘biotech,’ even on biotech R&D. Furthermore, biotech processes extend<br />
far beyond the pharmaceutical segment: political imperatives and<br />
technological capability have expanded industrial biotech for biofuels<br />
production, waste management and green chemistry. Geographically,<br />
biotech is no longer a Western province: China, India, South Korea and<br />
elsewhere are prominent actors in follow-on biologic drugs, diagnostics<br />
and clinical testing.<br />
Our public company survey reflects none of these changes: pharma<br />
companies, biogenerics firms, diagnostic and device providers all fall outside<br />
the definitions of our survey. In Asia, successful biotech companies<br />
(see p. 783) have only restricted access to mature public capital markets.<br />
Overall, the survey is now less a gauge for innovative life science and more<br />
a pointer to the shape of the Western healthcare market. To measure life<br />
sciences’ impact more broadly, other indicators are needed.<br />
To quantify innovation, we need to look, too, at activities within small<br />
private companies and, increasingly, at the early translational work in the<br />
public sector. These data are exponentially more difficult to gather than<br />
data from publicly quoted firms. Accordingly, policymakers, governments<br />
and industry associations need to devote much more effort and resources<br />
to collecting them.<br />
MAQC-II: analyze that!<br />
The MAQC consortium’s latest study suggests that human<br />
error in handling DNA microarray data analysis software<br />
could delay the technology’s wider adoption in the clinic.<br />
Following up on its publications in <strong>Nature</strong> Biotechnology four years ago<br />
(http://www.nature.com/nbt/focus/maqc/index.html), the Microarray<br />
Quality Control (MAQC) consortium publishes the results of its second<br />
phase of assessment (MAQC-II) on p. 827, in conjunction with ten accompanying<br />
papers in The Pharmacogenomics Journal (http://www.nature.<br />
com/tpj/journal/v10/n4/index.html). The new work assesses the capabilities<br />
and limitations of microarray data analysis methods—so-called<br />
genomic classifiers—in identifying gene signatures representative of a<br />
specific pathological condition.<br />
All in all, >30,000 genomic classifier models were built by combining<br />
one of 17 different data preprocessing and normalization methods,<br />
with one of 9 methods for filtering out problematic data, with one of >33<br />
techniques for picking ‘signature’ genes, with one of >24 algorithms for<br />
discerning patterns from those genes, and with one of 6 methods for testing<br />
the robustness of the results. Thirty-six research teams sought gene<br />
signatures within 6 massive microarray datasets derived from toxicological<br />
studies of chemicals on rodents and expression profiles of human cancer<br />
patients that predict 13 ‘endpoints’ potentially relevant to preclinical or<br />
clinical applications.<br />
As discussed on p. 810, one key finding of MAQC-II is that the classifier<br />
models are remarkably similar in predicting outcome, irrespective of the<br />
approach used. On the other hand, the overall success of the classifiers in<br />
predicting endpoints depends on the endpoints themselves. For example,<br />
predictions were in general much worse for breast cancer and multiple<br />
myeloma, which have highly heterogenous genetic backgrounds, than for<br />
liver toxicology or neuroblastoma.<br />
Perhaps most striking of all, some data analysis teams were consistently<br />
better at predictions than others. This may relate to simple errors<br />
associated with manipulating such large datasets. But insufficient tuning<br />
of the parameters used in a classifier model is also a likely contributor.<br />
In this sense, MAQC-II was as much an exercise in sociology as in<br />
technology. The human element in classifier implementation is key.<br />
Thus a key take-home message is that classifier protocols need to be<br />
more tightly described and more tightly executed. In this respect, regulatory<br />
agencies and scientific journals can promote good practice. A clear<br />
need exists for greater meticulousness both in documenting the parameters<br />
of a particular classifier model used and in detailing the procedures<br />
for normalization, batch effect correction, quality control and reduction<br />
of quality control flaws. Greater attention to detail will not only enhance<br />
reproducibility of research—it will also facilitate the progression of this<br />
technology toward the clinic.<br />
nature biotechnology volume 28 number 8 august 2010 761
in this section<br />
Investigational<br />
cancer agents<br />
tested in pairs<br />
p765<br />
Transparency rules<br />
challenge small<br />
firms p767<br />
news<br />
GM soybeans for<br />
trans fat–free oil<br />
p769<br />
Industry makes strides in melanoma<br />
© 2010 <strong>Nature</strong> America, Inc. All rights reserved.<br />
After decades of continuous failures, the treatment<br />
of metastatic melanoma is finally advancing.<br />
This year’s American Society for Clinical<br />
Oncology (ASCO) annual meeting heralded<br />
a breakthrough antibody therapy for the disease.<br />
Top-line, phase 3 results for Bristol-Myers<br />
Squibb’s humanized monoclonal antibody<br />
(mAb) ipilimumab showed a survival benefit<br />
in patients with advanced cancer—the first<br />
ever phase 3 trial to do so. These results contrast<br />
with a litany of letdowns from cancer vaccines,<br />
cytokine therapies, adoptive T-cell therapies as<br />
well as several targeted therapies that all have<br />
failed to improve on standard chemotherapy,<br />
which itself achieves a meager 15% response rate<br />
with negligible survival benefit. “Those of us in<br />
the melanoma business have felt like we’ve been<br />
in a long, dark tunnel,” said oncologist Vernon<br />
Sondak, of the H. Lee Moffitt Cancer Center in<br />
Tampa, Florida, at the ASCO meeting.<br />
The ipilimumab data, released by New<br />
York–based Bristol-Myers Squibb in June, have<br />
changed all that. The 676 individuals included in<br />
the study had unresectable, metastatic melanoma<br />
and had previously undergone chemotherapy for<br />
the disease. Those receiving ipilimumab, with<br />
or without the synthetic peptide vaccine glycoprotein<br />
100 (gp100), had a median survival<br />
of about 10 months, against 6.4 months for the<br />
vaccine alone. Ipilimumab, which targets cytotoxic<br />
T-lymphocyte antigen 4 (CTLA4), nearly<br />
doubled the rates of survival at 12 months (46%<br />
versus 25%) and 24 months (24% versus 14%)<br />
after treatment compared with the peptide.<br />
“This is really a benchmark for the field,” says<br />
John Kirkwood, a melanoma researcher at the<br />
University of Pittsburgh. “We finally have a randomized<br />
controlled trial that is positive.”<br />
Finalized phase 1 results of a BRAF inhibitor,<br />
developed by the Berkeley, California–based<br />
Plexxikon, are at least as dramatic. The small<br />
molecule PLX4032 (also RG7204), which<br />
Plexxikon is co-developing with Roche of Basel,<br />
specifically inhibits the V600E mutant BRAF, a<br />
constitutively active kinase present in more than<br />
half of metastatic melanomas. The drug produced<br />
an 81% response rate among 32 patients<br />
receiving the therapeutic dose. “The early effects<br />
are [as] profound, reliable and gratifying as<br />
Antigenpresenting<br />
cell<br />
B7<br />
MHC<br />
B7<br />
one could ever want out of a cancer therapy,”<br />
says trial principal investigator Keith Flaherty<br />
of Massachusetts General Hospital in Boston.<br />
PLX4032 is now in phase 3.<br />
Although both compounds will almost certainly<br />
become approved drugs, they have limitations.<br />
Ipilimumab extends median survival but,<br />
strangely, has only an 11% overall response rate.<br />
And almost all patients on PLX4032 relapse,<br />
most within a year. Nevertheless, the two drugs<br />
have revitalized melanoma research. By using<br />
ipilimumab and PLX4032 in combination with<br />
a variety of standard and investigational agents<br />
—or with each other—researchers hope to push<br />
long-term survival of metastatic melanoma<br />
patients up from the roughly 10% combined<br />
cure rate now achievable with ipilimumab<br />
monotherapy and interleukin-2 (IL-2) monotherapy.<br />
“We’re going to move the cure rate of<br />
melanoma progressively up,” predicts melanoma<br />
researcher Mario Sznol, of Yale University in<br />
New Haven, “to what could be a very respectable<br />
30, 35, 40% of patients, over the course of<br />
the next several years.”<br />
Ipilimumab<br />
Ag<br />
T cell<br />
activated<br />
TCR<br />
CTLA4<br />
CD28<br />
T cell<br />
Figure 1 Ipilimumab stimulates antitumor immunity by blocking CTLA4, a natural brake on T cells, and<br />
allowing their unimpeded ‘costimulation’. Ipilimumab is the first agent to extend survival in metastatic<br />
melanoma patients in phase 3.<br />
Anti-CTLA4 therapy has succeeded where<br />
other immunotherapies failed because, instead<br />
of trying to indirectly stimulate T cells by presenting<br />
tumor antigen to overcome immune<br />
tolerance, it activates T cells directly, by disabling<br />
a brake on T-cell activity. Normally,<br />
when a T cell is activated after CD28 binding<br />
of the B7 receptor on antigen-presenting cells,<br />
CTLA4 acts as a brake, trafficking from the<br />
T-lymphocyte cytosol to the surface to bind<br />
B7 molecule with high affinity. Thus CTLA4<br />
turns the T cell off. When the ipilimumab<br />
mAb is present it blocks CTLA4, keeping the<br />
T lymphocyte activated. The mAb also promotes<br />
unfettered binding of the T-cell CD28<br />
receptor to the antigen-presenting cell receptor<br />
B7, together with antigen presentation to the<br />
T-cell receptor (Fig. 1). Such ‘co-stimulation’<br />
is necessary for T-cell activation, and antitumor<br />
immunity. Unfortunately, ipilimumab also triggers<br />
autoimmune side effects, some severe. A<br />
few patients have died from colitis-related bowel<br />
perforations, for example. But Kirkwood points<br />
out, “[for] the vast majority of patients, we can<br />
nature biotechnology volume 28 number 8 AUGUST 2010 763
NEWS<br />
© 2010 <strong>Nature</strong> America, Inc. All rights reserved.<br />
Table 1 Selected phase 3 trials in metastatic melanoma<br />
Company (location) Product Description<br />
Bristol-Myers Squibb<br />
Ipilimumab<br />
(MDX-010)<br />
manage the side effects fairly easily, once you<br />
know how to look for them.”<br />
The one controversy in the phase 3 trial<br />
was the choice of the gp100 peptide vaccine,<br />
developed by the Bethesda, Maryland–based<br />
National Cancer Institute, as the active control<br />
arm for the study. The combination of this HLA-<br />
A0201–restricted peptide vaccine with highdose<br />
IL-2 resulted in higher response rates and<br />
improved progression-free survival in an earlier<br />
randomized trial. Thus the choice of gp100 for<br />
the control arm. Some researchers speculate<br />
that the vaccine may have hurt patients, thus<br />
giving ipilimumab an artificial statistical boost.<br />
(Certain vaccines have reduced survival in<br />
melanoma trials). Kirkwood disagrees, because<br />
gp100 did not appear to cause harm in its other<br />
trials. “The issues regarding the control are, in<br />
my book, non-issues,” he says.<br />
The question remains, why did ipilimumab<br />
succeed whereas tremelimumab, a similar anti-<br />
CTLA4 antibody from Pfizer, failed? It is possible<br />
that tremelimumab didn’t really fail. “[Pfizer]<br />
analyzed the trial early,” says Sznol. “You need<br />
to wait for the events to develop.” Sznol points<br />
out that some patients treated with anti-CTLA4<br />
mAbs experience progression of their cancers<br />
initially, followed by regression, and that other<br />
patients have most of their lesions disappear<br />
while a few continue growing. All are classified<br />
as nonresponders, but some may live for a long<br />
time. It’s also possible, Sznol says, that the company<br />
used the wrong drug dose and schedule.<br />
Kirkwood agrees that Pfizer was probably too<br />
quick to analyze the data.<br />
Pfizer defended the tremelimumab phase<br />
3 trial dose and schedule in an e-mail, noting<br />
that phase 2 results (using the same dose and<br />
schedule as in phase 3) were very similar to<br />
ipilimumab’s despite the different dose regi-<br />
Fully human antibody targeting the CTLA-4 receptor<br />
on T cells<br />
Plexxikon/Roche PLX4032 Small-molecule inhibitor of V600E mutant BRAF kinase<br />
Abraxis Bioscience Abraxane<br />
Nanoparticle albumin-bound paclitaxel (Taxol)<br />
(Los Angeles)<br />
(nab-paclitaxel, ABI-007)<br />
Eli Lilly<br />
(Indianapolis)<br />
Biovex<br />
(Woburn, Massachusetts)<br />
Novartis<br />
(Basel)<br />
GlaxoSmithKline<br />
Vical<br />
(San Diego)<br />
Tasisulam<br />
(LY573636)<br />
OncoVEX<br />
Tasigna<br />
(nilotinib, AMNN-107)<br />
Astuprotimut-r<br />
(MAGE-A3 ASCI)<br />
Allovectin-7<br />
Source: BioMedTracker & <strong>Nature</strong> Biotechnology<br />
Acyl sulfonamide, generates reactive oxygen species<br />
and induces apoptosis<br />
Oncolytic herpes simplex virus type-1 encoding granulocyte<br />
macrophage colony stimulating factor; selectively<br />
replicates in tumor cells, recruits dendritic cells<br />
Small molecule oral c-kit kinase inhibitor for c-kit<br />
mutant melanoma<br />
Protein subunit vaccine based on melanoma-associated<br />
antigen A3 (MAGE-A3), specific for tumor cells<br />
DNA plasmid/lipid complex containing human leukocyte<br />
antigen B7 and beta-2 microglobulin DNA sequences<br />
that together form major histocompatibility class I;<br />
improves antigen presentation<br />
mens. Long-term phase 3 follow up did show a<br />
survival advantage for the tremelimumab arm,<br />
but not enough to justify US Food and Drug<br />
Administration registration. Many patients in<br />
the tremelimumab trial control arm went on<br />
to receive ipilimumab in a compassionate use<br />
program, which could have decreased tremelimumab’s<br />
apparent effect. So circumstances, not<br />
biology, may have defeated tremelimumab.<br />
Any lingering ipilimumab doubts may<br />
disappear with a second completed phase 3<br />
trial, comparing ipilimumab plus dacarbazine<br />
chemotherapy to dacarbazine alone. Patient<br />
accrual ended more than two years ago, and<br />
results have not yet been reported. The delay<br />
suggests to many a successful trial, but no one<br />
knows for sure.<br />
No efficacy doubts exist for PLX4032. All<br />
agree the drug works, and works quickly, in<br />
the vast majority of patients with mutant BRAF<br />
tumors. Because PLX4032 targets the mutant<br />
form of the protein encoded by the BRAF oncogene,<br />
this allows very high doses to be given<br />
without adverse effects on normal cells. Data<br />
from several groups show, in fact, that PLX4032<br />
paradoxically activates BRAF signaling in normal<br />
cells. This pathway activation enhances the<br />
therapeutic window, but also probably leads to<br />
the appearance of skin lesions known as keratoacanthomas<br />
in many patients. They are benign,<br />
but raise the theoretical possibility that longterm<br />
treatment could promote the growth of<br />
other cancers.<br />
But the main downside of PLX4032 is<br />
relapses. Median duration of response in<br />
phase 1 was about nine months. By historical<br />
standards, this is excellent, and a few patients<br />
have had complete responses lasting two years<br />
or more (they remain on the drug). But the<br />
relapses indicate a still-unknown form of drug<br />
resistance. Some residual BRAF signaling in<br />
tumor cells persists, despite treatment, and<br />
there are new data that the mitogen-activated<br />
protein (MAP) kinase signaling pathway is<br />
reactivated downstream of BRAF. In either<br />
case, combining a BRAF inhibitor with an<br />
inhibitor of MAP kinase kinase (MEK), which<br />
is immediately downstream of BRAF, could<br />
overcome resistance and prolong survival. Such<br />
a trial is now underway with GSK2118436—a<br />
small-molecule inhibitor of the V600E mutant<br />
BRAF—and MEK inhibitor GSK1120212, both<br />
from GlaxoSmithKline in London and soon to<br />
be in phase 2/3 studies.<br />
Meanwhile, PLX4032 is moving forward<br />
quickly. An already completed phase 2 trial<br />
will “we all believe … likely be enough for FDA<br />
approval next year,” says Flaherty. Phase 3 will<br />
definitively show whether PLX4032 changes the<br />
natural history of the disease and extends survival.<br />
The list of agents in phase 3 trials is growing<br />
(Table 1), although none of them displayed<br />
the efficacy of ipilimumab and PLX4032 in<br />
phase 2. One comparable compound, however,<br />
is Bristol-Myers Squibb’s humanized anti-PD-1<br />
mAb, MDX-1106. PD-1, or programmed cell<br />
death-1, is a T-cell molecule that, like CTLA4,<br />
downregulates T-cell activity. It appears to be at<br />
least as powerful as CTLA4, and may function at<br />
the later stages of the immune response to shut<br />
down T cells.<br />
In phase 1, MDX-1106 treatment led to 15<br />
confirmed responses among 46 metastatic<br />
melanoma patients. As of June, none of the<br />
responders had relapsed, with more than a<br />
year passing in several cases. “This is one of<br />
the most promising starts I’ve seen for any<br />
drug,” said Sznol, the trial’s principal investigator.<br />
“It’s the kind of thing where we can’t<br />
sleep because we want to offer this to our next<br />
patient.” Autoimmune side effects occur, but<br />
fewer than with ipilimumab. A combination<br />
trial with ipilimumab has begun (see p. 765).<br />
The most anticipated combination is ipilimumab<br />
and PLX4032. This would bring<br />
together the quick responses of PLX4032 with<br />
ipilimumab’s ability to deliver cures. “The two<br />
are made for one another,” says Kirkwood.<br />
Tumor cells killed by PLX4032 should release<br />
antigen, enhancing ipilimumab’s ability to activate<br />
antitumor T cells. Flaherty says that the two<br />
sponsoring companies have agreed to collaborate<br />
on a large randomized combination trial,<br />
which should begin next year.<br />
Individually, ipilimumab and PLX4032 have<br />
ended the futility and nihilism that have long<br />
dominated melanoma treatment. It will take<br />
time to sort out the best combinations and the<br />
best way to apply them. “But at least the cupboard<br />
is not bare any more,” said Sondak.<br />
Ken Garber Ann Arbor, Michigan<br />
764 volume 28 number 8 AUGUST 2010 nature biotechnology
news<br />
Firms combine experimental cancer drugs<br />
to speed development<br />
© 2010 <strong>Nature</strong> America, Inc. All rights reserved.<br />
Tackling breast cancer. Drug<br />
developers are starting to combine<br />
novel, unapproved agents in search of<br />
synergistic activity.<br />
The next generation of cancer treatments<br />
could be approved in pairs, at least judging<br />
by a growing trend among drug makers to<br />
combine drugs early in development and the<br />
US Food and Drug Administration’s (FDA)<br />
willingness to regulate<br />
them. On 2 June, the<br />
FDA opened its public<br />
consultation into the<br />
formulation of guidance<br />
for combinations of<br />
investigational therapies.<br />
In the same week, Merck,<br />
of Whitehouse Station,<br />
New Jersey, reported at<br />
the annual American<br />
Society of Clinical<br />
Oncology meeting in<br />
Chicago that a combination<br />
of ridaforolimus, an<br />
oral inhibitor of mammalian<br />
target of rapamycin<br />
(mTOR) developed<br />
with Ariad of Cambridge,<br />
Massachusetts, and dalotuzumab,<br />
an antibody<br />
targeting the insulinlike<br />
growth factor 1 receptor (IGFR1), led<br />
to responses in a cluster of patients with<br />
highly proliferative, estrogen-receptorpositive<br />
breast cancers in a phase 1b trial.<br />
Collaborations between different sponsors to<br />
combine drugs very early in development are<br />
unusual and pose new issues for regulators<br />
compared with oversight of combinations of<br />
agents already on the market.<br />
The FDA initiative is not limited to cancer—it<br />
also covers infection, seizure disorders<br />
and cardiovascular disease. But cancer<br />
drug makers, in particular, are grappling with<br />
some thorny questions as they attempt to<br />
translate their rapidly expanding knowledge<br />
of tumor biology into therapies that offer significant<br />
improvements on what is now available.<br />
Foremost among their concerns is how<br />
to accelerate clinical development to deliver<br />
solid efficacy data without compromising<br />
patient safety. “We’ve talked to the FDA about<br />
specific combinations and have received guidance<br />
on an ad hoc basis,” says Pearl Huang, vice<br />
president and oncology franchise integrator at<br />
Merck. “For us, the burning issue is if we demonstrate<br />
great activity for the combination, are<br />
we obligated to demonstrate lack of activity for<br />
the single agent alone?”<br />
Some claim combinations of investigational<br />
drugs could accelerate clinical development.<br />
Merck’s ridaforolimus-dalotuzumab program,<br />
which is due to enter phase 2 trials later this<br />
year, is a key initiative and is being closely<br />
scrutinized. It exemplifies a science-based<br />
approach to combining investigational drugs<br />
that may offer limited<br />
potential as single agents,<br />
but which may offer synergistic<br />
effects when administered<br />
together, as well as<br />
reducing the risk of drug<br />
resistance. Trials of several<br />
other combinations of<br />
new types of agents are also<br />
underway (Table 1).<br />
Although combination<br />
therapy in cancer—and<br />
other indications—is not<br />
a new theme, it has developed<br />
historically through<br />
Sebastian Kaulitzki/iStockphoto<br />
trial and error. “Our knowledge<br />
of biological pathways<br />
and networks is so superficial<br />
it really is hard to come<br />
up with a strong rationale,”<br />
says Alan Ashworth, professor<br />
of molecular biology<br />
at the Institute of Cancer Research in London.<br />
The ridaforolimus-dalotuzumab combination<br />
emerged from an unbiased screen of a colon<br />
cancer cell line in which individual genes were<br />
systematically switched off using short hairpin<br />
RNAs, whereas each of the two drugs was<br />
tested in turn in a cell proliferation assay. This<br />
kind of synthetically lethal screen can unveil<br />
dependencies between related pathways and<br />
overcome compensatory mechanisms that<br />
cancer cells switch to when only one target is<br />
hit. “Those types of approaches couldn’t be<br />
done before,” says Eric Rubin, vice president<br />
of clinical oncology at Merck. The upcoming<br />
phase 2 trial will recruit around 200 breast<br />
cancer patients, who will be assigned to one<br />
of four treatment arms, comprising either<br />
ridaforolimus as monotherapy, dalotuzumab<br />
as monotherapy, the two drugs in combination<br />
or exemestane, the active comparator.<br />
The key question is whether that kind of design<br />
would need to be replicated in a large-scale registration<br />
trial of a new combination comprising<br />
two investigational compounds. “What we have<br />
proposed—and others have as well—is to do this<br />
in a more limited setting,” Rubin says. Balancing<br />
regulators’ requirements for statistical power<br />
with patients’ needs for effective therapy is not<br />
a straightforward task, particularly if some trial<br />
participants are to receive single agents that are<br />
nature biotechnology volume 28 number 8 AUGUST 2010 765
NEWS<br />
© 2010 <strong>Nature</strong> America, Inc. All rights reserved.<br />
Table 1 Selected targeted experimental combination cancer therapies in development<br />
Company Combination Mechanism Indication Status<br />
AstraZeneca (AZ)<br />
Cediranib maleate<br />
Vascular endothelial growth factor (VEGF) receptor inhibitor + Recurrent Phase 1/2<br />
(AZD2171) + olaparib<br />
poly(ADP-ribose) polymerase inhibitor<br />
ovarian cancer<br />
AZ & Merck (Darmstadt,<br />
Germany)<br />
unlikely to confer any benefit, while at the same<br />
time, the duration of combination trials is significantly<br />
extended. Ashworth says that more innovative<br />
trial designs and early use of biomarkers<br />
can help—but only if there is already a solid case<br />
for moving a particular therapy into the clinic<br />
in the first place. “You need a very strong biological<br />
basis for your combination treatment,” he<br />
says. “If you need 4,000 patients to prove your<br />
hypothesis, I’m sorry mate, you’ve got the wrong<br />
hypothesis.”<br />
There is some precedent for rapid approval<br />
of investigational therapies based on a strong<br />
phase 2 efficacy signal, particularly when<br />
it is backed by a solid understanding of<br />
the underlying biological mechanism. For<br />
example, Novartis, of Basel, gained FDA<br />
approval for Gleevec (imatinib mesylate) in<br />
chronic myeloid leukemia on the basis of a<br />
phase 1b dose-escalating trial (New. Engl. J.<br />
Med. 344, 1031–1037, 2001). “If in a phase<br />
2 trial, you’ve figured out the right dose and<br />
the correct schedule for a combination, and<br />
you get a dramatic change in efficacy, for<br />
example in a directed patient population,<br />
a path for that combination could be very<br />
straightforward,” says Bill Sellers, global head<br />
of oncology research at the Novartis Institutes<br />
for Biomedical Research, in Cambridge,<br />
Massachusetts. Head-to-head studies<br />
against the existing standard of care would<br />
also smooth the path toward approval—and<br />
combination therapies, he says, should aim<br />
for curative levels of efficacy rather than<br />
small, incremental improvements. “A major<br />
change in the rate of complete response or<br />
partial response to a therapeutic says you’ve<br />
killed a lot of the cancer.”<br />
Many of the combinations being tested target<br />
different kinase enzymes. Merck’s Huang<br />
Cediranib maleate + cilengitide VEGF receptor inhibitor + integrin inhibitor Recurrent<br />
glioblastoma<br />
says the combination of their investigational<br />
anti-cancer agent MK-2206, that inhibits<br />
Akt (a component of the phosphatiyliositol-3<br />
kinase pathway), with London-based<br />
AstraZeneca’s selumetinib (AZD6244), an<br />
inhibitor of the enzyme MEK, was chosen<br />
because each target is part of a canonical signal<br />
transduction pathway, downstream from a<br />
receptor tyrosine kinase. “They’re in parallel,<br />
but they also cross-talk,” she says. “They are<br />
not the cancer’s mutational drivers, they’re<br />
more the downstream effectors.”<br />
Even so, insights into tumor biology do<br />
not always yield significant clinical benefits.<br />
“In oncology, what we think works and what<br />
[actually] works are two different things, and<br />
that’s why we need to do big studies,” says<br />
Justin Stebbing, a physician scientist based at<br />
Imperial College London. “The initial promise<br />
of biomarkers doesn’t hold up to scrutiny,<br />
ultimately.”<br />
Matthew Ellis, professor of medicine at<br />
Washington University in St. Louis, Missouri,<br />
who recently published genomic analyses of<br />
cancer and normal tissues taken from an<br />
individual with breast cancer (<strong>Nature</strong>, 464,<br />
999–1005, 2010), has a different take: “My<br />
guess is we can solve the companion diagnostic<br />
problem by making full-genome sequencing<br />
of cancer the primary screen.” “We’re<br />
beginning to understand cancer genomes at<br />
a much more fundamental level than we ever<br />
have before,” he adds. “What we’re seeing, I<br />
think, is a great deal of complexity, much<br />
more complexity than was ever appreciated<br />
before.” This complexity is accompanied by<br />
an appreciable degree of heterogeneity—no<br />
two cancers appear the same. “We’re [starting]<br />
to classify them and put them into different<br />
buckets,” says James Zwiebel, chief of the<br />
Phase 1b<br />
GlaxoSmithKline (London) GSK1120212 + GSK2141795 MEK inhibitor + Akt kinase inhibitor Solid tumors Phase 1b<br />
Novartis & GlaxoSmithKline BKM120 + GSK1120212 Phoshphoinositide-3-OH kinase inhibitor + MEK inhibitor Solid tumors Phase 1b<br />
AZ & Roche (Basel) Cediranib maleate + RO4929097 VEGF receptor inhibitor + γ-secretase inhibitor Solid tumors Phase 1<br />
Bristol-Myers Squibb (New York) Ipilimumab + MDX-1106 Cytotoxic T-Lymphocyte antigen 4 (CTLA-4) inhibitor + Programmed Melanoma Phase 1<br />
& Ono Pharma (London)<br />
death-1 receptor (PD-1) inhibitor<br />
Merck & Ariad Dalotuzumab + ridaforolimus Insulin-like growth factor receptor 1 (IGFR1) inhibitor + mTOR Neoplasms Phase 1<br />
inhibitor<br />
Merck & AZ MK-2206 + selumetinib Akt inhibitor + MEK1/2 inhibitor Solid tumors Phase 1<br />
Pfizer (New York) Figitumumab + PF-00299804 IGFR1 inhibitor + HER tyrosine kinase inhibitor Solid tumors Phase 1<br />
Pfizer Crizotinib + PF-00299804 Met tyrosine kinase inhibitor + HER tyrosine kinase inhibitor Non-small cell<br />
lung carcinoma<br />
Phase 1<br />
Roche GDC-0449 + RO4929097 Hedgehog antagonist + γ-secretase inhibitor Breast cancer<br />
Sarcoma<br />
Source: http://www.ClinicalTrials.gov<br />
Phase 1<br />
Phase 1/2<br />
investigational drug branch at the National<br />
Cancer Institute, in Rockville, Maryland.<br />
“That’s really only scratching the surface.<br />
When you get down to it, every patient is<br />
going to have some unique characteristics.”<br />
That could make life more difficult for drug<br />
developers, he notes.<br />
This genome-level view of cancer, rather<br />
than the classic assumption of cancer as a<br />
disease affecting a particular organ, is turning<br />
our understanding of cancer on its head.<br />
Breast cancer perfectly illustrates the point.<br />
“When you do the genetics, what you see is<br />
a constellation of rare diseases,” Ellis says.<br />
In contrast, gastrointestinal stromal tumors,<br />
for example, seem to have a more uniform<br />
genetic profile. “You’ve got rare diseases<br />
defined by a common mutation, and we’re<br />
making progress,” he says. “We haven’t<br />
worked out how to handle the reverse situation,<br />
a common disease defined by multiple<br />
rare mutations.”<br />
Although the cost of individual genome<br />
sequencing is falling, Sellers says that full<br />
cancer genome sequencing may not be necessary<br />
to identify the dominant mutations that<br />
drive a particular cancer: partial approaches,<br />
based on techniques such as hybrid capture,<br />
targeted resequencing and high-throughput<br />
genotyping, may be sufficient. But even with<br />
the correct genomic information at hand,<br />
clinical progress will remain difficult, as<br />
combining two investigational agents correctly<br />
is not a straightforward task. “This is<br />
probably the biggest challenge: finding the<br />
effective and tolerated dose and, importantly,<br />
the schedule,” Sellers says. “I think this is<br />
probably a bigger challenge than the FDA<br />
regulatory challenge.”<br />
Cormac Sheridan Dublin<br />
766 volume 28 number 8 AUGUST 2010 nature biotechnology
© 2010 <strong>Nature</strong> America, Inc. All rights reserved.<br />
FDA transparency rules could hit small<br />
companies hardest<br />
The US Food and Drug Administration (FDA)<br />
is considering changing how much information<br />
it discloses about product applications—news<br />
that biotechs have greeted with a mixture of<br />
trepidation and hope. The agency is proposing<br />
to make publicly available ‘complete response’<br />
and ‘refuse-to-file’ letters for drugs and ‘not<br />
approvable’ letters for devices. From opinions<br />
gathered in advance of the final decision, it<br />
seems the smallest biotechs stand to lose the<br />
most.<br />
The proposed changes are wide-reaching<br />
and include some things most experts agree are<br />
good. On the upside, they say, this is an opportunity<br />
to make more information about what FDA<br />
does available to the public and ensure that data<br />
sources are more user-friendly. The downside,<br />
however, is the proposal to disclose information<br />
early in the approval process, including<br />
Investigational New Drug (IND) applications,<br />
holds and IND withdrawals. Few can see how<br />
revealing more information at the product<br />
application stage can be reconciled with trade<br />
secrets protection.<br />
The Biotechnology Industry Organization<br />
(BIO) wants more details about how these<br />
proposed regulations would be implemented.<br />
“They [FDA] define trade secrets [in the<br />
document], but oddly there is no definition<br />
of what constitutes competitive information,”<br />
explains Andrew Emmett, director for<br />
science and regulatory affairs at BIO, based<br />
in Washington, DC. The organization also<br />
wants clarification around who will decide<br />
what remains secret. Under current Freedom<br />
of Information Act regulations, Emmett<br />
says, companies have five days to determine<br />
whether documents that are going to be<br />
made public contain trade secrets that should<br />
be redacted. “We need to know exactly what<br />
the role of the sponsor will be in deciding<br />
what information is going to be shared,” he<br />
says. Otherwise, companies could be put at<br />
competitive disadvantage or become victims<br />
of wild speculation.<br />
The confidentiality issue is particularly critical<br />
for small biotechs. “When a small public<br />
company has a clinical trial pending, hedge<br />
fund managers do everything they can to get a<br />
sense of what the outcome might be,” says Alan<br />
Mendelson, senior partner at Los Angeles–<br />
headquartered law firm Latham and Watkins.<br />
If every pause in the clinical trial process gets<br />
announced to the public, it could lead to stock<br />
trading based on misleading or inadequate<br />
information. “It’s bad enough today,” he says,<br />
“But at least now people are commenting on<br />
definitive data, not just a signal that might prove<br />
to be nothing.”<br />
Wayne Kubick, a vice president in safety at<br />
Waltham, Massachusetts–based PhaseForward,<br />
says companies with “limited products” are also<br />
going to be at greatest risk of competitive disadvantage.<br />
Competitors will be able to use some<br />
types of information better than others. Says<br />
Gregory Conko, senior fellow at the Competitive<br />
Enterprise Institute in Washington, DC, “It’s<br />
less important with complete response or rejection<br />
letters, but with a new drug application, a<br />
hold, or a withdrawal, that is where tipping off<br />
competitors is a much bigger concern.” Smaller<br />
companies are already at a disadvantage in the<br />
review process. In comments it filed in April,<br />
BIO pointed out that a recent study from the<br />
law firm Booz Allen Hamilton found that small<br />
firms had only a 48% first-cycle approval rate<br />
for products in the priority review category,<br />
compared with a 78% rate for larger companies.<br />
In a survey of 168 of its members (http://www.<br />
bio.org/letters/20100412b.pdf), BIO also found<br />
that “early, frequent and explicit communication<br />
with the FDA” was felt to be the most helpful<br />
means for first-time filers to improve their success<br />
rates.<br />
The transparency initiative could help shore<br />
up this communication weakness. “A variety<br />
of leaders have been pushing for more open<br />
and straightforward dialog with the agency for<br />
years,” says J. Donald deBethizy, president and<br />
CEO of Winston-Salem, North Carolina–based<br />
Targacept. “This initiative could provide a means<br />
for that.” Greater transparency could also put<br />
pressure on FDA to provide rationales for rejections,<br />
which critics charge are sometimes based<br />
on “petty” issues, according to Conko.<br />
Overall, such changes may not necessarily<br />
translate to better decision making, Conko<br />
warns. “FDA’s political incentives are still poorly<br />
aligned. Even when their rationale is weak, they<br />
still don’t have to pay a price for it,” he says.<br />
On the other hand, transparency is not necessarily<br />
a bad thing. “The world is very different<br />
already in 2010” says Kubick. “We have<br />
clinicaltrials.gov and a lot of other information<br />
already available.” But it means companies will<br />
face more instances where study data is used out<br />
of context. “You have to protect yourself against<br />
people who data mine and then hold up a little<br />
data nugget as the truth,” deBethizy says.<br />
Many are watching closely as the next phase<br />
of the initiative rolls out. “This is by no means a<br />
done deal,” says Kubick. “Some [of the proposed]<br />
things are going to happen, but not everything<br />
will.” Others are very skeptical, like Jack McLane,<br />
in brief<br />
Supremes rule on Bilski<br />
The US Supreme<br />
Court has ruled<br />
on a long-awaited<br />
and controversial<br />
patent litigation<br />
case, a decision<br />
greeted with relief<br />
by the biotech<br />
industry but<br />
vague enough that<br />
both sides can<br />
claim victory. The<br />
Bilski v. Kappos<br />
case was closely<br />
news<br />
Biotech welcomes<br />
ruling.<br />
watched by the biotech community after<br />
the US Court of Appeals for the Federal<br />
Circuit ruled in 2008 that only methods<br />
tied to a machine or transformed into a<br />
different state are patentable, a standard<br />
which appeared to exclude crucial aspects of<br />
medical diagnostics. Commentators feared a<br />
restrictive ruling could have severely limited<br />
the ability to obtain patents on methods<br />
that use genes, proteins and metabolites<br />
to diagnose disease. Instead, the Supreme<br />
Court struck down patent claims on narrow<br />
grounds. “The Court was clearly conscious<br />
of the potential negative and unforeseeable<br />
consequences of a broad and sweeping<br />
decision,” stated Washington, DC–based<br />
Biotechnology Industry Organization<br />
president and CEO Jim Greenwood. The court<br />
ruled on two issues. First, it ruled against<br />
patenting only those inventions that are<br />
“tied to a particular machine” or those that<br />
transform “a particular article into a different<br />
state or thing.” Second, the court held that<br />
the word “process” as used in the US Patent<br />
Act should be read broadly to include modern<br />
day inventions. The ruling does not address<br />
the eligibility of patents for diagnostic<br />
methods, however, which leaves a number<br />
of questions unanswered with regard to a<br />
string of pending cases, including the closely<br />
watched dispute against Myriad Genetics<br />
and its breast cancer gene patents. Dan<br />
Ravicher of the Public Patent Foundation, a<br />
co-plaintiff with the American Civil Liberties<br />
Union in the suit against Myriad Genetics,<br />
believes “the opinion reinforces the line of<br />
case law that Judge Sweet relied upon in his<br />
decision striking down gene patents [in the<br />
Myriad case]. It rejects the argument that<br />
‘anything’ is patentable.” Justices Stevens,<br />
Breyer, Ginsburg and Sotomayor would have<br />
struck down not only the specific Bilski<br />
business method claims, but all business<br />
method patents on historical grounds that<br />
this class of patents was never contemplated<br />
by the framers of the US Constitution.<br />
The same argument would be difficult to<br />
support in biotech-specific cases as there<br />
is ample evidence that Thomas Jefferson,<br />
who reformed the Patent Act of 1793,<br />
considered medicine a “useful art” as was<br />
originally stated, a language later changed to<br />
“process.” Kenneth Chahine & Javier Mixco<br />
Lee Pettet/istockphoto<br />
nature biotechnology volume 28 number 8 AUGUST 2010 767
NEWS<br />
© 2010 <strong>Nature</strong> America, Inc. All rights reserved.<br />
in brief<br />
Lawsuits rock Jackson<br />
Lee Pettet/istockphoto<br />
Litigation over models<br />
may inflate prices.<br />
The Jackson<br />
Laboratory has<br />
unwittingly found<br />
itself ensnared in<br />
patent disputes.<br />
In June, the<br />
nonprofit laboratory<br />
mouse developer<br />
located in Bar<br />
Harbor, Maine, was<br />
cleared of a patent<br />
infringement<br />
allegation—the<br />
first in the<br />
laboratory’s 80-year history—and now<br />
faces a second allegation by another party.<br />
Jackson’s mission of making its repository<br />
of more than 5,000 mouse strains available<br />
to researchers at affordable prices could<br />
be challenged if it is forced to continue<br />
defending itself in expensive lawsuits, says<br />
David Einhorn, the laboratory’s in-house<br />
attorney. In Jackson’s first scuffle, the<br />
Central Institute for Experimental Animals<br />
(CIEA), a Kawasaki, Japan–based nonprofit,<br />
in 2008 sued Jackson for distributing a<br />
mouse model particularly useful for grafting<br />
human tissue. Both groups in the 1990s<br />
separately developed these immunodeficient<br />
mice by starting with a strain of nonobese<br />
diabetic mouse (NOD), crossing those<br />
with mice carrying the scid mutation for<br />
immunodeficiency, and crossing them again<br />
with mice whose gene for a key immune<br />
signaling molecule, interleukin-2 receptor γ,<br />
was knocked out. Jackson has distributed the<br />
mouse to more than 1,000 research groups<br />
worldwide, says Einhorn. But the laboratory<br />
didn’t patent its mouse, whereas CIEA did.<br />
On June 1, a US District Court judge ruled<br />
that the Jackson Laboratory had not infringed<br />
CIEA’s patent. What ultimately swayed the<br />
judge to side with Jackson was that the<br />
CIEA, in its patent application, described the<br />
mouse but didn’t claim it. In his decision the<br />
judge cited the Guidelines for Nomenclature<br />
of Mouse and Rat Strains, which state mice<br />
inbred for more than 20 generations can be<br />
considered a different strain, and Jackson’s<br />
mouse line had been separately inbred<br />
many times. Michael Rader, attorney with<br />
Wolf, Greenfield & Sacks in Boston, who<br />
represented Jackson, says this was likely<br />
the first time nomenclature rules have been<br />
used to help decide a lawsuit. Now Jackson<br />
faces another lawsuit involving transgenic<br />
mice with mutations useful in Alzheimer’s<br />
disease research. The Alzheimer’s Institute<br />
of America in February sued Jackson and six<br />
biotech and pharma companies for patent<br />
infringement. Despite the high costs of the<br />
two lawsuits, Einhorn says Jackson won’t<br />
alter its mission of making laboratory mice<br />
accessible. But he notes that if the suing<br />
trend continues, “the most obvious way<br />
to recoup the costs is to charge more for<br />
mice.” He adds: “That falls on the backs of<br />
scientists who do the research.” Emily Waltz<br />
The FDA’s Transparency Task Force is proposing to increase access to the agency’s decision letters<br />
about products or drugs. Such a move would challenge small biotech.<br />
vice president of clinical and regulatory affairs<br />
at Hudson, Massachusetts–based Clinquest.<br />
McLane points out that releasing more data<br />
earlier will also stretch the agency’s resources<br />
because there will be pressure to analyze many<br />
more signals quickly and thoroughly. “It’s a tremendous<br />
overreach,” he says. “A lot of people<br />
do not think this will go through.” McLane says<br />
he’d rather see the agency bring their transparency<br />
rules in line with the Sarbanes-Oxley Act<br />
of 2002, which set new standards for US boards,<br />
management and accounting firms. “A lot of<br />
what the FDA is asking for here is competitive<br />
information,” he says.<br />
in their words<br />
“They have grown so<br />
fast and so suddenly<br />
that people are still<br />
skeptical. But we should<br />
get used to it.” Rasmus<br />
Nielsen, a geneticist<br />
at the University of<br />
California at Berkeley,<br />
who collaborates with<br />
Chinese colleagues, on<br />
China’s sudden boom in<br />
sequencing output. (The Washington Post,<br />
28 June 2010)<br />
“Until the capacity issues can be addressed, this<br />
will not be an effective agent.” Chris Logothetis,<br />
head of prostate cancer research at the University<br />
The agency was accepting comments<br />
through July 20. In the autumn, the task<br />
force will consider the public comments as<br />
well as the “priority, operational feasibility,<br />
and resource requirements” of each proposal,<br />
according to Afia K. Asamoah, director of the<br />
FDA’s transparency initiative. BIO submitted<br />
one set of comments in April, and Emmett<br />
says the group will submit more before the<br />
deadline. Even if the agency decided to go<br />
through with all the proposals, though, some<br />
of the changes could not be implemented<br />
without new legislation.<br />
Malorye Allison Acton, Massachusetts<br />
of Texas MD Anderson Cancer Center in Houston,<br />
on the year-long wait patients currently face for<br />
Dendreon’s prostate cancer vaccine Provenge.<br />
(Pharmalot, 28 June 2010)<br />
“Everyone can claim victory, except of course<br />
Mr. Bilski himself.” Dan Ravicher, of the Public<br />
Patent Foundation, the organization leading the<br />
attack on Myriad, on the Supreme Court’s decision<br />
in Bilski v. Kappos. (GoozNews, 28 June 2010)<br />
“Now that the full integration has taken place,<br />
it’s the Genentech guys who are being promoted<br />
and getting the key positions.” Allianz Global<br />
Investors’ Joerg de Vries-Hippen on how<br />
Genentech is the strongest in the marriage with<br />
Roche. (Bloomberg Businessweek, 1 July 2010)<br />
JASON REED/Reuters/Corbis<br />
768 volume 28 number 8 AUGUST 2010 nature biotechnology
© 2010 <strong>Nature</strong> America, Inc. All rights reserved.<br />
Food firms test fry Pioneer’s trans fat–free<br />
soybean oil<br />
The US Department of Agriculture (USDA)<br />
has approved for environmental release one of<br />
the first biotech crops aimed at the food industry.<br />
The new crop, a genetically modified soybean<br />
with an altered fatty acid profile, yields oil<br />
that is more stable at high frying temperatures<br />
and has a longer shelf life than commodity soybean<br />
oil. It was developed by Pioneer Hi-Bred<br />
in Johnston, Iowa, a Dupont company. The<br />
company received marketing approval for the<br />
biotech soybean in June and aims to commercialize<br />
it by 2012. St. Louis–based Monsanto<br />
is following close behind, with two soybean<br />
products with modified oil profiles in its pipeline.<br />
The new soybean<br />
traits may help the<br />
biotech industry<br />
deliver on a twodecade-long<br />
promise:<br />
to develop crops with<br />
improved nutritional<br />
value. Until now,<br />
most commercialized<br />
biotech crops have<br />
been engineered with<br />
such traits as pest<br />
resistance and herbicide<br />
tolerance—traits<br />
that mostly benefit<br />
farmers rather than the food industry or consumers.<br />
“Heat stability and longer shelf life:<br />
these are the things that can light up the food<br />
industry, not reduced pesticides,” says Tom<br />
Hoban, a professor of food science at North<br />
Carolina State University in Raleigh.<br />
Pioneer is marketing its new soybean oil as<br />
an alternative to partially hydrogenated vegetable<br />
oils. For decades, food producers have<br />
relied on partially hydrogenated soybean oil<br />
because it retains its flavor at high cooking<br />
temperatures and for extended periods on the<br />
grocery store shelf. But the process of partial<br />
hydrogenation produces trans fatty acids, or<br />
trans fats, which are known to increase ‘bad’<br />
low-density lipoprotein (LDL) cholesterol and<br />
increase risk of coronary heart disease.<br />
In 2006, the US Food and Drug<br />
Administration began requiring food manufacturers<br />
to label food with trans fats, and<br />
measures to alert the public of the health risks<br />
of trans fats ensued. Food producers turned<br />
to alternatives, such as palm oil and certain<br />
kinds of canola oil, that have more stable frying<br />
and shelf life characteristics than those<br />
of unhydrogenated soybean oil. As a result,<br />
soybean oil’s share of the edible fats and oils<br />
The success of Pioneer’s recently approved soy<br />
bean, which has been engineered to cut down on<br />
trans fats, will depend on how well it is received<br />
by the food industry.<br />
market has gone from 76% in 2005 to 64%<br />
today, according to the US Census Bureau.<br />
“We hope to recapture that space [for soybeans],”<br />
says Pioneer’s Russ Sanders, director<br />
of enhanced oils.<br />
Pioneer’s new soybean oil has an oleic fatty<br />
acid content of >75%, a property that gives it<br />
frying and shelf stability comparable to that<br />
of palm, high oleic acid canola and hydrogenated<br />
soybean oils. It also contains 20% less<br />
saturated fat than commodity soybean oil.<br />
Pioneer dubbed the crop “Plenish high-oleic<br />
soybeans.” Overproduction of oleic acid and<br />
decreased levels of linoleic and linolenic acids<br />
in Plenish arise from<br />
transgenic expression<br />
of a fragment of the<br />
soybean microsomal<br />
omega-6 desaturase<br />
gene (FAD2-1)<br />
under the control<br />
of soybean Kunitz<br />
trypsin inhibitor<br />
gene promoter, which<br />
John Lee/iStockphoto<br />
silences endogenous<br />
omega-6 desaturase.<br />
The transgenic<br />
soybean also carries<br />
the S-adenosyl-lmethionine<br />
synthetase<br />
as a marker to enable initial selection<br />
in the laboratory by acetolactate synthase<br />
(ALS)-inhibiting herbicide.<br />
The success of the Plenish soybean will<br />
depend on how well it is received by the food<br />
industry. Pioneer has already set up testing<br />
agreements with a dozen undisclosed food<br />
companies, says Sanders. The companies will<br />
run consumer taste tests, frying tests and shelf<br />
life tests—just about anything a food company<br />
would normally do with a new ingredient.<br />
Food companies can already choose from an<br />
array of oils with modified fatty acid contents<br />
developed with conventional breeding. “The<br />
hard reality will be how producers of liquid<br />
vegetable oils compete,” says Terry Etherton,<br />
professor of animal nutrition at Penn State in<br />
University Park, Pennsylvania.<br />
Food industry representatives say they welcome<br />
the new oil option, but see it as a “trial<br />
situation,” says Jeffrey Barach, vice president<br />
of science policy at Grocery Manufacturers<br />
Association in Washington, DC .“Each company<br />
has to try it out and do some experimental<br />
work,” he says.<br />
Although Pioneer received the full go-ahead<br />
from regulators, the company doesn’t plan to<br />
in brief<br />
news<br />
Anti-CD20 patent battle ends<br />
On June 1, a four-year dispute over a European<br />
patent for anti-CD20 drugs to treat rheumatoid<br />
arthritis came to an end, with Seattle-based<br />
Trubion winning the dispute. This result frees up<br />
the space for anyone with a CD20 program, says<br />
Jeff Pepe, associate general counsel at Trubion.<br />
Multiple oppositions had been filed against the<br />
patent (European Patent 1176981) held jointly<br />
by Genentech of S. San Francisco, California,<br />
and Biogen Idec of Cambridge, Massachusetts.<br />
Trubion was joined by MedImmune, GenMab,<br />
Centocor, the Glaxo Group and Merck Serono, all<br />
pursuing anti-CD-20 programs at one time. In<br />
2008, the Opposition Division of the European<br />
Patent Office ruled that, as filed, the patent did<br />
not meet the necessary requirements, favoring<br />
Trubion. Genentech and Biogen appealed in<br />
2009. Finally, at an oral hearing this June,<br />
the original ruling was upheld, and no further<br />
appeals will be allowed. Ironically, around the<br />
time of the hearing, New York–based Pfizer,<br />
which acquired Trubion’s CD20 programs when<br />
it bought Wyeth in 2009, announced they would<br />
drop Trubion’s lead anti-CD20 compound (TRU-<br />
015) though retaining the biotech’s second<br />
generation anti-CD20 monoclonal antibody also<br />
in rheumatoid arthritis. For Genentech/Roche<br />
“the decision does not impact our expectations<br />
with respect to protection against Rituxan<br />
[rituximab, anti-CD20 chimeric monoclonal<br />
antibody],” says company spokesperson<br />
Rubin Snyder. <br />
Laura DeFrancesco<br />
EU states free to ban GM crops<br />
In July, the European Commission (EC)<br />
officially proposed to give member states<br />
the freedom to veto cultivation of genetically<br />
modified (GM) crops without having to<br />
back their decision with scientific evidence<br />
on new risks. The reform’s goal is to hand<br />
back responsibility to individual states and<br />
speed up pending authorizations. Anti-GM<br />
countries can now choose to opt out whereas<br />
biotech-friendly countries can cultivate new<br />
GM varieties. However, there is no guarantee<br />
it will work. “We are not against freedom<br />
for member states, the problem is how<br />
the principle is articulated,” says Carel du<br />
Marchie Sarvaas, director for agricultural<br />
biotech at EuropaBio. The proposal stands on<br />
two legs: an amendment to directive 2001/18<br />
that must gain the approval of the council<br />
of ministers and the European Parliament,<br />
and an EC recommendation on coexistence,<br />
already effective. The first legalizes national<br />
or local bans on growing, the second one<br />
achieves the same result by conceding that<br />
countries wanting to keep ‘contamination’<br />
levels well below the labeling threshold can<br />
enforce wide isolation distances between<br />
GM and conventional or organic fields. “It’s<br />
a Pandora’s box. We are concerned it will<br />
create legal uncertainty and unpredictability<br />
for farmers and operators,” says du Marchie<br />
Sarvaas. The reform doesn’t target imports of<br />
GM material for food or feed, whose approvals<br />
are also stalled. <br />
Anna Meldolesi<br />
nature biotechnology volume 28 number 8 AUGUST 2010 769
NEWS<br />
© 2010 <strong>Nature</strong> America, Inc. All rights reserved.<br />
in brief<br />
GM alfalfa—who wins?<br />
Both sides are claiming victory following the<br />
Supreme Court’s verdict issued June 21 in<br />
Monsanto v. Geerston Seed Farms over the<br />
future sale of Roundup Ready (RR) alfalfa<br />
seeds. The Supreme Court repealed a lower<br />
court injunction issued in 2007 banning the<br />
biotech seeds nationwide (Nat. Biotechnol. 28,<br />
184, 2010). Monsanto’s business lead for the<br />
crop, Steve Welker, says the St. Louis–based<br />
company has plenty of RR alfalfa seeds<br />
“ready to deliver,” although their release is<br />
subject to a pending environmental impact<br />
statement (EIS) by the US Department of<br />
Agriculture (USDA). “Our goal is to have<br />
everything in place for growers to plant in fall<br />
2010,” Welker adds. Not so fast, says lawsuit<br />
opponent Andrew Kimbrell of the Center for<br />
Food Safety in Washington. He points out<br />
that the Supreme Court “just took away the<br />
injunction, and USDA still has to comply with<br />
NEPA [the National Environmental Policy<br />
Act] and complete an EIS” before the crop<br />
can be deregulated. Although USDA appears<br />
poised to complete its EIS and fully deregulate<br />
RR alfalfa, the Center for Food Safety could<br />
renew its challenge of USDA’s decision.<br />
This lingering uncertainty has agitated many<br />
members of Congress. Seven senators and<br />
49 representatives have asked agriculture<br />
secretary Tom Vilsack to retain regulated status<br />
for RR alfalfa, whereas two other senators have<br />
urged Vilsack to “mount vigorous defenses<br />
against lawsuits that seek to upend sciencebased<br />
regulatory decisions.” Jeffrey L Fox<br />
Biofuel ‘Made in China’<br />
Collaboration between the Danish enzyme<br />
producer Novozymes of Bagsvared, Beijingbased<br />
China Petroleum and Chemical and<br />
Cofco, the state-run agriculture company, will<br />
produce three million gallons of ethanol a<br />
year for local consumption, using corn stalks<br />
and leaves from northeastern China’s corn<br />
belt. The demonstration plant will test novel<br />
technologies, including Novozymes’ new<br />
Cellic CTec2 enzymes, with a view to launch a<br />
commercial facility by 2013. Cofco has been<br />
running a small pilot plant in Heilongjiang<br />
province for four years, but as a precondition<br />
for commercialization “we need more capacity<br />
to optimize our design and operation,” says<br />
Guo Shunjie, general manager of Cofco’s<br />
bio-energy and biochemical department. One<br />
remaining hurdle is the inability to break down<br />
five-carbon sugars abundant in lignocellulose,<br />
which make up 20–40% of the plant biomass.<br />
The new process could cut costs considerably,<br />
as it requires half the dose of enzymes needed<br />
by other treatments to break down plant waste.<br />
The partners’ goal is to produce cellulosic<br />
ethanol at $2.25 a gallon, a price further<br />
pushed down by government tax credits to be<br />
competitive with corn-based ethanol, currently<br />
at $1.50–1.60 a gallon. “Since the trend to<br />
lower carbon emissions is here to stay, it<br />
won’t be long before we break even,”<br />
says Shunjie.<br />
Daniel Grushkin<br />
Table 1 USDA-approved soybeans modified for improved trans fat content<br />
Product Company Description<br />
DP-305423<br />
Pioneer Hi-Bred<br />
International<br />
commercialize Plenish soybeans until the first<br />
quarter of 2012, after food players have had<br />
time to determine what food applications, if<br />
any, they want to pursue with Plenish soybeans.<br />
“We’re being fairly conservative in our<br />
commercialization schedule,” Sanders says.<br />
The time to market also depends on<br />
Pioneer’s ability to secure regulatory approval<br />
in key global markets, such as Europe, Japan,<br />
China, Taiwan and South Korea, Sanders says.<br />
The soybean is already approved in Canada<br />
and Mexico.<br />
Global regulatory hurdles hampered<br />
Dupont’s earlier development of a different<br />
high oleic acid soybean (Table 1). In 1997, the<br />
USDA approved, or deregulated, DD-026005-3<br />
—a Dupont soybean with an oleic acid content<br />
of 85%. This variety was modified with<br />
an extra copy of soybean Δ 12 -fatty acid dehydrogenase<br />
under the control of the soybean<br />
β-conglycinin promoter, which triggered<br />
silencing of the transgene and its counterpart<br />
endogenous gene. But the product fizzled<br />
after the company encountered global regulatory<br />
complexities associated with the crop’s<br />
marker technology, says Sanders. Markers<br />
are used by crop developers to test whether<br />
genetic material is successfully transferred<br />
to the host crop. In this case, DD-026005-3<br />
contained the Escherichia coli uidA gene,<br />
encoding β-glucuronidase as a colorimetric<br />
marker, and the bla gene, encoding the<br />
enzyme β-lactamase as a selective marker<br />
that confers resistance to β-lactam antibiotics<br />
(such as penicillin and ampicillin).<br />
Pioneer’s new high oleic soybean targets the<br />
same oleic acid pathway as the 1997 version,<br />
but it is hoped that use of a different marker<br />
gene, one imparting tolerance to an ALSinhibitor<br />
herbicide, will smooth the regulatory<br />
path. (The plant will not be tolerant to<br />
ALS-inhibitor herbicides at the levels used in<br />
the field.) Sanders says he is “optimistic” about<br />
the 2012 regulatory goals.<br />
On Pioneer’s regulatory heels are two<br />
Monsanto soybean products with modified<br />
oil profiles, one with omega-3 fatty acids for<br />
High oleic acid soybean produced by inserting extra copies of a<br />
portion of the gene encoding omega-6 desaturase, gm-fad2-1,<br />
resulting in silencing of the endogenous omega-6 desaturase<br />
gene (FAD2-1).<br />
DD-026005-3 DuPont High oleic acid soybean produced by inserting a second copy of<br />
a portion of the gene encoding omega-6 desaturase, gm-fad2-1,<br />
resulting in silencing of the endogenous omega-6 desaturase<br />
gene (FAD2-1).<br />
OT96-15<br />
Source: AGBIOS<br />
Agriculture & Agri-Food<br />
Canada<br />
Low linolenic acid soybean produced through traditional crossbreeding<br />
to incorporate the trait from a naturally occurring fan1<br />
gene mutant that was selected for low linolenic acid.<br />
nutrition and the other with enhanced texture<br />
and functionality, called high stearic<br />
acid soybeans. Monsanto has submitted to<br />
the USDA petitions for deregulation of both<br />
products. Still in the discovery phase, Dow<br />
AgroSciences in Indianapolis, Indiana is<br />
developing omega-9 canola and sunflower<br />
oils. With one nutritionally altered crop<br />
approved and a handful in the pipeline,<br />
the public may finally get what it has been<br />
promised for two decades. But whether<br />
high oleic acid soybeans directly benefit<br />
consumers enough to boost public opinion<br />
of biotech crops is doubtful, say agriculture<br />
experts. “Companies already have methods<br />
of removing trans fats” from food, says Jane<br />
Rissler, a senior scientist with the Union for<br />
Concerned Scientists in Washington, DC.<br />
Pioneer is “offering an alternative to those<br />
existing methods” without much added benefit<br />
to consumers, she says. Alan McHughen,<br />
a plant biotechnologist at the University of<br />
California, Riverside, notes that: “Those<br />
who already despise [genetic modification]<br />
will continue to do so, those who accept GM<br />
will continue to do so, and most others won’t<br />
even notice it, as it’s not a high-profile whole<br />
food with immediate consumer-recognized<br />
benefit.”<br />
In the US, food companies aren’t required<br />
to label food derived from genetically engineered<br />
crops, and generally don’t voluntarily<br />
do so.<br />
An April 2010 survey of 750 US consumers<br />
asked this question: “All other things<br />
being equal, how likely would you be to<br />
buy a food product made with oils that had<br />
been modified by biotechnology to avoid<br />
trans fats?” Seventy-four percent said they<br />
were either very likely or somewhat likely to<br />
buy this kind of biotech food. However, in a<br />
separate question, only 32% of those respondents<br />
said they had a favorable impression of<br />
biotech food. The survey was conducted by<br />
the International Food Information Council<br />
Federation in Washington, DC.<br />
Emily Waltz Nashville, Tennessee<br />
770 volume 28 number 8 AUGUST 2010 nature biotechnology
data page<br />
2Q10—spreading the wealth<br />
Walter Yang<br />
© 2010 <strong>Nature</strong> America, Inc. All rights reserved.<br />
Although biotech stocks, along with the general markets, performed<br />
poorly last quarter, more companies were able to access capital, more than<br />
in each of the previous four quarters. Excluding US partnership monies,<br />
219 companies pulled in $8.1 billion (compared with 157 firms raising $5.3<br />
Stock market performance<br />
The BioCentury 100 and the NASDAQ Biotechnology were down 11% and<br />
15%, respectively, similar to other major indices.<br />
Index<br />
1,700<br />
1,600<br />
1,500<br />
1,400<br />
1,300<br />
1,200<br />
1,100<br />
1,000<br />
900<br />
800<br />
700<br />
600<br />
500<br />
12/2008<br />
1/2009<br />
2/2009<br />
3/2009<br />
4/2009<br />
5/2009<br />
6/2009<br />
7/2009<br />
8/2009<br />
9/2009<br />
10/2009<br />
Month<br />
11/2009<br />
12/2009<br />
Global biotech industry financing<br />
BioCentury 100<br />
Dow Jones<br />
S&P 500<br />
NASDAQ<br />
NASDAQ Biotech<br />
Swiss Market<br />
1/2010<br />
2/2010<br />
Partnership Debt and other financing Venture Follow-on PIPE<br />
2Q10<br />
1Q10<br />
4Q09<br />
3Q09<br />
2Q09<br />
6.1, 2.1, 1.3, 1.3, 0.5, 0.4<br />
8.5, 5.0, 1.7, 0.6, 0.4, 0.3<br />
9.4, 2.3, 1.2, 2.4, 0.6, 0.7<br />
8.0, 2.6, 1.2, 0.8, 0.7, 0.0<br />
0 5 10 15 20 25<br />
Amount raised ($ billions)<br />
3/2010<br />
4/2010<br />
5/2010<br />
6/2010<br />
Excluding partnership monies, 2Q10 funding was up $8.1 billion, 53%<br />
on 2Q09, largely through debt deals, which shot up 97%.<br />
Global biotech initial public offerings<br />
Amount raised ($ millions)<br />
700<br />
600<br />
500<br />
400<br />
300<br />
200<br />
100<br />
0<br />
0<br />
0<br />
0<br />
2Q09<br />
15<br />
7<br />
635<br />
3Q09<br />
50<br />
151<br />
70<br />
4Q09<br />
Financial quarter<br />
31<br />
0<br />
364<br />
1Q10<br />
50<br />
85<br />
208<br />
2Q10<br />
IPO<br />
14.8, 3.1, 1.6, 2.3, 0.7, 0.3<br />
Partnership figures are for deals involving a US company. Source: BCIQ: BioCentury Online Intelligence,<br />
Burrill & Co.<br />
Ten companies raised $342.9 million through IPOs last quarter versus<br />
none in 2Q09.<br />
Asia-Pacific<br />
Europe<br />
Americas<br />
2Q09 3Q09 4Q09 1Q10 2Q10<br />
Americas 0 2 2 4 4<br />
Europe 0 1 2 0 5<br />
Asia-Pacific 0 1 2 2 1<br />
Table indicates number of IPOs. Source: BCIQ: BioCentury Online Intelligence<br />
billion in 2Q09), 39% of which originated from debt deals by Genzyme<br />
(Cambridge, MA) and Teva Pharmaceuticals (Petah Tikva, Israel). Venture<br />
funding was up 36% from 2Q09; ten companies launched initial public<br />
offerings (IPOs), raising $342.9 million.<br />
Global biotech venture capital investment<br />
Venture money raised was up 36% to $1.7 billion from $1.2 billion in<br />
2Q09.<br />
Amount raised ($ millions)<br />
1,800<br />
1,600<br />
1,400<br />
1,200<br />
1,000<br />
800<br />
600<br />
400<br />
200<br />
0<br />
Notable Q2 deals<br />
Venture capital<br />
$9<br />
$180<br />
$1,035<br />
2Q09<br />
$6<br />
$104<br />
$1,064<br />
$9<br />
$479<br />
$1,065<br />
$24<br />
$331<br />
$939<br />
3Q09 4Q09 1Q10<br />
Financial quarter<br />
Amount<br />
raised<br />
($ millions)<br />
$0<br />
$458<br />
$1,210<br />
2Q10<br />
Americas<br />
Europe<br />
Asia<br />
2Q09 3Q09 4Q09 1Q10 2Q10<br />
Americas 43 49 60 60 76<br />
Europe 14 14 32 30 28<br />
Asia-Pacific 1 1 1 1 1<br />
Table indicates number of venture capital investments and includes rounds where the amount raised was<br />
not disclosed. Source: BCIQ: BioCentury Online Intelligence<br />
Company (lead investors)<br />
Round<br />
number<br />
Date<br />
closed<br />
AiCuris (Santo Holding) 74.9 2 14-Apr<br />
Achaogen (Frazier Healthcare) 56.0 3 7-Apr<br />
Pacific Biosciences (Gen-Probe) 50.0 6 17-Jun<br />
OptiNose (Avista Capital) 48.5 NA 8-Jun<br />
Agile Therapeutics (Investor Growth Capital,Care Capital) 45.0 2 14-Jun<br />
Tetraphase (Excel Venture) 45.0 3 1-Jun<br />
Anaphore 3 (5AM Ventures, Versant, Apposite Capital) 38.0 1 14-May<br />
Mergers and acquisitions<br />
Target<br />
Acquirer<br />
Value<br />
($ million)<br />
Date<br />
announced<br />
OSI Pharma Astellas 4,000 17-May<br />
Valeant Biovail 3,200 21-Jun<br />
Abraxis Celgene 2,900 30-Jun<br />
Wuxi PharmTech Charles River 1,500 26-Apr<br />
IPOs<br />
Company (lead underwriters)<br />
Amount<br />
raised<br />
($ millions)<br />
Change<br />
in stock<br />
price<br />
since offer<br />
Date<br />
completed<br />
Codexis 78.0 –33% 22-Apr<br />
Alimera 72.1 –32% 22-Apr<br />
Lansen Pharma 50.2 3% 30-Apr<br />
Tengion 30.0 –26% 9-Apr<br />
GenMark 27.6 –26% 28-May<br />
Aposense 24.8 –11% 7-Jun<br />
Licensing/collaboration<br />
Researcher Investor<br />
Value<br />
($ millions) Deal description<br />
TransTech Forest $1,100 Exclusive, worldwide rights, excluding the Middle East and<br />
North Africa, to develop and commercialize small-molecule<br />
glucokinase activators<br />
Regulus Sanofi-aventis >$750 Discover, develop and commercialize microRNA therapeutics<br />
for up to four targets<br />
Diamyd Johnson &<br />
Johnson<br />
$625 Exclusive rights to Diamyd diabetes vaccine outside Nordic<br />
countries<br />
Neurocrine Abbott $595 Exclusive, worldwide rights to develop and commercialize<br />
endometriosis compound elagolix<br />
OncoMed Bayer >$500 Discover and develop antibodies, proteins and small molecules<br />
targeting the Wnt signaling pathway to treat cancer<br />
Source: BCIQ: BioCentury Online Intelligence<br />
Walter Yang is Research Director at BioCentury<br />
nature biotechnology volume 28 number 8 AUGUST 2010 771
© 2010 <strong>Nature</strong> America, Inc. All rights reserved.<br />
NEWS feature<br />
Drugmakers dance with autism<br />
With monogenetic neurodevelopmental disorders similar to autism<br />
serving as starting points for several drug discovery programs,<br />
smaller biotechs are now joining big pharma in pursuing therapies<br />
to tackle this perplexing condition. Sarah Webb reports.<br />
In June, the Autism Research Project published<br />
the largest genetic study of autism so<br />
far, identifying 226 gene mutations that are<br />
found in people with the syndrome 1 . Children<br />
with autism are 20% more likely to carry one<br />
of these rare mutations, though they are not<br />
inheriting them; they are present in less than<br />
6% of the parents of autistic children. This<br />
study adds to the growing list of genes that<br />
could serve as starting points for research on<br />
autism therapies.<br />
Whereas the pharmaceutical industry<br />
increasingly has been shying away from<br />
psychiatric disorders, such as schizophrenia<br />
and depression, interest in autism has<br />
intensified. Together with an increasing<br />
number of autism cases diagnosed each<br />
year, there is a dearth of effective treatments.<br />
As a result, “autism seems to be a relatively<br />
hot area,” says Manuel Lopez-Figueroa<br />
of Bay City Capital, a venture capital firm<br />
in San Francisco, and scientific liaison for<br />
the Pritzker Neuropsychiatric Disorders<br />
Research Consortium. Not only is the pharmaceutical<br />
sector ploughing R&D resources<br />
into the condition, but several smaller companies<br />
are pioneering therapies, one of which<br />
is an enzyme replacement therapy already in<br />
phase 3 human testing (Table 1 and Box 1).<br />
What’s more, progress in drug discovery programs<br />
aiming to target proteins associated<br />
with Mendelian neurodevelopmental disorders<br />
may pave the way for expansion into<br />
broader spectrum autism conditions.<br />
Repurposed drugs<br />
Current estimates indicate that 1 in 110 children<br />
in the United States have an autism<br />
spectrum disorder defined by three core<br />
symptoms: deficits in social interactions,<br />
problems with communication and repetitive<br />
behaviors. Although twin and family studies<br />
have established a strong genetic basis for<br />
autism, no clear genetic cause has emerged.<br />
In addition to complex genetics, the disorder<br />
is phenotypically diverse: individuals with<br />
an autism spectrum diagnosis may be intelligent<br />
and high functioning (e.g., those with<br />
Asperger’s syndrome) or have severe mental<br />
deficits. The large variation in phenotypes and<br />
Trouble at the synapse. The genetics of autism is<br />
pointing toward malfunctioning at the synapse.<br />
high concordance in monozygotic twins suggests<br />
many genetic and environmental biasing<br />
factors are involved.<br />
A diagnosis of autism brings along a slew of<br />
unmet medical needs, including anxiety, sleep<br />
disturbances, and metabolic and gastrointestinal<br />
issues. Initial moves by industry into<br />
autism therapeutics have involved applying<br />
existing drugs to alleviate some of these symptoms,<br />
says Sophia Colamarino, vice president<br />
for research at Autism Speaks, a patient advocacy<br />
group based in New York. “In the short<br />
term, that’s where many of the pharmaceutical<br />
companies will be able to have an immediate<br />
impact,” she says. Two atypical antipsychotics<br />
have been approved by the US Food and Drug<br />
Administration (FDA) for treating irritability<br />
in autistic children. Johnson & Johnson’s<br />
Risperdal (risperidone) was approved in<br />
late 2006, followed by Abilify (aripiprazole)<br />
from Bristol-Myers Squibb in New York, and<br />
Otsuka in Princeton, New Jersey, in 2009.<br />
Selective serotonin reuptake inhibitors such<br />
as low-dose Prozac (fluoxetine) are approved<br />
for use in adults and children for obsessive<br />
compulsive disorder and have been tested in<br />
children with autism. Anticonvulsives such<br />
Mike Agliolo/Corbis<br />
as valproate (Stavzor, Depakene, Depacon)<br />
may serve the same sort of purpose for some<br />
patients, says Eric Hollander, director of the<br />
Compulsive, Impulsive and Autism Spectrum<br />
Disorders Program at Albert Einstein College<br />
of Medicine and Montefiore Medical Center<br />
in New York.<br />
Treating these related symptoms gives<br />
patients and their caregivers an improved<br />
quality of life, making it more likely that<br />
an individual with autism can live at home<br />
rather than in a care facility, Hollander adds.<br />
Improving those related symptoms can also<br />
make patients more responsive to behavioral<br />
therapies, says Robert Ring, who is heading<br />
up Pfizer’s autism research unit in Groton,<br />
Connecticut.<br />
At least one repurposed drug is targeting the<br />
imbalance between excitatory and inhibitory<br />
signaling suspected to be part of the basis of<br />
autism. New York-based Forest Laboratories is<br />
testing Namenda (memantine), an Alzheimer’s<br />
drug and N-methyl d-aspartate receptor<br />
(NMDA) receptor modulator, in a phase 2 trial<br />
in autism patients.<br />
Abnormal synaptic connectivity<br />
Because this spectrum of disorders has a<br />
clear genetic basis but no clear genetic cause,<br />
researchers are chewing on the question of how<br />
so many different mutations could lead to a<br />
similar phenotype, says Luca Santarelli, head<br />
of Roche’s central nervous system exploratory<br />
development in Basel.<br />
Genetic studies are important, but they don’t<br />
tell a complete story. “Identifying genes and<br />
coming up with gene candidates is really just<br />
a first step in gaining confidence in a potential<br />
genetic target that could be druggable,” says<br />
John Spiro, a research director at the Simons<br />
Foundation Autism Research Initiative in New<br />
York City. “There are not many genes that you<br />
can be really, really confident are accounting<br />
for any significant portion of autism.” Though<br />
researchers remain hopeful that the genes might<br />
converge into a single meaningful pathway, he<br />
adds, “for the most part in autism, it’s not clear<br />
yet that’s going to be the case.”<br />
Nonetheless, some patterns are emerging<br />
that may help researchers devise new therapeutic<br />
strategies. A genome-wide survey of a group<br />
of autistic and mentally retarded individuals<br />
revealed a set of mutations (point mutations<br />
and copy number variants) in a gene, SHANK2,<br />
that controls synaptic structure, defects in<br />
which could lead to problems in neuronal<br />
communication 2 .<br />
Mutations in another family of genes<br />
involved with synapse formation, the neuroligins,<br />
which code for adhesion molecules<br />
that cluster on the receiving side<br />
772 volume 28 number 8 august 2010 nature biotechnology
news feature<br />
© 2010 <strong>Nature</strong> America, Inc. All rights reserved.<br />
Box 1 Enzyme replacement for autism?<br />
Unlike other emerging treatment strategies for autism that target genes or neurochemical<br />
pathways, Rye New York’s Curemark is working on an enzyme replacement therapy<br />
comprising a mixture of several digestive enzymes (Table 1). In clinical work with children<br />
who showed symptoms of autism, Curemark’s founder and CEO, Joan Fallon, noticed that<br />
several of these patients restricted their diets by their own choice, preferring carbohydrateladen<br />
foods such as crackers and pasta. Searching for an explanation, she found that these<br />
patients had low fecal levels of the protease chymotrypsin (fecal chymotrypsin levels have<br />
also served as a diagnostic indicator of cystic fibrosis). Children with autism without a known<br />
genetic cause, often had these low enzyme levels, Fallon says.<br />
Administering high-protease enzymes, the physicians observed behavioral changes in<br />
the children. Fallon filed patents in 1999 and formed a biotech company in 2005. The<br />
company’s protease-based treatment, CM-AT, is currently being tested in a phase 3 study<br />
with 170 children ages 3–8 in 12 locations around the United States.<br />
of the synapse, may account for up to 6%<br />
of autism cases, according to Nils Brose,<br />
director of the Department of Molecular<br />
Neurobiology at the Max Planck Institute<br />
of Experimental Medicine, in Göttingen,<br />
Germany. Neuroligins 3 and 4 localize to<br />
glutamatergic synapses, and loss-of-function<br />
mutations in these genes segregate in<br />
certain pedigrees with mental retardation,<br />
autism and Asperger’s syndrome. These<br />
molecules are likely operating as the organizational<br />
point for information coming into<br />
the postsynaptic space, recruiting signaling<br />
receptors. In mouse knockouts of two of<br />
these neuroligins, Brose says, “the synapses<br />
are intrinsically operational, but they lack<br />
normal receptors and as a consequence don’t<br />
function properly.”<br />
But just noting a connection between these<br />
genes and synaptic structures isn’t enough for<br />
developing drug candidates, Spiro adds. “You<br />
don’t know. Is it too much? Is it too little? Are<br />
[the structures] in the wrong place during<br />
development? There are just a million questions<br />
that need to be ironed out before you can<br />
think about a pharmaceutical intervention.”<br />
Santarelli’s group at Roche is trying to get at<br />
some of these questions, in collaboration with<br />
Peter Scheiffele, a professor of cell and developmental<br />
neurobiology at the University of<br />
Basel and a leader in the neuroligin research<br />
area. “We’d like to understand the common<br />
downstream effects of different genetic alterations<br />
that lead to autisms and whether there<br />
are common mechanisms that could lead to<br />
treatments,” Santarelli says.<br />
Clues from rare single-gene disorders<br />
The increasing understanding of some of the<br />
molecular mechanisms of autism is providing<br />
one avenue forward. The second breakthrough,<br />
according to Colamarino, is coming through<br />
animal studies of single-gene disorders such<br />
as fragile X 3 and Rett’s syndromes 4 , which are<br />
found in a disproportionate number of individuals<br />
who meet the criteria for autism spectrum<br />
disorders. Since 2007, a handful of studies of<br />
animal models with inducible mutations have<br />
shown that animals can develop to adulthood<br />
with these disorders, and then recover after<br />
proper gene function is switched back on.<br />
That ability to reverse the symptoms in animals<br />
with advanced disease has been a major<br />
breakthrough, says Spiro. With clear genetic<br />
causes coupled with the opportunity to build<br />
animal models of these disorders, “it may be<br />
very reasonable to say that the pathway to drug<br />
discovery in autism may be paved by a careful<br />
focus on these rarer syndromes,” Ring says.<br />
Fragile X syndrome provides a case study<br />
in this approach that weds treatment strategies<br />
for a rare disorder with the possibility<br />
of understanding the underpinnings of<br />
autism. This genetic disorder, which affects 1<br />
in 4,000 males and 1 in 6,000 females (http://<br />
www.fraxa.org/), leads to learning disabilities<br />
and even mental retardation, anxiety and seizures.<br />
Up to 20% of individuals with fragile X<br />
also meet the criteria for an autism diagnosis.<br />
As a result of a single gene mutation, these<br />
individuals do not make the fragile X mental<br />
retardation protein (FMRP). Mark Bear of<br />
the Massachusetts Institute of Technology in<br />
Cambridge and his colleagues found that the<br />
lack of FMRP leads to dysregulation of signaling<br />
through the metabotropic glutamate<br />
receptors (mGluR). The mGluR5 receptor is<br />
highly expressed in regions of the brain critical<br />
for learning and memory.<br />
FMRP serves as a brake on this signaling<br />
pathway, says Randall Carpenter, CEO<br />
and president of Seaside Therapeutics, a<br />
Cambridge, Massachusetts, biotech company<br />
co-founded by Bear. “When it’s not<br />
there then there’s overactivation of the signaling<br />
pathway. The brain can’t discriminate<br />
between important information and noise<br />
and it doesn’t develop normally.” In mice<br />
with the fragile X mutation, Bear and his colleagues<br />
found that knocking down expression<br />
of mGluR5 to 50% rescued the learning<br />
deficits, stopped seizures and increased other<br />
measures of plasticity in the brain.<br />
Confident that they’re targeting the appropriate<br />
pathways, Seaside Therapeutics has licensed<br />
a series of small-molecule compounds from<br />
Merck to target glutamate signaling in general<br />
and mGluR5 signaling specifically, Carpenter<br />
says. They recently completed a phase 2 clinical<br />
trial of a general γ-aminobutyric acid (GABA)<br />
B agonist, STX209, in fragile X patients, and<br />
will soon complete a phase 2 trial of the same<br />
compound in individuals with autism spectrum<br />
disorders. A specific antagonist of the mGluR5<br />
receptor is currently in repeat-dose phase 2 trials,<br />
and Seaside expects to start phase 2 trials<br />
with fragile X patients by early 2011.<br />
Mutations in glutamate receptor genes<br />
GRIN2A and GRIK2 and multiple GABA<br />
receptor genes have been associated with<br />
autism. Two pharma companies also see<br />
promise in the mGluR5 receptor strategy<br />
for treating fragile X patients. Novartis in<br />
Basel recently completed a phase 2 clinical<br />
trial of their compound AFQ 056 at sites<br />
in Europe and is planning their next study,<br />
which is scheduled to open later in 2010, says<br />
spokesman Jeffrey Lockwood in an e-mail.<br />
Roche’s small-molecule mGluR5 antagonist<br />
is being tested in phase 2 clinical trials<br />
in five locations in the United States, says<br />
Santarelli. Their results are “encouraging so<br />
far,” he says. This growing understanding<br />
of these specific, related genetic disorders,<br />
Santarelli adds, provides a pathway to think<br />
about possible extrapolations to the more<br />
sporadic types of autism.<br />
Peptide hormone targets<br />
The peptide oxytocin and its related receptors<br />
are emerging as a pathway that could prove<br />
useful for treating a variety of neuropsychiatric<br />
disorders including autism. Animal studies<br />
have pointed to the importance of oxytocin in<br />
social behavior; in voles, for example, oxytocin<br />
and its counterpoint hormone vasopressin<br />
appears to have a role in pair bonding.<br />
Karen Parker and her colleagues at Stanford<br />
University in California observed seasonal<br />
differences in the way females and males who<br />
are raising young interacted. In the laboratory,<br />
they tracked these differences, caused by purely<br />
environmental cues to the locations of oxytocin<br />
receptors in the animals’ brains. Changes based<br />
on environmental cues have led researchers to<br />
consider oxytocin therapies for treating social<br />
dysfunctioning in humans.<br />
Such tests are already being done in humans.<br />
Hollander has given intravenous oxytocin<br />
nature biotechnology volume 28 number 8 august 2010 773
NEWS feature<br />
© 2010 <strong>Nature</strong> America, Inc. All rights reserved.<br />
to higher functioning patients with autism<br />
and Asperger’s syndrome and has observed<br />
improved social cognition. Patients were better<br />
able to lay down social memories or recognize<br />
emotions in spoken language, he says.<br />
Such treatments also decreased the severity<br />
of repetitive behaviors and self-stimulatory<br />
behaviors such as hand clapping, rocking and<br />
head banging.<br />
Patients treated with intranasal oxytocin<br />
showed similar improvements. Earlier this<br />
year, researchers at the Center for Cognitive<br />
Neuroscience in Bron, France, found that adults<br />
diagnosed as high functioning on the autism<br />
spectrum who received doses of intranasal<br />
oxytocin were better able to recognize cooperative<br />
play than adults with a similar diagnosis<br />
who had not received oxytocin. Those who had<br />
received oxytocin also spent more time looking<br />
at the face of their virtual playmates 5 .<br />
But teasing out the importance of oxytocin<br />
isn’t easy. The French study shows variation in<br />
individual responses to oxytocin. “We don’t have<br />
good biomarkers of oxytocin levels,” Parker says.<br />
Funded by a grant from the Simons Foundation,<br />
she and her colleagues are trying to measure<br />
plasma oxytocin levels, various mutations and<br />
social phenotypes among individuals with<br />
autism and their siblings and compare them<br />
with controls matched for age and gender.<br />
Oxytocin and the related response pathways<br />
represent “one of the most exciting biologies in<br />
the autism space today,” says Pfizer’s Ring and<br />
could have implications for other psychiatric<br />
areas as well. In research Ring carried out at<br />
Wyeth, he developed the first nonpeptide oxytocin<br />
receptor agonist 6 . “The oxytocin receptor<br />
is a priority target for the field, but a very<br />
challenging target to develop traditional smallmolecule<br />
chemistry for.”<br />
Cellceutix, a biotech company in Beverly,<br />
Massachusetts, is also testing a preclinical<br />
compound for autism, KM-391, in a rodent<br />
model of autism developed by researchers at<br />
the Kennedy Krieger Institute in Baltimore.<br />
The autism-like symptoms are induced by<br />
injecting the chemical 5,7-dihydroxytryptamine<br />
(5,7-DHT) into the forebrain of newborn<br />
rat pups, leading to neonatal serotonin depletion,<br />
reduced brain plasticity and abnormal<br />
behaviors. In an initial study, KM-391 given<br />
over 90 days restored normal behaviors, and<br />
near-normal serotonin levels and increased<br />
brain plasticity relative to a nontreatment<br />
group and a group given Prozac. Another study<br />
measuring serotonin levels in three regions of<br />
the rat brain has confirmed the restoration of<br />
normal serotonin levels.<br />
Another small study added an oxytocin<br />
antagonist to the mix. The antagonist alone<br />
intensified the autism-related behaviors, such as<br />
Table 1 Selected companies with autism targets in clinical development<br />
Company Target Drug candidate<br />
Curemark Protease CM-AT (a mixture of amylase, protease, chymotrypsin,<br />
deficiency trypsin, papain and papaya in a 4–10:1 ratio with lipase,<br />
derived from animal, plant, microbial or synthetic sources)<br />
repetitive behaviors and sensitivity to touch, but<br />
when given with KM-391, the frequency and<br />
intensity of these behaviors were reduced.<br />
Measuring outcomes<br />
Fueled by academic research and increased<br />
funding from the US National Institutes of<br />
Health, nonprofit and advocacy organizations,<br />
the field is moving forward. But even<br />
as some drug candidates are moving into the<br />
clinic, a number of challenges remain for the<br />
field as a whole. Above all is the problem of<br />
the heterogeneity of the disorder, according<br />
to Colamarino. “We’re calling it one thing<br />
when it’s really probably more than one.” That<br />
heterogeneity can pose a challenge in choosing<br />
appropriate study subjects. The field is<br />
also struggling with finding appropriate outcome<br />
measures, particularly those that can be<br />
measured within the time frame of a clinical<br />
study. Without sensitive measures of changes<br />
in the core symptoms, researchers need to<br />
identify what the focus should be within a<br />
particular trial. In many cases researchers<br />
have depended on parental reporting of<br />
behavioral changes, Colamarino says, leading<br />
to a large placebo effect. Although no<br />
biomarkers have been established for autism,<br />
some sort of biological measure of change<br />
in connection with autism’s core symptoms,<br />
would be particularly attractive. Some clinical<br />
trials have failed because of methodological<br />
issues, she adds. “That’s why we need to<br />
address this sooner rather than later.”<br />
To bring researchers together to discuss<br />
these challenges, Autism Speaks and Pfizer<br />
are co-sponsoring a translational research<br />
meeting to improve clinical study methodology<br />
and design, tentatively scheduled for<br />
later this year. “There’s no better investment<br />
for us externally than to bring together all<br />
the key experts in this area and have a discussion<br />
with FDA present and try to iron<br />
out a framework to address this challenge<br />
together,” Ring says. The development of the<br />
Diagnostic and Statistical Manual of Mental<br />
Stage of<br />
development<br />
Phase 3<br />
Novartis mGluR5 AFQ 056 (small molecule) Phase 2<br />
Roche mGluR5 RO4917523 (small molecule) Phase 2<br />
Seaside<br />
Therapeutics<br />
Forest<br />
Laboratories<br />
GABA B<br />
mGluR5<br />
NMDA receptor<br />
modulator<br />
STX209 (R-isomer of baclofen)<br />
STX107 (2-methyl-1,3-thiazol-4-yl)<br />
ethynylpyridine)<br />
Phase 2<br />
Phase 1<br />
Namenda (memantine) Phase 2<br />
Disorders (DSM-V), the bible for neurological<br />
diseases, scheduled for release in May<br />
2013, could complicate the development of<br />
trial endpoints, Bay City’s Lopez-Figueroa<br />
adds, depending on how autism disorders<br />
and symptoms are classified.<br />
A second meeting in early 2011 will look at<br />
clinical targets—both their identification and<br />
validation—in an attempt to reach a consensus<br />
on where therapeutics can bring the most<br />
initial benefit to patients. This is something<br />
the field is still struggling with, Ring says. “If<br />
we had one shot today to demonstrate that<br />
this would work, what would be the clinical<br />
target that we should take on?”<br />
Pfizer and Roche are also developing an<br />
autism proposal for the Innovative Medicines<br />
Initiative, which coordinates European<br />
Union–based public-private partnerships in<br />
drug discovery and development. The idea<br />
is for companies to join forces to work on<br />
research that is not generating intellectual<br />
property, Santarelli says, such as the development<br />
of animal models, understanding disease<br />
mechanisms and physiology, finding biomarkers<br />
and developing clinical methodology.<br />
Unquestionably, developing therapeutics<br />
for a developmental neuropsychiatric disorder<br />
with such an early onset presents several<br />
challenges. But Autism Speaks’ Colamarino is<br />
encouraged by the growth in the field. “Three<br />
to five years ago, we wouldn’t have been talking<br />
about clinical trials, certainly with respect to<br />
novel drug discovery,” she says. Pfizer’s Ring<br />
expects industry involvement to continue to<br />
grow: “It’s just too large an unmet medical<br />
need for companies not to see the opportunity<br />
to enter into this research space.”<br />
Sarah Webb, Brooklyn, NY<br />
1. Pinto, D. et al. <strong>Nature</strong> 466, 368–372 (2010).<br />
2. Berkel, S. et al. Nat. Genet. 42, 489–491 (2010).<br />
3. Guy, J. et al. Science 315, 1143–1147 (2007).<br />
4. Dölen, G. et al. Neuron 56, 955–962 (2007).<br />
5. Andari, E. et al. Proc. Natl. Acad. Sci. USA 107,<br />
4389–4394 (2010).<br />
6. Ring, R.H. et al. Neuropharmacology 58, 69–77<br />
(2010).<br />
774 volume 28 number 8 august 2010 nature biotechnology
uilding a business<br />
At ground level<br />
Julian Bertschinger<br />
The hardest—and perhaps loneliest—period of being an entrepreneur might be just after your company is founded.<br />
© 2010 <strong>Nature</strong> America, Inc. All rights reserved.<br />
cofounded Covagen when I was 30 years<br />
I old. Although my PhD and postdoc work<br />
had taught me to think in a focused manner<br />
and be product oriented, I was as green as<br />
they come concerning the nuts and bolts of<br />
launching a company. Picking it up as you go<br />
might not be the optimal way to learn, but<br />
I’m living proof that it can be done with the<br />
right team. Here’s how we did it.<br />
Two men and a plan<br />
The most important motivating factor, for me,<br />
was my education. I did my thesis in Dario<br />
Neri’s lab at the Institute of Pharmaceutical<br />
Sciences at ETH Zurich. The research group<br />
there had just isolated an antibody fragment<br />
that binds to a tumor-associated marker,<br />
and proof-of-concept data showed that the<br />
fragment selectively targeted solid tumors<br />
in mice. Neri went on to cofound Philogen,<br />
based in Siena, Italy, and develop the antibody<br />
in collaboration with Bayer Schering<br />
in Berlin. Today, several derivatives of this<br />
antibody are in phase 2 trials.<br />
Seeing this process firsthand showed me<br />
(and Dragan Grabulovski, my cofounder at<br />
Covagen, which is based in Zurich) that it was<br />
possible to move from the lab to the commercial<br />
side. This had our group thinking about<br />
products right away, which I believe is crucial<br />
when contemplating a biotech company. But<br />
the truth is that Covagen never would have<br />
been founded without the Venture business<br />
plan competition, organized every two years<br />
by McKinsey, in Zurich, and ETH Zurich.<br />
One of the winners of this competition was<br />
Glycart Biotechnology, also in Zurich, which<br />
took the prize in 1998 and eventually was<br />
acquired by Roche, in Basel, Switzerland, for<br />
CHF235 million (US$180 million) in 2005.<br />
Grabulovski and I decided to take part in<br />
Julian Bertschinger is CEO at Covagen,<br />
Zurich, Switzerland.<br />
e-mail: julian.bertschinger@covagen.com<br />
the Venture 2006 competition for two reasons:<br />
we were eager to learn how to write a business<br />
plan (we’d never written one) and we thought<br />
it would be interesting precisely because it was<br />
so different from the reports and scholarly<br />
articles we were used to writing.<br />
The competition is divided into two<br />
phases. During the first, entrants submit a<br />
business idea outlined on a few pages, and<br />
the best ten ideas are awarded a prize. In the<br />
second, all participants receive free coaching<br />
from industry experts and venture capitalists,<br />
who then give advice to participants<br />
writing their first business plan. The ten best<br />
business plans are chosen by a jury and all<br />
receive the same prize amount of CHF2,500<br />
(US$2,057).<br />
We submitted our business idea, but I<br />
didn’t actually expect us to be one of the<br />
winners; I was busy applying for postdoc<br />
positions abroad. Nevertheless, our idea<br />
was chosen out of about 100 applications<br />
to be awarded with a CHF2,500 prize. This<br />
Box 1 The technology behind Covagen<br />
Covagen is built on Fynomer technology (Fig. 1),<br />
developed at the Institute of Pharmaceutical<br />
Sciences at ETH Zurich. Fynomers are a class of<br />
binding proteins derived from the Src homology<br />
3 (SH3) domain of the human Fyn kinase (D.<br />
Grabulovski et al. J. Biol. Chem. 282, 3196–<br />
3204 (2007)). The Fyn SH3 domain structure<br />
is made up of two anti-parallel β-sheets and<br />
two loops—n-src and RT—which are known to<br />
be involved in interactions with other ligand<br />
proteins.<br />
Fynomers can be produced in bacteria at<br />
high yields and are approximately 20 times<br />
smaller than antibodies. Additionally, they<br />
have the advantage of being easily assembled<br />
in a modular manner to yield bispecific and/or<br />
surprised me—not because we doubted our<br />
entry, which was based on the Fynomer technology<br />
(Fig 1; Box 1 and D. Grabulovski et<br />
al. J. Biol. Chem. 282, 3196–3204 (2007)) but<br />
because we felt that it was too early to found<br />
a company on the available results: we had<br />
no in vivo data.<br />
Looking back, the biggest effect of participating<br />
in Venture 2006 was that it let us begin<br />
to establish a business network—previously,<br />
we’d known only people within academia. At<br />
workshops during the second phase of the<br />
competition, we met Rudolf Gygax, a managing<br />
director of Novartis Venture Fund, who<br />
would be a key contact for us later on. He<br />
and Neri helped us to draft our first business<br />
plan.<br />
The prize money was certainly useful,<br />
but the large amount of positive feedback<br />
we received was even more important. That<br />
boosted our confidence, and after winning, I<br />
thought for the first time that we really could<br />
found our own company.<br />
Figure 1 Fyn Src homology 3 (SH3)<br />
domain structure. The RT-Src loop is<br />
shown in red, and the n-Src loop is shown<br />
in green. (Protein Data Bank entry 1M27)<br />
multivalent proteins, which might allow new treatment modalities that are challenging or<br />
impossible to explore with traditional antibody formats.<br />
nature biotechnology volume 28 number 8 august 2010 775
uilding a business<br />
© 2010 <strong>Nature</strong> America, Inc. All rights reserved.<br />
Box 2 Securing our funding<br />
I was able to found Covagen with an initial investment (in several tranches) from the<br />
Novartis Venture Fund. The first tranche came after signing investment documents, and<br />
the following tranches were hinged on attaining research milestones.<br />
It was crucial that Novartis Venture Fund was prepared to invest in us at a very early<br />
stage. Corporate venture funds are beneficial in this way: they are usually more likely to do<br />
early-stage investments than most private venture capitalists because corporate funds can<br />
afford longer times to exit. If you’ve hit upon an interesting idea in academia, you might<br />
look to corporate venture funds first.<br />
In 2009, Covagen was able to attract three other investors: the corporate venture<br />
fund MP Healthcare Venture Management, of Boston; Ventech, of Paris; and Edmond de<br />
Rothschild Investment Partners, also of Paris. We also have received some funds via our<br />
research collaboration with Roche, which was secured in June 2009.<br />
To move our interleukin-17A inhibitor into preclinical and clinical development, we<br />
are planning to raise additional money this year, so we are seeking one or two venture<br />
capitalists to join our existing investors.<br />
Founding Covagen<br />
We stayed in contact with Gygax, and he<br />
invited us to present our project at the<br />
Novartis Venture Fund headquarters in Basel.<br />
The fund was interested in investing, and we<br />
sat down to negotiate our first term sheet. I<br />
had absolutely no idea what the difference<br />
was between a binding contract and term<br />
sheet, and this was my initiation. I learned<br />
what Series A shares are, how to calculate<br />
pre-money and post-money valuations, what<br />
drag-along and tag-along clauses are, why a<br />
high liquidation preference for investors is<br />
bad for holders of common shares and how<br />
anti-dilution protection for investors can<br />
hurt founders in a down round. I was moving<br />
into a whole new world.<br />
It is very important to understand every<br />
word in term sheets and agreements. You<br />
should always know what you are signing.<br />
To do this, first make sure you find a lawyer<br />
who intimately knows relationships between<br />
venture capitalists and biotech startup companies,<br />
and then be persistent enough to ask your<br />
lawyer about every single expression or phrase<br />
you do not understand. (You can familiarize<br />
yourself somewhat with the terminology by<br />
using the internet, in particular http://www.<br />
investopedia.com/terms/v/venturecapital.asp,<br />
but also ask your lawyer directly.)<br />
When we finally signed the term sheet,<br />
we found it just meant more paperwork. We<br />
still needed to establish a licensing agreement<br />
with ETH Zurich and negotiate the<br />
investment and shareholder’s agreements. I<br />
admit that when I first read the investment<br />
document drafts, I thought the beginning<br />
definitions weren’t very relevant. But after<br />
further reading and questioning our lawyer,<br />
I quickly realized that those definitions are<br />
actually one of the most important things in<br />
a contract.<br />
Once all the details were ironed out<br />
(Box 2), we founded Covagen in December<br />
2006 and signed the investment agreements<br />
with Novartis Venture Fund. The real work<br />
was about to start.<br />
The lonely lab<br />
Grabulovski still had to finish his PhD thesis.<br />
This made me Covagen’s only employee<br />
from December 2006 until May 2007, and<br />
Covagen was a startup in every sense of<br />
the word. My first task was to open a bank<br />
account so Novartis Venture Fund could<br />
transfer in its investment.<br />
When that was done, I set up Covagen’s<br />
homepage (be sure to check for domain<br />
name availability before you decide on a<br />
company name). A friend of a friend runs a<br />
company offering website design and e-mail<br />
hosting services, and he helped me create<br />
Covagen’s website. Here’s a tip: make sure<br />
that you can administer the website yourself<br />
so you will not have to pay a web designer for<br />
every small change or update. In addition, I<br />
opened a Covagen e-mail account, and here,<br />
too, I made sure I could independently set up<br />
additional e-mail accounts.<br />
But there remained a very big need—work<br />
space. We had no laboratory. Unfortunately,<br />
ETH Zurich does not offer incubator space<br />
for spin-outs. Startup companies usually try<br />
to find space within the department they<br />
originated from, but in our case there was no<br />
room available. After asking around within<br />
ETH Zurich, Grabulovski learned of an empty<br />
laboratory not attached to any department,<br />
and we were able to make an arrangement to<br />
allow us to rent this space. In addition, our former<br />
institute enabled us to access some rather<br />
expensive instruments for an affordable fee.<br />
The laboratory was empty, except for<br />
benches and desks, and somewhat dusty. On<br />
my second day, I brought rags from home<br />
and started cleaning. This wasn’t really what<br />
I envisioned a biotech CEO doing, but the<br />
truth is, I was excited—I was starting a company<br />
from the very bottom! There was no<br />
network connection for my computer, no<br />
printer, no phone, no fax. However, after<br />
making a few calls with my mobile phone,<br />
the university’s staff set up all the necessary<br />
connections within a few days. This is<br />
a benefit of staying within academia: when<br />
starting your company, all issues related to<br />
infrastructure need only minimal time and<br />
management resources.<br />
After all that work, I thoroughly appreciated<br />
making the first company phone call and<br />
sending the first message from my Covagen<br />
e-mail account!<br />
With communications behind me, I was<br />
left with the science. It’s only when you start<br />
from scratch that you realize how many different<br />
instruments and tools, disposable<br />
plastic tubes, glassware, kits, antibodies and<br />
chemicals are needed for research, and I had<br />
none of it. I also realized how comfortable<br />
my life in the academic lab had been, where<br />
many instruments were available and I didn’t<br />
have to think about budgeting. That was not<br />
the case at Covagen, where I became very<br />
cost sensitive. Comparison shopping takes<br />
time, and it was four months before the last<br />
instruments and reagents arrived. This neatly<br />
coincided with Grabulovski earning his PhD<br />
in May 2007, and he joined Covagen as CSO.<br />
I finally had company.<br />
Building a biotech<br />
Established as Covagen, we now had several<br />
target proteins in mind to validate the<br />
technology, but we did not have a clear plan<br />
on which targets we wanted to focus on<br />
for the development of our first Fynomerbased<br />
clinical candidate. Choosing a good<br />
first target was the most important decision<br />
we needed to make because once we made<br />
the call, we’d invest most of our resources in<br />
that direction. We investigated many different<br />
targets to find one that was economically<br />
promising and in an area in which Covagen<br />
had freedom to operate. We decided to go for<br />
inhibition of the cytokine interleukin-17A,<br />
which is an attractive emerging target for<br />
diseases such as rheumatoid arthritis, psoriasis<br />
and uveitis.<br />
In early summer 2007, we hired another<br />
person to help speed up our research. We<br />
had spent less money than we expected in the<br />
first half of 2007, so we had sufficient financial<br />
resources to hire. We felt that our first<br />
employee should be someone we already knew<br />
and someone we could trust to be dependable<br />
776 volume 28 number 8 august 2010 nature biotechnology
uilding a business<br />
© 2010 <strong>Nature</strong> America, Inc. All rights reserved.<br />
and competent. As several investors had<br />
warned us, not getting along with co-workers<br />
is a big reason why many small companies fail.<br />
Personal frictions tend to increase even more<br />
if a company hits hard times.<br />
We asked Simon Brack, an antibody engineering<br />
specialist we knew from our time in Neri’s<br />
group, to join Covagen. Brack was returning to<br />
Switzerland from Oxford, where he’d worked as a<br />
postdoc. In October 2007, he became Covagen’s<br />
third employee and was a great hire.<br />
Even in a company as small as Covagen<br />
was then, there were a million administrative<br />
things to do, and they occupied a large amount<br />
of my time—I was finding it hard to do the<br />
necessary work on the bench to develop our<br />
technology, not to mention that creating documents<br />
and presentations for potential investors<br />
takes a lot of time. So at the very least, it<br />
felt good to know that if I had to leave the lab,<br />
I had four hands working while I was gone.<br />
Now, we are up to seven employees.<br />
Advancing our technology is the most<br />
important task we have at Covagen, just as<br />
it was when we started. For this reason, all<br />
employees at Covagen are PhD scientists. We<br />
are a young and enthusiastic team; none of<br />
us is older than 33. This can be a problem<br />
at times: when talking to investors, I realize<br />
that we sometimes lack credibility. Quite<br />
often, investors do not believe our claims,<br />
and mainly that’s because they do not believe<br />
I have enough experience. In some ways,<br />
they are right—I am a scientist still learning<br />
the business side of things. But we have<br />
been taught a lot about the varying aspects<br />
of drug development through working with<br />
Neri, and I believe a young group like us can<br />
learn fast if given the right advice.<br />
Currently, we’re getting that advice from<br />
Ray Hill, who was executive director for<br />
licensing in Europe at Merck & Co. and now<br />
is a visiting professor in neuroscience and<br />
mental health at Imperial College London.<br />
Hill sits on our board of directors. We’ve also<br />
established an excellent scientific advisory<br />
board, which will be of great help and value<br />
when bringing our first drug candidate to<br />
preclinical development and broadening our<br />
research activities.<br />
Conclusions<br />
Even as our company grows, things continue<br />
to change quickly and will for the foreseeable<br />
future. The larger we get, the more important<br />
(and time consuming) communicating<br />
with employees, investors, our board of<br />
directors and our scientific advisory board<br />
becomes. My tasks are always shifting as we<br />
adapt, improve and complement our skills.<br />
But this fluid environment is partially what<br />
makes startup companies attractive workplaces.<br />
Now, our company doesn’t feel so young<br />
anymore. This year, we plan to bring our<br />
first drug candidate to good manufacturing<br />
practice production and preclinical development.<br />
That, of course, will require additional<br />
money, and we plan to close a financing<br />
round this year. Raising a sizable round is<br />
another challenge for me, and it means I’m<br />
no longer on the bench. My job is raising<br />
money now. In that regard, I’ve graduated to<br />
the role of a typical biotech CEO.<br />
To discuss the contents of this article, join the Bioentrepreneur forum on <strong>Nature</strong> Network:<br />
http://network.nature.com/groups/bioentrepreneur/forum/topics<br />
nature biotechnology volume 28 number 8 august 2010 777
correspondence<br />
Waking up and smelling the coffee<br />
© 2010 <strong>Nature</strong> America, Inc. All rights reserved.<br />
To the Editor:<br />
As I pointed out recently on the Patent<br />
Docs weblog (http://www.patentdocs.<br />
org/), the editorial ‘Sitting up and taking<br />
notice’ in the May issue 1 , announcing<br />
Judge Sweet’s 29 March decision in favor of<br />
the plaintiffs in Association for Molecular<br />
Pathology v. US Patent and Trademark<br />
Office, contains several misstatements and<br />
promotes the wrong-headed idea that gene<br />
patenting is a problem.<br />
In describing the case, you begin by<br />
making factual errors. Judge Sweet’s<br />
decision (summary judgment) does not<br />
indicate that “the judge felt that Myriad<br />
had no case to argue.” Rather, summary<br />
judgment is used when there are no<br />
disputed issues of material fact, and the<br />
case is decided as a matter of law. I would<br />
argue that the prudence of Judge Sweet’s<br />
judgment is questionable because he chose<br />
to make law by deciding that DNA is not<br />
patent eligible for being “the physical<br />
embodiment of genetic information.”<br />
You then state that “[t]he plaintiffs…won<br />
on virtually every count.” In fact, the court<br />
refused to consider the US Constitutional<br />
issues raised in the complaint, which<br />
formed the basis for the breast cancer<br />
victims to have standing in the lawsuit.<br />
This is not trivial because the court used<br />
these constitutional issues not only to<br />
deny defendants’ motions to dismiss, but<br />
also, politically, to provide the political<br />
frisson so attractive to the American Civil<br />
Liberties Union (New York) and the Public<br />
Patent Foundation (New York).<br />
The editorial goes on to mischaracterize<br />
the effects of BRCA patents on research,<br />
stating that “Myriad’s influence has been<br />
particularly pernicious. Its lawyers have<br />
issued cease-and-desist letters to genetics<br />
laboratories in universities, hospitals and<br />
clinics that offered diagnostic services<br />
based on the BRCA1 and BRCA2 genes.”<br />
Why is enforcing your patent rights<br />
pernicious? Use of these patented tests by<br />
these institutions constitutes infringement.<br />
It doesn’t matter whether the infringer<br />
is a university, hospital or clinic, they<br />
are still liable for infringement owing to<br />
their for-profit, commercial activities.<br />
There is no evidence that Myriad Genetics<br />
(Salt Lake City, UT, USA) or any other<br />
gene patent holder has inhibited basic<br />
biological research by threatening patent<br />
infringement litigation; indeed, there are<br />
several thousand basic research papers in<br />
scientific journals that have been published<br />
since the BRCA gene patents were granted.<br />
The piece also attempts<br />
to achieve ‘truth by<br />
association’ in citing<br />
several groups having<br />
“concerns” about gene<br />
patents that filed amicus<br />
briefs, including the<br />
International Center for<br />
Technology Assessment,<br />
Greenpeace, the<br />
Indigenous Peoples’<br />
Council on Biocolonialism<br />
and the Council for<br />
Responsible Genetics.<br />
Their contribution would<br />
be more worthwhile if<br />
it did not include incorrect statements<br />
regarding gene patenting’s consequences,<br />
including “the privatization of genetic<br />
heritage, the creation of private rights of<br />
unknown scope and consequences and the<br />
violation of patients’ rights.”<br />
The editorial was correct in noting<br />
that “[t]he alignment of physicians’<br />
and patients’ groups with what are, in<br />
effect, antibiotech lobbyists is a worrying<br />
development,” albeit ignoring the fact that<br />
not only the biotech sector, but also the<br />
public should be worried if these groups get<br />
their way.<br />
The editorial did supply potentially<br />
informative data, that Myriad reported<br />
“$326 million in revenue from diagnostic<br />
testing against $43 million in costs.”<br />
Assuming that these numbers are correct,<br />
and reflect only BRCA testing, this<br />
could be a measure of the profitability of<br />
BRCA testing results (perhaps providing<br />
motivation for the “universities, hospitals<br />
and clinics” to be so keen on getting into<br />
the business, infringing or no). But even<br />
here, the figures are completely out of<br />
context. No indication is provided whether<br />
these profits are out of the ordinary for a<br />
diagnostics company, traditional or genetic,<br />
or whether the ‘costs’ include ancillary<br />
costs like genetic counseling or physician<br />
education (both critical in genetic<br />
diagnostics due to the consequences for a<br />
patient of receiving a genetic diagnosis).<br />
If Myriad’s profits are<br />
significantly higher than<br />
those at other diagnostic<br />
companies, that fact would<br />
be relevant. The absence of<br />
any comparisons suggests<br />
that the absolute numbers<br />
were used because they<br />
better supported the<br />
editorial’s views.<br />
Finally, the editorial<br />
departs from reality when<br />
it decries the patent system<br />
for rewarding “only the last<br />
inventive step—the small<br />
breakthrough that enables<br />
a concept to be realized.” Such a statement<br />
indicates just how little the writers<br />
understand the ‘balance of rights’ that the<br />
patent bargain actually strikes. The patent<br />
system rewards inventors who disclose<br />
how to make and use an invention that<br />
is new, useful and nonobvious. Whether<br />
the improvement is groundbreaking or<br />
incremental, satisfaction of the statutory<br />
requirements governs patentability. Thus,<br />
if technology becomes obsolescent, new<br />
technology takes its place—because patents<br />
expire, as indeed Myriad’s patents will<br />
begin to expire in 2014. The consistent<br />
lack of understanding of innovation and<br />
the patent process is illustrated by the<br />
suggestion that rights to specific genes in<br />
multigene tests be assigned based on “the<br />
importance of any specific gene sequence<br />
to the utility of the test.” This is something<br />
the marketplace can be counted on to do<br />
without the government’s help.<br />
The last sentence of the piece<br />
even acknowledges the editorial idea<br />
778 volume 28 number 8 AUGUST 2010 nature biotechnology
correspondence<br />
© 2010 <strong>Nature</strong> America, Inc. All rights reserved.<br />
is “implausible within the current<br />
petrified patent system and commercial<br />
infrastructure,” and then adds that this<br />
“doesn’t have to stop the dream” or “stop<br />
the discussion.” I would counter that the<br />
dream of better diagnostics and therapies<br />
is being, and has been, realized by 30 years<br />
of biotech and protection thereof by an<br />
invigorated patent system in the United<br />
States (and elsewhere). Changing that now,<br />
particularly if based on the wooly-headed<br />
arguments (really, sentiments) in the<br />
editorial, is the fastest and surest way that<br />
those hopes and dreams will be dashed.<br />
COMPETING FINANCIAL INTERESTS<br />
The author declares no competing financial<br />
interests.<br />
Kevin E Noonan<br />
McDonnell Boehnen Hulbert & Berghoff LLP,<br />
Chicago, Illinois, USA.<br />
e-mail: noonan@mbhb.com<br />
1. Anonymous. Nat. Biotechnol. 28, 381 (2010).<br />
<strong>Nature</strong> Biotechnology replies:<br />
We were not making the case that gene<br />
patenting itself was a problem, although it<br />
is clear that some DNA patents with overly<br />
broad claims are cause for concern. We<br />
disagree with the contention that “there<br />
is no evidence that Myriad Genetics…or<br />
any other gene patent holder has inhibited<br />
basic biological research by threatening<br />
patent infringement litigation.” There are<br />
cases where exclusive licensing practices<br />
(a particular problem for methods patents)<br />
or aggressive license enforcement has<br />
stymied research, as is detailed elsewhere<br />
in this issue 1 . The problems also reach<br />
beyond basic research: a survey of 132<br />
clinical laboratory heads in the United<br />
States found that 53% had “decided not<br />
to develop or perform a test/service for<br />
clinical or research purposes because of a<br />
patent” 2 . Indeed, one of the plaintiffs in<br />
the Association for Molecular Pathology<br />
v. US Patent and Trademark Office case<br />
is a patient who would like to have their<br />
BRCA1 test from Myriad independently<br />
verified by another laboratory, but cannot<br />
because of Myriad’s aggressive stance that<br />
prevents other laboratories performing the<br />
test. It might be good business for Myriad,<br />
but is it reasonable to enforce intellectual<br />
property in such a manner that it is so<br />
difficult for a patient to confirm a DNA<br />
test in an independent laboratory?<br />
The claim that new technology takes the<br />
place of ‘obsolescent’ technology because<br />
“patents expire” is also moot in relation to<br />
DNA patents. A point we were trying to<br />
make in the editorial is that the fields of<br />
molecular diagnostics and sequencing are<br />
moving so quickly that they are becoming<br />
obsolete along much shorter timelines<br />
than patent terms of 20 years. Although<br />
Genetic stability in two<br />
commercialized transgenic<br />
lines (MON810)<br />
To the Editor:<br />
A letter of correspondence by Dany Morisset<br />
and his colleagues 1 in the August 2009 issue<br />
cites two recent publications 2,3 in which “two<br />
commercial seed varieties of the MON810<br />
maize genetically modified<br />
event (ARISTIS BT and<br />
CGS4540) present genetic<br />
variation thus hampering the<br />
detection by several methods<br />
for MON810 (Monsanto, St.<br />
Louis).” As representatives of<br />
Monsanto Europe (Brussels),<br />
Syngenta Crop Protection<br />
(Basel) and Limagrain<br />
Services Holding (Chappes,<br />
France), we would like to<br />
correct the scientific record<br />
concerning the claimed<br />
“variation” of the transgenic<br />
insertion in these transgenic<br />
hybrids.<br />
Upon request for further information,<br />
Margarita Aguilera and her colleagues at<br />
the European Commission, Directorate<br />
General Joint Research Center (JRC) in Ispra,<br />
Italy, informed us that the seeds tested were<br />
among 26 MON810 varieties provided by the<br />
Spanish Instituto Nacional de Investigación<br />
y Technología Agraria y Alimentaria (INIA;<br />
Madrid). The Spanish agency did not provide<br />
the JRC with details of the respective batch<br />
numbers for each variety.<br />
Our investigation has revealed that the<br />
two deviating results were not in fact related<br />
to variation of the transgenic insertion,<br />
as reported by Aguilera et al. 2,3 . Instead,<br />
our conclusions are that the two varieties<br />
(reported as entry 2 and entry 5) were not<br />
MON810 maize hybrids at all.<br />
Variety CGS4540 (entry 5) is a Bt176 maize<br />
hybrid and we do not understand why the<br />
seed was provided by INIA as MON810.<br />
Entry 2, which was designated as Aristis<br />
it was not trivial to sequence a human<br />
gene 20 years ago, it is certainly becoming<br />
routine today.<br />
1. Carbone, J. et al. Nat. Biotechnol. 28, 784–791<br />
(2010).<br />
2. Cho, M.K. et al. J. Mol. Diagnostics 5, 3–6 (2003).<br />
Bt, is most likely Aristis, the conventional<br />
counterpart of Aristis Bt (MON810). When<br />
we requested INIA to send a sample of<br />
Aristis Bt to its official Spanish laboratory<br />
CSIC (Consejo Superior de Investigaciones<br />
Científicas) for testing, the<br />
results were positive for<br />
MON810, as expected.<br />
Aguilera and her<br />
colleagues were not able<br />
to provide a correct chain<br />
of custody for the samples<br />
used in their analyses,<br />
which would have allowed<br />
resolution of the origin of<br />
these deviating results.<br />
The seed industry has<br />
invested significantly to<br />
provide quality products<br />
to the market place, which<br />
includes selling compliant<br />
and stable products. Traits are tested for<br />
presence and stability for many generations<br />
before release to the market place. We<br />
are therefore convinced that there is no<br />
scientific evidence of instability in MON810<br />
hybrids.<br />
COMPETING FINANCIAL INTERESTS<br />
The authors declare competing financial interests:<br />
details accompany the full-text HTML version of the<br />
paper at http://www.nature.com/naturebiotechnology/.<br />
Sofia Ben Tahar 1 , Isabelle Salva 2 &<br />
Ivo O Brants 3<br />
1 Limagrain Services Holding, Quality Assurance,<br />
Chappes, France. 2 Syngenta Crop Protection AG,<br />
Regulatory Affairs, Basel, Switzerland. 3 Monsanto<br />
Europe SA, Scientific Affairs, Brussels, Belgium.<br />
e-mail: ivo.o.brants@monsanto.com<br />
1. Morisset, D. et al. Nat. Biotechnol. 27, 700–701<br />
(2009).<br />
2. Aguilera, M. et al. Food Anal. Methods 1, 252–258<br />
(2008).<br />
3. Aguilera, M. et al. Food Anal. Methods 2, 73–79<br />
(2009).<br />
nature biotechnology volume 28 number 8 AUGUST 2010 779
correspondence<br />
Distances needed to limit cross-fertilization<br />
between GM and conventional maize in Europe<br />
© 2010 <strong>Nature</strong> America, Inc. All rights reserved.<br />
To the Editor:<br />
To avoid the economic consequences of<br />
admixtures of genetically modified (GM)<br />
and non-GM harvests, and to ensure that<br />
agricultural production complies with<br />
mandatory labeling provisions, the European<br />
Union (EU; Brussels) member states have<br />
adopted co-existence measures directed to<br />
farmers cultivating GM varieties. For GM<br />
maize cultivation, regulators have established<br />
mandatory isolation distances, which<br />
differ between countries and in some cases<br />
have been regarded as disproportionate 1,2 .<br />
Taking advantage of numerous field studies<br />
conducted by EU researchers in recent years,<br />
we report here a statistical analysis of crossfertilization<br />
data in maize, showing that<br />
separating fields 40 m is sufficient to keep<br />
GM adventitious presence below the legal<br />
labeling threshold in the EU set at 0.9%.<br />
Currently, insect-resistant maize<br />
(engineered to express Bacillus thuringiensis<br />
toxin; Bt) and Amflora potato (engineered<br />
with antisense against granule-bound starch<br />
synthase), which was recently approved 3 ,<br />
are the only two GM crops authorized for<br />
commercial cultivation in the EU. Bt maize<br />
was approved in 1998 and currently covers<br />
1.2% of the total maize area in the EU<br />
(Supplementary Notes 1 and 2).<br />
Given the legal standards for labeling and/<br />
or purity, the cultivation of GM maize in the<br />
EU is associated with mandatory technical<br />
coexistence measures designed to reduce<br />
the adventitious presence of GM maize<br />
in neighboring non-GM maize harvests.<br />
Such measures, to be applied by GM maize<br />
growers, should be stringent enough to<br />
keep adventitious presence below 0.9% so<br />
that conventional maize can comply with<br />
labeling provisions and avoid any potential<br />
price premium losses associated with GM<br />
admixtures 4,5 .<br />
Cross-fertilization between neighboring<br />
maize fields is the most important ‘biological’<br />
source of admixture between GM and<br />
conventional maize 4,5 . Factors influencing<br />
cross-fertilization rates in maize cultivation<br />
are well studied and include, among others,<br />
the distance between fields, flowering<br />
synchrony, weather conditions, the relative<br />
positions of donor and receptor fields (with<br />
respect to dominant winds in the area)<br />
and the size and shape of fields 4 . Because<br />
of the difficulty to control some of these<br />
parameters, regulatory bodies from most<br />
EU countries have decided to establish<br />
mandatory separation distances between GM<br />
and non-GM maize fields as the preferred<br />
single measure to limit cross-fertilization 6 .<br />
An overview of mandatory separation<br />
distances adopted by EU member states<br />
(Supplementary Table 1) shows a remarkable<br />
range of variation, 25–600 m, between the<br />
different countries. Although climatic and<br />
landscape parameters in maize cultivation<br />
(that affect cross-fertilization rates) are<br />
variable in the EU, often there is little sciencebased<br />
evidence that the distances adopted<br />
are proportional to achieve the desired purity<br />
standards.<br />
To test the proportionality of the<br />
separation distances established by EU<br />
member states, we perform a statistical<br />
analysis of data obtained from a number of<br />
recent studies on maize cross-fertilization<br />
performed in different European countries.<br />
Although the various studies recorded<br />
different variables, we analyzed only data<br />
on cross-fertilization rates (measured as<br />
percentage of seeds in the sample) in the<br />
receptor field as a function of distance<br />
from the edge of the pollen source. The aim<br />
of the analysis was to estimate distances<br />
necessary to keep cross-fertilization below<br />
different arbitrary tolerance thresholds and<br />
with different confidence levels. The results<br />
should inform debate on whether current<br />
distances between GM and non-GM maize<br />
fields stipulated by member states to meet<br />
legal EU labeling thresholds are supported by<br />
scientific data.<br />
Out-crossing (% seeds)<br />
40<br />
35<br />
30<br />
25<br />
20<br />
15<br />
10<br />
5<br />
0<br />
Out-crossing (% seeds)<br />
5<br />
4<br />
3<br />
2<br />
1<br />
0<br />
We first compiled a database of crossfertilization<br />
rates and distance by collating<br />
different publications and unpublished<br />
studies on maize cross-fertilization, to obtain<br />
a total of 1,174 observations covering four<br />
European countries (Germany, Italy, Spain and<br />
Switzerland). Details on the sources of data<br />
used are given in Supplementary Table 2.<br />
The database covered studies with a variety<br />
of experimental designs (mostly receptor and<br />
donor fields side by side, but also donor and<br />
receptor fields dispersed in actual agricultural<br />
landscapes) and that had been performed<br />
in different growing seasons (2001–2006).<br />
Data originate from experimental designs<br />
representing worst-case scenarios (receptor<br />
fields situated downwind from donor fields<br />
and coincidence of flowering between donor<br />
and receptor fields) in Europe.<br />
The relationship between distances and<br />
cross-fertilization rates for the database<br />
shows a negative relationship between<br />
these two variables (Fig. 1). This reciprocal<br />
relationship between cross-fertilization rates<br />
and distance was pointed out previously<br />
by several other authors 4,5,7–9 . For further<br />
analyses, cross-fertilization rates were<br />
analyzed for 10 m distance intervals<br />
(Supplementary Table 3). Because of the lack<br />
of sufficient observations from 50 m upwards,<br />
the size of intervals was increased to 20 m.<br />
Supplementary Table 3 shows that data on<br />
maize cross-fertilization are mostly available<br />
for short distances, close to the donor (84.1%<br />
of the data set, or 985 observations, are taken<br />
between 0 m and 20 m). In contrast, only<br />
0 25 50 75 100 125 150<br />
Distance (m)<br />
0 50 100 150 200<br />
Distance (m)<br />
Figure 1 Cross-fertilization rates for Bt maize. The figure shows a meta-analysis of maize crossfertilization<br />
data. Cross-fertilization rates are represented in relation to the distance from the pollen<br />
donor. The upper chart is a magnification of the original chart with a limited scale of the respective axis.<br />
780 volume 28 number 8 AUGUST 2010 nature biotechnology
correspondence<br />
© 2010 <strong>Nature</strong> America, Inc. All rights reserved.<br />
Table 1 Probability of keeping cross-fertilization below a certain threshold level (%) using a gamma distribution<br />
Distance (m)<br />
1.5%<br />
Mean<br />
(low-high bounds)<br />
(0–10] 49.44<br />
(46.10–52.92)<br />
(10–20] 91.19<br />
(88.58–93.70)<br />
(20–30] 99.86<br />
(99.54–100)<br />
(30–40] 99.99<br />
(99.96–100)<br />
(40–50] 99.88<br />
(99.56–100)<br />
(50–70] 99.88<br />
(99.28–100)<br />
(70–90] 99.98<br />
(99.90–100)<br />
>90 100<br />
(100–100)<br />
4.2% of the measurements are available from<br />
distances above 50 m from the donor field.<br />
The mean cross-fertilization rate and the<br />
standard deviation for each distance interval<br />
were calculated using all data points in the<br />
interval, and the highest and the lowest<br />
values for cross-fertilization rate registered<br />
(Supplementary Table 3).<br />
The mean and variance of each<br />
distance interval were used to calculate<br />
the parameters that characterize different<br />
probability distributions at those intervals.<br />
Once the distribution was obtained,<br />
probability of avoiding maize crossfertilization<br />
at different thresholds levels was<br />
calculated for each distance interval.<br />
To ensure robustness of the results<br />
obtained, different probability distributions<br />
were used following parametric and<br />
nonparametric approaches. Both approaches<br />
produced similar results. In the parametric<br />
approach, the probability distribution used<br />
to represent the cross-fertilization level for<br />
a given distance interval was the gamma<br />
distribution. The parameters of the gamma<br />
distribution were determined by the mean<br />
and the variance of the data in each interval.<br />
The probability distribution of crossfertilization<br />
being above a certain threshold<br />
level was obtained by conducting bootstrap<br />
sampling per interval 1,000 times. Bootstrap<br />
sampling allows obtaining a range of values<br />
for the parameters of the gamma distribution<br />
and therefore we were able to calculate the<br />
probability of being above a number of<br />
stated cross-fertilization thresholds (e.g.,<br />
0.9%; see ‘Gamma parameterization’ in<br />
Supplementary Note 3). We also estimated<br />
Cross-fertilization threshold (% of seeds) 1<br />
0.9%<br />
Mean<br />
(low-high bounds)<br />
41.16<br />
(37.80–44.62)<br />
70.89<br />
(67.56–74.38)<br />
95.62<br />
(92.12–98.44)<br />
99.61<br />
(98.76–100)<br />
98.56<br />
(96.10–100)<br />
99.11<br />
(96.26–100)<br />
99.58<br />
(98.68–100)<br />
99.96<br />
(99.86–100)<br />
a beta distribution to analyze the data<br />
(Supplementary Note 4).<br />
The nonparametric approach, where<br />
no distributional parameters are assigned,<br />
was based on a bootstrap simulation that<br />
consisted in drawing the observed data<br />
on cross-fertilization 1,000 times with<br />
replacement per interval. Therefore, we<br />
obtained 1,000 subsamples per interval.<br />
From each of these subsamples, the<br />
probability distribution of being above<br />
any cross-fertilization threshold can be<br />
calculated and mean and confidence<br />
intervals for the probability of being above a<br />
cross-fertilization threshold can be obtained.<br />
Table 1 shows the mean probability of<br />
keeping cross-fertilization between maize<br />
fields below different arbitrary threshold<br />
levels (1.5%, 0.9%, 0.5% and 0.3%) for each<br />
separation distance interval, using the<br />
gamma distribution. A 95% confidence<br />
interval of the mean probability of keeping<br />
cross-fertilization below a certain threshold<br />
is calculated (see low and high bounds for<br />
each distance interval).<br />
The results provided in Table 1 are<br />
relevant for policy decision-making. For<br />
example, implementing a 30 m separation<br />
distance would result in a probability higher<br />
than 95% (95.62%, see mean probability<br />
values in bold in Table 1) to keep crossfertilization<br />
values below the 0.9% EU<br />
labeling threshold. The probability increases<br />
to 99% if a 40 m distance is implemented.<br />
However, it is known that cross-fertilization<br />
is not the only source of GM adventitious<br />
presence in maize harvests. Traces of GM<br />
seeds in conventional seeds and machinery<br />
0.5%<br />
Mean<br />
(low-high bounds)<br />
33.11<br />
(29.76–36.66)<br />
41.41<br />
(37.78–45.06)<br />
66.94<br />
(58.30–75.14)<br />
94.14<br />
(87.70–99.44)<br />
92.07<br />
(84.12–99.80)<br />
95.89<br />
(87.30–99.90)<br />
96.08<br />
(91.56–99.94)<br />
98.58<br />
(97.30–99.54)<br />
0.3%<br />
Mean<br />
(low-high bounds)<br />
27.30<br />
(24.06–30.64)<br />
21.80<br />
(18.20–25.68)<br />
31.19<br />
(21.52–41.00)<br />
77.26<br />
(63.70–91.08)<br />
79.38<br />
(66.48–95.34)<br />
88.05<br />
(74.54–96.86)<br />
86.81<br />
(77.48–97.66)<br />
90.76<br />
(86.22–94.76)<br />
1 Numbers in italics indicate a scenario where separation distance is sufficient to reduce admixture in maize cultivation below different threshold levels (1.5%, 0.9%, 0.5% and 0.3%).<br />
Square brackets denote that the upper limit is included in the interval.<br />
are considered to be additional contributors<br />
to final adventitious presence 4,10 . Greater<br />
distances to the pollen source would be<br />
required if lower threshold levels for crossfertilization<br />
were to be considered that aim<br />
to take into account additional sources<br />
of adventitious presence. For example, a<br />
distance of 40 m is needed to keep crossfertilization<br />
below 0.5% with a probability<br />
higher than 90% (94.1%).<br />
An analysis of the data in Table 1 also<br />
allows the effects of a hypothetical increase<br />
in the EU mandatory labeling threshold on<br />
segregation practices in maize cultivation to<br />
be estimated (countries such as Japan allow<br />
as much as 5% tolerance). For example, a<br />
20 m separation distance would be sufficient<br />
to achieve a desired threshold level of 1.5%<br />
(with a probability of 91.19%). When using<br />
a nonparametric approach (bootstrapping<br />
simulation) results were quite similar to<br />
those obtained for the gamma distributions<br />
(Supplementary Table 4).<br />
The results presented here (Table 1)<br />
clearly show that some of the current<br />
mandatory separation distances proposed<br />
by several EU countries for maize<br />
segregation (Supplementary Table 1) are<br />
disproportionate. They are set too high to the<br />
objective of keeping cross-fertilization below<br />
the legal threshold level in real agricultural<br />
landscapes. Our results are robust because<br />
the experimental data set considered<br />
represents several climatic conditions,<br />
field sizes and locations in Europe. A<br />
previous study by Sanvido et al. 5 looking at<br />
separation distances in Switzerland came<br />
to similar conclusions. Also, the levels of<br />
nature biotechnology volume 28 number 8 AUGUST 2010 781
correspondence<br />
© 2010 <strong>Nature</strong> America, Inc. All rights reserved.<br />
cross-fertilization recorded in our database<br />
correspond to individual data points in<br />
receptor fields at several distances. Because<br />
most of the field points sampled were located<br />
at short distances from the donor field, crossfertilization<br />
rates at these distances were<br />
likely to be higher than cross-fertilization<br />
rates computed for an entire field harvested.<br />
In an agricultural context, harvest always<br />
represents a mixture of different harvested<br />
areas. The actual GM content in the harvest<br />
is thereby often substantially reduced<br />
because zones with higher cross-fertilization<br />
rates at the field margin are mixed with<br />
zones with lower GM content further within<br />
the receptor field. Studies performed in real<br />
agricultural landscapes with commercial<br />
cultivation of GM and non-GM maize point<br />
to distances over 20 m as being sufficient to<br />
prevent cross-fertilization below a threshold<br />
level of 0.9% 11,12 .<br />
In practice, large mandatory distances<br />
restrict farmers’ freedom of choice to grow<br />
GM maize in certain agricultural landscapes<br />
(especially in those with substantial presence<br />
of maize cultivation in small and scattered<br />
fields). This imposes important opportunity<br />
costs on farmers, reducing the potential net<br />
gains in farmers’ gross margins derived from<br />
Bt maize cultivation 13 .<br />
In conclusion, we have shown that a<br />
separation distance of 40 m is sufficient to<br />
reduce admixture in maize cultivation below<br />
the legal threshold of 0.9%. However, this<br />
is not an endorsement of using separation<br />
distances as the single tool to regulate coexistence<br />
in maize production. Numerous<br />
recent studies have pointed to the need for<br />
flexibility in co-existence measures 4,14,15 .<br />
Pollen barriers consisting of non-GM<br />
maize, for example, have proven to reduce<br />
cross-fertilization rates more effectively<br />
than an isolation of the same distance with<br />
open ground or low-growing crops. With<br />
a maize barrier of 10–20 m, the remaining<br />
maize harvest in the field rarely exceeds the<br />
threshold of 0.9% GM material 11 . Buffer<br />
zones, discard zones and other measures<br />
could therefore be combined or substitute for<br />
large, fixed-separation distances in search of<br />
a system that increases the real options for<br />
farmers to cultivate their crop of choice 1 .<br />
Note: Supplementary information is available on the<br />
<strong>Nature</strong> Biotechnology website.<br />
Disclaimer<br />
The views expressed are purely those of the authors<br />
and may not in any circumstances be regarded<br />
as stating an official position of the European<br />
Commission.<br />
ACKNOWLEDGMENTS<br />
The authors thank M. Czarnak-Klos for help in<br />
the interpretation of the data sets of maize crossfertilization<br />
trials that constitute the database of this<br />
analysis and J. Delincé for his useful comments on<br />
statistical simulation. The authors wish to express<br />
thanks to G. Squire, as coordinator of the gene flow<br />
and ecological field studies of the SIGMEA project,<br />
for providing SIGMEA data sets on maize crossfertilization<br />
trials. Within the SIGMEA partners, many<br />
thanks are extended to R. Wilhelm for providing data<br />
under German agricultural conditions, A. Vogler for<br />
Swiss data and J. Messeguer for data from Spain.<br />
COMPETING FINANCIAL INTERESTS<br />
The authors declare no competing financial interests.<br />
Laura Riesgo 1 , Francisco J Areal 1 ,<br />
Olivier Sanvido 2 & Emilio Rodríguez-Cerezo 1<br />
1 European Commission, Joint Research Centre<br />
(JRC), Institute for Prospective Technological<br />
Studies (IPTS), Edificio Expo, Avda. Inca<br />
Garcilaso, Seville, Spain. 2 Agroscope Reckenholz<br />
Tänikon Research Station ART., Zurich,<br />
Switzerland.<br />
e-mail: laura.riesgo@ec.europa.eu<br />
1. Devos, Y., Demont, M. & Sanvido, O. Nat. Biotechnol.<br />
26, 1223–1225 (2008).<br />
2. Moschini, G. Eur. Rev. Agric. Econ. 35, 331–355<br />
(2008).<br />
3. Ryffel, G.U. Nat. Biotechnol. 28, 318 (2010).<br />
4. Devos, Y. et al. Agron. Sustain. Dev. 29, 11–30<br />
(2009).<br />
5. Sanvido, O. et al. Transgenic Res. 17, 317–335<br />
(2008).<br />
6. European Commission. Commission Staff Working<br />
Document: Report from the Commission to the Council<br />
and the European Parliament on the Coexistence of<br />
Genetically Modified Crops with Conventional and<br />
Organic Farming. Implementation of National Measures<br />
on the Coexistence of GM crops with Conventional<br />
and Organic Farming. (Commission of the European<br />
Communities, Brussels, 2009). <br />
7. Pla, M. et al. Transgenic Res. 15, 219–228 (2006).<br />
8. Goggi, A.S. et al. Field Crops Res. 99, 147–157<br />
(2006).<br />
9. Vogler, A., Eisenbeiss, H., Aulinger-Leipner, I. &<br />
Stamp, P. Eur. J. Agron. 31, 99–102 (2009).<br />
10. Demeke, T., Perry, D.J. & Scowcroft, W.R. Can. J. Plant<br />
Sci. 86, 1–23 (2006).<br />
11. Messeguer, J. et al. Plant Biotechnol. J. 4, 633–645<br />
(2006).<br />
12. Gustafson, D.I. et al. Crop Sci. 46, 2133–2140<br />
(2006).<br />
13. Gómez-Barbero, M., Berbel, J. & Rodríguez-Cerezo, E.<br />
Nat. Biotechnol. 26, 384–386 (2008).<br />
14. Demont, M. & Devos, Y. Trends Biotechnol. 26, 353–<br />
358 (2008).<br />
15. Messéan, A. et al. Oleagineux 16, 37–51 (2009).<br />
782 volume 28 number 8 AUGUST 2010 nature biotechnology
case study<br />
commentary<br />
India’s billion dollar biotech<br />
Justin Chakma, Hassan Masum, Kumar Perampaladas, Jennifer Heys & Peter A Singer<br />
By focusing on an unmet medical need, providing a cost-efficient solution and reinvesting the resulting revenues into<br />
R&D and state-of-the-art manufacturing, Shantha Biotechnics was able to build one of India’s first biotech successes.<br />
© 2010 <strong>Nature</strong> America, Inc. All rights reserved.<br />
Shantha Biotechnics, an Indian biotech firm started by K. I. Varaprasad<br />
Reddy with $1.2 million of angel funds, was acquired last year by<br />
Sanofi-Aventis of Paris for €571 million. Since developing a copy of the<br />
hepatitis B surface antigen subunit vaccine—one of the first recombinant<br />
products to be ‘home grown’ in India—Shantha has been on a tear,<br />
bringing 11 products to market. Much of the company’s success can be<br />
attributed to the vision of its management, which brought its first product<br />
to market in only four years, reinvested revenues into internal R&D and<br />
built a state-of-the art manufacturing capability. This not only enhanced<br />
the company’s ability to address local health needs, but also built its global<br />
reputation—all of which has subsequently proved good business. 1<br />
After attending a conference in 1992, Varaprasad, an electrical engineer<br />
by training, recognized the urgent need for an inexpensive Indian<br />
hepatitis B vaccine; over 100,000 Indians die every year from the viral<br />
infection, with 4% of the population carriers. Prices were as high as $23<br />
a dose with primary suppliers being Merck and SmithKlineBeecham<br />
(now part of GlaxoSmithKline). With most Indian families living on<br />
$1 a day, with multiple children and three doses required per child,<br />
vaccination was simply unaffordable. Varaprasad saw the possibility of<br />
a local venture that could supply an affordable version.<br />
After recruiting local talent and two expatriate scientists in 1993 (see<br />
Supplementary Tables), the company took only four years to develop<br />
and register Shanvac-B, a version of the vaccine produced in Pichia pastoris.<br />
Shanvac-B was launched at $1 a dose and was an immediate success.<br />
Indian consumption of hepatitis B vaccine rose from a few hundred<br />
thousand doses in the early 1990s to tens of millions today with prices<br />
dropping as low as $0.25.<br />
Rapid uptake of the vaccine was partly helped by a confidential partnership<br />
with a large pharmaceutical multinational, which provided<br />
manufacturing/regulatory acumen and also resold the vaccine. Shantha<br />
followed Shanvac-B with Shanferon (interferon alpha 2b), which it also<br />
produced in P. pastoris. The company’s development of a purification<br />
process compliant with International Conference on Harmonization<br />
regulations led it to become the first Indian company to have a hepatitis<br />
B vaccine prequalified by the World Health Organization (WHO;<br />
Geneva). The initial investment in quality control helped accelerate<br />
approval for its other products.<br />
The company’s growing reputation for manufacturing excellence and<br />
regulatory expertise in recombinant vaccines also helped to secure business<br />
from entities in other developing countries, such as the International<br />
Vaccine Institute (IVI; South Korea) for low-cost oral cholera vaccine,<br />
and the Pediatric Dengue Vaccine Initiative (South Korea).<br />
This success led to international attention in 2006 when Mérieux<br />
Alliance (Paris, France) acquired a 60% stake in Shantha after its Omani<br />
investors sought an exit. The acquisition further bolstered Shantha’s<br />
reputation internationally as well as opening new markets. In 2009, the<br />
firm was awarded a $340 million United Nations International Children’s<br />
The authors are at the McLaughlin-Rotman Centre for Global Health,<br />
University Health Network and University of Toronto, Toronto,<br />
ON, Canada.<br />
e-mail: peter.singer@mrcglobal.org<br />
Emergency Fund (UNICEF) contract for pentavalent vaccines from<br />
2010–2012. Soon after, rumors emerged that multinationals were interested<br />
in bidding on Shantha, ultimately culminating in the takeover by<br />
Sanofi-Aventis the same year.<br />
The case of Shantha shows developing world biotech innovators can<br />
maintain a balance between local health impact and financial returns by<br />
keeping four principles in mind. First, identify therapeutic areas where<br />
cost efficiencies can be achieved locally and combine this with strong<br />
leadership skills. Varaprasad leveraged India’s homegrown scientists,<br />
lower labor costs, process innovation and a low-margins business strategy<br />
to exploit this opportunity.<br />
Second, seek investments/partnerships from non-traditional and<br />
international sources. Shantha embraced collaborations with research<br />
institutes such as the US National Institutes of Health (Bethesda, MD),<br />
and with competing multinationals for regulatory guidance.<br />
Third, focus on innovation and reinvestment. By plowing back significant<br />
profits toward R&D, Shantha has recently released new products<br />
every year or two. This initial focus on process and quality innovation<br />
may have delayed Shanvac-B’s launch, but it allowed Shantha to become<br />
the first WHO-prequalified Indian firm for hepatitis B vaccine, and<br />
opened the door to large international contracts, including contract<br />
research. However, experience with Shanferon suggested that India’s<br />
regulatory environment had challenges in conducting complex clinical<br />
trials. Other innovators in developing countries should not insist upon<br />
home-grown manufacturing or clinical trials if it entails compromise on<br />
quality for the sake of patriotism.<br />
Finally, Shantha shows integrated business models are viable in<br />
developing countries. Pre-acquisition, Shantha would not invest in<br />
any products for which it did not have internal capacity to execute<br />
on a significant part of the project. This contrasts with the developed<br />
world, where it is becoming increasingly popular to develop a<br />
‘virtual’ business model, whereby clinical trials and even early stage<br />
work is outsourced to contract research organizations. Shantha shows<br />
the virtual model may not make sense for an innovative biotech in<br />
a developing country because the risks of low quality and delays<br />
in outsourcing are too great. By maintaining internal development<br />
capabilities, Shantha and other developing country firms can also<br />
capitalize on earnings generated by contract research work for other<br />
companies.<br />
By combining cost-efficiency with focused R&D, biotech firms like<br />
Shantha are creating a new source of innovation for global health.<br />
Funding<br />
This work was funded by a grant from the Bill & Melinda Gates<br />
Foundation through the Grand Challenges in Global Health Initiative.<br />
Note: Supplementary information is available on the <strong>Nature</strong> Biotechnology website.<br />
Competing Financial Interests<br />
The authors declare competing financial interests: details accompany the full-text<br />
HTML version of the paper at http://www.nature.com/naturebiotechnology/.<br />
1. Prahalad, CK. The Fortune at the Bottom of the Pyramid: Eradicating Poverty through<br />
Profits. (Wharton School Publishing, Philadelphia; 2004).<br />
nature biotechnology volume 28 number 8 august 2010 783
commentary<br />
DNA patents and diagnostics: not a<br />
pretty picture<br />
Julia Carbone, E Richard Gold, Bhaven Sampat, Subhashini Chandrasekharan, Lori Knowles, Misha Angrist &<br />
Robert Cook-Deegan<br />
© 2010 <strong>Nature</strong> America, Inc. All rights reserved.<br />
Restrictive licensing practices on DNA patents are stymieing clinical access and research on genetic diagnostic testing.<br />
Diagnostic companies, university tech transfer offices and their respective associations need to pay more attention.<br />
Four decades after the US Supreme Court first<br />
held that an artificially created bacterium<br />
had the potential to be patented in the United<br />
States 1 , biotech patents continue to generate<br />
controversy—particularly human gene patents<br />
used in diagnostic testing. The persistence of the<br />
debate can be attributed to particular business<br />
models for genetic testing and university licensing<br />
that, despite public pronouncements to the<br />
contrary, have failed to acknowledge and appropriately<br />
address the real social and economic<br />
concerns raised by clinical geneticists, health<br />
care professionals, patient groups, politicians<br />
and academics. Their failure has led both policymakers<br />
and the courts to express increasing<br />
concern about broad patent rights over human<br />
genes that affect diagnostic testing.<br />
The most recent flare-up in the ongoing<br />
DNA patent and genetic testing debate is<br />
Julia Carbone is at Duke University’s School of<br />
Law, Durham, North Carolina, USA; E. Richard<br />
Gold is at McGill University’s Faculty of Law<br />
and Faculty of Medicine, Montreal, Québec,<br />
Canada; Bhaven Sampat is at Columbia<br />
University’s Department of Health Policy and<br />
Management, New York, NY, USA; Subhashini<br />
Chandrasekharan is at Duke University’s Center<br />
for Genome Ethics, Law & Policy, Institute for<br />
Genome Sciences and Policy, Durham, NC, USA;<br />
Lori Knowles is at the University of Alberta’s<br />
Health Law Institute, Edmonton, Alberta,<br />
Canada; Misha Angrist is at Duke University’s<br />
Institute for Genome Sciences & Policy, Durham,<br />
NC, USA; and Robert Cook-Deegan is at Duke<br />
University’s Center for Genome Ethics, Law &<br />
Policy, Institute for Genome Sciences and Policy,<br />
Durham, NC, USA.<br />
e-mail: Robert Cook-Deegan: bob.cd@duke.edu<br />
Myriad Genetics has been the poster child for controversial DNA patent licensing.<br />
the decision of the US District Court for the<br />
Southern District of New York in Association<br />
for Molecular Pathology et al. v. United States<br />
Patent and Trademark Office et al. 2 . On 29<br />
March, US Federal District Court Judge<br />
Robert Sweet ruled that isolated DNA is not<br />
patentable in the United States, and also that<br />
Myriad Genetics’ (Salt Lake City, UT, USA)<br />
method claims relevant to testing for BRCA1<br />
and BRCA2 genes are invalid. Essentially,<br />
the District Court held that neither isolated<br />
DNA nor cDNA is sufficiently different from<br />
DNA as it occurs within host cells to be considered<br />
an invention. As for the diagnostic<br />
tests, the court held that they simply involved<br />
drawing a mental correlation between facts,<br />
something that does not fall within the scope<br />
of what is patentable.<br />
A week earlier, the US Court of Appeals<br />
for the Federal Circuit held in Ariad<br />
Pharmaceuticals, Inc. et al. v. Eli Lilly and<br />
Company 3 that a researcher must do more than<br />
identify that a class of compounds has a certain<br />
effect: he or she must actually describe what<br />
those compounds are. This effectively eliminated<br />
the award of patents over basic research,<br />
requiring, instead, that the inventor “actually<br />
perform the difficult work of ‘invention’—that<br />
is, conceive of the complete and final invention<br />
with all its claimed limitations—and disclose<br />
the fruits of that effort to the public.”<br />
One month before that, on 10 February, the<br />
Secretary’s Advisory Committee on Genetics,<br />
Health and Society (SACGHS; Bethesda,<br />
MD, USA) at the US Department of Health<br />
and Human Services 4 , after a careful study<br />
of current knowledge on the effects of patenting<br />
genes on research and accessibility to<br />
genetic tests, found that there is no convincing<br />
evidence that patents either facilitate or<br />
accelerate the development and accessibility<br />
of such tests. What’s more, the committee<br />
784 volume 28 number 8 august 2010 nature biotechnology
COMMENTARY<br />
© 2010 <strong>Nature</strong> America, Inc. All rights reserved.<br />
found that there was some, albeit limited,<br />
evidence that patents had a negative effect<br />
on clinical research and on the accessibility<br />
of genetic tests to patients. In addition,<br />
most gene patents relevant to diagnostics are<br />
held by universities on the basis of research<br />
funded by public money. In this context, the<br />
committee recommended that universities<br />
be more cautious in patenting and licensing<br />
human genes, that there be more transparency<br />
and accountability for university licensing<br />
practices and that an existing exception<br />
protecting medical practitioners from patent<br />
infringement when they undertake surgery or<br />
treat a patient’s body be extended to include<br />
the provision of genetic diagnostic testing.<br />
What all three developments have in common<br />
is that they reflect growing disenchantment<br />
with the patenting and licensing practices<br />
of universities and industry. These concerns<br />
have existed for over a decade without resolution<br />
5,6 . The maturity of microarray technology<br />
that allows for multi-allele genotyping and<br />
now the prospect of full-genome sequencing<br />
deepen these concerns 7 . A legacy of exclusively<br />
licensed gene patents casts a shadow of patent<br />
infringement liability over the future of multiallele<br />
testing and full-genome analysis.<br />
In an attempt to better understand why concerns<br />
about DNA patenting persist and what role<br />
universities play as patentees and often exclusive<br />
licensors, this article outlines university technology<br />
transfer practices and business models that<br />
have given rise to the concerns. After outlining<br />
the practices that have given rise to concerns<br />
about the patenting of human genes for<br />
diagnostic genetic tests, we review past efforts<br />
attempting to address concerns. We then lay out<br />
the obstacles to addressing these concerns going<br />
forward, including a lack of recognition that<br />
diagnostics is a highly unusual market—and<br />
that the problem is not so much a legal question<br />
or necessarily about what gets patented, so much<br />
as how patents are licensed and enforced by both<br />
universities and industry. The ability to change<br />
these restrictive licensing practices, will, in turn,<br />
depend on several factors: first, a sharper definition<br />
of what constitutes research that needs<br />
to be protected in licensing provisions; second,<br />
more coherent university policies that promote<br />
broad dissemination, along with incentives for<br />
industry compliance with best practices; third,<br />
greater recognition of problems and the proposal<br />
of constructive solutions by key players;<br />
fourth, transparent reporting of DNA patents<br />
and diagnostic testing license agreements; and<br />
fifth, secure funding for technology transfer<br />
offices. Although legislative change may ultimately<br />
be necessary to facilitate these changes<br />
in practice, many problems can be addressed<br />
without statutory change.<br />
A legacy of short-sighted tech transfer<br />
and business practices<br />
Currently, universities frequently file patents<br />
on early-stage inventions 9 , and license patents<br />
exclusively half the time 10–13 . A study by<br />
Mowery et al. 10 notes the following: “A relatively<br />
high fraction of all inventions that are<br />
licensed—as high as 90% for UC [University<br />
of California] licenses and no less than 58.8%<br />
for Stanford licenses of ‘all technologies’ during<br />
this period—is licensed on a relatively exclusive<br />
basis, and these shares are similar for biomedical<br />
inventions.” Many of those licenses will endure<br />
for many years, including licenses on university<br />
patents relevant to DNA diagnostics.<br />
Universities and academic medical centers<br />
that provide diagnostic testing services face<br />
private genetic testing companies that enforce<br />
patents against university genetic testing services<br />
and national reference laboratories 5 —in<br />
contrast to the situation for therapeutics, where<br />
universities are often the plaintiffs. The story<br />
often begins with publicly funded academic<br />
or nonprofit research that is either patented<br />
and licensed exclusively to a private company<br />
or forms the basis for a spin-off company that<br />
attracts further investment and develops an<br />
invention that is patented. Whether exclusive<br />
licensees or spin-offs, these companies then<br />
develop genetic testing services based on a<br />
business model that relies not only on patenting<br />
sequences and mutations—not objectionable<br />
in itself—but also on preventing other<br />
institutions, including universities from offering<br />
those genetic tests.<br />
The case of Myriad patents over BRCA1,<br />
BRCA2 and methods for diagnostic testing<br />
14 , as well as Athena Diagnostics’ exclusive<br />
licenses for clinical testing from Duke<br />
University (Durham, NC, USA) over three<br />
method patents related to diagnostic testing<br />
for Alzheimer’s disease 15,16 , exemplify these<br />
practices and business models.<br />
Furthermore, other neurological and metabolic<br />
conditions, as well as other entities’ screening<br />
for Canavan disease, hemochromatosis and<br />
other single-gene conditions, has also generated<br />
fierce debate. In the case of Canavan testing,<br />
litigation resulted from licensing restrictions<br />
that inhibited freedom of action among those<br />
seeking to get genetic tests.<br />
In the case of Myriad, initial research took<br />
place at the University of Utah—with public<br />
funding from the US National Institutes<br />
of Health (NIH; Bethesda, MD, USA).<br />
The researchers then spun off Myriad,<br />
which attracted investment from Eli Lilly<br />
(Indianapolis, IN, USA) and succeeded in patenting<br />
BRCA1 and a diagnostic test for breast<br />
cancer (patents that were ultimately jointly<br />
assigned to the University of Utah, Myriad and<br />
the NIH). Rather than licensing out the test to<br />
clinical geneticists and laboratories around the<br />
world, Myriad required initial testing in each<br />
family to be performed at its laboratories in Salt<br />
Lake City. In the United States, the company<br />
sent out cease-and-desist letters to laboratories—both<br />
academic and commercial—already<br />
performing tests when the patent was issued.<br />
Threatened patent enforcement resulted in<br />
a backlash around the world from public laboratories,<br />
clinicians, molecular geneticists and<br />
some patient groups—against both the patenting<br />
of human genes and what they viewed<br />
as Myriad’s strong-arm tactics. These groups<br />
feared that by closing down public laboratories,<br />
Myriad would thwart research identifying<br />
weaknesses in Myriad’s test or distinguishing<br />
the effects of different mutations in the genes<br />
on disease severity or progression, and prevent<br />
the integration of breast and ovarian cancer<br />
genetic tests into genetic health services.<br />
Although some of these fears were clearly<br />
exaggerated, Myriad’s aggressive initial patent<br />
enforcement affected practice in the clinical<br />
genetics community and stirred long-standing<br />
resentment. Furthermore, in countries with<br />
public health care systems, health administrators<br />
objected to Myriad’s business model<br />
because it removed their ability to deploy<br />
genetic tests to their citizens in the manner<br />
that they viewed as most efficient 14 .<br />
Myriad always permitted what it considered<br />
to be basic research on BRCA1 and BRCA2, and<br />
also engaged in research collaborations. In fact,<br />
until 2004—after which Myriad ceased to do so<br />
for unknown reasons—the company contributed<br />
data to public databases. To illustrate Myriad’s<br />
openness to others performing basic research<br />
using BRCA1 and BRCA2, the company’s president,<br />
Greg Critchfield, has identified 7,000<br />
papers published by independent authors that<br />
mention BRCA1 or BRCA2 (http://docs.justia.<br />
com/cases/federal/district-courts/new-york/<br />
nysdce/1:2009cv04515/345544/158/0.pdf).<br />
This indicates that, with the exception of clinical<br />
testing at the University of Pennsylvania<br />
in 1998, Myriad did not pursue those who<br />
conducted research. Myriad also defined the<br />
University of Pennsylvania’s testing as ‘commercial’,<br />
as later defined under the terms of a 1999<br />
Memorandum of Understanding with the US<br />
National Cancer Institute (NCI: Bethesda, MD,<br />
USA). Myriad has been successful in arranging<br />
for payment agreements with insurers and<br />
other payers. However, as a result of Myriad’s<br />
enforcement actions coupled with broad patent<br />
claims, its fairly narrow conception of what<br />
constituted acceptable research and its failure<br />
to clearly state that it would not pursue those<br />
conducting such research, university and private<br />
laboratories ceased to offer the test publicly<br />
nature biotechnology volume 28 number 8 august 2010 785
COMMENTARY<br />
© 2010 <strong>Nature</strong> America, Inc. All rights reserved.<br />
in the United States. Outside the United States,<br />
resistance to Myriad’s model—particularly<br />
from health care administrators and government<br />
departments—caused the company to<br />
lose most of its market. Furthermore, Myriad’s<br />
relationship with scientists and policymakers<br />
around the world was seriously damaged 14 .<br />
Although the biotech industry tried to portray<br />
Myriad as an outlier, a series of detailed<br />
case studies conducted by some of us (J.C.,<br />
S.C., M.A. and R.C.-D.) and others 15,18–24 at<br />
Duke University’s Center for Genome Ethics<br />
Law and Policy reveal that, in fact, Myriad’s<br />
business model is not unique. As these studies<br />
show, diagnostic companies such as Athena<br />
Diagnostics (Worcester, MA) and PGxHealth<br />
(New Haven, CT) have adopted similar or even<br />
more aggressive business models and have<br />
shut out university laboratories from offering<br />
genetic testing for diseases such as long-QT<br />
syndrome and Alzheimer’s disease. In the case<br />
of Alzheimer’s disease, genes and method patents<br />
for diagnostic testing were initially patented<br />
by Duke University (and other academic<br />
institutions) and licensed exclusively to Athena<br />
Diagnostics. Athena Diagnostics then used its<br />
patents aggressively to prevent others from carrying<br />
out the test.<br />
These case studies strongly suggest both that<br />
universities are often not managing research<br />
and patents in a way that promotes dissemination<br />
and that companies deploy their patents or<br />
exclusive licenses to remove genetic testing laboratories<br />
at academic health centers and lowmargin<br />
national reference laboratories from<br />
the market. This is demonstrably a viable business<br />
model, or at least it has proven to be until<br />
recently—but is it good national policy, and<br />
does it add value to the national health system?<br />
As clinicians and laboratory directors react to<br />
cease-and-desist letters by withdrawing from<br />
those activities, clinical research and genetic<br />
testing are impeded. GeneDx (Gaithersburg,<br />
MD) and university laboratories ceased testing<br />
for the life-threatening long-QT syndrome<br />
after patent enforcement in 2002, for example,<br />
but no commercial test entered the market<br />
until 2004 (ref. 9); neither the University of<br />
Utah (which held the patents) nor the NIH<br />
(which could have been petitioned to march<br />
in, given that ‘health and safety’ needs were<br />
not being met) took action. Certain tests may<br />
not be offered if the patent holder or exclusive<br />
licensee does not provide them; second-opinion<br />
and verification testing may be unavailable;<br />
and tests are costly to public and private payers,<br />
sometimes prohibitively so for those lacking<br />
insurance 25,26 . Although negative effects on<br />
price and access to genetic testing are not uniform,<br />
consistent or pervasive, one cannot read<br />
the case studies as a whole without realizing<br />
there are real problems—and also that there are<br />
relatively easy solutions modeled on nonexclusive<br />
licensing, as used for Huntington’s disease<br />
and cystic fibrosis testing. Gene patents over<br />
diagnostics are not just like all other patents,<br />
and the diagnostic market is not just like markets<br />
for therapeutics and instruments. Holders<br />
of gene patents need to take care in licensing<br />
them for diagnostic use.<br />
Hurdles to resolution of concerns<br />
The past decade saw a plethora of policy<br />
reports about DNA patents, such as those from<br />
the Nuffield Council on Bioethics 17 , the US<br />
National Academy of Sciences 27 , the Ontario<br />
Ministry of Health 28 and the Australian Law<br />
Reform Commission 29 . Academic articles<br />
examined the concerns, the extent to which<br />
concerns were founded and the roles of<br />
industry, universities and legislative reform<br />
in addressing these concerns 5,6,26,30–38 . Some<br />
countries also made statutory changes to their<br />
patent and health laws. France expanded compulsory<br />
licensing laws 39 , and Belgium did the<br />
same, also carving out a diagnostic-use exemption<br />
from patent-infringement liability 40 . The<br />
In addition to evidence that gene<br />
patents covering diagnostics do<br />
not necessarily impede research,<br />
there is very little evidence of<br />
patent litigation in the field.<br />
US Patent and Trademark Office (USPTO;<br />
Washington, DC) developed guidelines on<br />
‘utility’ and ‘written description’ specifically<br />
for examining gene patent applications 41 .<br />
Recognizing that many of the concerns<br />
could be addressed through better licensing<br />
practices, many institutions also developed<br />
licensing guidelines, some aimed at universities<br />
and others at industry. These include<br />
the NIH’s Best Practices for the Licensing of<br />
Genomic Inventions 42 , the Organisation for<br />
Economic Cooperation and Development’s<br />
(OECD; Paris) Guidelines for Licensing of<br />
Genetic Inventions 43 and In the Public Interest:<br />
Nine Points to Consider in Licensing University<br />
Technology 44 , a document crafted by 12 institutions<br />
and subsequently endorsed by the Board<br />
of Trustees of the Association of University<br />
Technology Managers (AUTM; Deerfield, IL,<br />
USA). Since then, ~50 other institutions and<br />
organizations have also endorsed the guidelines.<br />
In November 2009, as part of AUTM’s<br />
Global Health Initiative to promote licensing<br />
practices that facilitate access to essential<br />
medicines in developing countries, AUTM<br />
also endorsed a document entitled University<br />
Principles on Global Access to Medicines 45 .<br />
Most recently, the SACGHS recommended<br />
the implementation of an exception to patentinfringement<br />
liability for research use and<br />
diagnostic testing 4 . All of these reports and recommendations<br />
focus on broad dissemination<br />
through nonexclusive licensing of gene-based<br />
inventions, particularly for publicly funded<br />
research. They reserve exclusive licensing<br />
for situations in which it is needed to induce<br />
investment in private-sector development to<br />
bring a product or service to fruition—which,<br />
as will later be discussed, is rarely the case for<br />
genetic diagnostics.<br />
Despite the plethora of policy reports,<br />
academic articles, guidelines and legislative<br />
changes, concerns about DNA patents persist.<br />
We must therefore turn our attention to factors<br />
that impede changing the system.<br />
A question of law or of practice. The first<br />
response to concerns is often a call to change<br />
patent law 39,46,47 . As recent research indicates,<br />
however, the central problem does not lie with<br />
patents over human genes themselves so long as<br />
the law incorporates the appropriate checks and<br />
balances. The recent suit challenging Myriad’s<br />
patents on BRCA genes notwithstanding 2 , the<br />
following discussion indicates that there is little<br />
evidence on which to conclude that limiting<br />
the ability to patent genes is the only way to<br />
solve the problems in the system.<br />
A recent study by Huys et al. 48 from Belgium<br />
suggests that relatively few claims in gene patents<br />
block competing laboratories from providing<br />
genetic tests. This study of 145 active patent<br />
documents (267 independent claims) related to<br />
genetic diagnostic testing of 22 inherited diseases<br />
(including method claims, gene claims,<br />
oligo claims and kit claims) that the European<br />
Patent Office (Munich, Germany) and the<br />
USPTO issued. It concluded that clinicians<br />
could easily get around 36% of claims and<br />
could, with work, circumvent another 49% of<br />
claims. Only 15% of claims would be difficult<br />
or impossible to circumvent. Of the gene claims<br />
studied, only 3% were found to be blocking.<br />
However, as discussed below, blocking claims<br />
were more prevalent among method claims.<br />
In addition to evidence that gene patents<br />
covering diagnostics do not necessarily impede<br />
research, there is very little evidence of patent<br />
litigation in the field. A recent study 8 on<br />
trends in human gene patent litigation notes<br />
that there is rarely any litigation over diagnostic<br />
tests arising from gene patents. This study<br />
identified only 31 examples of litigation over<br />
human genes in the United States from 1987 to<br />
2008. Although the low frequency of litigation<br />
786 volume 28 number 8 august 2010 nature biotechnology
COMMENTARY<br />
© 2010 <strong>Nature</strong> America, Inc. All rights reserved.<br />
could hypothetically support the conclusion<br />
that patents successfully exclude others (that<br />
is, threatened patent enforcement stops potentially<br />
infringing activities), an examination of<br />
patent claims suggests that most patents over<br />
human genes and related diagnostic tests find<br />
themselves in a relatively weak legal position.<br />
This weak legal position is further reinforced<br />
by the dissent in Laboratory Corp. of America<br />
Holdings v. Metabolite Laboratories, Inc. 49 ,<br />
which concluded that a natural correlation<br />
between two substances in the body was an<br />
unpatentable product of nature (the majority<br />
decided not to address the issue); by the United<br />
States District Court decision in Association for<br />
Molecular Pathology et al. v. the United States<br />
Patent and Trademark Office et al.; and by the<br />
general trajectory of recent decisions on assessing<br />
damages, the lack of automatic injunctive<br />
relief (eBay Inc v. MercExchange, L.L.C. 50 ), as<br />
well as by the increasing ambit for finding an<br />
invention to be obvious under patent law. The<br />
recent US Supreme Court decision In re Bilski 51<br />
only exasperates the uncertainty over method<br />
claims on DNA diagnostics. In fact, an eventual<br />
appeal from the District Court decision<br />
in Association for Molecular Pathology et al. v.<br />
the United States Patent and Trademark Office<br />
et al. may be required to determine whether<br />
these type of claims are valid.<br />
Adding to the trend in legal thinking is the<br />
Federal Circuit’s decision in Ariad, relating to<br />
claims based on DNA patents, where the court<br />
writes: “Much university research relates to<br />
basic research, including research into scientific<br />
principles and mechanisms of action…,<br />
and universities may not have the resources<br />
or inclination to work out the practical implications<br />
of all such research [i.e., finding and<br />
identifying compounds able to affect the mechanism<br />
discovered]. That is no failure of the law’s<br />
interpretation, but its intention. Patents are not<br />
awarded for academic theories, no matter how<br />
groundbreaking or necessary to the later patentable<br />
inventions of others.”<br />
That research hypotheses do not qualify for<br />
patent protection possibly results in some loss<br />
of incentive, although Ariad presents no evidence<br />
of any discernable impact on the pace of<br />
innovation or the number of patents obtained<br />
by universities. But claims to research plans<br />
also impose costs on downstream research,<br />
discouraging later invention.” Taken together,<br />
these studies and cases indicate that gene patents<br />
per se have closed off far less of the research<br />
landscape than is often supposed, and where<br />
expansive claims have been granted, many are<br />
vulnerable to challenge.<br />
Method claims in patents related to diagnostic<br />
testing, however, bear special mention.<br />
Although many pharmaceutical patents claim<br />
products as chemical entities, universities and<br />
biotech firms also tend to patent ways of using<br />
knowledge, including method patents that<br />
affect genetic tests. In fact, Huys et al. 48 conclude<br />
that 30% of method claims relating to<br />
genetic testing are difficult, if not impossible,<br />
to circumvent. Such claims tend to be broad,<br />
often to the point of vagueness, and many cover<br />
all conceivable ways to conduct genetic tests on<br />
a gene or for a clinical condition. In the 15 of<br />
22 conditions that Huys et al. 48 found had at<br />
least one blocking claim, most such claims were<br />
to methods. In the diagnostic realm, blocking<br />
patents thus appear to be common, present in<br />
68% of the clinical conditions studied. Changes<br />
in jurisprudence could reduce the number of<br />
truly blocking patents in genetic diagnostics.<br />
Recent and pending court decisions suggest<br />
that some fraction of broad claims in US<br />
patents on DNA sequences and methods pertinent<br />
to genetic diagnostics would be judged<br />
invalid if challenged. Although dealing with<br />
a patent claim in the information technology<br />
field, the recent US Court of Appeals for the<br />
Federal Circuit decision in In re Bilski narrowed<br />
criteria for patents on methods to inventions<br />
that entail a transformative step or involvement<br />
of a particular machine. Depending<br />
on how the Federal Circuit deals with the US<br />
Supreme Court in Bilski—perhaps in an appeal<br />
in the Myriad case—it could signal that broad<br />
method claims in DNA diagnostics might be<br />
held invalid because the link between a mutation<br />
and a probability of contracting a disease<br />
may be considered unpatentable. As it stands,<br />
many broad method claims pertinent to DNA<br />
diagnostics suffer under a cloud of uncertainty<br />
and may turn out to be invalid, thus dramatically<br />
increasing freedom to operate without fear of<br />
patent-infringement liability. Other recent US<br />
court decisions have moved in the same direction,<br />
increasing the stringency of criteria for<br />
nonobviousness 52,53 and written description 3 .<br />
Taken as a group, these decisions suggest<br />
that some of the potential obstacles to innovation<br />
that patents cause in diagnostics may not<br />
be as high, nor the amount of intellectual territory<br />
enclosed and enforced as expansive, as<br />
some had feared. A clear research exemption,<br />
a simplified method for challenging patents<br />
(for example, opposition proceedings or inter<br />
partes re-examination requests) and improved<br />
examination procedures to avoid overly broad<br />
patent claims could help quell concerns over<br />
blocked research and overly broad patents 54 .<br />
Overall, the problem does not lie wholly in<br />
patent law but rather concerns how decisions<br />
are made about what is patented (methods<br />
versus products) and how patents are managed<br />
and used. With one or a few successful<br />
challenges to broad patents enforced for<br />
diagnostic purposes, the business models of<br />
enforcing monopolies on genetic testing for<br />
specific conditions would probably give way<br />
to more cross-licensing, more competition and<br />
faster innovation in testing methods.<br />
A need for changes in patent licensing practices<br />
at universities. As patent law evolves,<br />
it is increasingly apparent that the exclusive<br />
licensing strategies of universities and the<br />
business models of a few companies doing<br />
DNA diagnostics are as much, or even more,<br />
of an impediment to DNA diagnostics as any<br />
problems with the law. Meanwhile, no evidence<br />
suggests that exclusive licensing is as<br />
important in the field of diagnostic testing as<br />
in therapeutics in creating products that would<br />
not otherwise exist. The exclusive licenses over<br />
erythropoietin, growth hormone, interferon<br />
and other therapeutic proteins are of commercial<br />
significance, as illustrated by the fact<br />
that eleven legal cases that presume the validity<br />
of gene patents have been decided by the<br />
US Court of Appeals for the Federal Circuit 8 .<br />
The same cannot be said for diagnostic testing:<br />
no exclusive license in this field has been<br />
deemed to be of such importance for anyone<br />
to take to court. In fact, most cases involving<br />
diagnostic testing are settled after initial notification<br />
letters or cease and desist letters are sent<br />
out. A handful have led to litigation, but settled<br />
early. The Federal District Court’s ruling of 29<br />
March in Association for Molecular Pathology<br />
et al. v. the United States Trademark and Patent<br />
Office is the first diagnostic case to go before a<br />
judge for a decision. Furthermore, barriers to<br />
entering the market with a new genetic test, at<br />
least for the first-generation genetic tests that<br />
search for mutations in one or a few genes, are<br />
far lower than for therapeutics. This is because<br />
for universities and national reference laboratories<br />
that already offer other genetic tests, the<br />
cost of ‘setting up’ a new genetic test based on<br />
data in scientific publications is comparable to<br />
the cost of patenting the underlying inventions<br />
since they are already laboratories approved by<br />
US regulators.<br />
Supporting this proposition is the fact that<br />
exclusive licensing does not appear to have<br />
been necessary to get a test to market in any of<br />
the cases 15,18–24 studied for SACGHS. In the<br />
study of 10 clinical conditions considered by<br />
SACGHS, three cases did not involve patent<br />
rights (i.e., there were no patents or patents<br />
were not licensed or enforced) or patents were<br />
nonexclusively licensed to multiple providers.<br />
These were cystic fibrosis, hereditary colorectal<br />
cancer and Tay-Sachs disease. Such<br />
patenting and licensing practices comply with<br />
current guidelines. In six cases, however, exclusive<br />
licensing led to patent enforcement that<br />
nature biotechnology volume 28 number 8 august 2010 787
COMMENTARY<br />
© 2010 <strong>Nature</strong> America, Inc. All rights reserved.<br />
Defining what qualifies as research. Although<br />
most industries tolerate a broad range of<br />
research activities and most researchers<br />
ignore patents when deciding whether to do<br />
research 55 , such blithe ignorance is not an obvious<br />
option in human genetic diagnostics, where<br />
threatened enforcement is common, laboratory<br />
directors and clinicians tend to respond to<br />
threatened enforcement by ceasing the activities<br />
under threat and workaround in the case<br />
of method patents are not always available 48 .<br />
Norms over what research is to be tolerated<br />
are unsettled, despite the existence of research<br />
exceptions 56 in many national laws (including<br />
an exemption in the United States for research<br />
into products that may eventually lead to the<br />
filing of an application with the US Food and<br />
Drug Administration (Rockville, MD) 57 ).<br />
One prominent example of disputed norms<br />
is the controversy between Myriad and the<br />
University of Pennsylvania Genetic Diagnostic<br />
Laboratory (GDL; Philadelphia, PA). Although<br />
Myriad states that it is generally supportive of<br />
research, it nevertheless sent GDL a cease-andreduced<br />
availability of genetic tests already<br />
being offered: HFE (hemochromatosis), APOE,<br />
Alzheimer’s disease and genes associated with<br />
Canavan disease, long-QT syndrome, hearing<br />
loss and spinocerebellar ataxias. Because tests<br />
were already available, exclusive licensing in<br />
these cases deviates from the norms that technology<br />
licensing offices generally claim to<br />
be following. In some cases, but not all, this<br />
led, at least transiently, to genetic testing by<br />
a single provider, and that exclusive license<br />
holder then eliminated other testing services<br />
that had beaten it to market. In all cases except<br />
hemochromatosis, exclusive licenses from universities<br />
were involved. Although the exclusive<br />
licensee may ultimately have developed a better<br />
test, in no case was the exclusive licensee the<br />
first to market. The tenth clinical condition<br />
studied by the SACGHS, hearing impairment,<br />
is subject to a hybrid of exclusive and nonexclusive<br />
licensing, and entails many genes and<br />
different means of testing. This case does have<br />
some examples of controversial patent enforcement<br />
action, but tests are generally widely<br />
available from several vendors.<br />
Patent incentives may induce investment<br />
in genetic diagnostics, but in none of the case<br />
studies did this lead to new availability of a test<br />
that was not already available, at least in part.<br />
This is in stark contrast with the role of patents<br />
in therapeutics and scientific-instrument<br />
development, where the benefits attributable<br />
to private R&D and new products are much<br />
clearer. The SACGHS case studies thus reinforce<br />
the benefits of licensing nonexclusively<br />
for genetic diagnostics, unless an unusual<br />
situation arises in which exclusivity is needed<br />
to get a product to market for the first time.<br />
The cases also highlight deviations from the<br />
NIH Best Practices 43 , OECD Guidelines 43 and<br />
the AUTM-endorsed Nine Points 44 . Exclusive<br />
licensing practices consistently reduce availability,<br />
at least as measured by the number of<br />
available laboratories offering a test, and thus<br />
reduce competition in genetic diagnostics, but<br />
with little evidence of a public benefit from services<br />
not otherwise available.<br />
Instead of recognizing this reality, some<br />
universities continue to seek broad patents<br />
regardless of subject matter and then<br />
license exclusively, enabling business models<br />
that impede competition in genetic testing.<br />
Although the real risk of being successfully<br />
sued for patent infringement in DNA diagnostics<br />
may be low, a 2003 survey 33 and recent<br />
case studies 14,15,18–24 indicate that laboratory<br />
directors change their testing practices and<br />
clinicians avoid research areas in reaction to<br />
cease-and-desist letters. Diagnostics are generally<br />
low-margin sources of revenue, and<br />
when faced with a threat of patent enforce-<br />
ment, most laboratories simply stop offering<br />
a genetic test, or at least no longer advertise<br />
a test’s availability publicly (in all the case<br />
studies, we learned of ‘research’ testing as an<br />
‘escape valve’ for patients who could not get<br />
or could not afford commercial genetic tests).<br />
Although part of the problem is that licenses<br />
executed over the past decade do not embody<br />
the principles of the NIH, OECD or AUTM<br />
guidelines and yet remain in force, the reality<br />
is that only a minority of universities have<br />
endorsed the consensus Nine Points 44 —with<br />
no repercussions for those who do not or those<br />
who sign and then violate the norms. Shortsighted<br />
licensing practices persist.<br />
Potential solutions<br />
Changes that could remedy problems with<br />
the current strategy of the licensing system<br />
include the following: first, a clear definition<br />
of research that should be exempt from patent-infringement<br />
liability; second, universities’<br />
leadership in promoting the alignment of tech<br />
transfer licensing practices with the univeristies’<br />
broader goal of dissemination; third, coupling<br />
of the latter with incentives to promote<br />
industry compliance and leadership by AUTM<br />
and the Biotechnology Industry Organization<br />
(BIO; Washington, DC) in recognizing problems<br />
and proposing constructive solutions;<br />
fourth, adequate funding for tech transfer<br />
offices to learn about and implement changing<br />
practices; and finally, greater transparency in<br />
reporting patent holdings and licensing agreement<br />
terms. A more detailed discussion of each<br />
of these follows.<br />
desist letter because it did not consider GDL’s<br />
activities to be research. To Myriad, GDL’s<br />
provision of testing services to researchers was<br />
commercial, not a research service 14 . GDL took<br />
the position, however, that its activities, which<br />
supported others’ research, fell within the norm<br />
of tolerated research use, and much of the contested<br />
testing was part of clinical trials funded<br />
by the NCI, which is clearly clinical research.<br />
Much debate ensued, leaving many researchers<br />
with the (wrong) impression that Myriad<br />
would not tolerate any form of research.<br />
In an attempt to establish a clear norm<br />
over the question of which activities should<br />
be considered ‘research’, Myriad entered into<br />
a Memorandum of Understanding with the<br />
NCI to provide at-cost or below-cost testing<br />
to the NCI and any researcher working under<br />
an NCI-funded project. Myriad also similarly<br />
offered to provide NIH researchers with at-cost<br />
testing, given that the NIH was a co-owner<br />
of some of the relevant patents. Importantly,<br />
the agreement with the NCI defined the type<br />
of research Myriad would tolerate as being<br />
“part of the grant supported research of an<br />
Investigator, and not in performance of a technical<br />
service for the grant supported research<br />
of another (as a core facility, for example).”<br />
Furthermore, testing services had to be paid<br />
for out of grant funds and not by a patient or<br />
by insurance. Under this definition, GDL was<br />
not conducting research. This agreement was<br />
acceptable to both parties (Myriad and the<br />
NCI), and given the ‘at-cost’ provisions and the<br />
known efficiency of Myriad in testing, perhaps<br />
it is a salutary precedent. It is worth noting,<br />
however, that the NCI did not seek to delegate<br />
its government use rights under the Bayh-Dole<br />
Act 35 U.S.C. § 200-212 (“Bayh-Dole Act”) or<br />
Stevenson-Wydler Act 15 U.S.C. 3701 (which<br />
pertain because Myriad’s patents include inventors<br />
covered by both laws).<br />
The restricted nature of the Myriad-NCI<br />
Memorandum of Understanding limits its value<br />
as a precedent. It covered only the provision<br />
of services by Myriad; it did not address the<br />
general question of which research practices a<br />
patent holder should tolerate in the diagnostics<br />
field. Some of the conflict surrounding patents<br />
and genetics laboratories could be avoided by<br />
adopting a clearer definition of ‘research’ for<br />
the purposes of incorporating licensing terms<br />
that lower the threat of patent-infringement<br />
liability. The scope of government use rights<br />
under the Bayh-Dole and Stevenson-Wylder<br />
Acts is another legal gray zone. In any case, the<br />
definition of research should not be left to the<br />
individual negotiation between one company<br />
and one NIH institute. The NIH could take on<br />
a key role in developing this norm by convening<br />
a meeting of interested parties to develop<br />
788 volume 28 number 8 august 2010 nature biotechnology
COMMENTARY<br />
© 2010 <strong>Nature</strong> America, Inc. All rights reserved.<br />
the principles by which individual actors can<br />
determine how to apply the norm.<br />
University leadership. Implementation of<br />
licensing guidelines and best practices is<br />
difficult when interests and goals are not<br />
aligned. Participants at a workshop held at<br />
Duke University in April 2009 addressed<br />
the role of universities in DNA patents and<br />
diagnostic testing and noted that those at the<br />
front line of implementing these guidelines,<br />
tech transfer offices, face many hurdles to<br />
implementation. Many university administrators<br />
view patents as a means to secure revenues<br />
(to subsequently reinvest in research)<br />
and believe that exclusive licenses generate<br />
the most revenues. Although the evidence 58<br />
is quite clear that most tech transfer offices<br />
either break even or lose money and that<br />
many of the most lucrative university patents<br />
have entailed nonexclusive licensing, this view<br />
persists. Compounding this problem, universities<br />
expect tech transfer offices to generate<br />
sufficient revenues to be sustainable. Despite<br />
usually being unrealistic, such expectations<br />
can lead these offices toward licensing strategies<br />
that promote short-term income over<br />
dissemination and broad availability.<br />
If there is to be a change of behavior, it<br />
must come from two sources: first, university<br />
administrators must align tech transfer strategy<br />
with the university mission of broad knowledge<br />
dissemination; and second, universities<br />
should provide more push-back when threatened<br />
patent enforcement gets in the way of<br />
research and impedes the university’s central<br />
mission. Regarding the first point, university<br />
presidents and senior management must take<br />
seriously the university mission to disseminate<br />
knowledge and technology. They must consider<br />
technology transfer as one component<br />
of their strategy to enable the wider world to<br />
access, enjoy and use university-generated<br />
knowledge. To achieve change, they need to<br />
change the way they fund tech transfer offices<br />
so that the latter have the freedom to explore<br />
alternatives to the way they currently license<br />
out technology. They also need to develop clear<br />
goals for dissemination and ensure that they<br />
impose measures of success for their technology<br />
licensing offices that correspond to those<br />
goals. Expecting technology licensing officers<br />
to forgo exclusive licenses when companies<br />
seek them is unrealistic unless the officers<br />
are rewarded for decisions that acknowledge<br />
the broad social benefit of avoiding patent<br />
thickets in genetic diagnostics. Recognition<br />
must also be given to the fact that these offices<br />
do not negotiate licenses in a vacuum: they<br />
negotiate largely with industry partners. If<br />
diagnostic companies are unwilling to accept<br />
nonexclusive licenses, broad research exemptions<br />
or other terms that universities propose<br />
to support research, tech transfer offices have<br />
little room to maneuver. Currently, there is no<br />
incentive—whether external or through the<br />
threatened use of government march-in rights<br />
under the Bayh-Dole Act—to curb industry<br />
behavior even when it is problematic. Tech<br />
transfer departments with limited funding,<br />
limited staff and unreasonable expectations<br />
to be sustainable cannot be expected to resist<br />
intransigence by licensees.<br />
Universities need also to take a lead in<br />
encouraging their researchers, clinicians and<br />
laboratory directors to push back when threatened<br />
with patent enforcement. University<br />
administrators need to educate themselves<br />
and their staff about the freedom to operate for<br />
purposes of research and improving diagnostic<br />
testing—that is, the scope of activities allowed<br />
that do not infringe on a valid patent. University<br />
Implementation of licensing<br />
guidelines and best practices<br />
is difficult when interests and<br />
goals are not aligned.<br />
administrators, researchers, clinicians and<br />
laboratory directors can act together by sharing<br />
cease and desist letters or other patent<br />
enforcement actions to determine whether the<br />
activities are, in fact, infringing. They can share<br />
expertise about the validity of patent claims that<br />
threaten research or clinical testing. Although<br />
individual laboratories may lack the resources<br />
to conduct these analyses, other institutions<br />
may have the requisite resources (for example,<br />
the American Society of Human Genetics, the<br />
American College of Medical Genetics, the<br />
College of American Pathologists and academic<br />
units such as the science policy research units at<br />
the University of Sussex in Brighton, UK, and<br />
the University of Leuven, Belgium).<br />
Leadership from AUTM and BIO. The<br />
development of a ‘gene patent supermarket’<br />
by Denver firm MPEG-LA is a promising<br />
step toward enabling nonexclusive licensing,<br />
increasing simplicity and consistency in licensing<br />
terms, and reducing transaction costs 59 .<br />
Unfortunately, instead of proposing such<br />
constructive solutions, BIO and AUTM have<br />
chosen not to acknowledge the real problems<br />
that exist in the unusual market for genetic<br />
diagnostics and have been quick and vociferous<br />
in their opposition to the recommendations<br />
of the SACGHS 60,61 . It is impossible to<br />
judge the full extent of the problems, but it is<br />
certainly poor policy to deny that they exist at<br />
all. Moreover, BIO and AUTM have expended<br />
time and resources opposing SACGHS recommendations<br />
while failing to enforce the<br />
established norms laid out by the NIH and the<br />
OECD, as well as the AUTM-endorsed Nine<br />
Points, among their respective constituencies.<br />
Companies and universities that violate those<br />
norms have faced no action, or even recognition<br />
that they have deviated. Indeed, there has<br />
been no public statement from either BIO or<br />
AUTM that members have been responsible for<br />
some of the problems uncovered in licensing<br />
practices for genetic diagnostics. It is reasonable<br />
to disagree with the SACGHS recommendations,<br />
but it is not reasonable to read the<br />
SACGHS report and the case studies prepared<br />
for it and conclude that the system is working<br />
well across the board. BIO and AUTM should<br />
recognize the very real problems that have been<br />
uncovered, exhort compliance with established<br />
norms and—even more importantly if such<br />
norms are to be meaningful—criticize deviations<br />
from them, rather than following the<br />
politically expedient tactic of focusing their<br />
fire on SACGHS recommendations intended<br />
to prevent these problems.<br />
The two most controversial SACGHS recommendations<br />
are, first, a proposed exemption<br />
from infringement liability for research use,<br />
and second, a similar exemption for diagnostic<br />
use. As previously noted, university licensing<br />
offices opposing a research exemption puts<br />
them at odds with their own stated principles,<br />
as licensing to ensure freedom to do research<br />
appears in every document proposing norms<br />
for licensing. Opposition to a diagnostic-use<br />
exemption is more understandable because<br />
it may be that there are unusual situations in<br />
which exclusivity is needed to get a product or<br />
service to market, and such situations simply<br />
have not been captured in the cases studied to<br />
date. Nevertheless, it is quite clear that in many<br />
if not most cases of genetic diagnostics, the<br />
main use of exclusive licenses from universities<br />
has been to reduce competition and reduce<br />
the number of laboratories offering tests, without<br />
apparent benefits of introducing tests that<br />
were not already available. Rather, tests would<br />
demonstrably have been available even without<br />
the participation of the companies involved.<br />
The SACGHS may have judged that tech<br />
transfer offices are failing to respect existing<br />
norms, and in the absence of any credible compliance<br />
measures, the simplest legal solution<br />
is to address the problem through exemption<br />
from infringement liability. If AUTM and<br />
BIO want to preserve the option of exclusive<br />
licensing when needed to get genetic tests to<br />
market, then compliance with guidelines needs<br />
to be credible. Criticizing deviations when<br />
nature biotechnology volume 28 number 8 august 2010 789
COMMENTARY<br />
© 2010 <strong>Nature</strong> America, Inc. All rights reserved.<br />
they come to light, with the long-term goal<br />
of increasing compliance with stated norms,<br />
would go a long way toward reducing the need<br />
for a diagnostic-use exemption. Moreover,<br />
enforcing nonexclusive licensing norms can<br />
preserve revenue streams, as seen in the cystic<br />
fibrosis and Huntington’s models, whereas<br />
a diagnostic-use exemption would eliminate<br />
those revenues because the patents would be<br />
unenforceable for diagnostic uses.<br />
One could object that it is neither the function<br />
nor the responsibility of either BIO or<br />
AUTM to criticize their members. BIO is an<br />
industry lobby group that sees itself as “the<br />
champion of biotechnology and the advocate<br />
for its member organizations,” whereas AUTM<br />
is an association of individuals working in tech<br />
transfer that seeks “to support and advance academic<br />
technology transfer globally.” Developing<br />
and enforcing patenting and licensing policies<br />
fall within neither mandate. This argument is,<br />
however, disingenuous, given that both AUTM<br />
and BIO claim to be working to ensure that<br />
tech transfer serves the public good. It is just as<br />
important to reduce practices that fall short as<br />
to promote practices that achieve the goals of<br />
their respective constituencies. Both organizations<br />
have endorsed the Nine Points guidelines<br />
and actively promote technology transfer “in<br />
a manner that is beneficial to the public interest”<br />
(http://bio.org/ip/techtransfer/) while<br />
“improving quality of life, building social and<br />
economic well-being, and enhancing research<br />
programs” (http://betterworldproject.org/<br />
tech_transfer.cfm). Having voluntarily taken<br />
these positions, both organizations should be<br />
held accountable for them.<br />
Increasing transparency to permit ‘system<br />
learning’. To promote change, universityindustry<br />
relationships need to be more transparent;<br />
indeed, the current opaqueness over<br />
existing university-industry interactions is<br />
a major hurdle to improving the intellectual<br />
property system for DNA diagnostics 11 . For<br />
example, license agreements between universities<br />
and start-up and private companies are<br />
unavailable, even in general terms. The only<br />
exceptions are universities or companies that<br />
voluntarily make such information public.<br />
Participants at the workshop on the role of<br />
universities in DNA patents and diagnostic testing<br />
held at Duke in April 2009 noted that most<br />
licensing information is not publicly available,<br />
even for inventions arising from public funding.<br />
In some cases, but only some, it is possible<br />
to reconstruct licensing terms from company<br />
annual reports or from press announcements.<br />
There is often no way for researchers and institutions<br />
to know what practices a license covers,<br />
whether there remains scope for others to<br />
practice an invention, which regions it covers<br />
and whether it applies to any specific fields of<br />
use or contains special restrictions. The lack of<br />
information makes it difficult to substantiate<br />
claims that licensing practices are changing or<br />
comply with best practices. As a study 11 on university<br />
licensing practices notes, simply stating<br />
whether a license is exclusive or nonexclusive<br />
misses important nuances. Not only would<br />
more transparency help researchers better<br />
understand the scope and ownership of intellectual<br />
property rights, it would also allow policymakers,<br />
academics and tech transfer offices<br />
to determine in what cases exclusive licensing<br />
is justified, as opposed to enforcing a blanket<br />
norm of nonexclusive licensing.<br />
Although under provisions 62 of the Bayh-<br />
Dole Act, all recipients of federal grants must<br />
report on activities involving the disposition of<br />
certain intellectual property rights that result<br />
from federally funded research, the information<br />
is incomplete and cannot be obtained<br />
Data on patenting and licensing<br />
practices are languishing in a<br />
government database that is not<br />
mined for valuable insights.<br />
because of strictures on access to the data. A<br />
clause of the legislation was intended to protect<br />
proprietary data from public access through the<br />
Freedom of Information Act 35 U.S.C. § 202(c)<br />
(5). The way the implementing regulations<br />
were written, however, went well beyond this,<br />
and gave licensees veto power over nongovernment<br />
disclosure of information. Tech transfer<br />
offices file reports with the interagency Edison<br />
(iEdison) database when they license inventions<br />
supported by most government funders.<br />
The reporting requirements do not require the<br />
disclosure of the licensing terms, and what is<br />
reported to iEdison is not publicly available.<br />
Indeed, access to iEdison is highly restricted;<br />
the database is unavailable for study or use outside<br />
government, and even government officials<br />
wanting to study technology transfer have<br />
been denied access unless they get permission<br />
from all licensees, a nearly impossible hurdle<br />
to overcome.<br />
Making licensing terms of publicly funded<br />
inventions more transparent would require<br />
a rewrite of the implementing regulations to<br />
change interpretation of the Bayh-Dole Act’s<br />
confidentiality clause. The confidentiality provision<br />
in the Bayh-Dole Act was intended to<br />
protect agencies from being forced to disclose<br />
proprietary data, but its implementing regulation<br />
is so broad that, in effect, it restricts the<br />
government’s ability to use data without permission<br />
of the relevant licensee. Current nondisclosure<br />
practices lead to data being unavailable for<br />
research aimed at improving knowledge about<br />
patenting and licensing practices. Many studies<br />
could be undertaken on aggregated reported<br />
data, and there are many precedents for using<br />
census data, health statistics and other very<br />
private information in government databases.<br />
The original rationale for the Bayh-Dole Act<br />
was that government-owned inventions were<br />
languishing for want of effective patent incentives<br />
to grantees and contractors; the current<br />
problem is that data on patenting and licensing<br />
practices are languishing in a government database<br />
that is not mined for valuable insights.<br />
On the industry side, there is a somewhat<br />
higher standard for disclosure by public companies<br />
to protect shareholders. As of 2003, the<br />
Securities and Exchange Commission (SEC)<br />
requires disclosure of material agreements,<br />
including license agreements, as part of SEC<br />
filings. Section 401(a) of the Sarbanes-Oxley<br />
Act of 2002 (Public Company Accounting<br />
Reform and Investor Protection Act of 2002,<br />
Pub. L. No. 107-204, 116 Stat. 745) requires the<br />
SEC to adopt rules to require each annual and<br />
quarterly financial report filed with the commission<br />
to disclose “all material off-balance<br />
sheet transactions, arrangements, obligations<br />
(including contingent obligations), and other<br />
relationships of the issuer with unconsolidated<br />
entities or other persons, that may have a material<br />
current or future effect on financial condition,<br />
changes in financial condition, results<br />
of operations, liquidity, capital expenditures,<br />
capital resources, or significant components<br />
of revenues or expenses.” In many cases, however,<br />
these disclosures are of little assistance in<br />
understanding the licensing landscape. The<br />
reporting pertains only when a license underpins<br />
a genetic test that is a large enough portion<br />
of a publicly traded company’s business that it<br />
needs to be disclosed to investors. Even then,<br />
which patents have been licensed under what<br />
terms may be disclosed vaguely. Many biotech<br />
start-up companies are not publicly traded and<br />
are not subject to SEC disclosure requirements.<br />
By the time a biotech company goes public, its<br />
prospectus may contain some, but only limited,<br />
information about licensing agreements. In the<br />
usual case of a public company acquiring technology<br />
by buying another company, disclosure<br />
of the original license may not be required.<br />
Universities argue that if they are forced to<br />
disclose the terms of prior licensing agreements,<br />
it will undermine their negotiating position<br />
with new potential licensees. If, however,<br />
public companies must disclose the contents of<br />
their license agreements to protect the interests<br />
of those funding them (namely, shareholders) as<br />
790 volume 28 number 8 august 2010 nature biotechnology
COMMENTARY<br />
© 2010 <strong>Nature</strong> America, Inc. All rights reserved.<br />
a matter of public policy, then it is not clear why<br />
a university should not be required to disclose<br />
the contents of its license agreements to protect<br />
those who fund it (namely, the public). The<br />
question of human resources needed to ensure<br />
transparency is very real and needs to be taken<br />
into account, but the principle of public disclosure<br />
should be entrenched within public institutions,<br />
particularly when the licensed inventions<br />
arise from publicly funded research and when<br />
data are being collected and reported already.<br />
Government and nonprofit research dollars<br />
should come with public accountability.<br />
Secure funding of tech transfer offices. As<br />
noted above, some tech transfer offices are<br />
expected to be self-sustaining and suffer from<br />
a serious lack of resources. This situation has<br />
several consequences. First, the agreements<br />
that these offices pursue will not necessarily<br />
aim to promote dissemination but instead will<br />
focus first on securing revenues. Second, tech<br />
transfer offices lack resources to train managers<br />
on implementing guidelines and the particular<br />
challenges that different technologies raise. The<br />
DNA diagnostic market is complex and rapidly<br />
evolving. For example, technology licensing<br />
officers need to know that the development of<br />
genetic testing after the discovery of the gene<br />
requires far less investment than the development<br />
of therapeutics, suggesting that exclusive<br />
licenses are usually not as necessary 11 . Without<br />
a more nuanced and informed understanding<br />
of how optimal patenting, dissemination and<br />
licensing decisions vary across different types<br />
of technologies and uses, these offices cannot<br />
fulfill their mandate: transferring technology.<br />
Conclusions<br />
To address the ongoing failure to achieve the<br />
goals of the multiple guidelines, policies and<br />
even legislation aimed at ensuring continued<br />
research on and access to clinical genetic tests,<br />
practices within universities and their industry<br />
partners must conform to existing guidelines.<br />
Although some changes to patent law—such as<br />
clearer research exemptions and an opposition<br />
proceeding—could be of use, fundamentally the<br />
problem is one of strategy about what to patent<br />
(products versus methods), how broadly to<br />
make claims to early-stage gene-based inventions<br />
and how to deploy those patents (broadly<br />
versus exclusively). Patents will be properly<br />
deployed only when university constituencies<br />
unite in promoting broad dissemination, when<br />
technology transfer offices are given the necessary<br />
financial support and incentives and when<br />
universities and industry have transparent and<br />
publicly accountable practices for licensing of<br />
DNA diagnostic technologies. Industry groups<br />
such as BIO and university technology transfer<br />
organizations such as AUTM have a crucial and<br />
constructive role to play in resolving this predicament.<br />
Progress toward addressing the problems<br />
in genetic diagnostics can begin with less caustic<br />
and unhelpful rhetoric and more focus on<br />
engagement with their constituencies on seriously<br />
implementing guidelines, as well as with<br />
federal advisory bodies such as the SACGHS.<br />
By acknowledging and engaging with the distinctive<br />
problems that patenting and licensing<br />
practices raise for DNA diagnostics, both the<br />
universities licensing out technology and the<br />
companies licensing it in can bring about real<br />
improvement without the need for legislation.<br />
COMPETING FINANCIAL INTERESTS<br />
The authors declare no competing financial interests.<br />
1. Diamond v. Chakrabarty, 447 U.S. 303 (1980).<br />
2. Association for Molecular Pathology et al. v. United<br />
States Patent and Trademark Office et al. (USDC SDNY<br />
09 Civ. 4515, 2010).<br />
3. Ariad Pharmaceuticals, Inc. v. Eli Lilly and Co. (560<br />
F3d 1366 (Fed Cir 2009).<br />
4. Secretary’s Advisory Committee on Genetics Health<br />
and Society, National Institutes of Health. Report<br />
on Gene Patents and Licensing Practices and Their<br />
Impact on Patient Access to Genetic Tests (SACGHS,<br />
Washginton, DC, 2010).<br />
5. Merz, J.F. Clin. Chem. 45, 324–330 (1999).<br />
6. Heller, M.A. & Eisenberg, R.A. Science 280, 698–701<br />
(1998).<br />
7. Chandrasekharan, S. & Cook-Deegan, R. Genome Med.<br />
1, 92 (2009).<br />
8. Holman, C.M. Science 322, 198–199 (2008).<br />
9. Nelson, R. J. Technol. Transf. 26, 13–19 (2001).<br />
10. Mowery, D.C. et al. Res. Policy 30, 99–119 (2001).<br />
11. Pressman, L. et al. Nat. Biotechnol. 24, 31–39<br />
(2006).<br />
12. Schissel, A., Merz, J.F. & Cho, M.K. <strong>Nature</strong> 402, 118<br />
(1999).<br />
13. Henry, M.R., Cho, M.K., Weaver, M.A. & Merz, J.F.<br />
Science 297, 1279 (2002).<br />
14. Gold, E.R. & Carbone, J. Genet. Med. 12 Suppl, S39–<br />
S70 (2010).<br />
15. Skeehan, K., Heaney, C. & Cook-Deegan, R. Genet.<br />
Med. 12 Suppl, S71–S82 (2010).<br />
16. Merz, J.F. in The Penn Center Guide to Bioethics (eds.<br />
Ravitsky, F., Feister, A. & Caplan, A.L.) 383–385<br />
(Springer, New York, 2009).<br />
17. Nuffield Council on Bioethics. The Ethics of Patenting<br />
DNA (Nuffield Council on Bioethics, London, 2002).<br />
18. Cook-Deegan, R. et al. Genet. Med. 12 Suppl, S15–<br />
S38 (2010).<br />
19. Angrist, M., Chandrasekharan, S., Heaney, C. &<br />
Cook-Deegan, R. Genet. Med. 12 Suppl, S111–S154<br />
(2010).<br />
20. Chandrasekharan, S. & Fiffer, M. Genet. Med. 12<br />
Suppl, S171–S193 (2010).<br />
21. Chandrasekharan, S., Heaney, C., James, T., Conover,<br />
C. & Cook-Deegan, R. Genet. Med. 12 Suppl,<br />
S194–S211 (2010).<br />
22. Chandrasekharan, S., Pitlick, E., Heaney, C. & Cook-<br />
Deegan, R. Genet. Med. 12 Suppl, S155–S170<br />
(2010).<br />
23. Colaianni, A., Chandrasekharan, S. & Cook-Deegan, R.<br />
Genet. Med. 12 Suppl, S5–S14 (2010).<br />
24. Powell, A., Chandrasekharan, S. & Cook-Deegan, R.<br />
Genet. Med. 12 Suppl, S83–S110 (2010).<br />
25. Cook-Deegan, R., Chandrasekharan, S. & Angrist, M.<br />
<strong>Nature</strong> 458, 405–406 (2009).<br />
26. Caulfield, T., Cook-Deegan, R.M., Kieff, F.S. & Walsh,<br />
J.P. Nat. Biotechnol. 24, 1091–1094 (2006).<br />
27. National Research Council. Reaping the Benefits<br />
of Genomic and Proteomic Research: Intellectual<br />
Property Rights, Innovation and Public Health<br />
(National Research Council, Washington, DC,<br />
2006).<br />
28. Ontario Report to the Provinces and Territories.<br />
Genetics, Testing and Gene Patenting: Charting<br />
New Territory in Healthcare (Government of Ontario,<br />
Toronto, Ontario, Canada, 2002).<br />
29. Australian Law Reform Commission. Essentially<br />
Yours: The Protection of Human Genetic Information<br />
in Australia (ALRC 96) (ALRC, Sydney, New South<br />
Wales, Australia, 2003).<br />
30. Gold, E.R., Bubela, T., Miller, F.A., Nicol, D. & Piper,<br />
T. Nat. Biotechnol. 25, 388–389 (2007).<br />
31. Gold, E.R. Nat. Biotechnol. 18, 1319–1320 (2000).<br />
32. Nicol, D. & Nielsen, J. Patents and Medical<br />
Biotechnology: An Empirical Analysis of Issues<br />
Facing the Australian Industry (Occasional Paper no.<br />
6) (Centre for Law & Genetics, Sandy Bay, Tasmania,<br />
Australia, 2003).<br />
33. Cho, M.K., Illangasekare, S., Weaver, M.A., Leonard,<br />
D.G.B. & Merz, J.F. J. Mol. Diagn. 5, 3–8 (2003).<br />
34. Rai, A. Northwest. Univ. Law Rev. 94, 77–152<br />
(1999).<br />
35. Merz, J.F., Kriss, A.G., Leonard, D.G. & Cho, M.K.<br />
<strong>Nature</strong> 415, 577–579 (2002).<br />
36. Merz, J.F., Cho, M.K., Robertson, M.J. & Leonard, D.G.<br />
Mol. Diagn. 2, 299–304 (1997).<br />
37. Merz, J.F. & Cho, M.K. Camb. Q. Healthc. Ethics 7,<br />
425–428 (1998).<br />
38. Andrews, L.B. Nat. Rev. Genet. 3, 803–808 (2002).<br />
39. LOI no 613–16 as amended in 2004.<br />
40. Overwalle, G.V. Int. Rev. Intellect. Property Competition<br />
Law 889, 908–918 (2006).<br />
41. Fed. Reg. 66, 1092–1099 (2001).<br />
42. Fed. Reg. 70, 18413–18415 (2005).<br />
43. Organisation for Economic Co-operation and<br />
Development. Guidelines for the Licensing of Genetic<br />
Inventions (OECD, Paris, 2006).<br />
44. In the Public Interest: Nine Points to Consider in<br />
Licensing University Technology (AUTM, Deerfield,<br />
Illinois, USA, 2007).<br />
45. Association of University Technology Managers.<br />
University Principles on Global Access to Medicines<br />
(AUTM, Deerfield, Illinois, USA, 2009).<br />
46. Rimmer, M. Eur. Intellectual Prop. Rev. 25, 20–33<br />
(2003).<br />
47. American Medical Association. Report 9 of the Council<br />
on Scientific Affairs (AMA, Chicago, 2000).<br />
48. Huys, I., Berthels, N., Matthijs, G. & Van Overwalle, G.<br />
Nat. Biotechnol. 27, 903–909 (2009).<br />
49. Laboratory Corporation of America Holdings, dba<br />
Labcorp v. Metabo-Lite Laboratories, Inc. et al., 548<br />
U.S. 124 (2006).<br />
50. eBay Inc. v. MercExchange, LLC, 547 U.S. 388<br />
(2006).<br />
51. Bilski v. Kappos, 561 U.S. ____ 20010 (No. 08–964),<br />
affirming F.3d 943 3d 943 (Fed. Cir. 2008).<br />
52. In re Kubin (Fed Cir. 2009).<br />
53. KSR International Co. v. Teleflex, Inc., 550 U.S. 398<br />
(2007).<br />
54. Van Overwalle, G., van Zimmeren, E., Verbeure, B. &<br />
Matthijs, G. Nat. Rev. Genet. 7, 143–148 (2006).<br />
55. Walsh, J.P., Ashish, A. & Cohen, W. in Effects Of<br />
Research Tool Patents And Licensing On Biomedical<br />
Innovation (eds. Cohen, W. & Merrill, S.) 285–336<br />
(National Academies Press, Washington, DC, 2003).<br />
56. Gold, E.R. et al. The Research or Experimental<br />
Use Exception: A Comparative Analysis (Centre for<br />
Intellectual Property Policy/Health Law Institute,<br />
Montreal, Quebec, Canada, 2005).<br />
57. Merck KGaA v. Integra Lifesciences I, Ltd., 545 U.S.<br />
193 (2005).<br />
58. Siegel, D.S. & Wright, M. Oxford Rev. Econ. Policy 23,<br />
529–540 (2007).<br />
59. http://www.mpegla.com/Lists/MPEG%20LA%20<br />
News%20List/Attachments/230/n-10–04–08.pdf,<br />
Last Accessed May 4, 2010.<br />
60. (5 February 2010).<br />
61. http://bio.org/ip/genepat/documents/SACGHSsignonletter2–4-2010final_000.pdf<br />
62. Bayh-Doyle Act, 37 C.F.R. Part 401.<br />
nature biotechnology volume 28 number 8 august 2010 791
FEATURE<br />
Public biotech 2009—the numbers<br />
Brady Huggett, John Hodgson & Riku Lähteenmäki<br />
The public biotech sector sustained more losses in 2009, but the year ended on a positive note, and the industry has<br />
regained its footing.<br />
© 2010 <strong>Nature</strong> America, Inc. All rights reserved.<br />
That whooshing sound at the end of 2009<br />
was the biotech sector letting out its collective<br />
breath. The year began as a hard slog,<br />
so when it came to a close on an upward<br />
swing, the industry rightfully felt a measure<br />
of relief. That’s not to say there weren’t casualties:<br />
a distressingly large number of companies<br />
departed the scene last year. But it was not as<br />
bad as some pundits had estimated, and the<br />
industry proved itself to be strong and creative.<br />
It was helped by a recovering economy in the<br />
second half of the year. Overall, counting the<br />
vast financial potential of collaborations, the<br />
industry recorded one of its best years for<br />
fundraising. That has left the sector brightly<br />
looking ahead again—a far cry from how<br />
things appeared at the end of 2008.<br />
Economic woes<br />
The 2009 data from <strong>Nature</strong> Biotechnology’s<br />
annual survey of public biotech firms, which<br />
now number 461 (owing to a change in<br />
our data-gathering process; see Box 1 and<br />
Supplementary Table 1), show little trace of<br />
how terribly the year began or how tightly<br />
the public markets had been hammered shut<br />
at the end of 2008. The reality is that 2009<br />
started bleakly for biotech, and it continued<br />
that way for most of the first quarter.<br />
Of course, not just biotech suffered—the<br />
recession affected all countries and sectors.<br />
Along with the other indices, shares on the<br />
Nasdaq Biotechnology Index bottomed out<br />
on 9 March, resting at 59.05, a low it had not<br />
seen since May 2003. The global economy continued<br />
to shed jobs last year: the US Central<br />
Data retrieval for this article was by Ernst &<br />
Young (Boston) with additional reporting by<br />
Riku Lähteenmäki. Brady Huggett is business<br />
editor at <strong>Nature</strong> Biotechnology, John Hodgson<br />
is editor-at-large at <strong>Nature</strong> Biotechnology,<br />
and Riku Lähteenmäki is a freelance writer in<br />
Turku, Finland.<br />
Box 1 The numbers<br />
<strong>Nature</strong> Biotechnology has published an annual report on public biotech companies since<br />
1996. As the industry has grown and changed, so have our definition of what constitutes<br />
a biotech company and our methods for gathering the information that serves as the<br />
backbone to this piece. We generally include companies built upon applying biological<br />
organisms, systems or processes, or the provision of specialist services to facilitate the<br />
understanding thereof. We exclude pharmaceutical companies, medical-device firms and<br />
contract research organizations to better focus on the unique attributes and situations<br />
that make up the biotech sector.<br />
This year’s data was provided by Ernst & Young, which has broadened the report’s reach<br />
into international exchanges and increased our total number of companies. Additional<br />
reporting was done via individual financial reports. The top-ten lists and other aggregate<br />
lists are sourced appropriately, with most data supplied by BioCentury. As investors do not<br />
stratify the biotech sector as stringently as <strong>Nature</strong> Biotechnology, we used money figures<br />
from across the biotech and biopharmaceutical arena to best highlight trends. In some<br />
cases, full-year data were not available and fourth-quarter numbers were extrapolated;<br />
this is noted in the company-by-company data table (Supplementary Table 1). Companies<br />
delisted in 2009 from major exchanges were excluded.<br />
Intelligence Agency estimates unemployment<br />
numbers increased around the world, sometimes<br />
drastically—Ireland’s unemployment<br />
nearly doubled to 12%, whereas the US went<br />
from 5.8% in 2008 to 9.3%.<br />
So although biotech wasn’t alone in the<br />
dark, as an industry made up mainly of small<br />
companies devoid of revenue—and thus<br />
more dependent on raising public funds—<br />
the sector was hit particularly hard. The fear,<br />
expressed by pundits, the Biotechnology<br />
Industry Organization (Washington, DC)<br />
and even biotech executives themselves, was<br />
that the industry would lose up to 25% of its<br />
companies to bankruptcy.<br />
But the Nasdaq Biotech Index steadily<br />
recovered from that March low and closed<br />
2009 at 81.83. Overall funding for the sector<br />
jumped in the second half, and although the<br />
National Bureau of Economic Research has<br />
yet to officially declare the end of the recession<br />
in the United States, consensus pegs it<br />
around the second quarter of 2009.<br />
Catastrophic shrinkage in the sector has<br />
not happened. There were losses (Table 1),<br />
but they were not as far-reaching as feared.<br />
And among all this detritus, a surprise: the<br />
biotech sector was again profitable in 2009.<br />
The money trail<br />
Financing levels for biotech are a useful<br />
gauge of the sector’s overall health, because<br />
without repeated investment, the industry<br />
shrivels. In this regard, 2009 turned out better<br />
than expected. The third quarter saw<br />
the first month of positive growth in the<br />
US economy since the recession started in<br />
December 2007, and as the economy recovered,<br />
money again began moving. By year’s<br />
end, overall biotech financing was up 84%<br />
from the depressed figures seen in 2008.<br />
In 2008, as first the United States and then<br />
the world slid into recession, overall funding<br />
was at its lowest since at least 2002 (Fig. 1),<br />
with debt financings, private investments in<br />
a public entity (PIPEs), follow-on offerings<br />
nature biotechnology volume 28 number 8 august 2010 793
feature<br />
© 2010 <strong>Nature</strong> America, Inc. All rights reserved.<br />
Table 1 Casualties in 2009<br />
Company<br />
Alpha Innotech<br />
Altus Pharmaceuticals<br />
Arthrokinetics<br />
Autoimmune<br />
Avalon Pharmaceuticals<br />
Avigen<br />
Biopure Corporation<br />
BioXell<br />
CelSis<br />
Cellegy<br />
Cell Genesys<br />
Cobra<br />
Curagen<br />
Curalogic<br />
CV Therapeutics<br />
EPIX Pharmaceuticals<br />
Evolutec<br />
Genaera<br />
Genentech<br />
Hemacare<br />
Hemagen Diagnostics<br />
IDM Pharma<br />
Introgen<br />
Isologen<br />
Intercytex<br />
Liponex<br />
Medarex<br />
Metabasis Therapeutics<br />
Monogram<br />
Napo Pharma<br />
Nastech<br />
Neos<br />
Neurogen<br />
Northfield Laboratories<br />
Nucryst<br />
Nuvelo<br />
Nventa Biopharmaceuticals<br />
Phynova<br />
Replidyne<br />
Targanta<br />
ViRexx Medical<br />
XLT Biopharmaceuticals<br />
and initial public offerings (IPOs) all declining<br />
substantially from previous years. Only<br />
venture capital remained aloft, although<br />
venture capitalists were more inclined to put<br />
money into companies previously invested<br />
in, rather than new ventures.<br />
This pattern reversed last year. Debt<br />
financings, venture capital and money raised<br />
in follow-ons and IPOs all increased, almost<br />
achieving the level seen in 2007, before the<br />
markets tanked. Only one category went<br />
backward, PIPEs —which was to be expected,<br />
Reason for status change<br />
Acquired by Cell Biosciences<br />
Bankruptcy<br />
Delisted<br />
Inactive<br />
Acquired by Clinical Data<br />
Acquired by Medicinova<br />
Bankruptcy<br />
Acquired by Cosmo<br />
Acquired by JM Hambro<br />
Merged with Adamis Pharmaceuticals<br />
Acquired by BioSante<br />
Merged with Recipharm<br />
Acquired by CellDex<br />
Bankruptcy<br />
Acquired by Gilead<br />
Liquidated<br />
Transformed into investment company<br />
Dissolved<br />
Acquired by Roche<br />
Inactive<br />
Inactive<br />
Acquired by Takeda<br />
Bankruptcy<br />
Bankruptcy<br />
Delisted<br />
Merged with ImaSight<br />
Acquired by BNS<br />
Acquired by Ligand Pharmaceuticals<br />
Acquired by LabCorp<br />
Inactive<br />
Changed name to MDRNA<br />
Inactive<br />
Inactive<br />
Inactive<br />
Inactive<br />
Merged with Arca<br />
Inactive<br />
Delisted<br />
Merged with Cardiovascular<br />
Acquired by The Medicines Company<br />
Acquired by Paladin<br />
Delisted<br />
as once the general markets (and individual<br />
stock prices) improved, the need for private<br />
investment faded.<br />
The largest follow-on offering of the year<br />
($640 million) was conducted by Qiagen<br />
(Venlo, The Netherlands), a profitable provider<br />
of sample and assay technologies<br />
(Table 2). It had the best year of its existence<br />
in 2009, with overall revenues above $1 billion,<br />
and is the type of stable company that<br />
can easily reach into the secondary-offering<br />
market. The sexier story is Human Genome<br />
Sciences (HGS, Rockville, Maryland, USA),<br />
which raised about $850 million in two follow-on<br />
offerings. As its stock price rocketed<br />
after positive pivotal trial results for the lupus<br />
drug Benlysta (belimumab), it tapped the<br />
public markets in late July for more than $373<br />
million and again in December for about $477<br />
million. The company’s stock, which opened<br />
the year at $2.12, ended it at $30.58.<br />
This is a similar story to Dendreon’s<br />
(Seattle), which in April reported positive<br />
phase 3 results for its prostate cancer vaccine<br />
Provenge (sipuleucel-T), sending its<br />
stock up more than 100% on the day the<br />
results were announced. This set the stage for<br />
a $427-million public offering in May, followed<br />
by another in December. Provenge has<br />
now been approved, the company has priced<br />
the drug aggressively, and Dendreon’s stock,<br />
at the time of publication, sat just above $34;<br />
it began 2009 at $4.59.<br />
Whereas many of biotech’s established<br />
companies completed debt deals last year,<br />
returning that funding category to levels<br />
seen before a well-below-average 2008, it<br />
was hardly a year worth mentioning for IPOs<br />
(Table 3). Just ten occurred in 2009, none<br />
before August, and none could be considered<br />
a typical biotech IPO, either in the type of<br />
company or the amount of money raised.<br />
For instance, the JSC Human Stem Cell<br />
Institute (with sites in Russia, Germany and the<br />
Ukraine) raised a mere $4.8 million. The institute<br />
doesn’t look much like the usual biotech enterprise<br />
preparing to go public: it has a research<br />
laboratory and a center for storage of cellular<br />
materials, and it publishes the journal Cellular<br />
Transplantation and Tissue Engineering.<br />
What’s more, an IPO is no longer the cash<br />
windfall and viable exit for investors it once<br />
was. Consider D-Pharm (Rehovot, Israel),<br />
which raised about $7.4 million on the Tel<br />
Aviv Stock Exchange to fund clinical testing<br />
of its small-molecule stroke drug, DP-b99, a<br />
membrane-active derivative of the calcium<br />
chelator 1,2-bis-(2-aminophenoxy)ethane-<br />
N,N,N′,N′-tetraacetic acid (BAPTA).<br />
Alongside the IPO, the company also completed<br />
a rights offering (which gives existing<br />
shareholders the right to buy shares during a<br />
defined period, usually at a discount), raising<br />
NIS 57 million ($14.8 million). The existing<br />
investors didn’t exit—they instead had the<br />
choice to increase their stake.<br />
In truth, the average amount raised per<br />
IPO is hardly enough to alleviate financial<br />
concerns for long. In 2008, our survey<br />
showed IPOs raised on average $22.3 million.<br />
In the previous two years, it was considerably<br />
more, $58 million in 2007 and $41 million in<br />
2006. Figure 2 shows an IPO in 2009 raised,<br />
794 volume 28 number 8 august 2010 nature biotechnology
feature<br />
© 2010 <strong>Nature</strong> America, Inc. All rights reserved.<br />
of finance in Europe and nearly half of all<br />
finance in Europe during 2009 (Table 4).<br />
Without this money, the amount raised in<br />
Europe during 2009 would have been only<br />
15% of the global total finance in this survey,<br />
rather than 26%.<br />
Those IPOs had a small role in the sizable<br />
increase in overall funding from 2008, but<br />
the biggest factor was headline-grabbing<br />
partnering deals: $36.9 billion in 2009, up<br />
from $20 billion the previous year. This<br />
heightened partnering activity was propelled<br />
both by pharma’s need to bolster fading pipelines<br />
and biotech’s need for help of any kind<br />
during the recession.<br />
But here again, that high figure is misleading,<br />
because a large portion of it represents<br />
milestone payments that may never be<br />
paid. The leading deal among our companies<br />
(Table 6) was formed between Nektar<br />
and AstraZeneca for two programs that use<br />
Nektar’s advanced polymer conjugate techon<br />
average, $92.8 million. On the surface<br />
that seems a marked increase, but further<br />
inspection shows that the figure is distorted<br />
by the unique case of Talecris Biotherapeutics<br />
(Research Triangle Park, NC, USA). The<br />
company develops nonrecombinant protein<br />
therapeutics from plasma and is profitable. It<br />
was pegged as an acquisition target by rival<br />
CSL (Victoria, Australia) in 2008 for $3.1 billion,<br />
but the US government challenged the<br />
purchase as anticompetitive, and the deal fell<br />
apart. Talecris instead conducted an IPO in<br />
2009 for a whopping $550 million. Toss aside<br />
Talecris, and the figure falls more in line with<br />
recent years: $42 million. Talecris is again in<br />
line for an acquisition, by Grifols (Barcelona,<br />
Spain) for $3.4 billion.<br />
Overall, the public markets in Europe<br />
remain relatively parsimonious. They provided<br />
only 15% of all European financing,<br />
whereas US public markets provided 33%<br />
of the total US fundraising (Table 4). The<br />
main shortfall, as in previous years, was<br />
in follow-on offerings. Where follow-on<br />
financings occurred in Europe, they raised<br />
amounts comparable to those raised by US<br />
firms—$112 million on average, compared<br />
with $107 million for US companies. But in<br />
2009, 48 US biotech companies got followon<br />
offerings away, compared with only seven<br />
in Europe. For European public companies,<br />
secondary offerings are still the exception—<br />
leaving them open to acquisition bids and<br />
investors open to disillusionment.<br />
Two European firms dominated debt<br />
financing this year (Table 5), with giant UCB<br />
(formed around Celltech, Brussels) taking in<br />
more than $2.6 billion in a series of three<br />
notes. Elan (Dublin) also raised $625 billion<br />
in a bond issue. These two massive chunks<br />
of debt financing distort the European<br />
fundraising picture, giving it an undue rosy<br />
glow. The $3.2 billion raised represents over<br />
three-quarters of the ‘Other’ categories<br />
Financing raised ($ billions)<br />
70<br />
60<br />
50<br />
40<br />
30<br />
20<br />
10<br />
0<br />
0.544<br />
3.883<br />
2.231<br />
4.018<br />
9.075<br />
8.933<br />
2003<br />
2.556<br />
3.335<br />
2.93<br />
5.318<br />
8.833<br />
10.933<br />
2004<br />
1.859<br />
4.838<br />
2.661<br />
5.398<br />
6.112<br />
17.268<br />
2005<br />
2.03<br />
5.578<br />
4.695<br />
5.682<br />
11.853<br />
19.796<br />
2006<br />
Year<br />
2.95<br />
4.377<br />
4.748<br />
6.809<br />
11.68<br />
22.365<br />
2007<br />
0.134<br />
1.867<br />
3.143<br />
5.177<br />
3.232<br />
20.023<br />
2008<br />
0.928<br />
6.041<br />
2.277<br />
5.198<br />
10.335<br />
36.923<br />
2009<br />
IPO<br />
Follow-on<br />
PIPES<br />
Venture capital<br />
Debt and other<br />
Partnerships<br />
Figure 1 Global biotech industry financing. Biotech funding was up 84% to $62 billion in 2009 from<br />
$33 billion in 2008. Partnership figures from Burrill & Co. are for deals involving a US company.<br />
BioCentury makes updates to its financing data on an ongoing basis. Sources: BCIQ: BioCentury Online<br />
Intelligence; Burrill & Co.<br />
nology platform—the program NKTR-118,<br />
which had completed phase 2 for opioidinduced<br />
constipation, and NKTR-119, an<br />
early-stage program intended to deliver<br />
products for pain without a constipation side<br />
effect. Nektar did receive an up-front payment<br />
of $125 million in the deal, but it’s the<br />
potential milestones that give the partnership<br />
its $1.5 billion high-end value.<br />
That was one of six deals in 2009 that had<br />
a potential payout of more than $1 billion,<br />
making the average potential of our top-ten<br />
group worth more than a billion dollars.<br />
But the average amount of funds received<br />
up front (including equity investments or<br />
money for milestones hit at the time of deal<br />
signing) was much lower, at about $109 million,<br />
meaning nearly 90% of the value in these<br />
deals remained unrealized at year’s end.<br />
When considering all partnerships<br />
between pharma and biotech (public and<br />
private), using data from Elsevier’s Strategic<br />
Table 2 Top ten follow-on offerings of 2009<br />
Company name<br />
Date completed<br />
Amount raised<br />
($ millions) Underwriters<br />
Qiagen 9/24 640.4 Deutsche Bank, Goldman Sachs, J.P. Morgan, Barclays Capital, Commerzbank, DZ Bank<br />
Vertex Pharmaceuticals 12/2 500.5 Goldman Sachs, Merrill Lynch, J.P. Morgan, Morgan Stanley<br />
Human Genome Sciences 12/2 476.8 Goldman Sachs, Citigroup, J.P. Morgan, Morgan Stanley, UBS<br />
Dendreon 12/10 426.9 J.P. Morgan, Deutsche Bank, Citigroup, Morgan Stanley, Lazard, Leerink<br />
Human Genome Sciences 7/28 373.8 Goldman Sachs, Citigroup<br />
Vertex Pharmaceuticals 2/18 320 Merrill Lynch, Cowen<br />
Cephalon 5/21 300 Deutsche Bank, J.P. Morgan, Barclays Capital Inc., Credit Suisse, Morgan Stanley<br />
Dendreon 5/13 229.9 Deutsche Bank<br />
Incyte 9/25 139.7 Goldman Sachs, Morgan Stanley, J.P. Morgan<br />
Seattle Genetics 8/11 135.9 J.P. Morgan, Goldman Sachs, Needham, Oppenheimer, RBC Capital Markets<br />
Data are matched to the definition of biotech in Box 1. Source: BCIQ: BioCentury Online Intelligence<br />
nature biotechnology volume 28 number 8 august 2010 795
feature<br />
© 2010 <strong>Nature</strong> America, Inc. All rights reserved.<br />
Table 3 Initial public offerings of 2009<br />
Amount raised<br />
Company name Location Date completed ($ millions) Underwriters<br />
CanBas Shizuoka, Japan 9/17 14.8 Mitsubishi UFJ Securities International plc, Mizuho, Ichiyoshi, JPMorgan,<br />
Mizuho Investors, Takagi<br />
China Nuokang<br />
Bio-Pharmaceutical<br />
Cumberland<br />
Pharmaceuticals<br />
D. Western Therapeutics<br />
Institute<br />
Transactions database, we found the average<br />
total amount paid up front in 2009 was about<br />
$58.9 million. That’s the highest average over<br />
the past 10 years (only 2006 came close, at<br />
$55.7 million), and a long way from the upfront<br />
money paid out in 2000, which was just<br />
$12.4 million. Still, it also drives home the<br />
reality that a deal with a potential value of<br />
$1 billion is just that: potential.<br />
2009 also provided an interesting wrinkle<br />
for equity investments around partnerships.<br />
Over the past 10 years, the average equity<br />
bought as part of a deal in each year was<br />
well below $10 million, with the exception<br />
of 2001, when it leaped to $32.3 million. Last<br />
year, it leaped again, to $20.6 million. In both<br />
2001 and 2009, the public markets had come<br />
down from peaks, and thus selling equity as<br />
part of partnering deals rose in favor.<br />
Beijing 12/9 40.7 Jefferies, Oppenheimer<br />
Nashville, TN, USA 8/10 85 UBS, Jefferies, Wells Fargo, Morgan Joseph and Co.<br />
Aichi, Japan 10/13 9.7 Nomura, Mitsubishi UFJ Securities International plc, Takagi, SBI Securities<br />
Co. Ltd., Tokai Tokyo, Mizuho<br />
D-Pharm Rahovot, Israel 8/17 7.3 Clal Finance, Rosario, Meitav<br />
Human Stem Cell Institute Moscow 12/10 4.8 CJSC Alor Invest<br />
Movetis N.V. Turnhout, Belgium 12/3 146 Credit Suisse, KBC, Piper Jaffray<br />
Omeros Corp. Seattle 10/7 68.2 Deutsche Bank, Wedbush, Canaccord, Needham, Chicago Investment<br />
Group, National Securities<br />
Talecris Biotherapeutics Research Triangle Park,<br />
NC, USA<br />
9/30 549.9 Morgan Stanley, Goldman Sachs, JPMorgan, Citigroup, Wells Fargo,<br />
Barclays Capital<br />
T-Ray Science Inc. Vancouver 12/9 1.4 Research Capital Corp.<br />
Source: BCIQ: BioCentury Online Intelligence<br />
Number of IPOs<br />
60<br />
50<br />
40<br />
30<br />
20<br />
10<br />
0<br />
10<br />
28<br />
2002<br />
14<br />
39<br />
2003<br />
53<br />
48<br />
2004<br />
45<br />
41<br />
2005<br />
Year<br />
49<br />
41<br />
2006<br />
Buyouts and climbing sales<br />
Mergers and acquisitions fell in 2009, both<br />
in total number and in the values assigned to<br />
the companies acquired (Table 7). Leading<br />
our list is Roche’s buyout of Genentech, but<br />
that deal was actually announced in 2008.<br />
Although it closed in the spring of last year,<br />
the acquisition is old news.<br />
But also high on the list is the purchase of<br />
Medarex by Bristol-Myers Squibb (BMS, New<br />
York), an acquisition that gained a validation<br />
of sorts in 2010. The purchase gave BMS<br />
access to Medarex’s antibody-drug conjugate<br />
technology and UltiMAb human antibody<br />
development system, but the main draw was<br />
ipilimumab. BMS was already partnered with<br />
Medarex on ipilimumab in phase 3 for metastatic<br />
melanoma, in phase 2 for lung cancer<br />
and in phase 3 for adjuvant melanoma and<br />
51<br />
58<br />
2007<br />
6<br />
22<br />
2008<br />
10<br />
92.8<br />
2009<br />
100<br />
90<br />
80<br />
70<br />
60<br />
50<br />
40<br />
30<br />
20<br />
10<br />
0<br />
Average amount raised ($ millions)<br />
Number of IPOs<br />
Average amt<br />
raised ($M)<br />
Figure 2 Global biotech initial public offerings. IPOs in 2009 seemingly made a recovery in amount<br />
raised, if not number of offerings.But the data is skewed by one large offering.<br />
hormone-refractory prostate cancer, so it had<br />
seen the product up close. Perhaps that’s the<br />
reason it offered a greater than 90% premium<br />
to the trading price of Medarex shares; the deal<br />
went through at $16 apiece, or $2.4 billion.<br />
Ipilimumab, a monoclonal antibody<br />
designed to block the inhibitory signal of<br />
cytotoxic T lymphocyte-associated antigen-4<br />
(CTLA-4), had failed in a phase 3 trial<br />
in 2007, and there was uncertainty around<br />
the new pivotal program for melanoma.<br />
But BMS announced in June 2010 at the<br />
American Society of Clinical Oncology’s<br />
annual meeting in Chicago that ipilimumab<br />
met the primary endpoint of survival in<br />
advanced melanoma in a phase 3 doubleblind<br />
randomized trial, and BMS said it<br />
expects to submit for regulatory approval<br />
of ipilimumab this year. Should the drug<br />
win approval, the $2.4 billion price tag for<br />
Medarex will seem a steal.<br />
Also of interest last year was Gilead’s (Foster<br />
City, CA, USA) buyout of CV Therapeutics,<br />
giving a company typically known for its<br />
HIV franchise a presence in the cardiovascular<br />
space. The move brought aboard<br />
Ranexa (ranolazine extended-release tablets),<br />
approved for chronic angina, and Lexiscan<br />
(regadenoson) injection for use as a pharmacologic<br />
stress agent in radionuclide myocardial<br />
perfusion imaging. Gilead remains a leader in<br />
HIV drugs—its highest-selling product was<br />
Truvada at about $2.5 billion last year, and<br />
90% of Gilead’s product sales came from its<br />
antiviral franchise—but through this acquisition<br />
it is seeking growth in other areas.<br />
Big sellers like Truvada are the beacons in the<br />
biotech fog, promising a move into the black<br />
after years spent dumping money into R&D and<br />
796 volume 28 number 8 august 2010 nature biotechnology
feature<br />
Table 4 Comparison of US and EU financing in 2009<br />
Amount<br />
raised in US<br />
($ millions)<br />
Number of<br />
US deals<br />
Amount<br />
raised in EU<br />
($ millions)<br />
Number of<br />
EU deals<br />
UCB and Elan<br />
($ millions)<br />
EU financing<br />
minus UCB<br />
($ millions)<br />
EU financing<br />
minus UCB<br />
(% of US +<br />
EU total)<br />
EU as a<br />
percentage<br />
of US + EU<br />
total<br />
EU as a<br />
percentage<br />
of EU total<br />
US as a<br />
percentage<br />
of US total<br />
Venture capital 3,939 197 1,114 87 – 1,114 22% 22% 18% 22%<br />
IPO 703 3 158 3 – 158 18% 18% 3% 4%<br />
Follow-on offering 5,166 48 785 7 – 785 13% 13% 12% 29%<br />
Other 7,756 236 4,253 108 3,200 1,053 12% 35% 67% 44%<br />
Total 17,564 484 6,310 205 3,200 3,110 15% 26% 100% 100%<br />
Source: BCIQ: BioCentury Online Intelligence<br />
© 2010 <strong>Nature</strong> America, Inc. All rights reserved.<br />
the clinic. Achieving that level of revenue usually<br />
follows this path: drug approval, then a marketing<br />
push and physician acceptance, followed<br />
by subsequent approvals in other indications<br />
to further increase sales. Most of the biologics<br />
in our list of the top ten drugs (Table 8) went<br />
that route. Enbrel (etanercept), from Amgen<br />
(Thousand Oaks, CA, USA), exemplifies this<br />
tactic. Originally approved in 1998 for rheumatoid<br />
arthritis, Amgen has received approvals in<br />
four other indications (ankylosing spondylitis,<br />
psoriasis, psoriatic arthritis and juvenile<br />
rheumatoid arthritis), and its worldwide revenue<br />
has jumped from $2.6 billion in 2005 to<br />
an estimated $6.4 billion in 2009, according to<br />
BioMedTracker. The drug, which inhibits the<br />
tumor necrosis factor (TNF) pathway, is the<br />
top-selling biologic in the world.<br />
In fact, three of the top five revenue-producing<br />
drugs target TNF: Remicade (infliximab,<br />
Johnson & Johnson, New Brunswick,<br />
NJ, USA) and Humira (adalimumab, Abbott,<br />
Abbott Park, IL, USA), are the other two,<br />
selling $5.9 billion and $5.5 billion worldwide,<br />
respectively. Those numbers, like the<br />
revenues for all the drugs in this table, are an<br />
improvement over the previous year.<br />
Given the lack of generic competition for<br />
biologics, it’s almost an anomaly when a<br />
drug does not increase sales year on year; it<br />
suggests something must have gone wrong.<br />
That’s been the case with Amgen’s Aranesp.<br />
Peaking at $4.1 billion in worldwide sales in<br />
2006, the drug has lost ground yearly since<br />
then, and in 2009 declined 15% to about<br />
$2.7 billion, falling off our list of the top ten<br />
biotech drugs. Amgen attributes the decline<br />
to the negative impact, mostly in supportive<br />
cancer care, of a “product label change”<br />
that came in August 2008. In fact, Aranesp<br />
serves as an example of the downside of<br />
product growth: the drug was being used offlabel<br />
in various indications until reports of<br />
adverse effects caused the US Food and Drug<br />
Administration (FDA) to tighten its label.<br />
The decline of Aranesp revenue meant<br />
Amgen reported lower overall revenues for<br />
2009, although the company’s adjusted net<br />
income for the year was more than $5 billion,<br />
compared with $4.9 billion in 2008, a<br />
3% increase.<br />
Affymetrix (Santa Clara, CA, USA) also<br />
saw its revenue decrease in 2009, though the<br />
reason has more to do with accounting: the<br />
figures had been buoyed in 2008 by a onetime<br />
intellectual property payment of $90<br />
million. So while a comparison year-by-year<br />
shows the company lost 20% of revenue in<br />
2009, in truth the business ground along<br />
smoothly. It had product revenue of $279.2<br />
million and service revenue of $39.6 million<br />
last year, both up from the previous year<br />
(2008 product revenue was $270.4 million<br />
and service revenue was $32.1 million.)<br />
Like Amgen and Affymetrix, other established<br />
firms fared well. Gilead experienced the<br />
largest increase in revenues, posting product<br />
sales that increased 27% over 2008 to nearly<br />
$6.5 billion, driven mostly by its HIV franchise<br />
of Truvada (emtricitabine and tenofovir disoproxil<br />
fumarate) and Atripla (efavirenz 600<br />
mg, emtricitabine 200 mg, tenofovir disoproxil<br />
fumarate 300 mg). Truvada sales increased<br />
18% to about $2.5 billion, and Atripla brought<br />
in $2.4 billion, up 51% over 2008.<br />
HGS also reported impressive revenues<br />
of $275.7 million for 2009, compared with<br />
Table 5 Top ten debt financings of 2009<br />
Company name Financing type Date completed<br />
revenues of only $48.4 million the previous<br />
year. The company logged its first product<br />
sales—$180.2 million for delivering to the<br />
US Strategic National Stockpile raxibacumab<br />
(human monoclonal antibody drug for treatment<br />
of inhalation anthrax) under a government<br />
contract. That helped HGS earn<br />
a net income of $5.7 million for the year,<br />
compared with a net loss of $268.9 million<br />
in 2008. The company also reported positive<br />
results for Benlysta (belimumab) phase<br />
3 trials announced in July and November<br />
2009. The good news drove up HGS’s stock<br />
price considerably, and as we noted earlier, it<br />
raised public funds twice during the year.<br />
End of the line<br />
Whereas 2008 saw 34 companies depart from<br />
the public biotech landscape—11 because of<br />
delisting or bankruptcy—those numbers<br />
increased in 2009. The total number of<br />
companies departing for any reason (buyout<br />
or merger included) climbed to 44, and<br />
the number removed owing to financial difficulty<br />
also went up, reaching 20. But a 9.5%<br />
drop in the number of companies is fewer<br />
casualties than was feared. Of those that teetered<br />
but survived, some were helped partially<br />
by the markets opening back up in the<br />
spring; by the ability to conduct debt deals,<br />
Amount raised<br />
($ millions)<br />
Amgen Sr notes (other) 1/14 2,000<br />
UCB Group Bond (other) 10/27 1,128<br />
UCB Group Bond (other) 12/3 751.9<br />
UCB Group Sr convert notes (other) 9/30 730.3<br />
Elan Sr notes (other) 9/29 625<br />
Cephalon Sr subord convert notes (other) 5/22 500<br />
Gilead Sciences Debt (other) 4/20 400<br />
Incyte Convert notes (other) 9/25 400<br />
Bio-Rad Laboratories Sr notes (other) 5/19 300<br />
PDL BioPharma Sr notes (other) 10/28 300<br />
Source: BCIQ: BioCentury Online Intelligence<br />
nature biotechnology volume 28 number 8 august 2010 797
feature<br />
© 2010 <strong>Nature</strong> America, Inc. All rights reserved.<br />
Table 6 Top ten research partnership and licensing deals of 2009<br />
Researcher<br />
Investor<br />
which returned to a more normal level after<br />
suffering through the battered credit markets<br />
in 2008; and by partners supplying up-front<br />
money and other funding.<br />
Also, considering that Genentech (and<br />
its $3.4 billion of net income in 2008) is no<br />
longer in our survey (now part of Roche), it<br />
seemed unlikely the sector would be able to<br />
repeat its performance from 2008, when it<br />
posted a net profit of $3.8 billion. But it did,<br />
drawing a collective net income in 2009 of<br />
$8 billion—with the heavy lifting, unsurprisingly,<br />
done by the large-cap firms (Fig. 3).<br />
Three main drivers contributed to the<br />
unexpected profitability in 2009. The first<br />
is an accounting change by the US Federal<br />
Accounting Standards Board, issued in late<br />
2007 but applicable in fiscal year 2009. Called<br />
SFAS 141R, the new guidance allows the costs<br />
associated with mergers and acquisitions to<br />
be expensed over time, rather than all at once<br />
Date<br />
announced<br />
Deal value<br />
($ millions) Details<br />
Nektar AstraZeneca 9/21 1,505 Worldwide rights to NKTR-118 for opioid-induced constipation and NKTR-119<br />
for pain<br />
Incyte Novartis 11/25 1,310 Ex-US rights to oral INCB18424, which is in phase 3 for myelofibrosis, and worldwide<br />
rights to preclinical cancer compound INCB28060<br />
Targacept AstraZeneca 12/3 1,240 Worldwide rights to develop and commercialize major depressive disorder compound<br />
TC-5214<br />
Exelixis Sanofi-aventis 5/29 >1,161 Exclusive, worldwide rights to XL147 and XL765, oral phosphoinositide 3-kinase<br />
inhibitors in phase 1b/2 and phase 2 to treat cancer<br />
ZymoGenetics Bristol-Myers Squibb 1/12 1,105 Codevelop and commercialize phase 1 HCV compound PEG-Interferon<br />
lambda (IL-29)<br />
Amylin Takeda 11/1 1,075 Codevelop and commercialize therapeutics for obesity and related indications<br />
Santaris Pharma Wyeth 1/12 847 Worldwide rights to ALD518 for all indications except cancer<br />
Algeta Bayer 9/3 800 Codevelop Alpharadin for bone metastases<br />
Medivation Astellas Pharma 10/27 765 Codevelop MDV3100 for the treatment of prostate cancer<br />
Cytokinetics Amgen 5/26 650 Exclusive world-wide (except Japan) license for cardiac contractility program<br />
Acorda Bayer 7/1 510 Exclusive collaboration and license agreement to develop Fampridine-SR for<br />
multiple sclerosis<br />
Data are matched to the definition of biotech in Box 1. Source: BCIQ: BioCentury Online Intelligence<br />
as part of the purchase price. It’s a small factor,<br />
and biotech-biotech mergers are less common<br />
and of lesser value than those between<br />
biotech and pharma, but still noteworthy.<br />
The second is that some companies simply<br />
had good years, and their revenue growth<br />
helped make up for the loss of Genentech.<br />
We’ve seen this with companies such as<br />
Gilead, which pushed its revenue up 31% and<br />
net income up 33% from 2008, and Biogen<br />
Idec (Weston, MA, USA), which posted a<br />
net income of $970 million, up 24% over the<br />
previous year.<br />
But the major reason for the collective<br />
profit is the same one that kept the number<br />
of bankruptcies lower than feared: a cutback<br />
on expenses. When the money isn’t<br />
there, spending has to decrease, and biotech<br />
tightened its belt in 2009. Companies spent<br />
less in two notable ways. First, they carried<br />
smaller payrolls than previously. In 2008, the<br />
companies surveyed had an average of 489<br />
employees per company. In 2009, although<br />
our pool of biotech firms surveyed grew to<br />
461 and with it the total number of employees<br />
increased, the average number of employees<br />
per company actually dropped to 442.<br />
Second, the biotech sector collectively<br />
reduced its R&D spending. In 2008, even as<br />
it faced financial turmoil, biotech increased<br />
its spending on R&D, as it had for years, from<br />
$22.8 billion in 2007 to $25.5 billion. This<br />
pattern came to a halt last year, when the<br />
sector’s overall R&D spending fell to $22.3<br />
billion, with the greatest decrease seen in the<br />
microcaps, which went from $5.4 billion in<br />
2008 to $4.0 billion (a fall of nearly 30%) in<br />
2009. (Large caps reduced their R&D spending<br />
by just under 10%.) This considerable<br />
drop helped keep biotech profitable, but it is<br />
likely that it penalized the sector’s ability to<br />
carry out innovative science.<br />
Table 7 Top ten announced mergers and acquisitions of 2009<br />
Target<br />
Acquirer<br />
Month<br />
completed<br />
Deal value<br />
($ millions)<br />
Genentech Roche March 46,800<br />
Medarex Bristol-Myers Squibb September 2,400<br />
CV Therapeutics Gilead Sciences April 1,400<br />
ESBATech Alcon September 589<br />
BiPar Sciences Sanofi-aventis April 500<br />
Noven Hisamitsu Pharmaceuticals August 428<br />
ViroChem Vertex March 413<br />
Peplin Leo Pharma November 288<br />
Dow Pharmaceutical Sciences Valeant Pharmaceuticals January 285<br />
Arana Therapeutics Cephalon August 276<br />
Data are matched to the definition of biotech in Box 1. Source: BCIQ: BioCentury Online Intelligence<br />
The horizon<br />
Compared with other business sectors, biotech<br />
will continue to face the challenges of<br />
long timelines for product development.<br />
The heavy costs of R&D have shaped this<br />
industry since its inception, and that’s not<br />
about to change. But precisely because biotech<br />
remains centered on the provision of<br />
medical products, it has had the advantage of<br />
being considered ‘recession proof ’—people<br />
need drugs no matter how the economy is<br />
performing. The bottom lines of biotech’s<br />
big producers—Amgen, Gilead, Biogen—in<br />
2008 and 2009 reflect this.<br />
Yet the sector’s ability to fund itself ebbs<br />
and flows with the global economy, and this<br />
798 volume 28 number 8 august 2010 nature biotechnology
feature<br />
Table 8 Top ten biologic drugs in terms of sales in 2009<br />
Name Lead company Approved indication(s)<br />
Enbrel Amgen Rheumatoid arthritis (RA), ankylosing spondylitis, psoriasis, psoriatic arthritis (PA), juvenile<br />
rheumatoid arthritis<br />
2009 revenue<br />
($ million)<br />
~6,400<br />
Remicade Johnson & Johnson Psoriasis, ulcerative colitis (UC), ankylosing spondylitis, Crohn’s disease, PA, RA 5,892<br />
Avastin Roche Colorectal cancer, breast cancer, brain cancer, renal cell cancer, non–small cell lung cancer 5,747<br />
Rituxan Biogen IDEC Non-Hodgkin’s lymphoma, RA, chronic lymphocytic leukemia 5,617<br />
Humira Abbott Laboratories RA, ankylosing spondylitis, juvenile rheumatoid arthritis, Crohn’s disease, PA, psoriasis 5,488<br />
Herceptin Roche Breast cancer 4,833<br />
Lantus Sanofi-aventis Diabetes mellitus type II, diabetes mellitus type I 4,295<br />
Gleevec Novartis Chronic myelogenous leukemia, hypereosinophilic syndrome, dermatofibrosarcoma protuberans,<br />
3,944<br />
myeloproliferative disorders, gastrointestinal stromal tumor, acute lymphocytic leukemia,<br />
myelodysplastic syndrome, mastocytosis<br />
Neulasta Amgen Neutropenia, leucopenia 3,355<br />
Prevnar Pfizer Prevention of otitis media, Streptococcus pneumoniae pneumonia ~3,100<br />
Source: BioMedTracker<br />
© 2010 <strong>Nature</strong> America, Inc. All rights reserved.<br />
is especially true for the smaller-cap firms.<br />
These companies require investors, they<br />
require the support of the public markets,<br />
and they require lending, and when the<br />
world’s money locks up the way it did over<br />
2008 and the beginning of 2009, they suffer.<br />
At times like these, some will break, and R&D<br />
expertise and know-how will be dispersed—<br />
or worse, will be gone for good.<br />
But what biotech showed us in 2008 and<br />
2009 is its ability to hibernate until money<br />
flows again. The industry has long had to<br />
make do with less—a valuable trait when the<br />
tap runs dry. It forces the sector’s executives to<br />
look constantly for new ways to trim expenses<br />
and to partner. This can be seen through collaborations<br />
by Symphony Capital (New York),<br />
which invests in clinical programs rather than<br />
a company itself, or the low-infrastructure<br />
model espoused by groups such as Talaris<br />
Advisors (Hopkinton, MA, USA), or the use of<br />
contract research organizations to outsource<br />
portions of drug development.<br />
The economic upswing seen in the second<br />
half of 2009 has continued. Overall funding<br />
in the first six months of 2010 is on pace<br />
to easily surpass 2009 for both private and<br />
public biotechs. The FDA approved 16 biologics<br />
last year, an increase over both 2008<br />
(11 biologic approvals) and 2007 (9 biologic<br />
approvals). The Nasdaq biotech index has<br />
held ground for the first six months of 2010.<br />
J. Craig Venter and colleagues caught the<br />
world’s attention by creating a bacterium with<br />
an artificial genome. Biotech made its way<br />
to the Supreme Court, winning a decision<br />
favorable to Monsanto (St. Louis, MO, USA)<br />
and others developing genetically modified<br />
seeds. And so far this year, there have been<br />
approvals of Amgen’s Prolia (denosumab) for<br />
post-menopausal osteoporosis and Provenge<br />
(sipuleucel-T) for prostate cancer, both of<br />
which are expected to be huge sellers.<br />
Biotech, with its small firms and entrepreneurial<br />
spirit, has long thought of itself as the<br />
underdog, made up of fast, nimble companies<br />
built to innovate, overachieve, withstand hardship<br />
and adapt. This attitude has always been<br />
part of the industry’s culture, and these days<br />
it’s also a carefully cultivated personality used<br />
to distance biotech from the more troubled<br />
a<br />
b<br />
Number of companies Amount ($ billions)<br />
60<br />
50<br />
40<br />
30<br />
20<br />
10<br />
0<br />
–10<br />
350<br />
300<br />
250<br />
200<br />
150<br />
100<br />
50<br />
0<br />
58.7<br />
21.0<br />
Revenue<br />
97,207<br />
13<br />
Large cap<br />
10.3<br />
7.1 4.8 4.3 3.7 4.0<br />
63,876<br />
32<br />
Mid-cap<br />
R and D<br />
82<br />
Small cap<br />
pharmaceutical industry. In short, it has often<br />
seemed like biotech was built to deal with<br />
adversity. After surviving the past two years,<br />
it now knows it can.<br />
ACKNOWLEDGMENTS<br />
The authors would like to acknowledge the insight of G.<br />
Giovannetti and G. Jaggi in crafting this article.<br />
Note: Supplementary information is available on the<br />
<strong>Nature</strong> Biotechnology website.<br />
12.9<br />
1.6 –2.4 –4.0<br />
Net profit/loss<br />
334<br />
24,394 22,954<br />
Micro cap<br />
100,000<br />
80,000<br />
60,000<br />
40,000<br />
20,000<br />
Number of employees<br />
Micro cap<br />
Small cap<br />
Mid-cap<br />
Large cap<br />
Number of companies<br />
Number of employees<br />
Figure 3 Public biotech company revenue, R&D spending, profits and number of employees by<br />
market cap. Large cap, ≥$5 billion; mid-cap, $1 billion to
patents<br />
Bilski v. Kappos: the US Supreme Court broadens<br />
patent subject-matter eligibility<br />
William J Simmons<br />
The court narrowly ruled that business methods may be patent eligible, while striking down the primacy of its main test.<br />
© 2010 <strong>Nature</strong> America, Inc. All rights reserved.<br />
With over 60 biopharmaceutical products<br />
applied for or expected to be filed at the<br />
US Food and Drug Administration this year,<br />
joining over 335 currently approved biopharmaceuticals,<br />
determining what can or cannot<br />
be patented is a threshold question protecting<br />
inventions in biotech and pharmaceutical<br />
industry 1 . Up until 2008, the answer to<br />
this important question was relatively clear.<br />
However, a 2008 decision that set a new single<br />
standard for patent eligibility made addressing<br />
this inquiry fundamentally uncertain.<br />
In a landmark decision issued 28 June,<br />
the US Supreme Court issued its holding<br />
regarding patent-eligible subject matter in<br />
Bilski v. Kappos. The court unanimously<br />
agreed that Bilski’s claims recited no more<br />
than “abstract ideas” and were therefore<br />
not patentable under US law. Importantly, a<br />
majority of the court held that the language<br />
of the relevant law (35 USC §§100–101)<br />
broadly encompassed vast forms of subject<br />
matter as patent eligible. The court unanimously<br />
struck down the ‘machine-or-transformation’<br />
test 1 , a test implemented by the US<br />
Court of Appeals for the Federal Circuit in<br />
2008 that was criticized as “unnecessary,” as<br />
the sole test for determining whether a process<br />
is directed to patentable subject matter<br />
and held that the machine-or-transformation<br />
test is one test among many that can be used<br />
to determine patent eligibility. Justice Kennedy<br />
delivered the court’s opinion, with Justices<br />
Roberts, Thomas and Alito joining in full and<br />
Justice Scalia joining in part. Justice Stevens<br />
filed a concurring opinion in which Justices<br />
Ginsburg, Breyer and Sotomayor joined.<br />
Justice Breyer filed a concurring opinion in<br />
which Justice Scalia joined in part.<br />
William J. Simmons is at Sughrue Mion, PLLC,<br />
Washington, DC, USA.<br />
e-mail: wsimmons@sughrue.com<br />
The facts of Bilski v. Kappos did not involve<br />
biotech or pharmaceutical subject matter but<br />
rather a process for hedging risk in commodity<br />
markets (that is, an invention regarding<br />
instructing buyers and sellers of commodities<br />
in the energy market to protect against the risk<br />
of price fluctuations) 2 . For example, the application<br />
recited a series of steps instructing how to<br />
hedge risk, and in another instance the application<br />
of risk hedging was described in the form<br />
of a mathematical formula. The US Patent and<br />
Trademark Office (USPTO) denied Bilski a<br />
patent because, according to the USPTO, the<br />
patent application was directed to business<br />
methods that were patent-ineligible subject<br />
matter. The USPTO reasoned that the invention<br />
was too abstract, that it merely manipulated an<br />
idea and that it failed to practically apply concepts<br />
enough to render them patentable. The<br />
administrative appeal board affirmed, concluding<br />
that the application involved only mental<br />
steps and did not result in the transformation<br />
of physical matter.<br />
On appeal, the Federal Circuit, sitting<br />
en banc, did not rely on any of the several tests<br />
used by prior courts, including the Supreme<br />
Court, but instead created and applied a new<br />
legal standard for patentability: processes are<br />
patentable only if they are tied to a particular<br />
machine or apparatus, or transform a particular<br />
article into a different state or thing—<br />
namely, the machine-or-transformation test 3 .<br />
The Federal Circuit reasoned that because<br />
Bilski’s claims did not satisfy the new governing<br />
test, which the court made clear should be<br />
grossly applied to all areas of technology, the<br />
USPTO’s decision was correct and Bilski was<br />
not entitled to a patent.<br />
Judge Rader, now the Chief Judge of the<br />
Federal Circuit, in dissent, indicated that the<br />
language of 35 USC §101 “contains no hint<br />
of an exclusion for certain types of methods”<br />
and stated that “ironically the Patent Act itself<br />
specifically defines ‘process’ without any of<br />
these judicial innovations.” Rader argued that<br />
the only limits on eligibility are inventions<br />
that embrace natural laws, natural phenomena<br />
and abstract ideas. He wrote, “this court today<br />
invents several circuitous and unnecessary<br />
tests.” Even so, Rader suggested that the hedging<br />
claim on appeal was abstract, and he stated,<br />
“Bilski’s method for hedging risk in commodities<br />
trading is either a vague economic concept<br />
or obvious on its face.” Rader pointed out that<br />
US patent law was designed to encourage ingenuity<br />
and that the law is focused not on particular<br />
subject categories but on the patentability of<br />
the specific claimed invention. He maintained<br />
that the law distinguishes eligibility from conditions<br />
of patentability and generously provides<br />
for patent eligibility. His dissent was clear: the<br />
court should not create any categorical exclusion.<br />
Rader also pointed out that in Diehr 4 , the<br />
Supreme Court indicated that only natural laws,<br />
natural phenomena and abstract ideas are patent<br />
ineligible. He clarified, however, that if an<br />
abstract idea is applied to a practical use, it may<br />
be patent eligible. Notably, Rader commented<br />
that the earlier Supreme Court opinion of<br />
three dissenting justices in Lab. Corp. 5 misapprehended<br />
the distinction between a natural<br />
phenomenon and a patentable process, and in<br />
so doing, this opinion did not ask the fundamental<br />
question of whether the subject matter<br />
at issue is deserving of patent protection. Rader<br />
was clear that courts should not avoid this fundamental<br />
inquiry nor categorically preclude any<br />
form of invention.<br />
In response to the Federal Circuit’s decision,<br />
Bilski petitioned for and obtained Supreme<br />
Court review. The Bilski decision garnered the<br />
attention of many, prompting an unprecedented<br />
number of submissions of unsolicited briefs<br />
expressing the views of nonparties. Among the<br />
66 briefs, 13 were submitted by or on behalf of<br />
life science organizations, including biotech and<br />
nature biotechnology volume 28 number 8 august 2010 801
patents<br />
© 2010 <strong>Nature</strong> America, Inc. All rights reserved.<br />
5 5<br />
pharmaceutical interests (Fig. 1 and Table 1).<br />
Interestingly, there are differing opinions on the<br />
desired outcome of the case within the industry,<br />
including support for affirmance of the decision.<br />
However, among the 13 briefs submitted,<br />
only one brief appeared to support the machineor-transformation<br />
test (with the caveat that the<br />
test be applied correctly; Figs. 1 and 2, and<br />
Table 1).<br />
During the oral arguments heard at the<br />
Supreme Court in November 2009, several<br />
justices expressed their concerns that in the<br />
absence of unambiguous limitations regarding<br />
patent eligibility, the public could be harmed<br />
by the grant of patents to inventions directed<br />
to unworthy subject matter or commercially<br />
useful subject matter that might stifle business<br />
or innovation if granted a monopoly. The chief<br />
justice and several other justices appeared dissatisfied<br />
with the Federal Circuit’s machine-ortransformation<br />
test as the sole test for patent<br />
eligibility but seemed to be concerned to avoid<br />
expanding the scope of patent-eligible subject<br />
matter beyond that limited by the court’s precedent<br />
5 . In defense of its decision, the USPTO<br />
argued that the Bilski process did not comply<br />
with the machine-or-transformation test, that<br />
the claimed process was a method of conducting<br />
business that was per se unpatentable and<br />
that the claimed process was no more than<br />
an abstract idea and therefore unworthy of a<br />
patent. The USPTO was clear about the devastating<br />
effects of banning entire categories of<br />
inventions from patenting and further asserted,<br />
“to say that business methods are categorically<br />
ineligible for patent protection would eliminate<br />
new machines, including programmed computers,<br />
that are useful because of their contributions<br />
to the operation of business.”<br />
3<br />
Bilski<br />
Affirmance<br />
Neither party<br />
Figure 1 Number of amicus briefs from biotech and pharma sector vis-à-vis Bilski v. Kappos. Chart<br />
compares numbers of briefs arguing for a decision in favor of Bilski, for affirmance of the court’s<br />
decision against Bilski or for neither party.<br />
The Supreme Court’s decision was supported<br />
by all justices but the Court divided 5–4 in holding<br />
that under some undefined circumstances,<br />
at least some business methods may be patented.<br />
The Court did not clarify under which<br />
circumstance one could distinguish a patenteligible<br />
business method from an unpatentable<br />
“abstract idea,” leaving this issue for the Federal<br />
Circuit to decide.<br />
In reaching its decision, the court looked to<br />
the language of the law that describes four categories<br />
of patentable subject matter: processes,<br />
manufactures, machines and compositions<br />
of matter. A problem, however, arises in that<br />
the law sets forth a circular definition of ‘process’,<br />
making it difficult, at times, to determine<br />
whether a process meets the requirements of the<br />
statute. According to the court, the machine-ortransformation<br />
test, when applied as the sole<br />
test of determining a statutory process, violates<br />
proper statutory interpretation because “[t]he<br />
term ‘process’ means process, art or method,<br />
machine, manufacture, composition of matter<br />
or material” and the ordinary definition of process<br />
does not require that it be tied to a machine<br />
or transform an article.” 5 Joined by three<br />
other justices, Justice Kennedy explained that<br />
“[s]ection 101 is a dynamic provision designed<br />
to encompass new and unforeseen inventions”<br />
and that as new technologies evolve, the statute<br />
allows for the development and application of<br />
additional tests to assist in determining which<br />
processes are patent eligible.<br />
Regarding the contention that business methods<br />
are per se unpatentable, the court rejected<br />
this argument. However, the court reasoned<br />
that, in view of specific on-point legislation—<br />
namely, 35 USC §273—which creates a defense<br />
to alleged infringement of a business method<br />
claim, the legislature intended that claims<br />
directed to business methods can be patentable<br />
subject matter. Justice Kennedy reiterated that<br />
abstract ideas (which he did not define) are not<br />
patentable and that the court’s decisions regarding<br />
the unpatentability of abstract ideas were<br />
useful in determining which business methods<br />
may be protected under the patent law. The<br />
court held that Bilski’s claims were unpatentable<br />
because they were directed to “abstract ideas.”<br />
According to the court, Bilski sought a patent<br />
on “the use of the abstract idea of hedging risk<br />
in the energy market,” which was too abstract<br />
to be patent eligible. Even though the court<br />
rejected application of an exclusive machineor-transformation<br />
test, the court was careful to<br />
point out that inventions should be considered<br />
as a whole, not analyzed by dissecting the claims<br />
into old and new elements. Although it rejected<br />
the machine-or-transformation sole standard,<br />
the court provided the Federal Circuit with<br />
great flexibility in developing and applying<br />
“other limiting criteria” useful for determining<br />
patent eligibility. This guidance by the court is<br />
important and when properly implemented<br />
will fundamentally impact method patenting<br />
in every act.<br />
The court’s reasoning was grounded on precedent,<br />
such as that articulated in Benson 7 , Flook 8<br />
and Diehr 5 . The court held that the claims at<br />
issue were unpatentable because allowing Bilski<br />
“to patent risk hedging would pre-empt use of<br />
this approach in all fields, and would effectively<br />
grant a monopoly over an abstract idea.” The<br />
court did not formulate a new test but instead<br />
held “precedents establish that the machine-ortransformation<br />
test is a useful and important<br />
clue, an investigative tool” and nothing more. It<br />
is therefore clear that the machine-or-transformation<br />
test is a nonexclusive option for lower<br />
courts, in addition to the tests set forth in the<br />
court’s earlier decisions.<br />
The guidance set forth in Benson, Flook and<br />
Diehr should therefore be carefully considered<br />
and revisited. Briefly, in Benson, the patent<br />
sought related to an algorithm that converts<br />
numbers from binary-coded decimal form<br />
into pure binary form, which arguably could<br />
be applied to specific computer applications.<br />
The Supreme Court held that the recited<br />
algorithms were not patentable because they<br />
were drawn to abstract ideas, were not tied<br />
to a particular machine or apparatus and did<br />
not change articles or materials to a “different<br />
state or thing.” The court found it important to<br />
determine whether, assuming the algorithm to<br />
be patentable, patenting of the invention would<br />
pre-empt use of the mathematical formula. In<br />
Flook, the Supreme Court held that a method<br />
for updating alarm limits in catalytic conversion<br />
processes, which recited a mathematical<br />
802 volume 28 number 8 august 2010 nature biotechnology
patents<br />
© 2010 <strong>Nature</strong> America, Inc. All rights reserved.<br />
Table 1 Amicus summary (selected) in Bilski v. Kappos<br />
Amicus Industry or group represented Summary<br />
Novartis Corp. 15<br />
Caris Diagnostics, Inc. 16<br />
algorithm for computing an updated alarm<br />
limit from measured present values of variables,<br />
was not patent eligible. The court held that the<br />
identification of a limited category of useful<br />
post-solution applications of a formula does<br />
not make an otherwise unpatentable formula<br />
patentable because a process itself, not merely<br />
the mathematical algorithm, must be new and<br />
useful in order to meet the requirements for<br />
patentability. In Diehr, the court addressed a<br />
process for molding uncured synthetic rubber<br />
into a cured product. The claims were directed<br />
to a method that constantly measured the actual<br />
temperature inside a mold. The court held that<br />
the process constituted patentable subject matter<br />
under 35 USC §101 because the transformation<br />
and reduction of an article “to a different<br />
state or thing” is one clue to the patentability of<br />
a process claim that does not include a specific<br />
machine. In this instance, the court determined<br />
that the invention manifested the transformation<br />
of an article, uncured synthetic rubber, into<br />
a different state or thing. Although the invention<br />
used a well-known mathematical equation,<br />
the court remarked that the applicants did not<br />
seek to pre-empt the use of the equation.<br />
Health care solutions;<br />
pharmaceutical<br />
Personalized medicine; tailoring<br />
therapeutics for individual patients<br />
using biomarkers<br />
Machine-or-transformation test unduly narrows the scope of diagnostic process<br />
claims. If upheld, the court should clarify that the test is not the dispositive standard.<br />
Machine-or-transformation test is not the exclusive test for patent eligibility of<br />
processes. Many diagnostic tests do not involve a machine or transformation.<br />
Georgia Biomedical Partnership, Inc. 17 Life sciences Machine-or-transformation test is too rigid. Precedent is flexible and permissive.<br />
University of South Florida 18 University; research facility Only presents arguments for the first question presented. Machine-ortransformation<br />
test excludes from patent eligibility certain processes that<br />
Congress intended to be patent eligible.<br />
Ananda Chakrabarty 19 University medical research Machine-or-transformation test finds no support in the statute and is bad policy.<br />
Prometheus Laboratories 20<br />
Manufacturer of pharmaceutical,<br />
medical treatment and diagnostic<br />
processes<br />
Court’s interpretation of section 101 may have significant ramifications beyond<br />
business methods and may adversely affect the field of medical diagnostic and<br />
treatment processes.<br />
Monogram Biosciences, Inc. et al. 21<br />
Emerging field of personalized<br />
medicine, using molecular diagnostic<br />
tests to correlate genetic and<br />
molecular biomarkers with clinically<br />
useful disease characteristics<br />
Federal Circuit erred in holding that a process must be tied to a particular<br />
machine or transformation. This should not be the sole test. Nonphysical<br />
processes should not be excluded.<br />
Medtronic, Inc. 22 R&D of medical technology Machine-or-transformation test would adversely affect medical technology innovation.<br />
Such a test would render significant medical advances patent ineligible.<br />
Pharmaceutical Research and<br />
Manufacturers of America 23<br />
Biotechnology Industry Organization<br />
et al. 11<br />
Knowledge Ecology International 24<br />
Pharmaceutical and biotechnology<br />
industry<br />
Biotech and medical technology<br />
industries<br />
Advocate of new incentive and<br />
financing models for biomedical<br />
information<br />
Court should not adopt a new test for the boundaries of section 101. Medical<br />
processes have long been protected.<br />
Bilski test is not appropriate for determining patent eligibility of biotechnology<br />
and medical technology under section 101.<br />
It is not necessary to fashion an overly broad definition of patentable subject<br />
matter merely to save medical innovations from an imagined and speculative<br />
danger.<br />
Adamas Pharmaceuticals et al. 25 Biomarkers and pharmaceuticals Problematic business method patents should be eliminated. Machine-ortransformation<br />
test violates NAFTA and the 1994 TRIPS Agreement. This test<br />
directly over-rules Congress’s choice (35 USC section 287(c)) to maintain broad<br />
subject-matter coverage for health care–related technology.<br />
American Medical Association et al. 26<br />
Medical profession; physicians and<br />
geneticists<br />
Bilski’s claims are not directed to technology. Machine-or-transformation test<br />
must remain secondary and cannot supplant this court’s requirement that<br />
claims address a technology or the court’s pre-emption standard. Machine-ortransformation<br />
test must be allowed to vary with each particular case.<br />
Impact on life science technologies<br />
In Bilski, four Supreme Court justices unequivocally<br />
indicated that nascent technologies, such as<br />
biotech and pharmaceutical processes, are patent<br />
eligible. This plurality expressed appreciation for<br />
technological progress and acknowledged that<br />
“unforeseen innovations such as computer programs”<br />
are patent eligible 9 . Justice Kennedy reasoned<br />
that the machine-or-transformation test<br />
may be an appropriate test for evaluating the patent<br />
eligibility of processes of the Industrial Age<br />
but should not be the sole test for newer types<br />
of inventions, such as medical diagnostic techniques.<br />
Interestingly, Justice Kennedy was careful<br />
to point out that he was “not commenting<br />
on the patentability of any particular invention,<br />
let alone holding that any of the above-mentioned<br />
technologies from the Information Age<br />
should or should not receive patent protection.”<br />
Regarding limiting interference with the development<br />
of nascent technologies, such as biotechnology<br />
and biopharmaceuticals, the court<br />
indicated that some types of inventions “raise<br />
special problems in terms of vagueness and suspect<br />
validity” and could “put a chill on creative<br />
endeavor and dynamic change.”<br />
In dramatic contrast, however, Justice<br />
Stevens’ concurrence (joined by Justices<br />
Breyer, Ginsburg and Sotomayor), in a separate<br />
47-page opinion, “strongly disagree[d]<br />
with the court’s disposition of this case.”<br />
Justice Stevens expressed great concern that<br />
the court “never provides a satisfying account<br />
of what constitutes an unpatentable abstract<br />
idea” and indicated that business method<br />
patents are per se unpatentable even though<br />
Bilski’s claims and application materials presented<br />
concrete parameters that may have<br />
amounted to more than an abstract idea or<br />
generalized concept. Justice Stevens cited<br />
English and early American patent jurisprudence<br />
and legislation as supportive of the<br />
opinion, concluding that the scope of patenteligible<br />
subject matter is “broad” but not limitless<br />
because, according to history, neither the<br />
patent statute nor patent law was intended to<br />
include business methods. Interestingly, biotech<br />
or pharmaceutical processes were not<br />
differentiated from business methods in the<br />
opinion, and it remains unclear to what extent<br />
such inventions could be distinguished, sufficient<br />
to survive Stevens’ per se ban.<br />
nature biotechnology volume 28 number 8 august 2010 803
patents<br />
© 2010 <strong>Nature</strong> America, Inc. All rights reserved.<br />
The dissenting justices agreed with the majority<br />
that the machine-or-transformation test was<br />
not the exclusive test for method claim patentability,<br />
but they went further, indicating that<br />
business methods are categorically excluded<br />
from patentable subject matter. Justice Stevens<br />
indicated that the court should have held “that<br />
Petitioners’ claim is not a ‘process’ within the<br />
meaning of Section 101 because methods of<br />
doing business are not, in themselves, covered<br />
by the statute.” Regarding the majority opinion’s<br />
holding that the patentability of business<br />
methods was clear from a reading of the satute,<br />
Stevens asserted that Congress did not explicitly<br />
state that it was amending and expanding<br />
the patent statute to include business methods;<br />
thus, he wrote, it was improper for the court to<br />
make such a presumption. Justice Stevens did<br />
not indicate how business method patents are<br />
categorically distinct from other forms of patent<br />
protection (for example, life science processes<br />
or therapeutic processes) but rather expressed<br />
“serious doubts” about whether business<br />
method patents are needed to encourage business<br />
innovation. It is unclear to what extent a<br />
safe harbor defense to those alleged of infringement<br />
of a business method claim applies to biotech<br />
or pharmaceutical businesses. The dissent<br />
therefore encompasses life science methods and<br />
Stevens’ logic applies equally well to biotech and<br />
pharmaceutical method patents vis-à-vis therapeutic<br />
innovations, making it critical for the<br />
industry to consider how each of their process<br />
inventions encourage medical innovations.<br />
Justice Breyer filed a separate concurring<br />
opinion, joined by Justice Scalia, indicating<br />
that agreement was reached by all of the<br />
12<br />
1<br />
Against MoT test<br />
Support MoT test<br />
Figure 2 Amicus briefs from biotech and pharma sector supporting or against Bilski machine-ortransformation<br />
test. MoT, machine-or-transformation.<br />
justices on at least four points: (i) the statute<br />
is broad but has some narrow limits; (ii) the<br />
machine-or-transformation is a useful test;<br />
(iii) the machine-or-transformation test is not<br />
to be misunderstood as the governing test; and<br />
(iv) by no means is everything that produces a<br />
“useful, concrete and tangible result” a patenteligible<br />
process.<br />
Regarding the breadth of patent-eligible subject<br />
matter, Justice Breyer considered the issue<br />
at oral argument wherein he indicated, “…every<br />
successful businessman typically has something.<br />
His firm wouldn’t be successful if he didn’t have<br />
anything others didn’t have…—and it’s new, too,<br />
and it’s useful, made him a fortune—anything<br />
that helps any businessman succeed is patentable<br />
because we reduce it to a number of steps,<br />
explain it in general terms, file our application,<br />
granted…” to which the attorney answered yes,<br />
what was described by Justice Bryer is potentially<br />
patentable. The Justice was also concerned that<br />
by simply assigning a set of instructions to a<br />
computer, and including the computer in the<br />
patent, an otherwise unpatentable process<br />
would be rendered patentable, asking, “how<br />
you are going to later, down the road, deal with<br />
the situation of all you do is get somebody who<br />
knows computers, and you turn every business<br />
patent into a setting of switches on the machine<br />
because there are no businesses that don’t use<br />
those machines.” This concern was directly<br />
addressed by Judge Rader, in the Bilski dissent<br />
at the Federal Circuit, wherein he focused the<br />
court not on patent ineligibility but rather on<br />
the fundamental inquiry of determining if an<br />
invention was worthy of patent protection (e.g.,<br />
if an invention is novel and not obvious).<br />
Important pending life sciences cases<br />
Following the Federal Circuit’s decision in<br />
Bilski, several cases were decided based solely<br />
on the machine or transformation test. Parties<br />
whose patent claims were held to be invalid<br />
under Bilski will take advantage of the change<br />
in law and seek reversal of these decisions.<br />
One such case is Association for Molecular<br />
Pathology v. USPTO (hereinafter, AMP),<br />
wherein the patent claims at issue are related to<br />
isolated DNA containing all or portions of the<br />
BRCA1 and BRCA2 gene sequence and methods<br />
for comparing or analyzing BRCA1 and<br />
BRCA2 gene sequences to identify the presence<br />
of mutations correlating with a predisposition<br />
to breast or ovarian cancer 10 . In a decision that<br />
radically changed the law, the court held that<br />
the step of isolating or purifying DNA does not<br />
sufficiently change the genetic sequence found<br />
in nature to make a claim to the gene per se<br />
patent eligible and that comparisons of DNA<br />
sequences are abstract mental processes, and<br />
thus not patent eligible. The court discussed<br />
abstract ideas, referring to the Federal Circuit’s<br />
opinion in Bilski, and applied the machine-ortransformation<br />
test to invalidate the process<br />
claims. In deciding AMP, the court discussed<br />
and distinguished another critical case,<br />
Prometheus Laboratories v. Mayo 11 .<br />
Prometheus Laboratories owns patents<br />
covering a method to optimize dosage of two<br />
drugs useful for autoimmune diseases, which<br />
involves administering a drug at certain dosage,<br />
detecting the concentration of certain metabolites<br />
and then comparing the value to a preset<br />
threshold value and subsequently increasing<br />
or decreasing the drug dosage accordingly.<br />
The Federal Circuit considered that this diagnostic<br />
process based on a correlation between<br />
drug metabolites level and drug efficacy and<br />
toxicity was patent eligible because, consistent<br />
with In re Bilski, a claimed process is patenteligible<br />
if the claimed process is transformative<br />
(e.g., citing the administering step and various<br />
chemical and physical changes of the drug’s<br />
metabolites that enable their concentrations<br />
to be determined). The court reasoned that<br />
determining the levels of drug metabolites was<br />
per se transformative because drug metabolite<br />
levels cannot be determined by mere inspection.<br />
And because these transformations were<br />
central to the invention, according to the court,<br />
the process was found to be patent eligible and<br />
the patent was held valid. The court provided<br />
no guidance as to when the interaction of a<br />
drug metabolite with the human body is a<br />
natural phenomenon.<br />
In Bilski, Justice Kennedy discusses the technological<br />
aspects of the Industrial Age and the<br />
Information Age, suggesting that the differences<br />
between the two periods provides insight<br />
804 volume 28 number 8 august 2010 nature biotechnology
patents<br />
© 2010 <strong>Nature</strong> America, Inc. All rights reserved.<br />
into how inventions are reduced to “physical<br />
or tangible form 12 .” Justice Kennedy seemed<br />
to be concerned that adoption of a single test<br />
—the machine-or-transformation test—could<br />
retard innovation by “creating uncertainty as<br />
to the patentability of … advanced diagnostic<br />
medicine techniques…”. This issue is addressed<br />
again later, where Justice Kennedy refers to “the<br />
tension, ever present in patent law, between<br />
stimulating innovation by protecting investors<br />
and impeding progress by granting patents<br />
when not justified by the statutory design 13 .”<br />
This tension is most evident in the field of biotechnology<br />
and biopharmaceuticals.<br />
In deciding AMP, the district court looked to<br />
Prometheus Labs 10 in determining what constitutes<br />
a ‘transformation’ in the biotechnological<br />
arts; for example, if an alleged transformation<br />
is mere preparatory “data gathering,” it falls outside<br />
the “central” focus of the recited method.<br />
Myriad’s patents were directed to methods of<br />
“analyzing” or “comparing” isolated or purified<br />
DNA, not host DNA. Although the district<br />
court recognized the great difficulty in isolating<br />
the subject DNAs, the court characterized<br />
this technical accomplishment as a mere “datagathering<br />
step,” thus invalidating the claimed<br />
methods as being directed to patent-ineligible<br />
subject matter. The district court’s new patent<br />
eligibility test is that to be patent eligible,<br />
isolated material must be “markedly different”<br />
from its naturally occurring counterpart. The<br />
court referred to the Supreme Court landmark<br />
decision in Diamond v. Chakrabarty 14 as precedent<br />
but did not define a “markedly different”<br />
invention. However, the district court went further<br />
and applied a “fundamental qualities” test<br />
to invalidate Myriad’s isolated DNA composition<br />
claims, indicating that a naturally occurring<br />
DNA’s “fundamental quality” is to contain “the<br />
physical embodiment of biological information,”<br />
which is the same “fundamental quality”<br />
as isolated DNA. The court appeared to reason<br />
that because both forms of DNA shared this<br />
quality, the isolated DNA was not sufficiently<br />
different from the naturally occurring DNA to<br />
render it patent eligible—a sweeping conclusion<br />
that draws into question the validity of thousands<br />
of patents susceptible to the application<br />
of similar logic.<br />
It is also important to remember the questions<br />
raised by the court in Lab Corp. v. Metabolite 5<br />
in attempting to differentiate patent eligible<br />
subject matter from ineligible biotech inventions.<br />
In this case, the Supreme Court declined<br />
to explicitly consider the issue of the patent eli-<br />
gibility of claims to a method for detecting the<br />
deficiency of cobalamin or folate by measuring<br />
the level of homocysteine in body fluids. The<br />
Federal Circuit held that the claims were valid<br />
but did not address the issue of patent eligibility<br />
under 35 USC §101. The Supreme Court then<br />
declined to review the decision, with Justices<br />
Stevens, Breyer and Souter dissenting. The<br />
dissenting opinion maintained that the claims<br />
were invalid because they recited only natural<br />
phenomena, which are not patent eligible. The<br />
dissent was compelled by public policy considerations<br />
and indicated that if the correlations<br />
between metabolite levels and disease were<br />
patent eligible, physicians may not be able to<br />
exercise their best judgment or might waste<br />
time, and the cost of healthcare would increase<br />
a result that would outweigh the value of protecting<br />
the invention at issue.<br />
Conclusion<br />
In Bilski, the Supreme Court expanded the<br />
forms of biotech and pharmaceutical inventions<br />
that are patent eligible in the US, holding<br />
that the machine-or-transformation test is<br />
not the sole test for patent eligibility in the US<br />
and the types of patent-eligibile subject matter<br />
are vast. But the Court narrowly avoided a<br />
catastrophe for the biotech and pharmaceutical<br />
industry. A majority of the court declined<br />
to adopt the view that “new technologies may<br />
call for new inquiries” directed to patent eligibility,<br />
which would adapt patent law to inventions<br />
of the Information Age. While the court<br />
unanimously held that Bilski’s process claims<br />
were not patent eligible, it indicated that the<br />
machine-or-transformation test may be useful<br />
for determining whether a method claim<br />
meets the threshold requirements of eligibility.<br />
Thus, universities and companies should consider<br />
providing sufficient evidence to satisfy the<br />
machine-or-transformation test when seeking<br />
to obtain patents.<br />
Although a 5–4 majority held that business<br />
methods are not categorically unpatentable, the<br />
court was a single vote away from denying business<br />
methods patent protection. This is chilling<br />
in view of the implications of such a ruling for<br />
other areas of technology, such as biotech and<br />
pharmaceutical method patenting. The court<br />
refrained from articulating a generic test that<br />
would distinguish a patentable method from<br />
an abstract idea. It remains to be seen how the<br />
USPTO, district courts and the Federal Circuit<br />
will proceed to define a new standard of patent<br />
eligibility designed to accommodate future<br />
innovations such as those emerging in the life<br />
sciences. The courts must provide guidance<br />
to the biotech industry as to what is patentable.<br />
What is clear, however, is that based on<br />
the court’s determination that Bilski’s claims<br />
were unpatentable because they were directed<br />
to abstract ideas, it is essential for the pharmaceutical<br />
and biotech industry to pursue and<br />
obtain method claims of varying scope and<br />
pre-emptively evaluate any available evidence<br />
to address future attacks on their intellectual<br />
property based on Bilski, at least until a medically<br />
important “abstract idea,” which could<br />
include an otherwise patentable invention<br />
under US law, is distinguished by the courts or<br />
the legislature.<br />
acknowledgments<br />
The views expressed are solely the author’s and do not<br />
represent those of Sughrue Mion and its clients, and are<br />
subject to changes in the art and law. The author thanks<br />
An Kang Li and Stuart Levy for their cotributions.<br />
COMPETING FINANCIAL INTERESTS<br />
The author declares no competing financial interests.<br />
1. Langer, E.S. Realistic expectations likely to prevail in<br />
2010. Gen. Eng. News (March 1, 2010).<br />
2. In re Bilski, 545 F.3d 943 (Fed. Cir. 2008) (en banc).<br />
3. Simmons, W.J. Nat. Biotechnol. 27, 245–248<br />
(2009).<br />
4. In re Bilski, 545 F.3d at 954.<br />
5. Diamond v. Diehr, 450 US 175, 185 (1981).<br />
6. Lab Corp. v. Metabolite (Fed. Cir. 2004).<br />
7. Gottschalk v. Benson, 409 US 63 (1972).<br />
8. Parker v. Flook, 437 US 584 (1978).<br />
9. Bilski v. Kappos, 561 US (2010) at 8.<br />
10. Association for Molecular Pathology et al. v. USPTO<br />
et al. 1:09 cv-04515 (SDNY).<br />
11. Prometheus Laboratories v. Mayo Collaborative Servs.,<br />
581 F.3d 1336 (Fed. Cir. 2009).<br />
12. 561 US (2010) - Kennedy, p. 9.<br />
13. 561 US (2010) - Kennedy, pp. 12–13.<br />
14. Diamond v. Chakrabarty 447 US 303 (1980).<br />
15. <br />
16. <br />
17. <br />
18. <br />
19. <br />
20. <br />
21. <br />
22. <br />
23. <br />
24. <br />
25. <br />
26. <br />
nature biotechnology volume 28 number 8 august 2010 805
patents<br />
© 2010 <strong>Nature</strong> America, Inc. All rights reserved.<br />
Recent patent applications in proteomics<br />
Patent number Description Assignee Inventor<br />
US 20100155243<br />
US 20100129842<br />
WO 2010052510<br />
CN 101696238<br />
JP 2010078455<br />
WO 2010035129<br />
WO 2010026742<br />
WO 2010011860<br />
WO 2010010108<br />
US 7653493<br />
JP 2010014689<br />
A method for separating a sample, involving introducing<br />
the sample into a microchannel formed in a module and<br />
separating the sample into sub-samples according to<br />
isoelectric point and into protein components based on<br />
electrophoresis; useful in, e.g., proteomics.<br />
Proteomic analysis of polypeptides for biomarker analysis,<br />
involving reacting two polypeptide samples, each having<br />
reactive analytes, with different labeling reagents of a set<br />
of labeling reagents, mixing, digesting with enzyme and<br />
performing mass analysis.<br />
A method of diagnosing S-adenyl-l-homocysteine<br />
hydrolase deficiency involving determining qualitativequantitative<br />
blood plasma proteomic profile and<br />
diagnosing S-adenyl-l-homocysteine hydrolase<br />
deficiency based on data obtained by the subject method.<br />
The total protein extract of a plant, and a method for its<br />
preparation, comprising phenol and the reducing agents<br />
mercaptoethanol or dithiothreitol; used for proteomics<br />
research on plant tissue samples.<br />
A method for isolating a peptide, e.g., disease marker<br />
protein, from blood, involving performing multidimensional<br />
column chromatography using an amphoteric ion<br />
column to isolate the peptide and performing protein<br />
mass spectrometry.<br />
An apparatus for separating constituents of a complex<br />
protein mixture for proteomic analysis, comprising the<br />
separation of elements having chemical-physical features<br />
such that they can capture proteins belonging to the<br />
determined homogeneous group by adsorption.<br />
A liquid chromatograph for proteomic analysis that<br />
injects a sample solution into an injection valve through<br />
an injection port that is arranged in the flow path of the<br />
injection valve.<br />
A method for determining if a subject of interest has<br />
pre-diabetes or diabetes or is at risk for developing<br />
pre-diabetes or diabetes, or for monitoring the efficacy<br />
of a therapy, comprising comparing a proteomic profile of<br />
a test sample with a reference sample.<br />
A new cell with no or low endogenous dihydrofolate<br />
reductase (DHFR) levels comprising at least two<br />
heterologous vector constructs; useful as a model cell<br />
for production cell proteomics and for manufacturing<br />
proteins.<br />
A system for automatic mass spectroscopy analysis of a<br />
group of proteomic samples, e.g., peptides, comprising a<br />
unit for detecting ions, ion data processing units to receive<br />
the ion data and a material characterization processor.<br />
A method for the determination of melanoma, involving<br />
detecting or quantifying a melanoma marker gene, e.g.,<br />
serum amyloid A2 gene, or melanoma marker protein,<br />
e.g., serum amyloid A2 protein, in a biological sample<br />
extracted from a human.<br />
Baraniuk JN,<br />
Schneider TW<br />
Life Technologies<br />
(Carlsbad, CA, USA)<br />
Rudjer Boskovic<br />
Institute (Zagreb,<br />
Croatia)<br />
Guangdong Academy<br />
of Agricultural Sciences<br />
Crop Research Institute<br />
(Guangdong, China)<br />
Japan Science and<br />
Technology Agency<br />
(Saitama, Japan)<br />
National Research<br />
Council (Rome)<br />
Baraniuk JN,<br />
Schneider TW<br />
Coull JM,<br />
Pappin DJC,<br />
Purkayastha S<br />
Cindric M, Hock K,<br />
Kraljevic Pavelic S,<br />
Sedic M<br />
Chen X, Liang X,<br />
Zhang E<br />
Asajima M,<br />
Fukuda H, Into A,<br />
Kurisaki A<br />
Boccardi C, Citti L,<br />
Mercatanti A,<br />
Parodi O,<br />
Rocchiccioli S<br />
Priority<br />
application<br />
date<br />
Publication<br />
date<br />
2/26/2003 6/24/2010<br />
1/5/2004 5/27/2010<br />
11/5/2008 5/14/2010<br />
10/27/2009 4/21/2010<br />
9/26/2008 4/8/2010<br />
9/29/2008 4/1/2010<br />
GL Sciences (Tokyo) Uzu H, Zhou X 9/2/2008 3/11/2010<br />
Diabetomics<br />
(Beaverton, OR, USA)<br />
Boehringer Ingelheim<br />
Pharma (Ingelheim,<br />
Germany)<br />
Stanford University<br />
(Palo Alto, CA, USA)<br />
Nagalla SR,<br />
Paturi VR,<br />
Roberts CT<br />
Becker E, Florin L,<br />
Kaufmann H,<br />
Studts JM<br />
Brown M,<br />
Chungfat N, Dutta S,<br />
Mathewson S,<br />
Wang EW<br />
Shizuoka Ken Akiyama Y,<br />
Takigawa M<br />
7/23/2008 1/28/2010<br />
7/23/2008 1/28/2010<br />
2/24/2006 1/26/2010<br />
6/6/2008 1/21/2010<br />
Source: Thomson Scientific Search Service. The status of each application is slightly different from country to country. For further details, contact Thomson Scientific, 1800<br />
Diagonal Road, Suite 250, Alexandria, Virginia 22314, USA. Tel: 1 (800) 337-9368 (http://www.thomson.com/scientific).<br />
806 volume 28 number 8 august 2010 nature biotechnology
news and views<br />
Can HIV be cured with stem cell therapy?<br />
Steven G Deeks & Joseph M McCune<br />
Transplantation of human hematopoietic stem cells engineered to lack the viral coreceptor CCR5 confers resistance<br />
to HIV infection in mice.<br />
© 2010 <strong>Nature</strong> America, Inc. All rights reserved.<br />
Antiretroviral therapy has transformed the<br />
treatment of HIV infection, but, despite its profound<br />
successes, it will not halt the relentless<br />
advance of the epidemic. Against this sobering<br />
reality, several promising, recent developments<br />
in the basic-science arena have led<br />
HIV researchers to envision new thera peutic<br />
approaches that would completely eradicate<br />
the virus, effectively ‘curing’ HIV disease. In<br />
an exciting and impressive display of data<br />
published in this issue, Holt et al. 1 provide a<br />
scientific bellwether for the practical implementation<br />
of one such strategy. They show<br />
that CCR5, a human gene often required for<br />
HIV to enter target cells, can be effectively and<br />
permanently disrupted in long-lived, multilineage,<br />
human hematopoietic stem cells (HSCs).<br />
When introduced into mice, these cells generate<br />
an apparently intact human immune<br />
system that is resistant to subsequent infection<br />
with HIV (Fig. 1a). This result raises the<br />
intriguing possibility that HIV-infected individuals<br />
might be cured with a one-time infusion<br />
of autologous, gene-modified HSCs.<br />
The introduction of combination antiretroviral<br />
regimens against HIV in the mid-1990s<br />
was undoubtedly one of the great triumphs<br />
of modern medicine. Almost overnight, those<br />
who could receive and adhere to the therapies<br />
gained a new lease on life. But the passage<br />
of time has revealed the limitations of<br />
these regimens. Because HIV DNA persists<br />
as an integrated genome in long-lived cellular<br />
reservoirs, current antiretroviral drugs are<br />
unlikely to prove curative 2 . In addition, the<br />
therapies require life-long adherence, which<br />
many find challenging, and are often associated<br />
with some short-term and long-term<br />
Steven G. Deeks and Joseph M. McCune are<br />
in the Department of Medicine, University of<br />
California, San Francisco, California, USA.<br />
e-mail: sdeeks@php.ucsf.edu and<br />
mike.mccune@ucsf.edu<br />
toxicity. Moreover, although they suppress<br />
HIV replication in a potent, durable manner,<br />
they do not restore health; for reasons<br />
that remain unknown, treated HIV disease<br />
is attended by chronic inflammation, persistent<br />
T-cell dysfunction and a shortened<br />
life expectancy 3,4 . Finally, and perhaps most<br />
importantly, antiretroviral therapies and<br />
their management are expensive and hard to<br />
deliver on a worldwide basis. It is now apparent<br />
that the number of HIV-infected people<br />
will continue to eclipse the number that can<br />
be successfully treated. To stop the epidemic<br />
and to provide care for all, a fundamentally<br />
different approach is needed.<br />
Gene therapy with HSCs<br />
The concept of HSC-based gene therapy for<br />
HIV disease emerged in the epidemic’s first<br />
decade, when effective antiretroviral regimens<br />
were nonexistent. Multiple advances in delivering<br />
and expressing transgenes in eukaryotic<br />
cells suggested that therapeutic applications<br />
were within reach 5 . Baltimore coined the term<br />
“intracellular immunization” to describe the<br />
introduction of HIV resistance genes into<br />
HSCs to allow long-term repopulation of the<br />
host with progeny cells that would be impervious<br />
to HIV 6 . By the late 1980s, startup biotech<br />
companies were isolating and preparing<br />
human HSCs for transplantation, devising<br />
techniques and vectors to genetically modify<br />
the cells, and conducting preclinical testing 7 .<br />
During the same period, studies of HIV<br />
pathogenesis were generating data that begged<br />
for a therapeutic approach that went beyond<br />
antiretroviral drugs. On the one hand, it<br />
became clear that CD4 + T-cell depletion, the<br />
hallmark of HIV disease, was caused not simply<br />
by destruction of late-stage CD4 + T effector<br />
cells but also by the host’s inability to maintain<br />
progenitor cells, including HSCs, intrathymic<br />
T progenitor cells and central memory T cells<br />
in the periphery 8 (Fig. 1b). On the other hand,<br />
it was recognized that HIV can persist within<br />
multiple lineages of long-lived cells, including<br />
T cells and cells of the myeloid lineage (some of<br />
which appear to be progenitor cells) 2,9 . Taken<br />
together, these observations underscored the<br />
need to confer HIV resistance to both progenitor<br />
cells and their progeny.<br />
Early attempts to engineer HIV resistance<br />
into hematopoietic progenitor cells encountered<br />
insurmountable hurdles: the scientific and<br />
practical constraints of HSC-based therapies<br />
were substantial; protocols for genetic modification<br />
of HSCs were inefficient and cytotoxic;<br />
the preclinical animal models were inadequate;<br />
and the choice of anti-HIV genes was driven<br />
more by convenience (and/or patent considerations)<br />
than by data 7 . Moreover, it proved<br />
difficult to devise a business model that could<br />
support the introduction of such a dramatically<br />
different, untested and potentially toxic form of<br />
therapy into the clinic. More recently, however,<br />
two important developments have prompted<br />
a reevaluation of HSC-based therapy for HIV:<br />
a critical target—the cell-surface receptor<br />
CCR5—was identified, and an HIV-infected<br />
individual was reported to be virus free in<br />
the absence of antiretroviral medications 20<br />
months after receiving a transplant of CCR5-<br />
defective allogeneic HSCs 10 .<br />
Targeting the Achilles’ heel of HIV<br />
To enter cells, HIV must bind to either CCR5 or<br />
CXCR4, chemokine receptors present on many<br />
immune cells 11 . The vast majority of transmitted<br />
viruses use CCR5 (R5 variants). As the disease<br />
progresses, HIV evolves and often, but not<br />
always, expands its co-receptor preference to<br />
include CXCR4 (X4 variants). A small fraction<br />
of people carry a 32-base-pair deletion in the<br />
CCR5 gene, leading to a truncated gene product,<br />
CCR5 ∆32. Those who are heterozygous<br />
for CCR5 ∆32 have delayed disease progression<br />
after they acquire HIV, whereas homozygotes<br />
rarely acquire HIV 11 . Although lack of<br />
nature biotechnology volume 28 number 8 August 2010 807
news and views<br />
© 2010 <strong>Nature</strong> America, Inc. All rights reserved.<br />
a<br />
b<br />
Human<br />
HSPCs<br />
HSC<br />
CCR5 knockout<br />
with ZFNs<br />
No CCR5<br />
modification<br />
CLP<br />
M/E<br />
Bone marrow<br />
ITTP<br />
Transplant<br />
HSPCs into<br />
NOG mice<br />
DP<br />
Thymus<br />
CCR5 may be associated with increased risk<br />
of developing serious sequela of some uncommon<br />
infections 12 , it does not seem to affect life<br />
expectancy and may even be associated with a<br />
reduced risk of certain inflammatory diseases.<br />
Once the role of CCR5 became clear in the late<br />
1990s, the pharmaceutical industry devoted<br />
tremendous resources to the development<br />
of small-molecule inhibitors, one of which,<br />
maraviroc (Selzentry), is highly effective, welltolerated<br />
and now FDA approved.<br />
This important set of observations inspired<br />
several groups to pursue CCR5-targeted gene<br />
therapy 13,14 . One highly innovative approach<br />
relied on engineered zinc-finger nucleases<br />
specific for the CCR5 gene 15 . Such ‘molecular<br />
scissors’ can be delivered to cells ex vivo using<br />
methods such as integrase-defective lentiviral<br />
vectors, adenoviral vectors and plasmid DNA<br />
nucleofection. After specific binding of a pair<br />
of zinc-finger nucleases to the CCR5 gene, a<br />
double-stranded DNA break is introduced<br />
and then repaired by pathways that include<br />
SP4<br />
SP8<br />
Tissue myeloid cells<br />
Challenge with<br />
CCR5-tropic HIV<br />
HSPC/thymusmediated<br />
expansion<br />
of peripheral<br />
CD4 + T cells<br />
CD4M<br />
CD4N<br />
CD8N<br />
CD8M<br />
HIV-resistant<br />
immune cells<br />
Low viremia<br />
High viremia<br />
HIV-mediated<br />
destruction of<br />
immune cells<br />
CD4E<br />
CD4E<br />
CD8E<br />
CD8E<br />
Peripheral lymphoid system<br />
Figure 1 Reconstitution of an HIV-resistant lymphoid and myeloid system in an experimental model.<br />
(a) Holt et al. 1 isolated human hematopoietic stem/progenitor cells (HSPCs) and used zinc-finger<br />
nucleases (ZFNs) to disrupt the CCR5 gene, which is often required for the entry of HIV into target<br />
cells. Mice that were successfully engrafted with CCR5-disrupted HSPCs tolerated infection with<br />
HIV, whereas those engrafted with unmodified HSPCs exhibited loss of CD4 + T cells and high-level<br />
viremia. (b) Long-lived, multilineage hematopoietic stem cells (HSCs) give rise to common lymphocyte<br />
progenitors (CLPs) and progenitors of the myelo-erythroid (M/E) lineages. CLPs move through the<br />
thymus and differentiate through a series of stages, from CD3 – CD4 + CD8 – intrathymic T progenitor<br />
(ITTP) cells to CD3 +/– CD4 + CD8 + double positive (DP) thymocytes to CD3 + thymocytes that are single<br />
positive for CD4 (SP4) or CD8 (SP8) to circulating naïve (N), effector (E), and memory (M) CD4 + or<br />
CD8 + T cells. All of the cell stages colored in red can be directly or indirectly disabled by HIV infection.<br />
error-prone nonhomologous end-joining. This<br />
can create a permanent gene disruption that is<br />
passed to daughter cells in the absence of persistent<br />
transgene expression. The end result is<br />
the functional disruption of the CCR5 gene.<br />
Previous work using this approach demonstrated<br />
its feasibility in human peripheral blood<br />
CD4 + T cells 15 , and unpublished data from a<br />
phase 1 trial suggest that autologous CD4 +<br />
T cells modified in this way can be reinfused<br />
safely into HIV-infected individuals (P. Tebas,<br />
University of Pennsylvania, personal communication).<br />
Although of great interest, this strategy<br />
does not disrupt CCR5 in HSCs and thus<br />
would not enable the long-term generation of<br />
both T and myeloid-lineage cells resistant to<br />
HIV infection. Evidence supporting such a leap<br />
came from another quarter.<br />
The Berlin patient: an instructive N of 1<br />
For all of those engaged in the care and treatment<br />
of patients with HIV disease, the world<br />
changed in 2009 with the remarkable story of<br />
a stably treated, HIV-infected individual—the<br />
‘Berlin patient’—who developed acute myeloid<br />
leukemia and was transplanted with HSCs from<br />
a human leukocyte antigen–matched, homozygous<br />
CCR5 ∆32 donor 10 . Combination antiretroviral<br />
therapy was discontinued the day before<br />
the transplant. Twenty months later, HIV could<br />
not be detected in any of the patient’s tissues<br />
examined, even when very sensitive techniques<br />
were used. Given disappointing treatment outcomes<br />
in the past, the HIV research community<br />
is hesitant to use the word ‘cure’, but this<br />
single case could very well be the first example<br />
to fit the bill.<br />
It is important to emphasize that this road<br />
to a cure was arduous and will not be available<br />
to the vast majority of patients. The Berlin<br />
patient underwent fully ablative condi tion ing<br />
with a potentially lethal regimen that included<br />
fludarabine (Fludara), Ara-C, amsacrine<br />
(Amerkin, Amsidyl, Amsidine), cyclosporin,<br />
mycophenolate mofetil (CellCept), antithymocyte<br />
globulin and 4 Gy of total body irradiation.<br />
Graft-versus-host disease developed<br />
during the post-transplant period. Owing to<br />
recurrent acute myeloid leukemia, a second<br />
stem cell transplantation using cells from the<br />
same donor was performed one year after the<br />
first transplant, which again required exposure<br />
to myeloablative therapy, including irradiation.<br />
No one believes that this approach<br />
will soon be used beyond the highly unusual<br />
indications for which allogeneic transplantations<br />
are normally performed. However, the<br />
example of the Berlin patient does provide a<br />
strong rationale for the development of CCR5-<br />
targeted stem cell therapy.<br />
This case also provides fascinating insights<br />
into HIV pathogenesis, some of which may be<br />
relevant to future attempts at HIV eradication.<br />
For example, it is not entirely clear why HIV<br />
did not rebound after combination antiretroviral<br />
therapy was discontinued. According to<br />
genotypic assays, the patient likely harbored<br />
a minority (2.9%) of X4 variant viruses. Also,<br />
host-derived CCR5-expressing myeloid cells,<br />
which are permissive for HIV infection, persisted<br />
for at least five months after the transplant.<br />
Given this volatile combination of<br />
residual CXCR4-tropic virus and long-lived<br />
CCR5-expressing targets, HIV replication and<br />
spread should have continued even as the rest<br />
of the hematopoietic system was being replaced<br />
by homozygous CCR5 ∆32 donor cells.<br />
There are at least two possible explanations<br />
for this surprising result. First, the low-level<br />
X4 variant may have been a poorly fit dualtropic<br />
virus that was dependent on CCR5 for<br />
replication, whereas the number of residual<br />
CCR5-expressing myeloid cells was too low to<br />
support systemic replication of the CCR5-tropic<br />
808 volume 28 number 8 August 2010 nature biotechnology
news and views<br />
© 2010 <strong>Nature</strong> America, Inc. All rights reserved.<br />
variants. Second, it is possible that the myeloablative<br />
preparative regimen itself contributed to<br />
the cure by destroying latently infected T and<br />
myeloid cells and by reducing the numbers of<br />
susceptible activated CD4 + T cells (HIV more<br />
readily infects activated rather than resting<br />
target cells). It is also possible that the ongoing<br />
graft-versus-host disease may have acted to<br />
clear residual susceptible target cells. Detailed<br />
exploration of these and other mechanisms will<br />
surely provide profound insights into almost<br />
any possible intervention aimed at HIV eradication<br />
in the future, and should be pursued.<br />
Disruption of CCR5 in autologous HSCs<br />
The strategy of Holt et al. 1 is related to the<br />
treatment received by the Berlin patient but<br />
is potentially relevant to a larger number of<br />
patients (Fig. 1a). The authors obtained human<br />
CD34 + hematopoietic stem/progenitor cells<br />
(HSPCs) (a population enriched in HSCs)<br />
from umbilical cord blood and stimulated them<br />
to divide with Flt-3 and thrombopoietin. The<br />
cells were nucleofected with plasmids expressing<br />
CCR5-specific zinc-finger nucleases.<br />
A mean of 17% of the cells were successfully<br />
modified, 5–7% of which were estimated to<br />
be homozygous CCR5 – . Modified or unmodified<br />
CD34 + cells were then transplanted<br />
into nonobese diabetic/severe combined<br />
immunodeficient/interleukin 2rγ null (NOD/<br />
SCID/IL2rγ null or NOG) mice, a model known<br />
to support multilineage human hematopoiesis.<br />
As expected, mice engrafted with unmodified<br />
stem cells and subsequently challenged with<br />
CCR5-tropic HIV (Bal) showed high levels<br />
of viremia and loss of peripheral and tissuebased<br />
human T cells. Remarkably, in animals<br />
repopulated with CCR5-disrupted HSPCs, the<br />
virus levels were lower and CD4 + T cells were<br />
not depleted, either in the peripheral blood<br />
or in the hemato lymphoid tissues (e.g., bone<br />
marrow, thymus, spleen and small intestine).<br />
The preservation of human CD4 + T cells in<br />
the experimental group was due to selection<br />
for multiple independent clones of successfully<br />
gene-modified cells. The frequency of<br />
cells containing evidence of CCR5 disruption<br />
increased to >80% in the peripheral blood<br />
and to >40% in multiple tissues by week 12<br />
of infection.<br />
These experiments raise a number of technical<br />
issues and derivative questions. For<br />
instance, do genetically modified HSCs confer<br />
benefit to a mouse that is already infected<br />
(the situation most closely approximating the<br />
therapeutic need in humans)? Does a CCR5-<br />
disrupted hematopoietic compartment confer<br />
protection against infection by X4 viral variants?<br />
Is the CCR5-disrupted immune system<br />
normal? Are there long-term toxicities that will<br />
become evident later? Is off-target cleavage by<br />
the zinc-finger nucleases a significant concern<br />
(e.g., the CCR2 gene may also be targeted by<br />
this nuclease 15 )? These and other issues can be<br />
resolved with further work. In the meantime,<br />
the data of Holt et al. 1 show convincingly that<br />
a relatively small number of gene-modified<br />
HSCs can be rapidly selected to ultimately<br />
confer resistance to HIV in vivo.<br />
Next steps<br />
If stem cell–based gene therapy for HIV is to<br />
become a reality in the clinic, a number of<br />
nontrivial theoretical and practical concerns<br />
must be addressed. First, in the current era,<br />
when clinicians are increasingly concerned<br />
about the ‘toxicity’ of ongoing viral replication,<br />
will patients and their healthcare providers be<br />
willing to allow HIV to replicate at high levels<br />
in the absence of antiretroviral therapy so that<br />
CCR5-deficient cells can be selected? There is<br />
now a growing consensus that HIV replication<br />
causes significant and perhaps irreversible<br />
harm to many organs, including those of the<br />
cardiovascular, renal, hepatic and neurologic<br />
systems 4 , so this approach must be assumed<br />
to carry some risk.<br />
Second, will a partially effective antiviral<br />
intervention (which is what the gene- modified<br />
cells represent) select for the outgrowth of a<br />
resistant virus population, such as X4 variants?<br />
The history of HIV therapeutics is absolutely<br />
clear on this issue: if HIV is allowed to<br />
replicate in the presence of a selective pressure,<br />
it will find a way to survive. This concern<br />
is even more pressing as it is widely believed<br />
that X4 variants are more virulent than R5<br />
variants. Although X4 variants are only infrequently<br />
selected in patients treated with smallmolecule<br />
CCR5 inhibitors (e.g., maraviroc),<br />
this is only true when a fully suppressive regimen<br />
is used from day one. It is not likely that<br />
transplantation of gene-modified HSCs will<br />
be fully suppressive at first, particularly if partially<br />
myeloablative therapy is used.<br />
Third, will ablative therapy be needed to<br />
allow stem cell engraftment and, if so, will<br />
short- and long-term toxicity preclude its use<br />
in those most likely to be offered this intervention<br />
first? Those most in need of aggressive<br />
interventions typically have dual-tropic<br />
virus and are therefore unlikely to respond<br />
to any approach based on disruption of<br />
CCR5 (ref. 16). And with advanced disease,<br />
they have a paucity of HSCs and damaged<br />
hematopoietic microenvironments (such as<br />
bone marrow, thymus and lymph node) that<br />
would normally support the maturation of<br />
modified HSCs.<br />
Finally, the mechanism whereby HIV causes<br />
CD4 + T-cell depletion remains unclear 8 .<br />
Although HIV can clearly kill cells directly,<br />
many if not most cells in an HIV-infected individual<br />
die as a consequence of indirect viral<br />
effects. Generalized activation of the immune<br />
system, for example, is harmful to the function<br />
of T and myeloid cells and to the regeneration<br />
of multiple lineages. These indirect effects may<br />
persist even as the virus is driven to extinction<br />
by the gradual emergence of an HIV-resistant<br />
T-cell population.<br />
Reaching for blue sky<br />
Although the above concerns are daunting,<br />
the epidemic is not going to disappear,<br />
the science of stem cells is becoming more<br />
tractable, sociopolitical forces are forging<br />
new perspectives in healthcare, and now is<br />
not the time to stop. From our perspective,<br />
HSC-based gene therapy for HIV disease may<br />
make a significant impact on the worldwide<br />
epidemic if two goals can be met. First, it is<br />
essential to find a way to deliver these therapies<br />
to all in need, in a manner that is safe,<br />
affordable and generally available around<br />
the world. Many clever approaches to do this<br />
have been proposed in the past, and more<br />
will surely emerge. Second, the preclinical<br />
and clinical development of these strategies<br />
requires a sustainable financial model. Such<br />
a model may involve reprioritization of governmental<br />
efforts, creative plans to incentivize<br />
existing pharmaceutical and healthcare delivery<br />
systems, and global assistance programs<br />
motivated by a common desire for a world<br />
free of HIV. This may seem like a formidable<br />
exercise, but it is worth noting that if oneshot,<br />
modified HSC-based gene therapy can<br />
be made efficacious and accessible in the context<br />
of HIV disease, similar approaches will<br />
likely be applicable to a host of other chronic<br />
diseases, infectious and otherwise. If so, the<br />
treatment paradigms of the future will look<br />
vastly different from today’s. In the same way<br />
that problems associated with the reliance on<br />
fossil fuels have stimulated the development of<br />
alternative strategies of energy delivery, so too<br />
may the ongoing crisis in the HIV epidemic<br />
spark novel approaches to the provision of<br />
healthcare in the future.<br />
Conclusion<br />
The progress in HIV therapeutics over the past<br />
15 years has been tremendous. The life expectancy<br />
of most people who present with HIV<br />
disease today in resource-rich regions is on<br />
the order of decades. Yet antiretroviral drugs<br />
have intrinsic limitations that are unlikely to<br />
be surmounted. What is needed, therefore, is<br />
a ‘game changer’, such as a cure for HIV infection<br />
or an effective vaccine. Could a one-shot<br />
manipulation of HSCs be the answer? We will<br />
nature biotechnology volume 28 number 8 AUGUST 2010 809
news and views<br />
© 2010 <strong>Nature</strong> America, Inc. All rights reserved.<br />
not know unless we continue to move these<br />
new technologies into the clinic. Even if CCR5-<br />
targeted gene therapy is not the ultimate solution,<br />
human studies are certain to be highly<br />
informative with regard to HIV pathogenesis<br />
and human immunology.<br />
ACKNOWLEDGMENTS<br />
The authors wish to acknowledge amfAR, Project<br />
Inform, TAG and the AIDS Policy Project for<br />
supporting and stimulating cross-disciplinary<br />
discussion on the issues outlined in this commentary.<br />
The authors’ work that contributed to this review<br />
was supported by the National Institute of Allergy<br />
and Infectious Diseases (RO1 AI087145 and<br />
K24AI069994 to S.G.D. and R37 AI40312 and DPI<br />
OD00329 to J.M.M.), the University of California,<br />
San Francisco (UCSF) Center for AIDS Research<br />
(P30 MH59037), the UCSF Clinical and Translational<br />
Science Institute (UL1 RR024131), the Harvey V.<br />
Berneking Living Trust and amfAR. J.M.M. is a<br />
recipient of the National Institutes of Health (NIH)<br />
Director’s Pioneer Award Program, part of the NIH<br />
Roadmap for Medical Research.<br />
Microarrays in the clinic<br />
Guy W Tillinghast<br />
Clinical application of gene expression microarrays<br />
1 and other ’omics technologies is widely<br />
expected to usher in a new era of personalized<br />
medicine. But although DNA microarrays are<br />
beginning to be used in patient care 2,3 , progress<br />
has been slow, in part because of analytic<br />
challenges and concerns about accuracy and<br />
reproducibility. In this issue, the MAQC consortium<br />
presents the results of a large study,<br />
MAQC-II 4 , to evaluate methods for building<br />
genomic classifiers—software programs that<br />
convert microarray profiles of an individual<br />
sample into a prediction, such as membership<br />
in a clinical class. The results show that<br />
microarray algorithms can be reliable enough<br />
to justify clinical application, at least within<br />
certain contexts. More broadly, the findings<br />
of MAQC-II on microarray classifiers may<br />
be useful for analyzing data from other highthroughput<br />
assays.<br />
Existing clinical predictors have well-known<br />
limitations, especially with respect to complex<br />
diseases such as cancer. Given two individuals<br />
who present identical clinical parameters, one<br />
Guy Tillinghast is at the Riverside Cancer Care<br />
Center, Newport News, Virginia, USA.<br />
e-mail: guy.tillinghast@rivhs.com<br />
COMPETING FINANCIAL INTERESTS<br />
The authors declare competing financial<br />
interests: details accompany the full-text HTML<br />
version of the paper at http://www.nature.com/<br />
naturebiotechnology/.<br />
1. Holt, N. et al. Nat. Biotechnol. 28, 839–847 (2010).<br />
2. Siliciano, J.D. et al. Nat. Med. 9, 727–728 (2003).<br />
3. Kuller, L.H. et al. PLoS Med. 5, e203 (2008).<br />
4. Phillips, A.N., Neaton, J. & Lundgren, J.D. AIDS 22,<br />
2409–2418 (2008).<br />
5. Friedman, A.D., Triezenberg, S.J. & McKnight, S.L.<br />
<strong>Nature</strong> 335, 452–454 (1988).<br />
6. Baltimore, D. <strong>Nature</strong> 335, 395–396 (1988).<br />
7. Rossi, J.J., June, C.H. & Kohn, D.B. Nat. Biotechnol.<br />
25, 1444–1454 (2007).<br />
8. McCune, J.M. <strong>Nature</strong> 410, 974–979 (2001).<br />
9. McCune, J.M. Cell 82, 183–188 (1995).<br />
10. Hutter, G. et al. N. Engl. J. Med. 360, 692–698<br />
(2009).<br />
11. Moore, J.P., Kitchen, S.G., Pugach, P. & Zack, J.A.<br />
AIDS Res. Hum. Retroviruses 20, 111–126 (2004).<br />
12. Glass, W.G. et al. J. Exp. Med. 203, 35–40 (2006).<br />
13. DiGiusto, D.L. et al. Sci. Transl. Med. 2, 36ra43<br />
(2010).<br />
14. Shimizu, S. et al. Blood 115, 1534–1544 (2010).<br />
15. Perez, E.E. et al. Nat. Biotechnol. 26, 808–816<br />
(2008). w<br />
16. Hunt, P.W. et al. J. Infect. Dis. 194, 926–930 (2006).<br />
The MicroArray Quality Control (MAQC) consortium has evaluated methods<br />
for making clinically useful predictions from large-scale gene expression data.<br />
may respond to a therapy whereas the other may<br />
not. In principle, genome-wide data should be<br />
able to discriminate between them. The most<br />
common goals of a clinical test are to make a<br />
diagnosis or to determine an appropriate therapy.<br />
In light of statistical considerations, these<br />
goals depend on the prevalence of a disease,<br />
suggesting that clinical DNA microarray tests<br />
will augment, and not supplant, other clinical<br />
information. Thus, a possible strategy would<br />
be to first use traditional clinical predictors to<br />
broadly identify patients who might benefit<br />
from a treatment, and to then use an expensive<br />
assay, such as a microarray, to eliminate<br />
those for whom the treatment is unlikely to<br />
be effective.<br />
Despite this promise, DNA microarrays have<br />
not been rapidly adopted in clinical practice.<br />
One reason is the noise that results from analyzing<br />
thousands of genes, which can lead to<br />
false predictions. Consequently, microarrays<br />
have been criticized because studies of the<br />
same clinical groups using different microarray<br />
measurements or analytic methods have<br />
often yielded dissimilar lists of differentially<br />
expressed genes. A second concern is the inherent<br />
error in the technology. Error stems from<br />
high background at the bottom of the dynamic<br />
range, saturation at the top of the dynamic<br />
range, and nonlinearity, at least with measurements<br />
of some transcripts.<br />
Many statistical methods have been developed<br />
to address these challenges, including<br />
approaches for grouping samples and genes,<br />
data normalization schemes to allow meaningful<br />
comparisons across samples, multiple testing<br />
procedures to select differentially expressed<br />
genes and ‘cross-validation’ methods for using<br />
samples to train prediction algorithms while<br />
reducing bias. These methods are applied<br />
sequentially to transform massive data sets of<br />
raw microarray gene expression profiles into<br />
clinically useful classifiers (Fig. 1a). As the<br />
optimal combination of methods is difficult<br />
to determine, MAQC-II sought to evaluate<br />
approaches to building classifiers.<br />
Clinical use of microarrays is particularly<br />
challenging owing to the variability of<br />
the arrays themselves and to the variability<br />
between patients and between laboratories<br />
performing the analyses. These effects fall<br />
under the rubric of ‘batch effects’ and cause<br />
false positives. Moreover, before MAQC-II, it<br />
had not been clear whether classifiers trained<br />
on an initial data set would be able to make<br />
accurate predictions based on completely<br />
independent samples collected at a later date.<br />
The five-step process for building a classifier<br />
in MAQC-II involved designing the experiment,<br />
collecting microarray data, creating a predictive<br />
model, validating the model internally with<br />
the training samples and validating the model<br />
externally with new samples obtained independently<br />
from the training data. MAQC-II<br />
enlisted 36 teams of data analysts within government<br />
agencies, academia and industry. The<br />
teams were given six microarray data sets and<br />
charged with predicting 13 ‘endpoints’ potentially<br />
relevant to clinical or preclinical applications.<br />
The data sets included toxicological<br />
studies of chemicals on rodents and expression<br />
profiles of human cancer patients. In total, the<br />
teams built >30,000 classifiers using hundreds<br />
of combinations of analytic methods. A team of<br />
referees comprising biostatisticians and experienced<br />
data analysts chose one ‘candidate’ model<br />
that was expected to have the best performance<br />
for each endpoint from among models nominated<br />
by each of the 36 teams.<br />
Next, the consortium analyzed how well<br />
the models classified samples. Performance<br />
was measured using several metrics, but the<br />
one most familiar to clinicians is the receiver<br />
operating characteristic area under the curve<br />
(AUC), a metric that varies between 0 and<br />
1, where 0.5 indicates performance no better<br />
than chance and 1 means that all samples<br />
are correctly classified and none misclassified.<br />
For most of the endpoints, the candidate<br />
810 volume 28 number 8 AUGUST 2010 nature biotechnology
news and views<br />
a<br />
b<br />
AUC = 0.991<br />
AUC = 0.956<br />
AUC = 0.787<br />
AUC = 0.615<br />
Tissue sample<br />
Microarray<br />
Remove<br />
batch<br />
effects<br />
Classifier<br />
Normalize<br />
Select<br />
features<br />
Prediction<br />
Train<br />
algorithm<br />
Process evaluated in MAQC-II<br />
Treatment plan<br />
Internal<br />
validation<br />
True-positive rate (sensitivity)<br />
False-positive rate (1 – specificity)<br />
© 2010 <strong>Nature</strong> America, Inc. All rights reserved.<br />
Figure 1 Using microarrays to make clinical predictions. (a) Current clinical decision-making processes can be refined by gene expression–based<br />
predictions generated by microarray classifiers (top). MAQC-II evaluated methods for constructing classifiers (bottom). Constructing a classifier from<br />
raw microarray data requires processing the data using a sequence of analytic steps (colored boxes). Many different approaches have been developed to<br />
solve each step (represented as dots above each box). In MAQC-II, >30,000 classifiers were constructed to test different combinations of analytic steps<br />
to predict 13 clinical and preclinical ‘endpoints’. (b) Curves showing the range of performance of classifiers developed for different data sets as part of<br />
MAQC-II. Performance is quantified using AUC. Data sets are characterized by the ratio of positive to negative samples in the cohort (P/N). Classifiers<br />
performed well for some endpoints, such as the sex of patients. The ~400 genes exclusively present on the Y chromosome made this an easy-to-predict<br />
positive control (red, training set P/N 1.44). The most difficult-to-predict endpoint was the overall survival of multiple myeloma patients, which has<br />
traditionally been difficult for other tests as well (orange, training set P/N 0.34). Classifiers for liver toxicity in rats (blue, training set P/N 0.58) and<br />
pathological complete remission in breast cancer (green, training set P/N 0.34) showed intermediate performance.<br />
microarray-based classifiers performed far<br />
better than chance on the independent validation<br />
data set, with a range of 0.62–0.99.<br />
Moreover, the performance of the refereeselected<br />
candidate models was better than that<br />
of nominated models, suggesting that expert<br />
advice can enhance the modeling outcome.<br />
Notably, classifier performance was found<br />
to depend heavily on the endpoint being predicted<br />
(Fig. 1b). However, it is evident from<br />
inspecting the data that there is a linear correlation<br />
between the AUC performance and<br />
the ratio of positive to negative samples in the<br />
cohort (‘training set P/N’). The composition of<br />
the training set is known to affect classification<br />
performance, and extreme imbalance, such as<br />
with the breast cancer and multiple myeloma<br />
endpoints (Fig. 1b, orange and green), may have<br />
adversely affected performance. Alternatively,<br />
the genetics of neuroblastoma and certainly<br />
the rodent data sets may be less variable and<br />
hence more tractable to modeling (Fig. 1b,<br />
blue). Moreover, genetic variation typically<br />
accumulates over time, making the genomes<br />
of the patients with breast cancer and multiple<br />
myeloma more variable than those with neuroblastoma<br />
and therefore less consistent with the<br />
reference genome from which the microarray<br />
platforms were constructed. These substantial<br />
differences in endpoints may have affected the<br />
validation AUC results.<br />
Several findings from MAQC-II may help<br />
bring the technology closer to clinical use.<br />
Microarray experiments should be designed<br />
to minimize batch effects, such as those introduced<br />
by different laboratories or material<br />
lots. There should be a plan for detecting such<br />
effects (e.g., by testing for unexpected genes<br />
that are expressed in different experimental<br />
conditions), and the same statistical test used<br />
to detect differentially expressed genes should<br />
be applied to all samples 5 . A gene that is differentially<br />
expressed in a pattern that matches<br />
the grouping of samples into batches should<br />
be examined closely and probably not used<br />
in a classifier.<br />
Related to batch effects, quality control metrics<br />
should be used to distinguish variation in<br />
gene expression caused by laboratory artifact<br />
rather than by clinical phenotype. Quality control<br />
metrics are formulated to assess specific<br />
aspects of laboratory processing, such as RNA<br />
degradation or faulty equipment. These metrics<br />
can be used to adjust gene expression measurements<br />
or to identify problem microarrays. In<br />
the MAQC-II project, rather than adjusting<br />
measurements to account for laboratory noise,<br />
data analysts did not use samples that appeared<br />
to have quality control problems.<br />
Several factors were found to influence<br />
classifier performance more than the type of<br />
algorithm used. One of these is the inherent<br />
difficulty of the biological phenomena being<br />
predicted. Another is the method for tuning<br />
the algorithm. Inexperience in tuning can be a<br />
major source of bias in the final classifier, especially<br />
if the predictive algorithm is not tuned<br />
for the population of interest. For example, in<br />
a population with low prevalence of a disease,<br />
it may be more desirable to have a test that<br />
makes few false predictions.<br />
The results of MAQC-II highlight two priorities<br />
for future work. First, the field needs<br />
rigorous standards for reporting the steps<br />
used to develop a classifier, its parameters<br />
of use and the appropriate quality metrics.<br />
Examples in the literature 2 may provide useful<br />
starting points. A classifier submitted for<br />
publication or for regulatory approval should<br />
specify how to use it to classify new samples—<br />
for example, the normalization and batch<br />
effect correction procedures to perform, the<br />
essential quality control checks and how to<br />
handle quality control flaws. The final report<br />
of a prediction algorithm should provide the<br />
variance (that is, standard error) of the performance<br />
measure as well as an estimation of<br />
the bias. A prediction report based on analysis<br />
of an individual patient sample should be<br />
accompanied by a report of quality metrics<br />
and their normal values and a report of batch<br />
effect measures that could provide a clinician<br />
with a sense of whether a microarray is within<br />
the range of the samples for which the test<br />
was developed 5 .<br />
Second, methods are needed to combine<br />
microarray predictions with existing clinical<br />
decision-making tools, such as nomograms<br />
(a graphical chart for performing calculations).<br />
In constructing a nomogram, it will be necessary<br />
to determine how to balance the data from<br />
a microarray classifier with traditional clinical<br />
predictors. In addition, approaches should be<br />
developed to handle variability. For instance,<br />
the microarray chips used in MAQC-II have<br />
already been replaced by newer versions.<br />
A key observation of MAQC-II—namely,<br />
that some endpoints seem inherently more<br />
predictable than others, regardless of the<br />
analytic methods used—suggests that gene<br />
expression microarrays may not capture a<br />
nature biotechnology volume 28 number 8 AUGUST 2010 811
news and views<br />
© 2010 <strong>Nature</strong> America, Inc. All rights reserved.<br />
sufficiently rich snapshot of disease physiology.<br />
In such cases, complementary technologies,<br />
which measure mRNA expression,<br />
protein levels, genetic mutation, copy number<br />
variation, gene silencing or regulatory RNA<br />
expression, could be considered. Alternatively,<br />
the best technology may vary by tumor type.<br />
High-throughput sequencing, in particular,<br />
offers advantages over microarrays in that<br />
coverage of the genome is less biased and the<br />
dynamic range is larger 6 . With luck, the results<br />
of MAQC-II will be useful for shepherding<br />
Shaking up genome engineering<br />
KA Tipton & John Dueber<br />
A new method generates genome-scale modified bacteria with<br />
unprecedented ease.<br />
Systematic approaches to mutate and characterize<br />
the function of every gene in a microbe have<br />
been hampered by the need to manually create<br />
thousands of separate strains through tedious<br />
genetic manipulation. In this issue, Warner<br />
et al. 1 describe an approach to create and characterize<br />
rationally modified versions of almost<br />
every gene in Escherichia coli. Using this strategy,<br />
the authors quickly zero in on genes that<br />
influence industrially relevant traits, such as<br />
tolerance to toxins in a biofuel feedstock. The<br />
method enables single genome modifications<br />
to be probed rapidly and comprehensively and<br />
correlated to a phenotype, yielding information<br />
that lays a foundation for gene mapping and for<br />
engineering strains with desired phenotypes.<br />
Until now, systematic phenotyping of mutants<br />
in yeasts 2,3 and E. coli 4 has been accomplished<br />
by Herculean manual efforts to create thousands<br />
of mutant strains, each with a different singlegene<br />
knockout. Although the resulting strain<br />
collections have proven valuable, it remains<br />
a challenge to create, on a genome scale, new<br />
collections of mutants for targeted applications<br />
or to control gene expression levels using<br />
a strong promoter, an inducible promoter or a<br />
low- efficiency ribosome binding site.<br />
In contrast, the method of Warner et al. 1 —<br />
trackable multiplex recombineering (TRMR),<br />
pronounced ‘tremor’ (Fig. 1)—offers a fast<br />
and cheap approach for creating collections of<br />
mutants. Impressively, the authors were able to<br />
KA Tipton and John Dueber are at the<br />
University of California Berkeley, Berkeley,<br />
California, USA.<br />
e-mail: jdueber@berkeley.edu<br />
other high- throughput technologies toward<br />
the clinic as well.<br />
COMPETING FINANCIAL INTERESTS<br />
The author declares no competing financial interests.<br />
1. DeRisi, J.L., Iyer, V.R. & Brown, P.P. Science 278,<br />
680–686 (1997).<br />
2. Dumur, C.I. et al. J. Mol. Diagn. 10, 67–77 (2008).<br />
3. Buyse, M. et al. J. Natl. Cancer Inst. 98, 1183–1192<br />
(2006).<br />
4. The MicroArray Quality Control (MAQC) consortium.<br />
Nat. Biotechnol. 28, 827–838 (2010).<br />
5. Luo, J. et al. Pharmacogenomics J. 10, 278–291<br />
(2010).<br />
6. Schuster, S.C. Nat. Methods 5, 16–18 (2008).<br />
construct libraries containing up- and downregulated<br />
versions of 96% of the genes in the<br />
E. coli genome in one week at a materials cost<br />
of ~$1 per targeted gene.<br />
The first step in TRMR is to obtain thousands<br />
of 189-base-pair oligonucleotides that<br />
target and uniquely identify every E. coli gene.<br />
Each of these oligos consists of a barcode tag<br />
unique to a gene and regions of homology that<br />
E. coli<br />
+<br />
Multiplex<br />
oligonucleotide library<br />
E. coli strains with modified<br />
gene expression levels<br />
flank the targeted gene in the genome. Warner<br />
et al. 1 purchased the oligos, which were made<br />
on a programmable microarray. Next, using<br />
a clever cloning strategy, they appended the<br />
oligos to DNA elements that modulate gene<br />
expression. Attaching the targeting oligos to<br />
the strong P LtetO-1 promoter created a DNA<br />
cassette that was expected to upregulate the<br />
targeted gene after incorporation into the<br />
genome. Conversely, attaching the targeting<br />
oligo to a weak ribosome binding site produced<br />
a DNA cassette that downregulated the<br />
targeted gene. An antibiotic resistance gene<br />
allowed selection for the genetic modifications.<br />
As a result of the DNA synthesis and<br />
manipulation steps, Warner et al. 1 created<br />
two libraries of linear DNA fragments, each<br />
with 4,077 DNA cassettes pooled together in<br />
a single tube.<br />
These libraries of DNA oligonucleotides were<br />
used to modify the E. coli genome by means of<br />
recombineering, a homologous recombination–<br />
based method in E. coli expressing λ phage<br />
recombination factors (λgam, bet and exo) 5 .<br />
Growth on antibiotic medium selects for successful<br />
recombinants, and the sites of recombination<br />
are determined by homology of the<br />
targeting oligos to genomic regions flanking<br />
each gene.<br />
The resulting collections of modified E. coli<br />
strains were then challenged by growth in<br />
environmental conditions of interest. Warner<br />
et al. 1 measured the relative fitness of each<br />
Selection in new<br />
environmental<br />
conditions<br />
Figure 1 TRMR enables genome-scale selection of rational modifications to the expression of single<br />
genes. A multiplex library of oligonucleotides is synthesized to encode a unique barcode tag and regions<br />
of homology flanking individual target genes in the E. coli genome (left). A series of cloning steps<br />
generates linear DNA fragments that contain sequences necessary for up- or downregulating the<br />
expression of each target gene. E. coli are transformed with this library of linear fragments to create a<br />
collection of genetically modified strains (middle, green cells containing a modified genetic network).<br />
The modifications alter the functional linkages between genes. (Lines in the networks represent<br />
linkages, with thickness being the strength of the link. Circles represent genes, with translucency<br />
and a dashed outline representing attenuated expression). The E. coli strain collection is grown<br />
on medium containing an environmental challenge of interest (right). The identities and relative<br />
abundances of individual survivors are determined by sequencing colonies using universal primer<br />
sequences. Alternatively, survivors are determined in bulk by microarray analysis of the barcode tags.<br />
Importantly, the basic TRMR strategy is amenable to rapid iteration such that the most promising gene<br />
modifications are used to seed subsequent cycles of mutation and selection (dotted arrow).<br />
812 volume 28 number 8 AUGUST 2010 nature biotechnology
news and views<br />
© 2010 <strong>Nature</strong> America, Inc. All rights reserved.<br />
modified strain by isolating genomic DNA,<br />
amplifying the barcode tags using PCR and<br />
hybridizing the amplified DNA to a microarray<br />
that contains probes complementary to<br />
each tag. A signal on the microarray identifies<br />
strains that grew. To demonstrate the<br />
approach, the authors selected for growth in<br />
media containing salicin, d-fucose, valine or<br />
methylglyoxyl. These compounds inhibit cell<br />
growth by different mechanisms. Salicin is a<br />
carbon source that normally cannot be metabolized.<br />
d-fucose is an analogue of arabinose<br />
that inhibits the ability of E. coli to metabolize<br />
this sugar. Valine acts as a feedback inhibitor<br />
of growth-limiting leucine and isoleucine biosynthesis.<br />
Methylglyoxal presents an oxidative<br />
stress if present in elevated concentrations.<br />
These conditions demonstrated the effectiveness<br />
of TRMR in identifying gene-trait relationships<br />
and in identifying genes that were<br />
not expected to be involved in resistance to the<br />
given cellular stress, thus supporting the power<br />
of a genome-scale, unbiased approach.<br />
In a particularly challenging and exciting<br />
application of TRMR, Warner et al. 1 grew their<br />
libraries of strains in lignocellulosic hydrolysate<br />
derived from corn stover. Hydrolysates<br />
represent a complex potpourri of molecules<br />
toxic to E. coli. It has been difficult to predict<br />
a priori which genes would best confer resistance<br />
to growth inhibitors in the hydrolysates 6 .<br />
This problem is thus well suited to test the<br />
authors’ methods. Among the modified genes<br />
that conferred improved growth were genes<br />
with expected functions as well as several<br />
with seemingly disparate cellular functions,<br />
including primary metabolism, RNA metabolism,<br />
sugar transporters, secondary metabolism,<br />
vitamin processes and antioxidant activities. In<br />
one notable result, the authors identified the<br />
antioxidant ahpC, a gene not previously linked<br />
to growth on hydrolysates, which, when upregulated,<br />
considerably improved both growth rate<br />
and final biomass levels.<br />
TRMR has many potential uses. Warner<br />
et al. 1 note that it could easily be applied iteratively,<br />
with strains selected after one round of<br />
TRMR used as the starting strains for a second<br />
round, thereby accumulating beneficial<br />
genome alterations (Fig. 1, dotted arrow).<br />
Such iterative processing can take advantage<br />
of the same pool of oligos already synthesized.<br />
Parallel microarray analysis of the barcode<br />
tags present in the selected survivors should<br />
produce additional layers of information about<br />
genetic contributors to fitness. For instance,<br />
the ability to track combinations of alterations<br />
in a stepwise fashion as they accumulate has<br />
the potential to provide snapshots of genetic<br />
interaction data that, if taken at a high enough<br />
frequency, may uncover network connections<br />
in conditions particularly relevant to industrial<br />
and biotechnological settings.<br />
TRMR is also valuable because it identifies<br />
genes and network connections that<br />
could form the basis for further strain optimization.<br />
For instance, a particularly powerful<br />
combination of technologies would<br />
be to first use TRMR to identify relevant<br />
genes and then apply the recently developed<br />
multiplex automated genome engineering<br />
(MAGE) method 7 , which finely tunes the<br />
expression levels of a limited number of<br />
genes. In microbial engineering applications,<br />
such as the creation of a strain of E. coli that<br />
can metabolize lignocellulose sugars, TRMR<br />
should complement existing technologies,<br />
including directed evolution, genome-scale<br />
metabolic modeling and synthetic biology<br />
approaches for redox balancing, flux improvement<br />
and limiting the production of undesirable<br />
and toxic metabolic products.<br />
In addition to TRMR, other approaches<br />
based on genome-wide modifications are<br />
Dendritic cells (DCs) are central players in the<br />
control of immunity and tolerance, and investigation<br />
of their properties is expected to illuminate<br />
many diseases of the immune system<br />
and lead to innovative therapies. Four recent<br />
reports 1–4 in The Journal of Experimental<br />
Medicine mark new progress in our understanding<br />
of the biology of a particular human<br />
DC subset identified by co-expression of<br />
CD141 (thrombomodulin, BDCA-3) and the<br />
increasingly providing scientists with the ability<br />
to generate large, information-rich data sets<br />
from which new genetic information may be<br />
extracted 2–4,8,9 . TRMR heralds an approach to<br />
genetic analyses in which phenotypes are rapidly<br />
mapped to genetic modifications across the<br />
genome, simultaneously producing improved<br />
strains for immediate practical use as well as<br />
data sets enabling future rational creation of<br />
sophisticated strains.<br />
COMPETING FINANCIAL INTERESTS<br />
The authors declare no competing financial interests.<br />
1. Warner, J. et al. Nat. Biotechnol. 28, 856–862<br />
(2010).<br />
2. Giaever, G. et al. <strong>Nature</strong> 418, 387–391 (2002).<br />
3. Kim, D.U. et al. Nat. Biotechnol. 28, 617–623<br />
(2010).<br />
4. Baba, T. et al. Mol. Syst. Biol. 2, 2006.0008 (2006).<br />
5. Datta, S., Costantino, N. & Court, D.L. Gene 379,<br />
109–115 (2006).<br />
6. Mohagheghi, A. & Schell, D.J. Biotechnol. Bioeng. 105,<br />
992–996 (2010).<br />
7. Wang, H.H. et al. <strong>Nature</strong> 460, 894–898 (2009).<br />
8. Tong, A.H. et al. Science 294, 2364–2368 (2001).<br />
9. Mnaimneh, S. et al. Cell 118, 31–44 (2004).<br />
The expanding family of dendritic<br />
cell subsets<br />
Hideki Ueno, A Karolina Palucka & Jacques Banchereau<br />
The recent identification of human CD141 + dendritic cells as a counterpart<br />
of mouse CD8 + dendritic cells may be useful in developing vaccines and<br />
immunotherapies.<br />
Hideki Ueno, A. Karolina Palucka and Jacques<br />
Banchereau are at the Baylor Institute for<br />
Immunology Research and INSERM U899,<br />
Dallas, Texas, USA; A. Karolina Palucka is at<br />
the Sammons Cancer Center, Baylor University<br />
Medical Center, Dallas, Texas, USA; and<br />
A. Karolina Palucka and Jacques Banchereau<br />
are in the Department of Gene and Cell<br />
Medicine and Department of Medicine,<br />
Immunology Institute, Mount Sinai School of<br />
Medicine, New York, New York, USA.<br />
e-mail: jacquesb@baylorhealth.edu<br />
C-type lectin CLEC9A (DNGR-1). Collectively,<br />
the papers show that CD141 + DCs are the<br />
human counterpart of mouse CD8 + DCs. As<br />
mouse CD8 + DCs are important for the induction<br />
of cytotoxic T-lymphocyte responses<br />
through their exceptional capacity to present<br />
exogenous antigens in an HLA class I pathway<br />
(so-called cross-presentation) 5 , this discovery<br />
could have significant clinical impact if human<br />
CD141 + DCs have a similar role.<br />
DCs were discovered in 1973 by Ralph<br />
Steinman as a novel cell type in the mouse<br />
spleen and are now recognized as a group of<br />
related cell populations that efficiently present<br />
antigens. Both mice and humans have two<br />
major types of DC: myeloid DCs (mDCs, also<br />
called conventional or classical DCs), and<br />
plasmacytoid DCs (pDCs). pDCs are considered<br />
the front line in anti-viral immunity as<br />
they rapidly produce abundant type I interferon<br />
in response to viral infection. In their<br />
resting state, pDCs may be important in tolerance,<br />
including oral tolerance 6,7 . pDCs are<br />
nature biotechnology volume 28 number 8 AUGUST 2010 813
news and views<br />
© 2010 <strong>Nature</strong> America, Inc. All rights reserved.<br />
CTL Th cells<br />
Long-lived memory<br />
CD8 + T cells<br />
Langerhans<br />
cells<br />
IL-15<br />
CTLs<br />
Antigen crosspresentation<br />
themselves composed of at least two subsets<br />
with different functional properties 8 .<br />
Similarly, mDCs comprise different subsets<br />
with unique localization, phenotype and functions<br />
(Fig. 1). In human skin, the epidermis<br />
hosts Langerhans cells, whereas the dermis<br />
contains CD1a + DCs and CD14 + DCs. The<br />
latter DC subset is involved in the generation of<br />
humoral immunity, partly through secretion of<br />
interleukin (IL)-12, which stimulates the differentiation<br />
of activated B cells into plasma cells<br />
and also promotes the differentiation of naive<br />
CD4 + T cells into T follicular helper cells 9,10 ,<br />
a CD4 + T-cell subset that promotes antibody<br />
responses. In contrast, Langerhans cells efficiently<br />
prime antigen-specific CD8 + T cells,<br />
possibly by means of IL-15 (ref. 9). The functions<br />
of the predominant CD1a + dermal DCs<br />
are as yet unknown.<br />
Human DCs expressing CD141 were originally<br />
found in blood as a subset of mDCs distinct<br />
from CD1c + mDCs 11 . The new reports 1–4<br />
argue that CD141 + DCs are the human counterpart<br />
of mouse CD8 + DCs on the basis of<br />
results from several different experimental<br />
CD141 + DCs<br />
IL-12?<br />
Protection in vivo<br />
Plasma cells<br />
Dermal<br />
CD14 + DCs<br />
IL-12<br />
Tfh cells<br />
Long-lived<br />
memory B cells<br />
Figure 1 Contribution of human myeloid DC subsets to the regulation of adaptive immunity. The<br />
humoral and cellular arms of adaptive immunity are regulated by different human mDC subsets.<br />
Humoral immunity is preferentially regulated by CD14 + dermal DCs by means of IL-12, which acts<br />
directly on B cells and promotes the development of T follicular helper cells (Tfh). Cellular immunity<br />
is preferentially regulated by Langerhans cells, possibly through IL-15 and a dedicated subset of CD4 +<br />
T cells specialized to help CD8 + T cells (CTL Th cells). Given their capacity to cross-present antigens<br />
to CD8 + T cells, CD141 + DCs are likely to be involved in the development of cytotoxic T-lymphocyte<br />
responses. CD141 + DCs might also be involved in the development of humoral responses through<br />
IL-12 secretion. This hypothesis is supported by mouse in vivo antigen-targeting studies showing that<br />
CD8 + DCs, the mouse counterpart of human CD141 + DCs, can induce both cytotoxic T-lymphocyte and<br />
humoral responses 12,13 , although the mechanisms may be different. It will be important to determine<br />
whether and how CD141 + DCs are related to Langerhans cells and to dermal DCs, and how these DC<br />
subsets shape adaptive immunity.<br />
approaches, including detailed functional and<br />
phenotypic analysis 1,3 , as well as the discovery<br />
of a chemokine receptor expressed on both<br />
cell types 2,4 .<br />
First, like mouse CD8 + DCs, human CD141 +<br />
DCs are present in secondary lymphoid organs<br />
such as tonsils and spleen 1,3 . Further studies<br />
are needed to determine whether they are also<br />
present in tissues.<br />
Second, although human CD141 + DCs do<br />
not express CD8, they share with mouse CD8 +<br />
DCs expression of other surface molecules,<br />
including CLEC9A 1,3,12,13 and the adhesion<br />
molecule, NECL2 (refs. 3,14). NECL2 binds to<br />
class I–restricted T cell–associated molecule,<br />
a cell-surface protein primarily expressed by<br />
natural killer cells, natural killer T cells and<br />
activated CD8 + T cells 14 .<br />
Third, human CD141 + DCs uniquely express<br />
the chemokine receptor XCR1 (refs. 2,4), in<br />
line with the unique expression of XCR1 by<br />
mouse CD8 + DCs shown previously. XCR1<br />
expressed in both human and mouse DCs is<br />
functional, as the cells migrate in response to<br />
the ligand XCL1 (refs. 2,4), a secreted protein<br />
known to be produced by natural killer cells<br />
and activated CD8 + T cells. These observations<br />
suggest a potential for interactions<br />
between human CD141 + DCs/mouse CD8 +<br />
DCs and natural killer cells or CD8 + T cells,<br />
which might be a mechanism involved in the<br />
efficient induction of cytotoxic T lymphocyte<br />
responses. For example, interferon (IFN)-γ<br />
released by natural killer cells and/or CD8 +<br />
T cells might stimulate CD141 + DCs/CD8 +<br />
DCs to secrete more IL-12 (refs. 2,4).<br />
Fourth, all of the new studies 1–4 demonstrate<br />
that human CD141 + DCs are highly efficient in<br />
inducing CD8 + T-cell responses through their<br />
capacity to cross-present exogenous antigens.<br />
This evidence suggests that human CD141 +<br />
DCs participate in the development of cytotoxic<br />
lymphocyte responses in vivo.<br />
Fifth, human CD141 + DCs and mouse CD8 +<br />
DCs express the transcription factors Batf3<br />
and IRF-8 (refs. 1,3), both of which are strictly<br />
required for the development of mouse CD8 +<br />
DCs 5 . In contrast, CD141 + DCs do not express<br />
IRF4 (refs. 1,3), a transcription factor required<br />
for the development of other mouse spleen<br />
CD4 + DCs 5 . Thus, CD141 + DCs and mouse<br />
CD8 + DCs might share a common developmental<br />
pathway.<br />
Finally, two of the studies 1,3 show similarities<br />
between human CD141 + DCs and mouse<br />
CD8 + DCs in the expression of Toll-like<br />
receptors (TLRs). TLRs belong to the family<br />
of pattern recognition receptors through<br />
which DCs sense microbes and dying cells.<br />
Engagement of these receptors by pathogen-<br />
and danger-associated molecular patterns<br />
expressed by microbes and dying cells<br />
triggers DC maturation, a complex series of<br />
events that includes expression of new surface<br />
molecules, secretion of cytokines and a<br />
reduction in antigen capture. Different DC<br />
subsets express different sets of pattern recognition<br />
receptors, particularly in humans,<br />
which provides flexibility in responding to<br />
different microbes.<br />
Similar to mouse CD8 + DCs, human CD141 +<br />
DCs are found to express TLR3 and TLR8,<br />
and stimulation with their respective ligands<br />
(poly I:C and poly U) induces their maturation<br />
and cytokine secretion. In contrast<br />
to the relatively limited TLR expression by<br />
CD141 + DCs, it is known that CD1c + DCs,<br />
another blood mDC subset, express a wide<br />
array, including TLR4, 5 and 7. Whether<br />
human CD141 + DCs express other pattern<br />
recognition receptors, such as NOD-like<br />
receptors and RIG-I-like receptors, has yet<br />
to be determined.<br />
The identification of the human counterpart<br />
of mouse CD8 + DCs opens the possibility<br />
of translating to humans knowledge<br />
814 volume 28 number 8 AUGUST 2010 nature biotechnology
news and views<br />
© 2010 <strong>Nature</strong> America, Inc. All rights reserved.<br />
generated in the mouse. There are still many<br />
infectious diseases for which no efficient vaccines<br />
are available, including AIDS, malaria,<br />
hepatitis C infection and tuberculosis. Most<br />
of these would benefit from the induction of<br />
potent cytotoxic T lymphocytes to eliminate<br />
the infected cells. Similarly, strong cytotoxic<br />
T-lymphocyte responses would be beneficial<br />
in the context of cancer immunotherapy.<br />
Thus, it may be possible to exploit CD141 +<br />
DCs in the ‘DC-targeting’ vaccination strategy,<br />
in which vaccines are generated from<br />
recombinant anti-DC antibodies fused to<br />
selected antigens 15 . Studies in mice have<br />
shown that targeting antigen to DCs in this<br />
manner in vivo results in potent antigenspecific<br />
CD4 + and CD8 + T-cell immunity 15 ,<br />
provided adjuvants are co-administered to<br />
activate the targeted DCs. Indeed, antibodies<br />
to CLEC9 allowed targeting of antigen to<br />
mouse CD8 + DCs in vivo, inducing potent<br />
cytotoxic T-lymphocyte responses when<br />
combined with anti-CD40 administration 12<br />
and potent antibody responses even without<br />
co-administration of adjuvants 13 .<br />
It should be emphasized, however, that<br />
translating mouse immunological data to<br />
the clinic is fraught with uncertainty, as 65<br />
million years of independent evolution have<br />
produced many nuances that distinguish the<br />
human and mouse immune systems 16 . As one<br />
example, other human DCs, such as CD1c +<br />
DCs 1,3 and epidermal Langerhans cells 9 , can<br />
also cross-present antigens. Thus, it remains<br />
to be determined whether and how human<br />
CD141 + mDCs are related to other mDCs<br />
subsets and how all the mDC subsets cooperate<br />
in shaping adaptive immunity.<br />
COMPETING FINANCIAL INTERESTS<br />
The authors declare no competing financial interests.<br />
1. Jongbloed, S.L. et al. J. Exp. Med. 207, 1247–1260<br />
(2010).<br />
2. Bachem, A. et al. J. Exp. Med. 207, 1273–1281<br />
(2010).<br />
3. Poulin, L.F. et al. J. Exp. Med. 207, 1261–1271<br />
(2010).<br />
4. Crozat, K. et al. J. Exp. Med. 207, 1283–1292<br />
(2010).<br />
5. Shortman, K. & Heath, W.R. Immunol. Rev. 234,<br />
18–31 (2010).<br />
6. Goubier, A. et al. Immunity 29, 464–475 (2008).<br />
7. Liu, Y.J. Annu. Rev. Immunol. 23, 275–306 (2005).<br />
8. Matsui, T. et al. J. Immunol. 182, 6815–6823<br />
(2009).<br />
9. Klechevsky, E. et al. Immunity 29, 497–510 (2008).<br />
10. Schmitt, N. et al. Immunity 31, 158–169 (2009).<br />
11. Dzionek, A. et al. J. Immunol. 165, 6037–6046<br />
(2000).<br />
12. Sancho, D. et al. J. Clin. Invest. 118, 2098–2110<br />
(2008).<br />
13. Caminschi, I. et al. Blood 112, 3264–3273 (2008).<br />
14. Galibert, L. et al. J. Biol. Chem. 280, 21955–21964<br />
(2005).<br />
15. Bonifaz, L.C. et al. J. Exp. Med. 199, 815–824<br />
(2004).<br />
16. Mestas, J. & Hughes, C.C. J. Immunol. 172, 2731–<br />
2738 (2004).<br />
nature biotechnology volume 28 number 8 AUGUST 2010 815
esearch highlights<br />
© 2010 <strong>Nature</strong> America, Inc. All rights reserved.<br />
Lung on a chip<br />
Efforts to mimic the<br />
alveolar-capillary<br />
interface—the<br />
fundamental functional<br />
unit of the lung—in<br />
cell culture have been<br />
frustrated primarily<br />
by the challenge<br />
of replicating the<br />
structural and functional<br />
properties of the system<br />
while simulating the<br />
mechanical changes<br />
associated with normal<br />
breathing. Huh et al.<br />
recreate the behavior<br />
of lung tissue in a<br />
microfluidic device<br />
by lining a thin (10 µm), porous and flexible membrane<br />
with human alveolar epithelial cells on one side and human<br />
pulmonary microvascular endothelial cells on the other.<br />
Application and release of a vacuum to two flanking chambers<br />
causes the membrane with its adherent tissue layers to stretch<br />
and then relax to its original size, thus recreating the dynamic<br />
mechanical distortion of the alveolar-capillary interface caused<br />
by breathing. The device reproduces organ-level responses to<br />
bacterial infection and inflammatory cytokines, and its use<br />
suggests that mechanical strain can promote nanoparticleinduced<br />
toxicity. These findings underscore the potential of<br />
the chip for evaluating the safety and efficacy of new drugs for<br />
lung disorders, or the effects of environmental toxins.<br />
(Science 328, 1662–1668, 2010)<br />
PH<br />
miRNAs, Dicer and metastasis<br />
MicroRNAs (miRNAs) play a key role in the pathogenesis of cancer.<br />
Although the overexpression of individual miRNAs is important<br />
in numerous tumors, a global downregulation of miRNA levels is a<br />
hallmark of cancer. Martello et al. now show that members of the<br />
miR-103/107 family suppress the expression of Dicer, the enzyme<br />
responsible for the maturation of pre-miRNAs into miRNAs. Levels of<br />
miR-103/107 are inversely proportional to Dicer abundance in cancer<br />
cell lines and high miR-103/107 expression correlates with metastasis<br />
and poor prognosis in breast cancer. In mouse models of breast cancer,<br />
nonmetastatic cell lines can be converted to an invasive phenotype by<br />
miR-103/107 expression. Therapeutic targeting of the miRNAs with<br />
a specific antisense molecule reduces the number of lung metastases,<br />
making these miRNAs promising targets for antimetastatic drugs,<br />
although no effect on the growth of the primary tumor was observed.<br />
The miR-103/107 molecules promote an epithelial-to-mesenchymal<br />
transition, a developmental program associated with increased mobility<br />
and loss of cell adhesion that is frequently observed in metastatic<br />
cancer. (Cell 141, 1195–1207, 2010)<br />
ME<br />
Written by Kathy Aschheim, Laura DeFrancesco, Markus Elsner,<br />
Peter Hare & Craig Mak<br />
Fungal histone acetylation inhibitors<br />
Targeting fungal histone acetylation may provide a new source of drugs<br />
against Candida albicans infections, a particular problem for immunocompromised<br />
individuals, research by Wurtele et al. suggests. The authors<br />
set out to determine whether a fungal histone acetyltransferase enzyme<br />
(RTT109) not found in humans would make a good drug target. The<br />
particular modification that the enzyme makes—acetylation of lysine 56<br />
on histone 3 (H3 Lys56)—is found on close to 30% of C. albicans histones,<br />
whereas only 1% of human histones bear the mark. Knocking out both<br />
copies of RTT109 creates strains with greater sensitivity to certain antifungal<br />
agents; repressing the activity of the HST3 deacetylase enzyme led<br />
to fungal cell death. The effects were also mirrored by nicotinamide, an<br />
inhibitor of NAD-dependent deacetylases. A/J mice, a model particularly<br />
sensitive to C. albicans infection, which were injected with an HST3-<br />
repressed strain of the fungus or an RTT109-deleted strain failed to show<br />
signs of infection. Once again, nicotinamide treatment mirrored the effects<br />
of HST3 repression, but only in strains with wild-type RTT109, suggesting<br />
that nicotinamide, which acts as an anti-inflammatory, exerts its effects<br />
on infection through its interaction with the histone deacetylase pathway.<br />
Finally, the researchers showed that whereas some fungal pathogens are<br />
sensitive in various degrees to nicotinamide, all tested clinical isolates of<br />
C. albicans, the fungus with the greatest impact on human health, were<br />
sensitive. (Nat. Med. 16, 774–780, 2010)<br />
LD<br />
iPS cells from blood<br />
As researchers contemplate clinical applications of induced pluripotent stem<br />
(iPS) cells, one practical consideration is the accessibility of the donor cells<br />
used for reprogramming. So far, most human iPS cells have been derived<br />
from fibroblasts collected through skin biopsies, a procedure that requires an<br />
incision and stitches. Following three 2009 papers on the reprogramming of<br />
human hematopoietic stem/progenitor cells from cord blood or from adults<br />
after mobilization by granulocyte colony stimulating factor, three new studies<br />
describe iPS cells from unmobilized adult blood cells. All three groups rely<br />
on the standard ‘Yamanaka’ reprogramming factors (OCT4, SOX2, KLF4,<br />
C-MYC), but Loh et al. and Staerk et al. deliver these with retroviruses,<br />
whereas Seki et al. use the nonintegrating Sendai virus. The latter method<br />
appears more efficient, allowing iPSCs to be generated from samples as small<br />
as 1 ml. Like keratinocytes from plucked hair (Nat. Biotechnol. 26, 1276–1284,<br />
2008), peripheral blood cells may provide a convenient source of iPS cells in<br />
a clinical context. (Cell Stem Cell 7, 15–19; 20–24; 11–14, 2010) KA<br />
Antibody therapy for thrombosis<br />
Small-molecule therapeutics, such as aspirin and clopidogrel (Plavix),<br />
reduce the risk for heart attack and stroke by inhibiting platelets but at<br />
the cost of increased risk for excessive bleeding. Tucker et al. demonstrate<br />
an alternative strategy in baboons based on reducing platelet counts using<br />
neutralizing antibodies. This strategy was tested using a vascular graft<br />
model that mimics a damaged blood vessel at risk for thrombosis. Animals<br />
with fewer circulating platelets showed less potential for thrombosis in<br />
the graft model. Notably, the blood of these animals did not take longer<br />
to clot after cutting the animals’ forearm, whereas aspirin treatment led to<br />
a statistically significant increase in bleeding time. Tucker et al. reduced<br />
platelet counts by treating animals with serum containing polyclonal neutralizing<br />
antibodies raised in baboons against thrombopoietin, a hormone<br />
essential for platelet production. Drugs that can be safely used to inhibit<br />
platelet production will be required before this strategy can be tested in<br />
humans. (Sci. Transl. Med. 2, 37ra45, 2010)<br />
CM<br />
816 volume 28 number 8 august 2010 nature biotechnology
A n a ly s i s<br />
Discovery and characterization of chromatin states for<br />
systematic annotation of the human genome<br />
Jason Ernst 1,2 & Manolis Kellis 1,2<br />
© 2010 <strong>Nature</strong> America, Inc. All rights reserved.<br />
A plethora of epigenetic modifications have been described<br />
in the human genome and shown to play diverse roles in gene<br />
regulation, cellular differentiation and the onset of disease.<br />
Although individual modifications have been linked to the<br />
activity levels of various genetic functional elements, their<br />
combinatorial patterns are still unresolved and their potential<br />
for systematic de novo genome annotation remains untapped.<br />
Here, we use a multivariate Hidden Markov Model to reveal<br />
‘chromatin states’ in human T cells, based on recurrent and<br />
spatially coherent combinations of chromatin marks. We define<br />
51 distinct chromatin states, including promoter-associated,<br />
transcription-associated, active intergenic, large-scale repressed<br />
and repeat-associated states. Each chromatin state shows<br />
specific enrichments in functional annotations, sequence<br />
motifs and specific experimentally observed characteristics,<br />
suggesting distinct biological roles. This approach provides a<br />
complementary functional annotation of the human genome<br />
that reveals the genome-wide locations of diverse classes of<br />
epigenetic function.<br />
The primary DNA sequence of the human genome encodes the<br />
genetic information of each cell, but numerous epigenetic modifications<br />
can modulate the interpretation of the primary sequence.<br />
These modifications contribute to the diversity of phenotypes found<br />
across different human cell types, play key roles in the establishment<br />
and maintenance of cellular identity during development and have<br />
been associated with DNA repair, replication and human disease.<br />
Post-translational modifications in the tails of histone proteins that<br />
package DNA into chromatin constitute perhaps the most versatile<br />
type of such epigenetic information. More than a dozen positions of<br />
multiple histone proteins can undergo a number of modifications,<br />
such as acetylation and mono-, di- or tri-methylation 1,2 .<br />
More than 100 distinct histone modifications have been described,<br />
leading to the ‘histone code hypothesis’ that specific combinations of<br />
chromatin modifications would encode distinct biological functions 3 .<br />
Others, however, have instead proposed that individual epigenetic<br />
marks act in additive ways and the multitude of modifications simply<br />
contributes to stability and robustness 4 . The specific combinations of<br />
1 MIT Computer Science and Artificial Intelligence Laboratory, Cambridge,<br />
Massachusetts, USA. 2 Broad Institute of MIT and Harvard, Cambridge,<br />
Massachusetts, USA. Correspondence should be addressed to M.K.<br />
(manoli@mit.edu).<br />
Published online 25 July 2010; doi:10.1038/nbt.1662<br />
epigenetic modifications that are biologically meaningful, and their<br />
corresponding functional roles, are still largely unknown.<br />
To directly address these questions, we introduce an approach for<br />
the de novo discovery of ‘chromatin states’ (Fig. 1, Supplementary<br />
Table 1 and Supplementary Fig. 1), or biologically meaningful and<br />
spatially coherent combinations of chromatin marks, by performing<br />
a systematic genome-wide analysis based on a multivariate Hidden<br />
Markov Model (HMM). Multivariate HMMs are graphical probabilistic<br />
models that model multiple ‘observed’ inputs as generated by<br />
unobserved ‘hidden’ states, using transitions between hidden states<br />
to model spatial relationships (Online Methods).<br />
Our model captures two types of chromatin information. The frequency<br />
with which different chromatin mark combinations are found<br />
with each other are captured by a vector of ‘emission’ probabilities<br />
associated with each chromatin state (Fig. 2 and Supplementary<br />
Figs. 2 and 3) and the frequency with which different chromatin<br />
states occur in spatial relationships of each other along the genome<br />
are encoded in a ‘transition’ probability vector associated with each<br />
state. These spatial relationships capture both the spreading of certain<br />
chromatin domains across the genome, as well as the functional ordering<br />
of different states such as from intergenic regions to promoter regions<br />
and transcribed regions (Supplementary Notes and Supplementary<br />
Figs. 4–6). Biologically the genomic locations associated with a<br />
given chromatin state may correspond to specific types of functional<br />
elements, such as transcription start sites (TSS), enhancers, active genes,<br />
repressed genes, exons or heterochromatin, which can be inferred<br />
solely from the corresponding combinations of chromatin marks in<br />
their spatial context, even though no information about these annotations<br />
is given to the model as input.<br />
We applied our model to the largest data set of chromatin mark<br />
information available, consisting of the genome-wide occupancy data<br />
for a set of 38 different histone methylation and acetylation marks and<br />
for the histone variant H2AZ, RNA polymerase II (PolII) and CTCF in<br />
human CD4 T-cells. The maps were previously obtained using chromatin<br />
immunoprecipitation followed by next generation sequencing<br />
(ChIP-seq) (Online Methods) 5,6 . To understand the biological importance<br />
of the resulting chromatin states, we undertook a large-scale,<br />
systematic data-mining effort, bringing to bear dozens of genomewide<br />
data sets including gene annotations, expression information,<br />
evolutionary conservation, regulatory motif instances, compositional<br />
biases, genome-wide association data, transcription-factor binding,<br />
DNaseI hypersensitivity and nuclear lamina maps.<br />
This work provides an unbiased and systematic chromatin-driven<br />
annotation for every region of the genome at a 200 base pair resolution,<br />
refining previously described epigenetic states and introducing<br />
nature biotechnology VOLUME 28 NUMBER 8 AUGUST 2010 817
A n a ly s i s<br />
additional ones. Regardless of whether these chromatin states are<br />
causal in directing regulatory processes, or simply reinforcing independent<br />
regulatory decisions, these annotations should provide a<br />
resource for interpreting biological and medical data sets, such as<br />
genome-wide association studies for diverse phenotypes and could<br />
potentially help to identify new classes of functional elements.<br />
RESULTS<br />
Chromatin states model and comparison to previous work<br />
Previous analyses have largely focused on characterizing the marks<br />
predictive of specific classes of genomic elements defined a priori such<br />
as transcribed regions, promoters or putative enhancers, and using<br />
the characterization to identify new instances of these classes 5–12 .<br />
Chr 7:<br />
116,260 kb<br />
116,270 kb<br />
116,280 kb<br />
116,290 kb<br />
116,300 kb<br />
116,310 kb<br />
116,320 kb 116,330 kb 116,340 kb 116,350 kb 116,360 kb<br />
© 2010 <strong>Nature</strong> America, Inc. All rights reserved.<br />
Chromatin states<br />
Chromatin marks<br />
State 3<br />
State 5<br />
State 7<br />
State 8<br />
State 10<br />
State 11<br />
State 13<br />
State 15<br />
State 16<br />
State 17<br />
State 18<br />
State 19<br />
State 24<br />
State 25<br />
State 26<br />
State 36<br />
State 37<br />
State 38<br />
State 39<br />
State 43<br />
State 44<br />
State 51<br />
H3K14ac<br />
H3K23ac<br />
H4K12ac<br />
H2AK9ac<br />
H4K16ac<br />
H2AK5ac<br />
H4K91ac<br />
H3K4ac<br />
H2BK20ac<br />
H3K18ac<br />
H2BK120ac<br />
H3K27ac<br />
H2BK5ac<br />
H2BK12ac<br />
H3K36ac<br />
H4K5ac<br />
H4K8ac<br />
H3K9ac<br />
PolII<br />
CTCF<br />
H2AZ<br />
H3K4me3<br />
H3K4me2<br />
H3K4me1<br />
H3K9me1<br />
H3K79me3<br />
H3K79me2<br />
H3K79me1<br />
H3K27me1<br />
H2BK5me1<br />
H4K20me1<br />
H3K36me3<br />
H3K36me1<br />
H3R2me1<br />
H3R2me2<br />
H3K27me2<br />
H3K27me3<br />
H4R3me2<br />
H3K9me2<br />
H3K9me3<br />
H4K20me3<br />
Promoter states<br />
Transcribed states<br />
Active intergenic<br />
Repressed<br />
Repetitive<br />
CAPZA2<br />
50 kb<br />
Figure 1 Example of chromatin state annotation. Input chromatin mark information and resulting chromatin state annotation for a 120-kb region of<br />
human chromosome 7 surrounding the CAPZA2 gene. For each 200-bp interval, the input ChIP-Seq sequence tag count (black bars) is processed into a<br />
binary presence and/or absence call for each of 18 acetylation marks (light blue), 20 methylation marks (pink) and CTCF/Pol2/H2AZ (brown). The precise<br />
combination of these marks in each interval in their spatial context is used to infer the most probable chromatin state assignment (colored boxes). Although<br />
chromatin states were learned independently of any prior genome annotation, they correlate strongly with upstream and downstream promoters (red),<br />
5′-proximal and distal transcribed regions (purple), active intergenic regions (yellow), repressed (gray) and repetitive (blue) regions (state descriptions<br />
shown in Supplementary Table 1). This example illustrates that even when the signal coming from chromatin marks is noisy, the resulting chromatin state<br />
annotation is very robust, directly interpretable and shows a strong correspondence with the gene annotation. Several spatially coherent transitions are seen<br />
from large-scale repressed to active intergenic regions near active genes, from upstream to downstream promoter states surrounding the TSS and from<br />
5′-proximal to distal transcribed regions along the body of the gene. The frequent transitions to state 16 correlate with annotated Alu elements (57%<br />
overlap versus 4% and 25% for states 13 and 15, respectively). Transitions to state 13 are likely due to enhancer elements in the first intron of CAPZA2,<br />
a region where regulatory elements are commonly found and correlate with several enhancer marks. The maximum-probability state assignments are shown<br />
here, and the full posterior probability for each state in this region is shown in Supplementary Figure 1.<br />
818 VOLUME 28 NUMBER 8 AUGUST 2010 nature biotechnology
a n a ly s i s<br />
An unsupervised (without using prior knowledge) local chromatin<br />
pattern discovery method 13 first demonstrated that many of the<br />
patterns previously associated with promoters and enhancers could<br />
be discovered de novo, but did not discover patterns associated with<br />
broader domains and left the vast majority of the genome unannotated<br />
(Supplementary Fig. 7).<br />
Unsupervised HMM approaches that modeled chromatin mark<br />
signal intensity levels using multivariate normals or nonparametric<br />
histograms 14–18 have been previously used, but in contrast we use<br />
a binarization approach that explicitly models the presence/absence<br />
frequency of each mark. Specifically, we make a local call of whether a<br />
mark was present in each 200-bp interval, and use a Bernoulli random<br />
variable to model the probability of detection of each mark in isolation,<br />
and a product of independent probabilities to model the probability<br />
of each combination of marks (Online Methods). Our approach<br />
has the advantage that the model parameters are directly interpretable<br />
as the frequencies of each mark and each mark combination, in<br />
contrast to previous approaches for which the biological significance<br />
of the parameters corresponding to varying signal intensity levels for<br />
each mark is often unclear. Moreover, the binarization also makes our<br />
© 2010 <strong>Nature</strong> America, Inc. All rights reserved.<br />
a<br />
b<br />
Repetitive Repressive Active intergenic<br />
Transcribed states<br />
Promoter states<br />
State<br />
H3K14ac<br />
H3K23ac<br />
H4K12ac<br />
H2AK9ac<br />
H4K16ac<br />
H2AK5ac<br />
H4K91ac<br />
H3K4ac<br />
H2BK20ac<br />
H3K18ac<br />
H2BK120ac<br />
H3K27ac<br />
H2BK5ac<br />
H2BK12ac<br />
H3K36ac<br />
H4K5ac<br />
H4K8ac<br />
H3K9ac<br />
PolII<br />
CTCF<br />
H2AZ<br />
H3K4me3<br />
H3K4me2<br />
H3K4me1<br />
H3K9me1<br />
H3K79me3<br />
H3K79me2<br />
H3K79me1<br />
H3K27me1<br />
H2BK5me1<br />
H4K20me1<br />
H3K36me3<br />
H3K36me1<br />
H3R2me1<br />
H3R2me2<br />
H3K27me2<br />
H3K27me3<br />
H4R3me2<br />
H3K9me2<br />
H3K9me3<br />
H4K20me3<br />
State<br />
Percent of genome<br />
% +-2kb TSS<br />
Percent of TSS<br />
Chromatin mark frequency<br />
0.01 0.08 1<br />
xF TSS exact<br />
% RefSeq gene<br />
Expression level<br />
xF ZNF gene<br />
5′ UTR<br />
xF<br />
All exons<br />
xF<br />
xF Spliced exons<br />
xF 3′ UTR<br />
xF TES<br />
xF Conserved<br />
xF DNaseI<br />
TF binding<br />
xF<br />
xF CpG island<br />
% GC<br />
% Lamina<br />
% Repeat<br />
c<br />
Promoter upstream high expr; potential enh looping<br />
Promoter upstream med expr; potential enh looping<br />
Promoter upstream low expr; potential enh looping<br />
Repressed promoter<br />
TSS low-med expr; most GC rich<br />
TSS med expr<br />
TSS high expr<br />
Transcribed promoter; highest expr, TSS for active genes<br />
Transcribed promoter; highest expr, downstream<br />
Transcribed promoter; high expr, near TSS<br />
Transcribed promoter; high expr, downstream<br />
Transcribed 5′ proximal, higher expr, open chr, TF binding<br />
Transcribed 5′ proximal, higher expr, open chr<br />
Transcribed 5′ proximal, high expr, open chr<br />
Transcribed 5′ proximal, high expr<br />
Transcribed 5′ proximal, med expr; Alu repeats<br />
Transcribed less 5′ proximal, med expr, open chr<br />
Transcribed less 5′ proximal, med expr<br />
Transcribed less 5′ proximal, lower expr; Alu repeats<br />
Candidate strong enhancer in transcribed regions<br />
Spliced exons/GC rich; open chr, TF binding<br />
Spliced exons/GC rich<br />
Spliced exons/GC rich; Alu repeats<br />
Transcribed 5′ distal; exons<br />
Transcribed further 5′ distal; exons<br />
Transcribed 5′ distal; Alu repeats<br />
End of transcription; exons; high expr<br />
ZNF genes; KAP-1 repressed state<br />
Cand strong distal enh; higher open chr; higher target expr<br />
Cand strong distal enh; high open chr; higher target expr<br />
Intergenic H2AZ with open chr/TF binding. Cand. distal enh<br />
Candidate weak distal enhancer<br />
Candidate distal enhancer<br />
Proximal to active enhancers; Alu repeats<br />
Active intergenic regions not enhancer specific<br />
Active intergenic further from enhancers; Alu repeats<br />
Non-repressive intergenic domains; Alu repeats<br />
H2AZ specific state<br />
CTCF island; candidate insulator<br />
Unmappable<br />
Heterochr; nuclear lamina; most AT rich<br />
Heterochr; nuclear lamina; ERVL repeats<br />
Heterochr; lower gene depletion<br />
Heterochr; ERVL repeats: lower gene/exon depletion<br />
Specific repression<br />
Simple repeats (CA)n, (TG)n<br />
L1/LTR repeats<br />
Satellite repeat<br />
Satellite repeat; moderate mapping bias<br />
Satellite repeat; high mapping bias<br />
Satellite repeat/rRNA; extreme mapping bias<br />
Genome total/average<br />
Figure 2 Chromatin state definition and functional interpretation. (a) Chromatin mark combinations associated with each state. Each row shows the specific<br />
combination of marks associated with each chromatin state and the frequencies between 0 and 1 with which they occur (color scale). These correspond to<br />
the emission probability parameters of the Hidden Markov Model (HMM) learned across the genome during model training (values shown in Supplementary<br />
Fig. 2). Marks and states colored as in Figure 1. (b) Genomic and functional enrichments of chromatin states. %, percentage; xF, fold enrichment. In order,<br />
columns are: percentage of the genome assigned to the state; percentage of state that overlaps a 200-bp interval within 2 kb of an annotated RefSeq TSS;<br />
percentage of RefSeq TSS found in the state; fold enrichment for TSS; percentage of state overlapping a RefSeq transcribed region; average expression level<br />
of genomic intervals overlapping the state; fold-enrichment for zinc-finger–named gene; fold-enrichment for RefSeq 5′ Untranslated Region (5′-UTR) exon<br />
and introns; fold enrichment for RefSeq exons; fold enrichment for spliced exons (2 nd exon or later); fold enrichment for RefSeq 3′ Untranslated Region<br />
(3′-UTR) exons and introns; fold enrichment for RefSeq transcription end sites (TES); fold enrichment for PhastCons conserved elements; fold enrichment<br />
for DNaseI hypersensitive sites; median fold enrichment for transcription factor binding sites over a set of experiments (expanded in Supplementary<br />
Fig. 23); fold-enrichment for CpG islands; percentage of GC nucleotides; percent overlapping experimental nuclear lamina data; percent overlapping a<br />
RepeatMasker element (expanded in Supplementary Fig. 31). All enrichments are based on the posterior probability assignments. Genome total indicates<br />
the total percentage of 200 bp interval intersecting the feature or the genome average for expression and percent GC. (c) Brief description of biological state<br />
function and interpretation (chr, chromatin; enh, enhancer, full descriptions in Supplementary Table 1).<br />
nature biotechnology VOLUME 28 NUMBER 8 AUGUST 2010 819
A n a ly s i s<br />
© 2010 <strong>Nature</strong> America, Inc. All rights reserved.<br />
a<br />
c<br />
Number of genes<br />
States 24–28 shown<br />
2,000<br />
State 26<br />
1,500<br />
1,000<br />
500<br />
State 25<br />
State 24<br />
State 27<br />
0<br />
State 28<br />
2,000<br />
State 19<br />
States 13–23 shown<br />
1,500<br />
21 16<br />
15<br />
1,000<br />
23<br />
20 18<br />
500<br />
22<br />
13<br />
0<br />
0<br />
Gene GO<br />
category<br />
Cell cycle<br />
phase<br />
Embryonic<br />
development<br />
Chromatin<br />
Response to<br />
DNA damage<br />
RNA<br />
processing<br />
T-cell<br />
activation<br />
1,600<br />
3,200<br />
4,800<br />
3 4 5 6 7 8<br />
2.70<br />
(10 –7 )<br />
1.24<br />
(1.0)<br />
1.20<br />
(1.0)<br />
1.20<br />
(1.0)<br />
0.49<br />
(1.0)<br />
0.77<br />
(1.0)<br />
6,400<br />
8,000<br />
9,600<br />
11,200<br />
12,800<br />
14,400<br />
16,000<br />
17,600<br />
19,200<br />
Distance from transcription start site<br />
Chromatin state at TSS of corresponding gene<br />
0.57<br />
(1.0)<br />
2.82<br />
(10 –22 )<br />
0.48<br />
(1.0)<br />
0.35<br />
(1.0)<br />
0.26<br />
(1.0)<br />
0.88<br />
(1.0)<br />
1.61<br />
(10 –3 )<br />
1.07<br />
(1.0)<br />
2.17<br />
(10 –7 )<br />
1.55<br />
(0.07)<br />
1.31<br />
(1.0)<br />
1.27<br />
(1.0)<br />
Fold enrichment<br />
1.45<br />
(1.0)<br />
0.85<br />
(1.0)<br />
1.64<br />
(1.0)<br />
2.13<br />
(10 –11 )<br />
1.91<br />
(10 –11 )<br />
0.70<br />
(1.0)<br />
14<br />
12<br />
10<br />
8<br />
6<br />
4<br />
2<br />
0<br />
1.15<br />
(1.0)<br />
0.54<br />
(1.0)<br />
0.85<br />
(1.0)<br />
1.97<br />
(10 –4 )<br />
2.64<br />
(10 –24 )<br />
0.79<br />
(1.0)<br />
States 12–23 shown<br />
–2,000<br />
–1,600<br />
–1,200<br />
–800<br />
–400<br />
0<br />
400<br />
1.51<br />
(1.0)<br />
1.00<br />
(1.0)<br />
0.85<br />
(1.0)<br />
0.84<br />
(1.0)<br />
2.46<br />
(10 –4 )<br />
4.72<br />
(10 –7 )<br />
State 22<br />
State 21<br />
State 23<br />
State 20<br />
Distance from spliced exon start<br />
b<br />
Fold enrichment<br />
800<br />
1,200<br />
1,600<br />
2,000<br />
80<br />
60<br />
40<br />
20<br />
0<br />
160<br />
Fold enrichment<br />
120<br />
80<br />
40<br />
0<br />
80<br />
60<br />
40<br />
20<br />
0<br />
14<br />
12<br />
10<br />
8<br />
6<br />
4<br />
2<br />
0<br />
Dual peaking<br />
State 1<br />
State 2<br />
State 3<br />
TSS centered<br />
State 4<br />
State 5<br />
State 6<br />
State 7<br />
Downstream<br />
State 8<br />
State 9<br />
State 10<br />
State 11<br />
States 12–28 shown<br />
–4,000<br />
–3,200<br />
–2,400<br />
Distance from transcription start site<br />
State 21<br />
State 23<br />
–1,600<br />
–800<br />
State 27<br />
0<br />
800<br />
1,600<br />
2,400<br />
3,200<br />
4,000<br />
Distance from transcription end site<br />
–2,000<br />
–1,600<br />
–1,200<br />
–800<br />
–400<br />
0<br />
400<br />
800<br />
1,200<br />
1,600<br />
2,000<br />
State 12<br />
State 13<br />
State 14<br />
State 15<br />
State 16<br />
State 17<br />
State 18<br />
State 19<br />
State 20<br />
State 21<br />
State 22<br />
State 23<br />
State 24<br />
State 25<br />
State 26<br />
State 27<br />
State 28<br />
Figure 3 Promoter and transcribed chromatin states show distinct functional and positional enrichments. (a) Distinct Gene Ontology (GO) functional<br />
enrichments (fold and corrected P-values) found for genes associated with different promoter states at their TSS. For additional states and GO terms, see<br />
Supplementary Figure 29. (b) Distinct positional biases of promoter states with respect to nearest RefSeq TSS distinguish states peaking upstream, only<br />
downstream and centered at the TSS. (c) Positional biases of transcribed states with respect to TSS, nearest spliced exon start and transcription end<br />
sites (TES). These distinguish 5′-proximal states (12–23, left panel), 5′-distal states (24–28), states strongly enriched for spliced exons (middle panel,<br />
see also Supplementary Fig. 24 for plot for states 24–28) and TES-associated states (with state 27 being particularly precisely positioned, right panel).<br />
model less prone to forming states overfitting potentially insignificant<br />
variations in signal intensity levels. In contrast to models that use a<br />
multivariate normal distribution, our method avoids this strong parametric<br />
assumption, which is generally violated by the often relatively<br />
small discrete counts found in ChIP-seq experiments, enabling more<br />
robust models to be inferred. In comparison to the models previously<br />
inferred based on a nonparametric histogram strategy 18 , our binarization<br />
approach uses an order of magnitude fewer parameters per state,<br />
further increasing model robustness and interpretability.<br />
We developed a procedure for learning sets of chromatin states<br />
across a range of model complexities. For a given number of states and<br />
from a set of initial parameters, standard expectation maximization<br />
based procedures enable simultaneous local optimization of the state<br />
definitions (emission and transition probabilities) and the corresponding<br />
genome annotation consistent with the observed data. However<br />
the model inferred and its quality can depend on the initial set of<br />
parameters, which can confound comparing models with different<br />
number of states learned from independent initializations. We therefore<br />
used a two-stage process that first selected a 79-state model which<br />
had the highest complexity-penalized likelihood score across a large<br />
compendium of randomly-initialized models of varying complexity.<br />
We then pruned and optimized this model down to smaller numbers<br />
of states, leading to a model with 51 states that were relatively<br />
consistently recovered across the compendium of models, and that<br />
sufficiently captured all states found in larger models for which we<br />
could give a distinct biological interpretation (see Online Methods).<br />
This enabled us to maintain a relatively small number of states while<br />
capturing most of the unique biology uncovered across our compendium<br />
of randomly-initialized models. Put in other words, this<br />
procedure enabled us to maximize biological interpretability, while<br />
minimizing model complexity. We further ensured that general<br />
properties of the resulting model validated our approach, including<br />
robustness to varying thresholds and different background models,<br />
and independence of marks given a chromatin state (Supplementary<br />
Notes, Supplementary Figs. 8–21 and Supplementary Table 2).<br />
We next describe the likely biological functions of the 51 discovered<br />
chromatin states, divided into five large groups.<br />
Promoter-associated states<br />
The first group of states, states 1–11, all had high enrichment for<br />
promoter regions: 40–89% of each state was within 2 kb of a RefSeq<br />
TSS, compared with 2.7% genome-wide (P < 10 −200 , for all states).<br />
820 VOLUME 28 NUMBER 8 AUGUST 2010 nature biotechnology
a n a ly s i s<br />
© 2010 <strong>Nature</strong> America, Inc. All rights reserved.<br />
Figure 4 SNP and GWAS enrichments for<br />
chromatin states. (a) Several chromatin states<br />
show enrichments for disease association<br />
data sets. For each state is shown: genome<br />
percentage; fold enrichment for SNPs from the<br />
HapMap CEU population; fold enrichment from a<br />
collection of 1,640 GWAS SNPs associated with<br />
a variety of diseases and traits from numerous<br />
studies 25 ; fold enrichment of GWAS SNPs<br />
relative to the HapMap CEU SNP enrichment;<br />
significance of GWAS SNPs relative to the<br />
underlying SNP frequency (when the corrected<br />
P-value < 0.01). (b) Example of intergenic<br />
SNP in GWAS-enriched state 33, found 40 kb<br />
downstream of the IKZF2 gene and associated<br />
with plasma eosinophil count levels 26 . SNP<br />
significance as reported 26 is shown for each<br />
SNP in the region (blue circles) and associated<br />
chromatin state annotation (similar to Fig. 1).<br />
Red circle denotes top SNP and its overlap with<br />
state 33. In addition to top SNPs, secondary<br />
SNPs were also frequently found at or near<br />
GWAS-enriched states in several cases.<br />
These states accounted for 59% of all RefSeq TSS although they<br />
covered only 1.3% of genome. These states all had a high frequency of<br />
H3K4me3 in common, as well as significant enrichments for DNaseI<br />
hypersensitive sites, CpG islands, evolutionarily conserved motifs and<br />
bound transcription factors (Fig. 2). They differed however in the<br />
presence and levels of other associated marks, primarily H3K79me2/3,<br />
H4K20me1, H3K4me1/2 and H3K9me1, and of numerous acetylations<br />
leading to varying strength of the aforementioned functional<br />
enrichments, and varying expression levels of the downstream genes<br />
(Supplementary Figs. 22 and 23).<br />
Promoter states differed in the enrichment of Gene Ontology (GO)<br />
terms of associated genes including cell cycle, embryonic development,<br />
RNA processing and T-cell activation (Fig. 3a). For instance, the term<br />
‘embryonic development’ is specifically enriched in state 4, whereas<br />
the term ‘T-cell activation’ is specifically enriched in state 8. Promoter<br />
states also differed in their preferentially enriched positions with respect<br />
to the TSS of associated genes (Fig. 3b). States 4–7 were most concentrated<br />
over the TSS (showing upwards of 100-fold enrichment), states<br />
8–11 peaked between 400 bp and 1,200 bp downstream of the TSS and<br />
corresponded to transcribed promoter regions of expressed genes and<br />
states 1–3 peaked both upstream and downstream of the TSS.<br />
Transcription-associated states<br />
The second large group of chromatin states consisted of 17<br />
transcription-associated states. These are 70–95% contained within<br />
RefSeq-annotated transcribed regions compared to 36% for the rest<br />
of the genome (Fig. 2b, P < 10 −200 , for all states). This group was not<br />
predominantly associated with a single mark, but instead defined by<br />
combinations of seven marks, H3K79me3, H3K79me2, H3K79me1,<br />
H3K27me1, H2BK5me1, H4K20me1 and H3K36me3 (Fig. 2a).<br />
Inspection of the transition frequencies between these states revealed<br />
subgroups of states that are associated with 5′-proximal or 5′-distal<br />
locations and with different expression levels (Fig. 2c, Supplementary<br />
Notes, Supplementary Table 1 and Supplementary Fig. 4).<br />
We observed several states strongly enriched for spliced exons (states<br />
21–25 and 27–28 with 5.7- to 9.7-fold enrichments) (Figs. 2b and 3c and<br />
Supplementary Fig. 24). Spliced exons were previously reported to be<br />
enriched in several individual marks 19–21 . In contrast to these previous<br />
studies, the combinatorial approach we have taken here shows that<br />
a<br />
State<br />
Percent<br />
genome<br />
HapMap<br />
CEU SNP<br />
GWAS<br />
HapMap CEU<br />
SNP and GWAS<br />
P value<br />
4.6E-04<br />
3.2E-03<br />
5.2E-05<br />
5.8E-04<br />
3.6E-06<br />
b<br />
Promoter<br />
states<br />
Transcribed<br />
states<br />
Active<br />
State 33<br />
intergenic<br />
states<br />
Repressed<br />
states<br />
Repetitive<br />
states<br />
Human mRNAs<br />
Spliced ESTs<br />
Mammal cons<br />
–log P<br />
6<br />
5<br />
4<br />
3<br />
2<br />
1<br />
0<br />
213.3<br />
individual marks in spliced exonic states are also frequently detected in<br />
several other states that show only a modest 1.3- to 1.6-fold enrichment<br />
for spliced exons (e.g., states 12, 13, 14 and 17). This suggests that the<br />
chromatin signature of spliced exons is not solely defined by the presence<br />
of the previously reported H3K36me3, H2BK5me1, H4K20me1<br />
and H3K79me1 marks, but their specific combinations and the absence<br />
of H3K4me2, H3K9me1 and H3K79me2/3.<br />
State 27 showed a 12.5-fold enrichment for transcription end sites<br />
(TES) with its enrichment peaking directly over these locations (Fig. 3c).<br />
It was characterized both by the presence of H3K36me3, PolII and<br />
H4K20me1 and the absence of H3K4me1, H3K4me2 and H3K4me3,<br />
distinguishing it from other transcribed states with higher PolII or<br />
H3K36me3 frequencies. This suggests a distinct signature for 3′ ends of<br />
genes for which, to our knowledge, no specific chromatin signature had<br />
been described before. This was further validated by a 3.4-fold signal<br />
enrichment for the elongating form of PolII surveyed in an independent<br />
study 22 (Supplementary Fig. 25), even though our input data did not<br />
distinguish between the elongating and non-elongating form.<br />
State 28 showed a 112-fold enrichment in zinc-finger genes, which<br />
comprise 58% of the state. This state was characterized by the high frequency<br />
for H3K9me3, H4K20me3 and H3K36me3 and relatively low<br />
frequency of other marks. This specific combination has been independently<br />
reported as marking regions of KAP1 binding, a zinc-finger–<br />
specific co-repressor, which also shows a specific 44-fold enrichment<br />
for state 28 (refs. 23,24). Although the association of H3K9me3 and<br />
H4K20me3 with zinc-finger genes has been previously reported 5 , the<br />
de novo discovery of this highly specific signature of zinc-finger genes<br />
illustrates the utility of the methodology and also reveals the additional<br />
presence of H3K36me3 and lower frequency of other marks as<br />
complementing the signature of zinc-finger genes.<br />
Active intergenic states<br />
The third broad class of chromatin states consisted of 11 active<br />
intergenic states (states 29–39), including several classes of candidate<br />
enhancer regions, insulator regions and other regions proximal<br />
to expressed genes (Supplementary Notes). These states were<br />
associated with higher frequencies for H3K4me1, H2AZ, numerous<br />
acetylation marks and/or CTCF and with lower frequencies<br />
for other methylation marks (Fig. 2a and Supplementary Figs. 2<br />
rs12619285<br />
IKZF2<br />
IKZF2<br />
213.4 213.5 213.6 213.7 213.8<br />
Position (Mb)<br />
nature biotechnology VOLUME 28 NUMBER 8 AUGUST 2010 821
A n a ly s i s<br />
© 2010 <strong>Nature</strong> America, Inc. All rights reserved.<br />
a<br />
True-positive rate<br />
b<br />
True-positive rate<br />
0.7<br />
0.6<br />
0.5<br />
0.4<br />
0.3<br />
0.2<br />
0.1<br />
0<br />
0<br />
0.5<br />
0.4<br />
0.3<br />
RefSeq gene transcription start sites<br />
5<br />
7<br />
6<br />
8<br />
4<br />
2 9 1011<br />
H3K4me3<br />
3 1<br />
H3K9ac<br />
Pol2<br />
RefSeq gene transcripts<br />
False-positive rate<br />
45 21 20 31<br />
Individual marks (CD4T)<br />
Chromatin states ordered<br />
(CD4T cells only)<br />
CAGE tags (all cell types)<br />
H3K4me3 at varying cutoffs<br />
0.005 0.01 0.015 0.02 0.025 0.03<br />
10 8 26<br />
2114<br />
20<br />
2328<br />
7 6 5 4<br />
27<br />
Individual marks (CD4T cells)<br />
0.2<br />
9<br />
19<br />
Chromatin states ordered<br />
24<br />
(CD4T cells only)<br />
25<br />
Expressed sequence tags<br />
11<br />
16<br />
H4K20me1<br />
(all cell types)<br />
0.1 22<br />
H3K79me3<br />
12<br />
H3K36me3<br />
18<br />
17<br />
H2BK5me1<br />
13<br />
15 H3K79me1<br />
H3K79me2<br />
0<br />
0 0.005 0.01 0.015 0.02 0.025 0.03<br />
False-positive rate<br />
and 3). They occurred primarily away from promoter regions<br />
(85–97% outside 2 kb of a TSS) and outside of transcribed genes<br />
(48–64% outside of RefSeq annotations, Fig. 2b). When they overlapped<br />
gene annotations, it was mainly in regions that were repressed<br />
or not highly expressed (see expression column in Fig. 2b).<br />
States 29–33 were notable as they corresponded to smaller fractions<br />
of the genome specifically associated with greater DNaseI<br />
hypersensitivity, transcription factor binding and regulatory motif<br />
instances and are likely to represent enhancer regions (Fig. 2 and<br />
Supplementary Fig. 23). Although these candidate enhancer states all<br />
shared higher H3K4me1 frequencies, they showed differences in the<br />
expression levels of downstream genes associated with subtle differences<br />
in their specific mark combinations (Supplementary Fig. 22).<br />
For instance, genes downstream of state 30 had a consistently higher<br />
average expression level than genes downstream of state 31 (P < 0.001<br />
at 10 kb, two-sided t-test). The two states differed in the frequency of<br />
several acetylation marks (state 30 relative to 31 showed higher frequency<br />
for H2BK120ac, H3K27ac and H2BK5ac and lower frequency<br />
for H4K5ac, H4K8ac) and also in the level of H2AZ (higher in state<br />
31 than 30), suggesting that these marks may be playing a more<br />
complex role than previously thought in enhancer regions.<br />
Several active intergenic states showed significant enrichments<br />
for genome-wide association study (GWAS) hits (e.g., 3.3-fold for<br />
candidate enhancer state 33, Fig. 4a), based on a curated database<br />
of top-scoring single-nucleotide polymorphisms (SNPs) in a range<br />
of diseases and traits 25 . These states thus provide a likely common<br />
functional role and means of refining many intergenic SNPs even<br />
in the absence of other annotations. For example (Fig. 4b), a SNP<br />
reported to be strongly associated with plasma eosinophil count levels<br />
in inflammatory diseases (rs12619285) 26 and located 40 kb downstream<br />
of IKZF2 in an intergenic region devoid of annotations is in<br />
a section of the genome in the chromatin state 33, which is enriched<br />
c<br />
State<br />
CAGE (%)<br />
CAGE (%) | not RefSeq TSS<br />
mRNA (%)<br />
mRNA (%) | not RefSeq<br />
% Overall 2 2 46 16<br />
Figure 5 Discovery power of chromatin states for genome annotation.<br />
(a) Comparison of the power to discover TSS for individual chromatin<br />
marks (red), chromatin states (blue) ordered by their TSS enrichment<br />
and a directed experimental approach based on CAGE sequence tag data<br />
read counts from all available cell types 36 (gold), whereas the chromatin<br />
states and marks use only data from CD4 T-cells. Both chromatin states<br />
and CAGE tags are compared using a receiver operating characteristic<br />
(ROC) curve that shows the false-positive (x axis) and true-positive<br />
(y axis) rates at varying prediction thresholds or increasing numbers<br />
of states in the task of predicting if a 200-bp interval intersects a<br />
RefSeq TSS. Thin red curve compares performance of H3K4me3 mark<br />
at varying intensity thresholds. (b) Comparison of the power to detect<br />
RefSeq transcribed regions for chromatin states and marks as in a, and<br />
directed experimental information coming from EST data (gold) based<br />
on sequence counts from all available cell types 37,38 . (c) Independent<br />
experimental information provides support that a significant fraction of<br />
false positives in a and b are genuine unannotated TSS and transcribed<br />
regions currently missing from RefSeq. Percentage of each state<br />
supported by a CAGE tag (column 1), and the same percentage for<br />
locations at least 2 kb away from a RefSeq TSS (column 2), suggests that<br />
many promoter-associated state assignments outside RefSeq promoters<br />
are supported by CAGE tag evidence. Similarly, percentage of each state<br />
overlapping a GenBank mRNA (column 3), and the same percentage<br />
specifically outside RefSeq genes (column 4), suggest that transcriptionassociated<br />
state assignments outside RefSeq genes are supported<br />
by mRNA evidence. Similar support is found by GenBank ESTs and<br />
evolutionarily conserved, predicted new exons (Supplementary Fig. 33).<br />
for GWAS hits. In contrast, the surrounding region of the genome<br />
is assigned to other active or repressed intergenic states with no<br />
significant GWAS association.<br />
Large-scale repressed states<br />
The next group of states (40–45) marked large-scale repressed and<br />
heterochromatic regions, representing 64% of the genome. The two<br />
most frequently detected modifications in total for all the states in this<br />
group were H3K27me3 and H3K9me3. State 40, covering 13% of the<br />
genome, was essentially devoid of any detected modifications, states<br />
41–42 (25% of the genome) had a higher frequency for H3K9me3 than<br />
H3K27me3, whereas states 43–45 (26% of the genome) had a higher<br />
frequency for H3K27me3. States 41–42 as compared to states 43–45<br />
showed a stronger depletion for genes, promoters and conserved elements<br />
and stronger association with nuclear lamina regions 27 and the<br />
darkest-staining chromosomal bands 28 . It also had a higher frequency<br />
of A/T nucleotides (Fig. 2b and Supplementary Figs. 26–28).<br />
State 45 likely corresponds to targeted gene repression. It showed<br />
the highest frequency for H3K27me3 and was unique among repressed<br />
states to show enrichment for TSS. The corresponding genes were<br />
enriched for development-related GO categories (Supplementary<br />
Fig. 29), similar to the repressed promoter state 4 marked by<br />
H3K4me3. However, in contrast to state 4, state 45 showed almost no<br />
change in acetylation levels in response to histone deacetylase inhibitor<br />
(HDACi) treatment (Supplementary Fig. 30), suggesting that state 4<br />
is poised for activation whereas state 45 is stably repressed 29 .<br />
Repetitive states<br />
The final group of six states (46–51) showed strong and distinct<br />
enrichments for specific repetitive elements (Supplementary Fig. 31).<br />
State 46 had a strong enrichment of simple repeats, specifically<br />
(CA) n , (TG) n or (CATG) n (44, 45 and 302-fold, respectively), possibly<br />
due to sequence biases in ChIP-based experiments 30 . State 47<br />
was characterized specifically by H3K9me3 and enriched for L1 and<br />
LTR repeats. State 48–51 all had higher frequencies of H4K20me3<br />
and H3K9me3 and were heavily enriched for satellite repeat elements.<br />
822 VOLUME 28 NUMBER 8 AUGUST 2010 nature biotechnology
a n a ly s i s<br />
States 49–51 showed seemingly high frequencies for numerous<br />
modifications, but also strong enrichments in sequence reads from<br />
a nonspecific antibody (IgG) control 31 (Supplementary Fig. 20),<br />
suggesting these enrichments are due to a lack of coverage for the<br />
additional copies of these repeat elements in the reference genome<br />
assembly 32 , thus illustrating the ability of our model to capture such<br />
potential artifacts by considering all marks jointly.<br />
Predictive power for genome annotation<br />
We next set out to study the predictive power of chromatin states for<br />
the discovery of functional elements. We focused on two classes of<br />
elements that benefit from ample experimental information independent<br />
of chromatin marks, TSS and transcribed regions. We found<br />
that chromatin states consistently outperformed predictions based on<br />
individual marks (Fig. 5a,b), emphasizing the importance of using<br />
a<br />
State<br />
None<br />
H3K4me2<br />
H3K18ac<br />
H3K4me3<br />
H3K79me3<br />
H2BK5me1<br />
H3K36me3<br />
H2BK120ac<br />
H3K9me3<br />
H3K4me1<br />
H4K20me1<br />
H2AZ<br />
CTCF<br />
H2BK5ac<br />
H4K91ac<br />
H3K27me3<br />
H4K20me3<br />
H3K9me1<br />
H4K5ac<br />
H3K79me2<br />
H2BK20ac<br />
H3K27me1<br />
H3K27ac<br />
H3K79me1<br />
H3K27me2<br />
PolII<br />
H3K4ac<br />
H3R2me1<br />
H2AK5ac<br />
H4K8ac<br />
H3K36ac<br />
H3R2me2<br />
H3K9me2<br />
H2BK12ac<br />
H3K9ac<br />
H3K36me1<br />
H4K16ac<br />
H4R3me2<br />
H3K23ac<br />
H4K12ac<br />
H2AK9ac<br />
H3K14ac<br />
b<br />
State<br />
First 10 greedy<br />
Ref. 38<br />
© 2010 <strong>Nature</strong> America, Inc. All rights reserved.<br />
c<br />
50<br />
45<br />
40<br />
35<br />
Squared error<br />
30<br />
25<br />
20<br />
15<br />
10<br />
5<br />
0<br />
0 2 4 6 8 10 12 14 16 18 20<br />
22<br />
24<br />
26<br />
28<br />
30<br />
32<br />
34<br />
36<br />
38<br />
40<br />
Number of marks<br />
Figure 6 Recovery of chromatin states with subsets of marks. (a) The figure shows the ordering of marks (top, from left to right) based on a greedy<br />
forward selection algorithm to optimize a squared error penalty on state misassignments (Online Methods). Conditioned on all the marks to the left<br />
having already been profiled, the mark listed is the optimal selection for one additional mark to be profiled based on the target optimization function.<br />
Below each mark is the percentage of a state with identical assignments using the subset of marks. (b) Comparison of the percentage of each state<br />
recovered between the first ten marks based on the greedy method and the ten marks previously used 33 (Supplementary Fig. 39). The two columns after<br />
the state IDs are the proportion of the states recovered using the greedy algorithm and the set previously used 33 . (c) The figure shows a progressive<br />
decrease in squared error for state misassignment as a function of the number of marks selected based on the greedy algorithm.<br />
nature biotechnology VOLUME 28 NUMBER 8 AUGUST 2010 823
A n a ly s i s<br />
© 2010 <strong>Nature</strong> America, Inc. All rights reserved.<br />
mark combinations and spatial genomic information (Supplementary<br />
Notes and Supplementary Fig. 32 for a comparison to k-means clustering<br />
and a supervised classifier). The prediction performance of<br />
chromatin states based on just CD4 T-cells was similar to that of cap<br />
analysis of gene expression (CAGE) tags and expressed sequence tags<br />
(ESTs) data, even though these were obtained across many diverse cell<br />
types. This was possible because active and inactive states together<br />
capture the information about genetic elements across cell type<br />
boundaries (Fig. 5 and Supplementary Figs. 33–35). Moreover, based<br />
on our 51-state model, we could predict TSS and transcribed regions<br />
when applied to occupancy data obtained for a subset of ten chromatin<br />
marks in CD36 erythrocyte precursors and CD133 hematopoietic<br />
stem cells 33 (Supplementary Fig. 36).<br />
We also found that chromatin states revealed candidate promoter<br />
and transcribed regions not in RefSeq, but further supported by independent<br />
experimental evidence. Candidate promoters overlapped with<br />
CAGE tags (Fig. 5c) and intergenic PolII (Supplementary Fig. 37), and<br />
candidate transcribed regions overlapped GenBank mRNAs (Fig. 5c)<br />
and EST data (Supplementary Fig. 33). A number of promoter and<br />
transcribed states outside known genes were also strongly enriched<br />
for not previously described protein-coding exons predicted using<br />
evolutionary comparisons of 29 mammals (Lin and M.K., unpublished<br />
data) (Supplementary Fig. 33). We note that some candidate promoters<br />
may represent distal enhancers, sharing promoter-associated marks<br />
potentially due to looping of enhancer to promoter regions 7 .<br />
Recovery of chromatin states using subsets of marks<br />
As the large majority of chromatin states were defined by multiple marks,<br />
we next sought to specifically study the contribution of each mark in<br />
defining chromatin states. First, we found several notable examples of<br />
both additive relationships, such as acetylation marks in promoter regions,<br />
and combinatorial relationships, such as methylation marks associated<br />
with repressive and repetitive elements (Supplementary Notes and<br />
Supplementary Fig. 38). We also evaluated varying subsets of chromatin<br />
marks in their ability to distinguish between chromatin states<br />
(Supplementary Notes and Supplementary Figs. 39–41). More generally,<br />
we sought to provide guidelines for selecting subsets of chromatin marks<br />
to survey in new cell types that would be maximally informative.<br />
As a proof of principle, we evaluated the recovery power of increasing<br />
numbers of marks in a greedy way, that is, selecting the best mark given<br />
all previous selected marks, weighing each state equally and penalizing<br />
mismatches uniformly (see Online Methods), which provided an<br />
initial unbiased recommendation of marks to survey for a new cell type<br />
(Fig. 6). We find that increasing subsets of marks rapidly converge to a<br />
fairly accurate annotation of chromatin states (Fig. 6c), providing costefficient<br />
recommendations for new cell types. In addition to an overall<br />
error score, this analysis provides information on the proportion of each<br />
state accurately recovered, and specific pairwise state misassignments.<br />
Such information could be incorporated in a modified scoring function<br />
to provide chromatin mark recommendations targeted to the<br />
subset of chromatin states that are of particular biological interest, or<br />
the particular state distinctions that are most important to each study.<br />
DISCUSSION<br />
The discovery and systematic characterization of chromatin states presented<br />
here reveals a diverse epigenomic landscape with 51 functionally<br />
distinct chromatin states. Although the exact number of chromatin states<br />
can vary based on the number of chromatin marks surveyed and the<br />
desired resolution at which state differences are studied, our results suggest<br />
that the genome annotation resulting from these states can extend the<br />
interpretable part of the human genome, especially outside protein-coding<br />
genes. The definition of the states themselves revealed numerous insights<br />
into the combinatorial and additive roles of chromatin marks, sometimes<br />
hinting at combinations of chromatin marks that were not previously<br />
described, and the genome-wide annotation of these states exposed many<br />
previously unannotated candidate functional elements.<br />
We expect the usefulness of the methods presented here will<br />
increase as additional genome-wide epigenetic data sets become<br />
available, and as additional cell types are surveyed systematically.<br />
Chromatin states can be inferred with virtually any type of epigenetic<br />
and related information, including histone variants, DNA methylation,<br />
DNaseI hypersensitivity and binding of chromatin-associated<br />
and sequence-specific transcription factors. Although we focused on<br />
a single human cell type, the methods are generally applicable to any<br />
species and any number of cell types and even whole embryos, albeit<br />
in mixed cell populations mutually exclusive marks found in different<br />
subsets of cells could potentially be interpreted as co-occurring.<br />
Specifically for understanding epigenomic dynamics, chromatin<br />
states can play a central role going forward, as they provide a uniform<br />
language for interpreting and comparing diverse epigenetic data<br />
sets, for selecting and prioritizing chromatin marks for additional<br />
cell types and for summarizing complex relationships of dozens of<br />
marks in directly-interpretable chromatin states. As several largescale<br />
data production efforts are currently underway to map the<br />
epigenomes of many more cell types, exemplified by the ENCODE 34 ,<br />
modENCODE 35 and Epigenome Roadmap projects (http://www.<br />
roadmapepigenomics.org/), chromatin states will likely play a key<br />
role in the understanding of the human epigenome and its role in<br />
development, health and disease.<br />
Methods<br />
Methods and any associated references are available in the online version<br />
of the paper at http://www.nature.com/naturebiotechnology/.<br />
Note: Supplementary information is available on the <strong>Nature</strong> Biotechnology website.<br />
Acknowledgments<br />
We thank P. Kheradpour for regulatory motif instances and M.F. Lin for predicted<br />
new exons. We thank M. Garber, A. Siepel, K. Lindblad-Toh, and E. Lander for use of<br />
comparative information on 29 mammals. We thank B. Bernstein, N. Shoresh, C. Epstein<br />
and T. Mikkelsen for helpful discussions. We thank L. Goff, C. Bristow, R. Sealfon and<br />
all members of the MIT CompBio Group for comments, feedback and support. This<br />
material is based upon work supported by the National Science Foundation under award<br />
no. 0905968 and funding from the US National Human Genome Research Institute<br />
(NHGRI) under awards U54-HG004570 and RC1-HG005334.<br />
AUTHOR CONTRIBUTIONS<br />
J.E. and M.K. developed the method, analyzed results and wrote the paper.<br />
COMPETING FINANCIAL INTERESTS<br />
The authors declare no competing financial interests.<br />
Published online at http://www.nature.com/naturebiotechnology/.<br />
Reprints and permissions information is available online at http://npg.nature.com/<br />
reprintsandpermissions/.<br />
1. Bernstein, B.E., Meissner, A. & Lander, E.S. The mammalian epigenome. Cell 128,<br />
669–681 (2007).<br />
2. Kouzarides, T. Chromatin modifications and their function. Cell 128, 693–705<br />
(2007).<br />
3. Strahl, B.D. & Allis, C.D. The language of covalent histone modifications. <strong>Nature</strong><br />
403, 41–45 (2000).<br />
4. Schreiber, S.L. & Bernstein, B.E. Signaling network model of chromatin. Cell 111,<br />
771–778 (2002).<br />
5. Barski, A. et al. High-resolution profiling of histone methylations in the human<br />
genome. Cell 129, 823–837 (2007).<br />
6. Wang, Z. et al. Combinatorial patterns of histone acetylations and methylations in<br />
the human genome. Nat. Genet. 40, 897–903 (2008).<br />
824 VOLUME 28 NUMBER 8 AUGUST 2010 nature biotechnology
a n a ly s i s<br />
© 2010 <strong>Nature</strong> America, Inc. All rights reserved.<br />
7. Heintzman, N.D. et al. Distinct and predictive chromatin signatures of transcriptional<br />
promoters and enhancers in the human genome. Nat. Genet. 39, 311–318 (2007).<br />
8. Heintzman, N.D. et al. Histone modifications at human enhancers reflect global<br />
cell-type-specific gene expression. <strong>Nature</strong> 459, 108–112 (2009).<br />
9. Guttman, M. et al. Chromatin signature reveals over a thousand highly conserved<br />
large non-coding RNAs in mammals. <strong>Nature</strong> 458, 223–227 (2009).<br />
10. Hon, G., Wang, W. & Ren, B. Discovery and annotation of functional chromatin<br />
signatures in the human genome. PLoS Comput. Biol. 5, e1000566 (2009).<br />
11. Wang, X., Xuan, Z., Zhao, X., Li, Y. & Zhang, M.Q. High-resolution human corepromoter<br />
prediction with CoreBoost_HM. Genome Res. 19, 266–275 (2009).<br />
12. Won, K.J., Chepelev, I., Ren, B. & Wang, W. Prediction of regulatory elements in<br />
mammalian genomes using chromatin signatures. BMC Bioinformatics 9, 547 (2008).<br />
13. Hon, G., Ren, B. & Wang, W. ChromaSig: a probabilistic approach to finding common<br />
chromatin signatures in the human genome. PLOS Comput. Biol. 4, e1000201<br />
(2008).<br />
14. Day, N., Hemmaplardh, A., Thurman, R.E., Stamatoyannopoulos, J.A. & Noble, W.S.<br />
Unsupervised segmentation of continuous genomic data. Bioinformatics 23,<br />
1424–1426 (2007).<br />
15. Jia, L. et al. Functional enhancers at the gene-poor 8q24 cancer-linked locus. PLoS<br />
Genet. 5, e1000597 (2009).<br />
16. Thurman, R.E., Day, N., Noble, W.S. & Stamatoyannopoulos, J.A. Identification of<br />
higher-order functional domains in the human ENCODE regions. Genome Res. 17,<br />
917 (2007).<br />
17. Schuettengruber, B. et al. Functional anatomy of polycomb and trithorax chromatin<br />
landscapes in Drosophila embryos. PLoS Biol. 7, e13 (2009).<br />
18. Jaschek, R. & Tanay, A. Spatial clustering of multivariate genomic and epigenomic<br />
information. in Proceedings of the 13th Annual International Conference on Research<br />
in Computational Molecular Biology (ed. Batzoglou, S.) 170–183 (Springer, 2009).<br />
19. Schwartz, S., Meshorer, E. & Ast, G. Chromatin organization marks exon-intron<br />
structure. Nat. Struct. Mol. Biol. 16, 990–995 (2009).<br />
20. Kolasinska-Zwierz, P. et al. Differential chromatin marking of introns and expressed<br />
exons by H3K36me3. Nat. Genet. 41, 376–381 (2009).<br />
21. Andersson, R., Enroth, S., Rada-Iglesias, A., Wadelius, C. & Komorowski, J.<br />
Nucleosomes are well positioned in exons and carry characteristic histone<br />
modifications. Genome Res. 19, 1732–1741 (2009).<br />
22. Schones, D.E. et al. Dynamic regulation of nucleosome positioning in the human<br />
genome. Cell. 132, 878–898 (2008).<br />
23. Sripathy, S.P., Stevens, J. & Schultz, D.C. The KAP1 corepressor functions to<br />
coordinate the assembly of de novo HP1-demarcated microenvironments of<br />
heterochromatin required for KRAB zinc finger protein-mediated transcriptional<br />
repression. Mol. Cell. Biol. 26, 8623–8638 (2006).<br />
24. O’Geen, H. et al. Genome-wide analysis of KAP1 binding suggests autoregulation<br />
of KRAB-ZNFs. PLoS Genet. 3, e89 (2007).<br />
25. Hindorff, L.A., Junkins, H.A., Mehta, J.P. & Manolio, T.A. A catalog of published<br />
genome-wide association studies. accessed<br />
July 22, 2009.<br />
26. Gudbjartsson, D.F. et al. Sequence variants affecting eosinophil numbers associate<br />
with asthma and myocardial infarction. Nat. Genet. 41, 342–347 (2009).<br />
27. Guelen, L. et al. Domain organization of human chromosomes revealed by mapping<br />
of nuclear lamina interactions. <strong>Nature</strong> 453, 948–951 (2008).<br />
28. Furey, T.S. & Haussler, D. Integration of the cytogenetic map with the draft human<br />
genome sequence. Hum. Mol. Genet. 12, 1037–1044 (2003).<br />
29. Wang, Z. et al. Genome-wide mapping of HATs and HDACs reveals distinct functions<br />
in active and inactive genes. Cell 138, 1019–1031 (2009).<br />
30. Johnson, D.S. et al. Systematic evaluation of variability in ChIP-chip experiments<br />
using predefined DNA targets. Genome Res. 18, 393–403 (2008).<br />
31. Zang, C. et al. A clustering approach for identification of enriched domains from<br />
histone modification ChIP-Seq data. Bioinformatics 25, 1952–1958 (2009).<br />
32. Zhang, Y., Shin, H., Song, J.S., Lei, Y. & Liu, X.S. Identifying positioned nucleosomes<br />
with epigenetic marks in human from ChIP-Seq. BMC Genomics 9, 537 (2008).<br />
33. Cui, K. et al. Chromatin signatures in multipotent human hematopoietic stem cells<br />
indicate the fate of bivalent genes during differentiation. Cell Stem Cell 4, 80–93<br />
(2009).<br />
34. ENCODE Project Consortium. Identification and analysis of functional elements in<br />
1% of the human genome by the ENCODE pilot project. <strong>Nature</strong> 447, 799–816<br />
(2007).<br />
35. Celniker, S.E. et al. Unlocking the secrets of the genome. <strong>Nature</strong> 459, 927–930<br />
(2009).<br />
36. Carninci, P. et al. Genome-wide analysis of mammalian promoter architecture and<br />
evolution. Nat. Genet. 38, 626–635 (2006).<br />
37. Karolchik, D. et al. The UCSC Genome Browser Database: 2008 update. Nucleic Acids<br />
Res. 36, D773–D779 (2008).<br />
38. Benson, D.A., Karsch-Mizrachi, I., Lipman, D.J., Ostell, J. & Wheeler, D.L. GenBank:<br />
update. Nucleic Acids Res. 32, D23–D26 (2004).<br />
nature biotechnology VOLUME 28 NUMBER 8 AUGUST 2010 825
© 2010 <strong>Nature</strong> America, Inc. All rights reserved.<br />
ONLINE METHODS<br />
Input data for modeling. The initial unprocessed data were bed files containing<br />
the genomic coordinates and strand orientation of mapped sequence reads<br />
from ChIP-seq experiments 5,6 . There was a separate bed file for each of the 18<br />
acetylations, 20 methylations, H2AZ, CTCF and PolII in CD4 T cells. We used<br />
the updated version of the H3K79me1/2/3 data, as reported 6 , which differs<br />
from the version first reported 5 .<br />
To apply the model we first divided the genome into 200-base-pair nonoverlapping<br />
intervals within which we independently made a call as to whether<br />
each of the 41 marks was detected as being present or not based on the count<br />
of tags mapping to the interval. Each tag was uniquely assigned to one interval<br />
based on the location of the 5′ end of the tag after applying a shift of 100 bases<br />
in the 5′ to 3′ direction of the tag. The threshold, t, for each mark was based<br />
on the total number of mapped reads for the mark (Supplementary Table 2),<br />
and was set to be the smallest integer t such that P(X>t)
© 2010 <strong>Nature</strong> America, Inc. All rights reserved.<br />
The sequence data for computed nucleotide frequencies, CpG islands, repeats 42<br />
and conservation data were also obtained from the UCSC genome browser.<br />
The conservation data were based on PhastCon conserved elements using the<br />
44-way vertebrate alignment 43,44 (Lindblad-Toh, K. et al., Broad Institute,<br />
unpublished data ). Transcription factor binding enrichments were computed<br />
for 18 experiments from numerous publications (Supplementary Fig. 23), the<br />
median enrichment over all these experiments is reported in Figure 2b. The<br />
DNaseI hypersensitivity data was as described 45 obtained from the UCSC genome<br />
browser. The nuclear lamina data of human fibroblasts was obtained from<br />
ref. 27. The zinc-finger genes were defined as those that had ‘ZNF’ at the beginning<br />
of the gene symbol in the RefSeq gene table. For published coordinates<br />
that were in hg17 we converted them to hg18 using the liftover tool from the<br />
UCSC genome browser 46 .<br />
Expression, motif and gene ontology analyses. We obtained the processed<br />
CD4 T expression data from ref. 47 for both replicates. We then averaged the<br />
two replicates. After averaging the two replicates we performed a natural log<br />
transform of the average values. We then standardized all values by subtracting<br />
the mean log transformed value and then dividing by the s.d. of the log transform<br />
values. The genome coordinates of each probe set were obtained from the UCSC<br />
genome browser. Each 200 bp interval that overlapped a probe set obtained the<br />
transformed expression score. If multiple probe sets overlapped the same 200 bp<br />
then the average of the expression values associated with these were taken.<br />
We generated transcription factor motif enrichments as described 48 ,<br />
extended for position-weight matrices (PWMs) (Kheradpour, P., MIT, and<br />
M.K., unpublished data) based on the hard state assignments.<br />
Gene ontology enrichments were based on the hard state assignment of the<br />
interval containing the RefSeq annotated TSS of the gene. Enrichments were<br />
computed using the STEM software (v.1.3.4) and the Bonferroni corrected<br />
P-values are reported 49 .<br />
SNP and GWAS analysis. The HapMap CEU 50 data were downloaded from<br />
the UCSC genome browser. Significant GWAS hits were taken from ref. 25.<br />
SNPs listed as occurring multiple times were only counted once, and for the<br />
SNP set listed as a 17-marker haplotype only the first SNP was used giving<br />
1,640 SNPs. In computing enrichment for HapMap and GWAS SNPs, if two<br />
SNPs mapped to the same interval, we counted them multiple times. To determine<br />
if the number of GWAS SNPs in a chromatin state was more significant<br />
than would be expected based on the general SNP frequency in the state<br />
we used a binomial distribution where n = 1,640 and p is the proportion of<br />
HapMap CEU SNPs assigned to the state. We applied a Bonferroni correction<br />
for testing multiple states and only reported those P-values significantly<br />
enriched with P < 0.01.<br />
RefSeq TSS and gene transcripts discovery. The ROC curve for the CAGE data<br />
was based on the number of CAGE tags mapping to a 200 bp interval retrieved from<br />
the Fantom database and converted from hg17 to hg18 using the UCSC genome<br />
browser liftover tool 36 . The overlap with EST was based on those EST listed in<br />
the UCSC genome browser all_est table as of November, 29, 2009 (refs. 37,38).<br />
The overlap with GenBank mRNA is based on the overlap with the UCSC genome<br />
browser mRNA listed in the table as of October 31, 2009 (refs. 37,38). The novel<br />
exon predictions are from (Lin, M.F., MIT, and M.K., unpublished data).<br />
Mark subset evaluation and selection. When evaluating the coverage of<br />
a specified subset of marks, first a posterior distribution over the states at<br />
each interval is computed using the model learned on the full set of marks,<br />
except that the marks not in the subset are omitted when computing emission<br />
probabilities. For an interval t we define here s t,k and f t,k to be the posterior<br />
assignment to state k at interval t based on the subset and full set of marks,<br />
respectively. The proportion of state k recovered with a subset of marks is<br />
defined as:<br />
min( f s<br />
c t t, k, t,<br />
k)<br />
k<br />
ft,<br />
k<br />
= ∑ ∑ t<br />
where the sum is over all intervals t in the genome. The ordering of marks presented<br />
without any prior biological knowledge was based on a greedy forward selection<br />
algorithm designed to select marks that would minimize this function:<br />
∑<br />
2<br />
( 1−<br />
c k )<br />
k<br />
where the sum is over all states. At each step the algorithm would then choose<br />
the one additional mark, conditioned on all the other previously selected<br />
marks that would cause this function to be minimized. We note that this<br />
target function considers all nonidentical state assignments to have equal loss.<br />
An extension of this approach would be to apply target functions that weigh<br />
different misassignments differently. The proportion of state k with the full<br />
set of marks that is misassigned to state i using a subset of marks, m k,i , as is<br />
presented in Supplementary Figures 39 and 40, is defined as:<br />
mk,<br />
i =<br />
∑<br />
⎛<br />
⎛ max( st, i − ft,<br />
i, 0)<br />
⎞⎞<br />
⎜max( ft, k − st,<br />
k , 0)<br />
⎜ ⎟⎟<br />
t ⎜<br />
⎜ max( st j f<br />
j , − t,<br />
j, )<br />
⎝ ∑<br />
0<br />
⎠<br />
⎟⎟<br />
⎝<br />
⎠<br />
∑<br />
t f t,<br />
k<br />
The first term in the sum in the numerator represents for an interval t the<br />
amount of posterior probability assigned to state k using the full set of marks<br />
not assigned using the subset of marks. The second term represents the portion<br />
of this posterior probability that will be credited to state i. The portion<br />
credited to state i is the proportion of the surplus posterior state i received<br />
with the subset of marks in the interval relative to the total surplus posterior<br />
all states received in the interval.<br />
39. Durbin, R., Eddy, S., Krogh, A. & Mitchison, G. Biological Sequence Analysis<br />
(Cambridge Univ. Press, 1998).<br />
40. Neal, R.M. & Hinton, G.E. A view of the EM algorithm that justifies incremental,<br />
sparse, and other variants. Learn. Graph. Models 89, 355–368 (1998).<br />
41. Pruitt, K.D., Tatusova, T. & Maglott, D.R. NCBI reference sequences (RefSeq): a<br />
curated non-redundant sequence database of genomes, transcripts and proteins.<br />
Nucleic Acids Res. 35, D61–D65 (2007).<br />
42. Smit, A., Hubley, R. & Green, P. RepeatMasker Open-3.0 1996-2010 .<br />
43. Miller, W. et al. 28-way vertebrate alignment and conservation track in the UCSC<br />
Genome Browser. Genome Res. 17, 1797–1808 (2007).<br />
44. Siepel, A. et al. Evolutionarily conserved elements in vertebrate, insect, worm, and<br />
yeast genomes. Genome Res. 15, 1034–1050 (2005).<br />
45. Boyle, A.P. et al. High-resolution mapping and characterization of open chromatin<br />
across the genome. Cell 132, 311–322 (2008).<br />
46. Kent, W.J. et al. The human genome browser at UCSC. Genome Res. 12, 996–1006<br />
(2002).<br />
47. Su, A.I. et al. A gene atlas of the mouse and human protein-encoding transcriptomes.<br />
Proc. Natl. Acad. Sci. USA 101, 6062–6067 (2004).<br />
48. Kheradpour, P., Stark, A., Roy, S. & Kellis, M. Reliable prediction of regulator<br />
targets using 12 Drosophila genomes. Genome Res. 17, 1919–1931 (2007).<br />
49. Ernst, J. & Bar-Joseph, Z. STEM: a tool for the analysis of short time series gene<br />
expression data. BMC Bioinformatics 7, 191 (2006).<br />
50. International HapMap Consortium. A second generation human haplotype map of<br />
over 3.1 million SNPs. <strong>Nature</strong> 449, 851–861 (2007).<br />
doi:10.1038/nbt.1662<br />
nature biotechnology
A r t i c l e s<br />
The MicroArray Quality Control (MAQC)-II study of<br />
common practices for the development and validation<br />
of microarray-based predictive models<br />
MAQC Consortium *<br />
© 2010 <strong>Nature</strong> America, Inc. All rights reserved.<br />
Gene expression data from microarrays are being applied to predict preclinical and clinical endpoints, but the reliability of<br />
these predictions has not been established. In the MAQC-II project, 36 independent teams analyzed six microarray data sets<br />
to generate predictive models for classifying a sample with respect to one of 13 endpoints indicative of lung or liver toxicity in<br />
rodents, or of breast cancer, multiple myeloma or neuroblastoma in humans. In total, >30,000 models were built using many<br />
combinations of analytical methods. The teams generated predictive models without knowing the biological meaning of some of<br />
the endpoints and, to mimic clinical reality, tested the models on data that had not been used for training. We found that model<br />
performance depended largely on the endpoint and team proficiency and that different approaches generated models of similar<br />
performance. The conclusions and recommendations from MAQC-II should be useful for regulatory agencies, study committees<br />
and independent investigators that evaluate methods for global gene expression analysis.<br />
As part of the United States Food and Drug Administration’s (FDA’s)<br />
Critical Path Initiative to medical product development (http://www.<br />
fda.gov/oc/initiatives/criticalpath/), the MAQC consortium began in<br />
February 2005 with the goal of addressing various microarray reliability<br />
concerns raised in publications 1–9 pertaining to reproducibility<br />
of gene signatures. The first phase of this project (MAQC-I) extensively<br />
evaluated the technical performance of microarray platforms<br />
in identifying all differentially expressed genes that would potentially<br />
constitute biomarkers. The MAQC-I found high intra-platform reproducibility<br />
across test sites, as well as inter-platform concordance of<br />
differentially expressed gene lists 10–15 and confirmed that microarray<br />
technology is able to reliably identify differentially expressed genes<br />
between sample classes or populations 16,17 . Importantly, the MAQC-I<br />
helped produce companion guidance regarding genomic data submission<br />
to the FDA (http://www.fda.gov/downloads/Drugs/GuidanceCo<br />
mplianceRegulatoryInformation/Guidances/ucm079855.pdf).<br />
Although the MAQC-I focused on the technical aspects of gene<br />
expression measurements, robust technology platforms alone are<br />
not sufficient to fully realize the promise of this technology. An<br />
additional requirement is the development of accurate and reproducible<br />
multivariate gene expression–based prediction models, also<br />
referred to as classifiers. Such models take gene expression data from<br />
a patient as input and as output produce a prediction of a clinically<br />
relevant outcome for that patient. Therefore, the second phase of the<br />
project (MAQC-II) has focused on these predictive models 18 , studying<br />
both how they are developed and how they are evaluated. For<br />
any given microarray data set, many computational approaches can<br />
be followed to develop predictive models and to estimate the future<br />
performance of these models. Understanding the strengths and limitations<br />
of these various approaches is critical to the formulation<br />
of guidelines for safe and effective use of preclinical and clinical<br />
genomic data. Although previous studies have compared and benchmarked<br />
individual steps in the model development process 19 , no<br />
prior published work has, to our knowledge, extensively evaluated<br />
current community practices on the development and validation of<br />
microarray-based predictive models.<br />
Microarray-based gene expression data and prediction models are<br />
increasingly being submitted by the regulated industry to the FDA<br />
to support medical product development and testing applications 20 .<br />
For example, gene expression microarray–based assays that have<br />
been approved by the FDA as diagnostic tests include the Agendia<br />
MammaPrint microarray to assess prognosis of distant metastasis in<br />
breast cancer patients 21,22 and the Pathwork Tissue of Origin Test<br />
to assess the degree of similarity of the RNA expression pattern in<br />
a patient’s tumor to that in a database of tumor samples for which<br />
the origin of the tumor is known 23 . Gene expression data have<br />
also been the basis for the development of PCR-based diagnostic<br />
assays, including the xDx Allomap test for detection of rejection of<br />
heart transplants 24 .<br />
The possible uses of gene expression data are vast and include diagnosis,<br />
early detection (screening), monitoring of disease progression,<br />
risk assessment, prognosis, complex medical product characterization<br />
and prediction of response to treatment (with regard to safety or<br />
efficacy) with a drug or device labeling intent. The ability to generate<br />
models in a reproducible fashion is an important consideration in<br />
predictive model development.<br />
A lack of consistency in generating classifiers from publicly available<br />
data is problematic and may be due to any number of factors<br />
including insufficient annotation, incomplete clinical identifiers,<br />
coding errors and/or inappropriate use of methodology 25,26 . There<br />
* A full list of authors and affiliations appears at the end of the paper. Correspondence should be addressed to L.S. (leming.shi@fda.hhs.gov or leming.shi@gmail.com).<br />
Received 2 March; accepted 30 June; published online 30 July 2010; doi:10.1038/nbt.1665<br />
nature biotechnology VOLUME 28 NUMBER 8 AUGUST 2010 827
A rt i c l e s<br />
© 2010 <strong>Nature</strong> America, Inc. All rights reserved.<br />
are also examples in the literature of classifiers whose performance<br />
cannot be reproduced on independent data sets because of poor study<br />
design 27 , poor data quality and/or insufficient cross-validation of all<br />
model development steps 28,29 . Each of these factors may contribute<br />
to a certain level of skepticism about claims of performance levels<br />
achieved by microarray-based classifiers.<br />
Previous evaluations of the reproducibility of microarray-based<br />
classifiers, with only very few exceptions 30,31 , have been limited<br />
to simulation studies or reanalysis of previously published results.<br />
Frequently, published benchmarking studies have split data sets at<br />
random, and used one part for training and the other for validation.<br />
This design assumes that the training and validation sets are produced<br />
by unbiased sampling of a large, homogeneous population of samples.<br />
However, specimens in clinical studies are usually accrued over years<br />
and there may be a shift in the participating patient population and<br />
also in the methods used to assign disease status owing to changing<br />
practice standards. There may also be batch effects owing to time<br />
variations in tissue analysis or due to distinct methods of sample<br />
collection and handling at different medical centers. As a result,<br />
samples derived from sequentially accrued patient populations, as<br />
was done in MAQC-II to mimic clinical reality, where the first cohort<br />
is used for developing predictive models and subsequent patients are<br />
included in validation, may differ from each other in many ways that<br />
could influence the prediction performance.<br />
The MAQC-II project was designed to evaluate these sources of<br />
bias in study design by constructing training and validation sets at<br />
different times, swapping the test and training sets and also using<br />
data from diverse preclinical and clinical scenarios. The goals of<br />
MAQC-II were to survey approaches in genomic model development<br />
in an attempt to understand sources of variability in prediction<br />
performance and to assess the influences of endpoint signal strength<br />
in data. By providing the same data sets to many organizations for<br />
analysis, but not restricting their data analysis protocols, the project<br />
has made it possible to evaluate to what extent, if any, results depend<br />
on the team that performs the analysis. This contrasts with previous<br />
benchmarking studies that have typically been conducted by single<br />
laboratories. Enrolling a large number of organizations has also made<br />
it feasible to test many more approaches than would be practical for<br />
any single team. MAQC-II also strives to develop good modeling<br />
practice guidelines, drawing on a large international collaboration of<br />
experts and the lessons learned in the perhaps unprecedented effort<br />
of developing and evaluating >30,000 genomic classifiers to predict<br />
a variety of endpoints from diverse data sets.<br />
MAQC-II is a collaborative research project that includes<br />
participants from the FDA, other government agencies, industry<br />
and academia. This paper describes the MAQC-II structure and<br />
experimental design and summarizes the main findings and key<br />
results of the consortium, whose members have learned a great deal<br />
during the process. The resulting guidelines are general and should<br />
not be construed as specific recommendations by the FDA for<br />
regulatory submissions.<br />
RESULTS<br />
Generating a unique compendium of >30,000 prediction models<br />
The MAQC-II consortium was conceived with the primary<br />
goal of examining model development practices for generating<br />
binary classifiers in two types of data sets, preclinical and clinical<br />
(Supplementary Tables 1 and 2). To accomplish this, the project<br />
leader distributed six data sets containing 13 preclinical and clinical<br />
endpoints coded A through M (Table 1) to 36 voluntary participating<br />
data analysis teams representing academia, industry<br />
and government institutions (Supplementary Table 3). Endpoints<br />
were coded so as to hide the identities of two negative-control endpoints<br />
(endpoints I and M, for which class labels were randomly<br />
assigned and are not predictable by the microarray data) and two<br />
positive-control endpoints (endpoints H and L, representing the<br />
sex of patients, which is highly predictable by the microarray data).<br />
Endpoints A, B and C tested teams’ ability to predict the toxicity<br />
of chemical agents in rodent lung and liver models. The remaining<br />
endpoints were predicted from microarray data sets from human<br />
patients diagnosed with breast cancer (D and E), multiple myeloma<br />
(F and G) or neuroblastoma (J and K). For the multiple myeloma<br />
and neuroblastoma data sets, the endpoints represented event free<br />
survival (abbreviated EFS), meaning a lack of malignancy or disease<br />
recurrence, and overall survival (abbreviated OS) after 730 days<br />
(for multiple myeloma) or 900 days (for neuroblastoma) post treatment<br />
or diagnosis. For breast cancer, the endpoints represented<br />
estrogen receptor status, a common diagnostic marker of this<br />
cancer type (abbreviated ‘erpos’), and the success of treatment<br />
involving chemotherapy followed by surgical resection of a tumor<br />
(abbreviated ‘pCR’). The biological meaning of the control endpoints<br />
was known only to the project leader and not revealed to<br />
the project participants until all model development and external<br />
validation processes had been completed.<br />
To evaluate the reproducibility of the models developed by a data<br />
analysis team for a given data set, we asked teams to submit models<br />
from two stages of analyses. In the first stage (hereafter referred to as<br />
the ‘original’ experiment), each team built prediction models for up to<br />
13 different coded endpoints using six training data sets. Models were<br />
‘frozen’ against further modification, submitted to the consortium<br />
and then tested on a blinded validation data set that was not available<br />
to the analysis teams during training. In the second stage (referred<br />
to as the ‘swap’ experiment), teams repeated the model building and<br />
validation process by training models on the original validation set<br />
and validating them using the original training set.<br />
To simulate the potential decision-making process for evaluating a<br />
microarray-based classifier, we established a process for each group<br />
to receive training data with coded endpoints, propose a data analysis<br />
protocol (DAP) based on exploratory analysis, receive feedback on<br />
the protocol and then perform the analysis and validation (Fig. 1).<br />
Analysis protocols were reviewed internally by other MAQC-II participants<br />
(at least two reviewers per protocol) and by members of the<br />
MAQC-II Regulatory Biostatistics Working Group (RBWG), a team<br />
from the FDA and industry comprising biostatisticians and others<br />
with extensive model building expertise. Teams were encouraged to<br />
revise their protocols to incorporate feedback from reviewers, but<br />
each team was eventually considered responsible for its own analysis<br />
protocol and incorporating reviewers’ feedback was not mandatory<br />
(see Online Methods for more details).<br />
We assembled two large tables from the original and swap experiments<br />
(Supplementary Tables 1 and 2, respectively) containing<br />
summary information about the algorithms and analytic steps, or<br />
‘modeling factors’, used to construct each model and the ‘internal’<br />
and ‘external’ performance of each model. Internal performance<br />
measures the ability of the model to classify the training samples,<br />
based on cross-validation exercises. External performance measures<br />
the ability of the model to classify the blinded independent validation<br />
data. We considered several performance metrics, including Matthews<br />
Correlation Coefficient (MCC), accuracy, sensitivity, specificity,<br />
area under the receiver operating characteristic curve (AUC) and<br />
root mean squared error (r.m.s.e.). These two tables contain data on<br />
>30,000 models. Here we report performance based on MCC because<br />
828 VOLUME 28 NUMBER 8 AUGUST 2010 nature biotechnology
A rt i c l e s<br />
it is informative when the distribution of the two classes in a data set<br />
is highly skewed and because it is simple to calculate and was available<br />
for all models. MCC values range from +1 to −1, with +1 indicating<br />
perfect prediction (that is, all samples classified correctly and none<br />
incorrectly), 0 indicates random prediction and −1 indicating perfect<br />
inverse prediction.<br />
The 36 analysis teams applied many different options under each<br />
modeling factor for developing models (Supplementary Table 4)<br />
including 17 summary and normalization methods, nine batch-effect<br />
removal methods, 33 feature selection methods (between 1 and >1,000<br />
features), 24 classification algorithms and six internal validation<br />
methods. Such diversity suggests the community’s common practices are<br />
Table 1 Microarray data sets used for model development and validation in the MAQC-II project<br />
© 2010 <strong>Nature</strong> America, Inc. All rights reserved.<br />
Date set<br />
code<br />
Endpoint<br />
code<br />
Endpoint<br />
description<br />
Hamner A Lung tumorigen<br />
vs. non-tumorigen<br />
(mouse)<br />
Iconix B Non-genotoxic liver<br />
carcinogens vs.<br />
non-carcinogens<br />
(rat)<br />
NIEHS C Liver toxicants vs.<br />
non-toxicants based<br />
on overall necrosis<br />
score (rat)<br />
Breast<br />
cancer<br />
(BR)<br />
Multiple<br />
myeloma<br />
(MM)<br />
Neuroblastoma<br />
(NB)<br />
D<br />
E<br />
F<br />
G<br />
H<br />
I<br />
J<br />
K<br />
L<br />
M<br />
Pre-operative treatment<br />
response (pCR,<br />
pathologic complete<br />
response)<br />
Estrogen receptor<br />
status (erpos)<br />
Overall survival<br />
milestone outcome<br />
(OS, 730-d cutoff)<br />
Event-free survival<br />
milestone outcome<br />
(EFS, 730-d cutoff)<br />
Clinical parameter<br />
S1 (CPS1). The<br />
actual class label<br />
is the sex of the<br />
patient. Used as a<br />
“positive” control<br />
endpoint<br />
Clinical parameter<br />
R1 (CPR1). The<br />
actual class label is<br />
randomly assigned.<br />
Used as a “negative”<br />
control endpoint<br />
Overall survival<br />
milestone outcome<br />
(OS, 900-d cutoff)<br />
Event-free survival<br />
milestone outcome<br />
(EFS, 900-d cutoff)<br />
Newly established<br />
parameter S (NEP_S).<br />
The actual class label<br />
is the sex of the<br />
patient. Used as a<br />
“positive” control<br />
endpoint<br />
Newly established<br />
parameter R (NEP_R).<br />
The actual class label<br />
is randomly assigned.<br />
Used as a “negative”<br />
control endpoint<br />
Microarray<br />
platform<br />
Affymetrix Mouse<br />
430 2.0<br />
Amersham Uniset<br />
Rat 1 Bioarray<br />
Affymetrix<br />
Rat 230 2.0<br />
Affymetrix Human<br />
U133A<br />
Affymetrix Human<br />
U133Plus 2.0<br />
Different versions<br />
of Agilent human<br />
microarrays<br />
Number<br />
of samples<br />
Comments and references<br />
Positives Negatives P/N Number Positives Negatives P/N<br />
(P) (N) ratio of samples (P) (N) ratio<br />
Training set a Validation set a<br />
70 26 44 0.59 88 28 60 0.47 The training set was first<br />
published in 2007 (ref. 50) and<br />
the validation set was generated<br />
for MAQC-II<br />
216 73 143 0.51 201 57 144 0.40 The data set was first published<br />
in 2007 (ref. 51). Raw microarray<br />
intensity data, instead of ratio<br />
data, were provided for MAQC-II<br />
data analysis<br />
214 79 135 0.58 204 78 126 0.62 Exploratory visualization of the<br />
data set was reported in 2008<br />
(ref. 53). However, the phenotype<br />
classification problem was<br />
formulated specifically for<br />
MAQC-II. A large amount of<br />
additional microarray and<br />
phenotype data were provided to<br />
MAQC-II for cross-platform and<br />
cross-tissue comparisons<br />
130 33 97 0.34 100 15 85 0.18 The training set was first<br />
published in 2006 (ref. 56) and<br />
the validation set was specifically<br />
generated for MAQC-II. In addition,<br />
130 80 50 1.6 100 61 39 1.56<br />
two distinct endpoints (D<br />
and E) were analyzed in MAQC-II<br />
340 51 289 0.18 214 27 187 0.14 The data set was first published<br />
in 2006 (ref. 57) and 2007<br />
(ref. 58). However, patient<br />
340 84 256 0.33 214 34 180 0.19 survival data were updated and<br />
the raw microarray data (CEL<br />
files) were provided specifically<br />
340 194 146 1.33 214 140 74 1.89 for MAQC-II data analysis. In<br />
addition, endpoints H and I were<br />
designed and analyzed specifically<br />
in MAQC-II<br />
340 200 140 1.43 214 122 92 1.33<br />
238<br />
239<br />
246<br />
246<br />
22<br />
49<br />
145<br />
145<br />
216<br />
190<br />
101<br />
101<br />
0.10<br />
0.26<br />
1.44<br />
1.44<br />
177<br />
193<br />
231<br />
253<br />
39<br />
83<br />
133<br />
143<br />
138<br />
110<br />
98<br />
110<br />
0.28<br />
0.75<br />
1.36<br />
1.30<br />
The training data set was first<br />
published in 2006 (ref. 63).<br />
The validation set (two-color<br />
Agilent platform) was generated<br />
specifically for MAQC-II. In addition,<br />
one-color Agilent platform<br />
data were also generated for most<br />
samples used in the training and<br />
validation sets specifically for<br />
MAQC-II to compare the prediction<br />
performance of two-color<br />
versus one-color platforms.<br />
Patient survival data were also<br />
updated. In addition, endpoints L<br />
and M were designed and<br />
analyzed specifically in MAQC-II<br />
The first three data sets (Hamner, Iconix and NIEHS) are from preclinical toxicogenomics studies, whereas the other three data sets are from clinical studies. Endpoints H and L are positive<br />
controls (sex of patient) and endpoints I and M are negative controls (randomly assigned class labels). The nature of H, I, L and M was unknown to MAQC-II participants except for the project<br />
leader until all calculations were completed.<br />
a Numbers shown are the actual number of samples used for model development or validation.<br />
nature biotechnology VOLUME 28 NUMBER 8 AUGUST 2010 829
A rt i c l e s<br />
© 2010 <strong>Nature</strong> America, Inc. All rights reserved.<br />
Figure 1 Experimental design and timeline<br />
of the MAQC-II project. Numbers (1–11)<br />
order the steps of analysis. Step 11 indicates<br />
when the original training and validation<br />
data sets were swapped to repeat steps 4–10.<br />
See main text for description of each step.<br />
Every effort was made to ensure the complete<br />
independence of the validation data sets from<br />
the training sets. Each model is characterized<br />
by several modeling factors and seven internal<br />
and external validation performance metrics<br />
(Supplementary Tables 1 and 2). The modeling<br />
factors include: (i) organization code; (ii) data<br />
set code; (iii) endpoint code; (iv) summary and<br />
normalization; (v) feature selection method;<br />
(vi) number of features used; (vii) classification<br />
algorithm; (viii) batch-effect removal method;<br />
(ix) type of internal validation; and (x) number<br />
of iterations of internal validation. The seven<br />
performance metrics for internal validation and<br />
external validation are: (i) MCC; (ii) accuracy;<br />
(iii) sensitivity; (iv) specificity; (v) AUC;<br />
(vi) mean of sensitivity and specificity; and<br />
(vii) r.m.s.e. s.d. of metrics are also provided for<br />
internal validation results.<br />
9/07 – 10/07<br />
1. Exploratory<br />
data analysis<br />
(36 DATs)<br />
well represented. For each of the models nominated by a team as being<br />
the best model for a particular endpoint, we compiled the list of features<br />
used for both the original and swap experiments (see the MAQC Web<br />
site at http://edkb.fda.gov/MAQC/). These comprehensive tables represent<br />
a unique resource. The results that follow describe data mining<br />
efforts to determine the potential and limitations of current practices for<br />
developing and validating gene expression–based prediction models.<br />
Performance depends on endpoint and can be estimated<br />
during training<br />
Unlike many previous efforts, the study design of MAQC-II provided<br />
the opportunity to assess the performance of many different modeling<br />
a<br />
External validation (MCC)<br />
c<br />
MCC<br />
1.0<br />
0.8<br />
0.6<br />
0.4<br />
0.2<br />
0<br />
–0.2<br />
–0.4<br />
b<br />
External validation (MCC)<br />
10/07<br />
9/1/2007 2/1/2009<br />
10/07 – 12/07 1/08 – 3/08<br />
3/08 – 8/08 8/08 – 9/08 10/08 – 2/09<br />
4. Data sets<br />
5. Classifiers<br />
12/07 – 1/08<br />
3. Review & approval<br />
of DAP by RBWG<br />
11/07 12/07<br />
2. Data analysis<br />
protocol (DAP)<br />
1. Exploration 2. DAP 3. DAP review<br />
11. Swap<br />
r = 0.840, N = 18,060 1.0 r = 0.951, N = 13<br />
Endpoint<br />
A<br />
0.8<br />
B<br />
C<br />
D<br />
0.6<br />
E<br />
F<br />
0.4<br />
G<br />
H<br />
0.2<br />
I<br />
I G<br />
J<br />
K<br />
0<br />
L<br />
M –0.2<br />
M<br />
–0.4<br />
–0.6<br />
–0.6 –0.4 –0.2 0 0.2 0.4 0.6 0.8 1.0<br />
Internal validation (MCC)<br />
1.0<br />
L C H E K<br />
0.8<br />
0.6<br />
0.4<br />
0.2<br />
0<br />
J<br />
1/08<br />
1/08 3/08 8/08 9/08<br />
Face-to-face<br />
meeting<br />
4. Six training<br />
data sets<br />
(13 endpoints)<br />
2/08 3/08<br />
5. Classifiers are frozen<br />
(mark one for validation)<br />
7. Validation<br />
(blind test)<br />
data sets<br />
distribution<br />
6. Models 7. Validation 8. Prediction<br />
4/08 5/08 6/08 7/08 8/08 9/08 10/08 11/08 12/08 1/09<br />
6. MAQC-II’s<br />
candidate models<br />
9-10. Meta-data<br />
distribution<br />
9<br />
8. Prediction<br />
results<br />
approaches on a clinically realistic blinded external validation data set.<br />
This is especially important in light of the intended clinical or preclinical<br />
uses of classifiers that are constructed using initial data sets and<br />
validated for regulatory approval and then are expected to accurately<br />
predict samples collected under diverse conditions perhaps months or<br />
years later. To assess the reliability of performance estimates derived<br />
during model training, we compared the performance on the internal<br />
training data set with performance on the external validation data set<br />
for of each of the 18,060 models in the original experiment (Fig. 2a).<br />
Models without complete metadata were not included in the analysis.<br />
We selected 13 ‘candidate models’, representing the best model for<br />
each endpoint, before external validation was performed. We required<br />
that each analysis team nominate one model<br />
L<br />
H C<br />
E<br />
J<br />
K B<br />
–0.6<br />
–0.6 –0.4 –0.2 0 0.2 0.4 0.6 0.8 1.0<br />
Internal validation (MCC)<br />
D G F A I M<br />
Internal validation<br />
External validation<br />
–0.2<br />
–0.4<br />
1796 970 866 1143 1079 2263 1192 2905 877 863 1569 807 1730<br />
NBpositive<br />
NIEHS MM-<br />
BR-<br />
NB- NB- Iconix BR-<br />
MM- MM- Hamner MM-<br />
NB-<br />
(rat liver positive erpos EFS OS (rat liver pCR EFS OS (mouse negative negative<br />
necrosis)<br />
tumor)<br />
lung tumor)<br />
B<br />
D<br />
A<br />
F<br />
5′<br />
Models<br />
9/08 – 10/08<br />
11. Swap<br />
prediction<br />
results<br />
12. Meta-data analysis<br />
& visualization<br />
10. Table of model information<br />
Performance metrics<br />
1<br />
2<br />
3<br />
...<br />
...<br />
...<br />
...<br />
...<br />
n<br />
Modeling<br />
factors<br />
Internal<br />
validation<br />
External<br />
validation<br />
1<br />
... ... ... ... ... ... ... ...<br />
2 3 m<br />
...<br />
...<br />
...<br />
MF1 MF2 MF3 IV1 IV2 IV3 EV1 EV2 EV3<br />
12. Meta-data analysis<br />
for each endpoint they analyzed and we then<br />
selected one candidate from these nominations<br />
for each endpoint. We observed a<br />
higher correlation between internal and<br />
external performance estimates in terms<br />
1.0<br />
0.9<br />
0.8<br />
0.7<br />
0.6<br />
0.5<br />
0.4<br />
0.3<br />
0.2<br />
0.1<br />
r = 0.8495, N = 17,092<br />
0.2<br />
0.30.40.50.60.70.80.91.0<br />
Figure 2 Model performance on internal<br />
validation compared with external validation.<br />
(a) Performance of 18,060 models that were<br />
validated with blinded validation data.<br />
(b) Performance of 13 candidate models.<br />
r, Pearson correlation coefficient; N, number<br />
of models. Candidate models with binary and<br />
continuous prediction values are marked as<br />
circles and squares, respectively, and the<br />
standard error estimate was obtained using<br />
500-times resampling with bagging of the<br />
prediction results from each model. (c) Distribution<br />
of MCC values of all models for each endpoint in<br />
internal (left, yellow) and external (right, green)<br />
validation performance. Endpoints H and L (sex of<br />
the patients) are included as positive controls and<br />
endpoints I and M (randomly assigned sample<br />
class labels) as negative controls. Boxes indicate<br />
the 25% and 75% percentiles, and whiskers<br />
indicate the 5% and 95% percentiles.<br />
830 VOLUME 28 NUMBER 8 AUGUST 2010 nature biotechnology
A rt i c l e s<br />
© 2010 <strong>Nature</strong> America, Inc. All rights reserved.<br />
Figure 3 Performance, measured using MCC,<br />
of the best models nominated by the 17 data<br />
analysis teams (DATs) that analyzed all 13<br />
endpoints in the original training-validation<br />
experiment. The median MCC value for<br />
an endpoint, representative of the level of<br />
predicability of the endpoint, was calculated<br />
based on values from the 17 data analysis<br />
teams. The mean MCC value for a data analysis<br />
team, representative of the team’s proficiency<br />
in developing predictive models, was calculated<br />
based on values from the 11 non-random<br />
endpoints (excluding negative controls I and M).<br />
Red boxes highlight candidate models. Lack<br />
of a red box in an endpoint indicates that the<br />
candidate model was developed by a data analysis<br />
team that did not analyze all 13 endpoints.<br />
DAT24<br />
DAT13<br />
DAT25<br />
DAT11<br />
DAT12<br />
DAT32<br />
DAT10<br />
DAT20<br />
DAT4<br />
DAT18<br />
DAT36<br />
DAT29<br />
DAT35<br />
DAT7<br />
DAT19<br />
DAT33<br />
DAT3<br />
Median<br />
of MCC for the selected candidate models<br />
Candidate<br />
(r = 0.951, n = 13, Fig. 2b) than for the overall<br />
Mean* L<br />
set of models (r = 0.840, n = 18,060, Fig. 2a),<br />
suggesting that extensive peer review of<br />
analysis protocols was able to avoid selecting<br />
models that could result in less reliable<br />
predictions in external validation. Yet, even<br />
for the hand-selected candidate models, there is noticeable bias in the<br />
performance estimated from internal validation. That is, the internal<br />
validation performance is higher than the external validation performance<br />
for most endpoints (Fig. 2b). However, for some endpoints<br />
and for some model building methods or teams, internal and external<br />
performance correlations were more modest as described in the following<br />
sections.<br />
To evaluate whether some endpoints might be more predictable<br />
than others and to calibrate performance against the positive- and<br />
negative-control endpoints, we assessed all models generated for each<br />
endpoint (Fig. 2c). We observed a clear dependence of prediction<br />
performance on endpoint. For example, endpoints C (liver necrosis<br />
score of rats treated with hepatotoxicants), E (estrogen receptor status<br />
of breast cancer patients), and H and L (sex of the multiple myeloma<br />
and neuroblastoma patients, respectively) were the easiest to predict<br />
(mean MCC > 0.7). Toxicological endpoints A and B and disease<br />
progression endpoints D, F, G, J and K were more difficult to predict<br />
(mean MCC ~0.1–0.4). Negative-control endpoints I and M were<br />
totally unpredictable (mean MCC ~0), as expected. For 11 endpoints<br />
(excluding the negative controls), a large proportion of the submitted<br />
models predicted the endpoint significantly better than chance (MCC<br />
> 0) and for a given endpoint many models performed similarly well<br />
on both internal and external validation (see the distribution of MCC<br />
in Fig. 2c). On the other hand, not all the submitted models performed<br />
equally well for any given endpoint. Some models performed<br />
no better than chance, even for some of the easy-to-predict endpoints,<br />
suggesting that additional factors were responsible for differences in<br />
model performance.<br />
Data analysis teams show different proficiency<br />
Next, we summarized the external validation performance of the<br />
models nominated by the 17 teams that analyzed all 13 endpoints<br />
(Fig. 3). Nominated models represent a team’s best assessment of its<br />
model-building effort. The mean external validation MCC per team<br />
over 11 endpoints, excluding negative controls I and M, varied from<br />
0.532 for data analysis team (DAT)24 to 0.263 for DAT3, indicating<br />
appreciable differences in performance of the models developed by different<br />
teams for the same data. Similar trends were observed when AUC<br />
Data analysis team code<br />
0.532 0.982 0.910 0.845 0.748 0.575 0.557 0.311 0.323 0.244 0.193 0.168 0.011 −0.059<br />
0.513 0.973 0.918 0.829 0.792 0.493 0.437 0.322 0.306 0.307 0.202 0.060 0.044 −0.041<br />
0.504 0.965 0.801 0.816 0.652 0.514 0.349 0.383 0.360 0.217 0.243 0.247 0.016 −0.051<br />
0.500 0.991 0.752 0.750 0.778 0.509 0.483 0.345 0.305 0.295 0.193 0.099 0.029 0.012<br />
0.495 0.973 0.869 0.825 0.755 0.403 0.413 0.321 0.275 0.193 0.266 0.152 −0.016 −0.117<br />
0.489 0.982 0.762 0.823 0.702 0.533 0.557 0.284 0.203 0.143 0.257 0.129 0.043 −0.006<br />
0.485 0.982 0.871 0.445 0.728 0.472 0.249 0.429 0.353 0.295 0.293 0.222 0.016 −0.035<br />
0.483 0.930 0.838 0.805 0.773 0.542 0.386 0.345 0.289 0.225 0.181 0.000 0.067 −0.152<br />
0.473 0.982 0.847 0.835 0.737 0.488 0.344 0.118 0.324 0.110 0.176 0.247 −0.067 −0.112<br />
0.460 0.973 0.860 0.829 0.690 0.371 0.376 0.344 0.229 0.057 0.243 0.090 −0.059 −0.059<br />
0.457 0.956 0.815 0.847 0.773 0.491 0.202 0.185 0.385 −0.014 0.187 0.203 0.002 −0.075<br />
0.443 0.982 0.847 0.780 0.755 0.377 0.423 0.313 −0.042 0.198 0.241 0.000 0.000 −0.041<br />
0.427 0.725 0.782 0.824 0.770 0.531 0.344 0.168 0.349 −0.096 0.165 0.140 0.068 0.036<br />
0.371 0.982 0.707 0.782 0.466 0.499 0.184 0.271 0.000 −0.062 0.203 0.051 0.013 −0.103<br />
0.364 0.636 0.761 0.454 0.748 0.247 0.377 0.062 0.324 0.043 0.085 0.271 0.016 −0.020<br />
0.284 0.856 0.054 0.709 0.751 0.455 −0.213 –0.078 0.114 0.479 −0.096 0.091 0.051 0.024<br />
0.263 0.982 0.830 0.595 0.544 0.036 −0.090 −0.027 0.336 −0.143 −0.030 −0.142 −0.047 0.019<br />
0.488 0.973 0.830 0.816 0.748 0.491 0.376 0.311 0.306 0.193 0.193 0.129 0.016 −0.041<br />
0.511 0.982 0.891 0.829 0.732 0.403 0.479 0.429 0.301 0.217 0.162 0.196 0.067 −0.103<br />
H C E K J B D A G F I M<br />
NB pos<br />
MM pos<br />
Rat liver necr.<br />
BR erpos<br />
NB EFS<br />
NB OS<br />
Rat liver tumor<br />
BR pCR<br />
Mouse lung tumor<br />
MM EFS<br />
MM OS<br />
MM neg<br />
NB neg<br />
Endpoint<br />
was used as the performance metric (Supplementary Table 5) or when<br />
the original training and validation sets were swapped (Supplementary<br />
Tables 6 and 7). Table 2 summarizes the modeling approaches that<br />
were used by two or more MAQC-II data analysis teams.<br />
Many factors may have played a role in the difference of external validation<br />
performance between teams. For instance, teams used different<br />
modeling factors, criteria for selecting the nominated models, and software<br />
packages and code. Moreover, some teams may have been more<br />
proficient at microarray data modeling and better at guarding against<br />
clerical errors. We noticed substantial variations in performance among<br />
the many K-nearest neighbor algorithm (KNN)-based models developed<br />
by four analysis teams (Supplementary Fig. 1). Follow-up investigations<br />
identified a few possible causes leading to the discrepancies in<br />
performance 32 . For example, DAT20 fixed the parameter ‘number of<br />
neighbors’ K = 3 in its data analysis protocol for all endpoints, whereas<br />
DAT18 varied K from 3 to 15 with a step size of 2. This investigation<br />
also revealed that even a detailed but standardized description of model<br />
building requested from all groups failed to capture many important<br />
tuning variables in the process. The subtle modeling differences not<br />
captured may have contributed to the differing performance levels<br />
achieved by the data analysis teams. The differences in performance<br />
for the models developed by various data analysis teams can also be<br />
observed from the changing patterns of internal and external validation<br />
performance across the 13 endpoints (Fig. 3, Supplementary<br />
Tables 5–7 and Supplementary Figs. 2–4). Our observations highlight<br />
the importance of good modeling practice in developing and validating<br />
microarray-based predictive models including reporting of computational<br />
details for results to be replicated 26 . In light of the MAQC-II<br />
experience, recording structured information about the steps and<br />
parameters of an analysis process seems highly desirable to facilitate<br />
peer review and reanalysis of results.<br />
Swap and original analyses lead to consistent results<br />
To evaluate the reproducibility of the models generated by each team,<br />
we correlated the performance of each team’s models on the original<br />
training data set to performance on the validation data set and<br />
repeated this calculation for the swap experiment (Fig. 4). The correlation<br />
varied from 0.698–0.966 on the original experiment and from<br />
1.0<br />
0.8<br />
0.6<br />
0.4<br />
0.2<br />
0<br />
−0.2<br />
−0.4<br />
−0.6<br />
−0.8<br />
−1.0<br />
nature biotechnology VOLUME 28 NUMBER 8 AUGUST 2010 831
A rt i c l e s<br />
© 2010 <strong>Nature</strong> America, Inc. All rights reserved.<br />
Table 2 Modeling factor options frequently adopted by MAQC-II data<br />
analysis teams<br />
Original analysis (training => validation)<br />
Modeling factor<br />
Option<br />
Number<br />
of teams<br />
Number<br />
of endpoints<br />
Number<br />
of models<br />
Summary and normalization Loess 12 3 2,563<br />
RMA 3 7 46<br />
MAS5 11 7 4,947<br />
Batch-effect removal None 10 11 2,281<br />
Mean shift 3 11 7,279<br />
Feature selection SAM 4 11 3,771<br />
FC+P 8 11 4,711<br />
T-Test 5 11 400<br />
RFE 2 11 647<br />
Number of features 0~9 10 11 393<br />
10~99 13 11 4,445<br />
≥1,000 3 11 474<br />
100~999 10 11 4,298<br />
Classification algorithm DA 4 11 103<br />
Tree 5 11 358<br />
NB 4 11 924<br />
KNN 8 11 6,904<br />
SVM 9 11 986<br />
Analytic options used by two or more of the 14 teams that submitted models for all endpoints in both<br />
the original and swap experiments. RMA, robust multichip analysis; SAM, significance analysis of<br />
microarrays; FC, fold change; RFE, recursive feature elimination; DA, discriminant analysis; Tree,<br />
decision tree; NB, naive Bayes; KNN, K-nearest neighbors; SVM, support vector machine.<br />
0.443–0.954 on the swap experiment. For all but three teams (DAT3,<br />
DAT10 and DAT11) the original and swap correlations were within<br />
±0.2, and all but three others (DAT4, DAT13 and DAT36) were within<br />
±0.1, suggesting that the model building process was relatively robust,<br />
at least with respect to generating models with similar performance.<br />
For some data analysis teams the internal validation performance<br />
drastically overestimated the performance of the same model in predicting<br />
the validation data. Examination of some of those models<br />
revealed several reasons, including bias in the feature selection and<br />
cross-validation process 28 , findings consistent with what was observed<br />
from a recent literature survey 33 .<br />
Previously, reanalysis of a widely cited single study 34 found that<br />
the results in the original publication were very fragile—that is, not<br />
reproducible if the training and validation sets were swapped 35 . Our<br />
observations, except for DAT3, DAT11 and DAT36 with correlation<br />
65%<br />
of the variability in the external validation performance. All other<br />
factors explain 1%.<br />
The BLUPs reveal the effect of each level of the factor to the corresponding<br />
MCC value. The BLUPs of the main endpoint effect show<br />
that rat liver necrosis, breast cancer estrogen receptor status and the<br />
sex of the patient (endpoints C, E, H and L) are relatively easier to be<br />
predicted with ~0.2–0.4 advantage contributed on the corresponding<br />
MCC values. The rest of the endpoints are relatively harder to<br />
be predicted with about −0.1 to −0.2 disadvantage contributed to<br />
the corresponding MCC values. The main factors of normalization,<br />
classification algorithm, the number of selected features and<br />
the feature selection method have an impact of −0.1 to 0.1 on the<br />
corresponding MCC values. Loess normalization was applied to the<br />
endpoints (J, K and L) for the neuroblastoma data set with the twocolor<br />
Agilent platform and has 0.1 advantage to MCC values. Among<br />
the Microarray Analysis Suite version 5 (MAS5), Robust Multichip<br />
Analysis (RMA) and dChip normalization methods that were<br />
applied to all endpoints (A, C, D, E, F, G and H) for Affymetrix data,<br />
the dChip method has a lower BLUP than the others. Because<br />
normalization methods are partially confounded with endpoints, it<br />
may not be suitable to compare methods between different confounded<br />
groups. Among classification methods, discriminant analysis has the<br />
largest positive impact of 0.056 on the MCC values. Regarding the<br />
number of selected features, larger bin number has better impact on<br />
the average across endpoints. The bin number is assigned by applying<br />
the ceiling function to the log base 10 of the number of selected features.<br />
All the feature selection methods have a slight impact of −0.025 to 0.025<br />
Correlation in swap analysis (validation → training)<br />
1.0<br />
0.9<br />
0.8<br />
0.7<br />
0.6<br />
0.5<br />
10<br />
12 18<br />
24<br />
20<br />
4<br />
29<br />
32<br />
13<br />
7<br />
0.4<br />
0.4 0.5 0.6 0.7 0.8 0.9 1.0<br />
Correlation in original analysis (training → validation)<br />
Figure 4 Correlation between internal and external validation is<br />
dependent on data analysis team. Pearson correlation coefficients<br />
between internal and external validation performance in terms of MCC are<br />
displayed for the 14 teams that submitted models for all 13 endpoints<br />
in both the original (x axis) and swap (y axis) analyses. The unusually low<br />
correlation in the swap analysis for DAT3, DAT11 and DAT36 is a result<br />
of their failure to accurately predict the positive endpoint H, likely due to<br />
operator errors (Supplementary Table 6).<br />
36<br />
25<br />
3<br />
11<br />
832 VOLUME 28 NUMBER 8 AUGUST 2010 nature biotechnology
Bscatter<br />
FC<br />
Fisher<br />
Golub<br />
KS<br />
RFE P<br />
SAM<br />
T-Test<br />
Welch<br />
Wilcoxon<br />
DA<br />
Forest<br />
GLM<br />
KNN<br />
NC<br />
NB<br />
PLS<br />
RFE<br />
SVM<br />
Tree<br />
A rt i c l e s<br />
© 2010 <strong>Nature</strong> America, Inc. All rights reserved.<br />
a<br />
Endpoint<br />
Summary normalization<br />
Classification algorithm<br />
Number of features<br />
Feature selection<br />
Validation iterations<br />
Organization<br />
Batch effect removal<br />
Organization*classification<br />
algorithm<br />
Summary normalization*endpoint<br />
Classification algorithm*endpoint<br />
Number of features*endpoint<br />
Feature selection*endpoint<br />
Validation iterations*endpoint<br />
Organization*endpoint<br />
Batch effect removal*endpoint<br />
Organization*classification<br />
algorithm*endpoint<br />
Residual<br />
0 10 20 30 40 50 60 70<br />
0 1 2 3 4 5 6 7 8 9<br />
Percentage of variation<br />
0.40<br />
0.30<br />
0.20<br />
0.10<br />
0<br />
–0.10<br />
–0.20<br />
on MCC values except for recursive feature elimination (RFE) that<br />
has an impact of −0.006. In the plots of the four selected interactions,<br />
the estimated BLUPs vary across endpoints. The large variation across<br />
endpoints implies the impact of the corresponding modeling factor on<br />
different endpoints can be very different. Among the four interaction<br />
plots (see Supplementary Fig. 6 for a clear labeling of each interaction<br />
term), the corresponding BLUPs of the three-way interaction<br />
of organization, classification algorithm and endpoint show the highest<br />
variation. This may be due to different tuning parameters applied<br />
to individual algorithms for different organizations, as was the case<br />
for KNN 32 .<br />
We also analyzed the relative importance of modeling factors on<br />
external-validation prediction performance using a decision tree<br />
model 38 . The analysis results revealed observations (Supplementary<br />
Fig. 7) largely consistent with those above. First, the endpoint code<br />
was the most influential modeling factor. Second, feature selection<br />
method, normalization and summarization method, classification<br />
method and organization code also contributed to prediction performance,<br />
but their contribution was relatively small.<br />
Feature list stability is correlated with endpoint predictability<br />
Prediction performance is the most important criterion for evaluating<br />
the performance of a predictive model and its modeling process.<br />
However, the robustness and mechanistic relevance of the model and<br />
b<br />
BLUP<br />
BLUP<br />
BLUP<br />
A B C D E F G H J K L<br />
Tox BR MM NB<br />
Endpoint<br />
0.10<br />
0.05<br />
0<br />
–0.05<br />
–0.10<br />
1 2 3 4 5<br />
Number of features<br />
FC+P<br />
dChip<br />
GA<br />
Loess<br />
MAS5<br />
Mean<br />
Median<br />
RMA<br />
Vote<br />
Logistic<br />
ML<br />
A B C D E F G H J K L A B C D E F G H J K L A B C D E F G H J K L<br />
Classification algorithm*<br />
endpoint<br />
0.10<br />
0.05<br />
0<br />
–0.05<br />
–0.10<br />
0.10<br />
0.05<br />
Summary normalization<br />
Feature selection method<br />
0.10<br />
0.20 0.20<br />
0.15<br />
0.10<br />
0.05<br />
0.10<br />
0<br />
–0.10<br />
0<br />
0.05<br />
–0.20<br />
0<br />
–0.05<br />
–0.30<br />
–0.05<br />
–0.40<br />
–0.10 –0.10<br />
–0.50<br />
0<br />
–0.05<br />
–0.10<br />
Number of features*<br />
endpoint<br />
0.10<br />
0.05<br />
0<br />
–0.05<br />
–0.10<br />
the corresponding gene signature is also important (Supplementary<br />
Fig. 8). That is, given comparable prediction performance between<br />
two modeling processes, the one yielding a more robust and reproducible<br />
gene signature across similar data sets (e.g., by swapping the<br />
training and validation sets), which is therefore less susceptible to<br />
sporadic fluctuations in the data, or the one that provides new insights<br />
to the underlying biology is preferable. Reproducibility or stability of<br />
feature sets is best studied by running the same model selection protocol<br />
on two distinct collections of samples, a scenario only possible, in<br />
this case, after the blind validation data were distributed to the data<br />
analysis teams that were asked to perform their analysis after swapping<br />
their original training and test sets. Supplementary Figures 9 and 10<br />
show that, although the feature space is extremely large for microarray<br />
data, different teams and protocols were able to consistently select the<br />
best-performing features. Analysis of the lists of features indicated that<br />
for endpoints relatively easy to predict, various data analysis teams<br />
arrived at models that used more common features and the overlap<br />
of the lists from the original and swap analyses is greater than those<br />
for more difficult endpoints (Supplementary Figs. 9–11). Therefore,<br />
the level of stability of feature lists can be associated to the level of difficulty<br />
of the prediction problem (Supplementary Fig. 11), although<br />
multiple models with different feature lists and comparable performance<br />
can be found from the same data set 39 . Functional analysis of the<br />
most frequently selected genes by all data analysis protocols shows<br />
0.10<br />
0.05<br />
0<br />
–0.05<br />
–0.10<br />
ANN<br />
SMO<br />
Classification algorithm<br />
A B C D E F G H J K L<br />
Tox BR MM NB<br />
Summary normalization*<br />
endpoint<br />
Tox BR MM NB Tox BR MM NB Tox BR MM NB<br />
Organization*classification*<br />
endpoint<br />
Figure 5 Effect of modeling factors on estimates of model performance. (a) Random-effect models of external validation performance (MCC) were<br />
developed to estimate a distinct variance component for each modeling factor and several selected interactions. The estimated variance components<br />
were then divided by their total in order to compare the proportion of variability explained by each modeling factor. The endpoint code contributes the<br />
most to the variability in external validation performance. (b) The BLUP plots of the corresponding factors having proportion of variation larger than 1%<br />
in a. Endpoint abbreviations (Tox., preclinical toxicity; BR, breast cancer; MM, multiple myeloma; NB, neuroblastoma). Endpoints H and L are the sex<br />
of the patient. Summary normalization abbreviations (GA, genetic algorithm; RMA, robust multichip analysis). Classification algorithm abbreviations<br />
(ANN, artificial neural network; DA, discriminant analysis; Forest, random forest; GLM, generalized linear model; KNN, K-nearest neighbors; Logistic,<br />
logistic regression; ML, maximum likelihood; NB, Naïve Bayes; NC, nearest centroid; PLS, partial least squares; RFE, recursive feature elimination;<br />
SMO, sequential minimal optimization; SVM, support vector machine; Tree, decision tree). Feature selection method abbreviations (Bscatter, betweenclass<br />
scatter; FC, fold change; KS, Kolmogorov-Smirnov algorithm; SAM, significance analysis of microarrays).<br />
nature biotechnology VOLUME 28 NUMBER 8 AUGUST 2010 833
A rt i c l e s<br />
© 2010 <strong>Nature</strong> America, Inc. All rights reserved.<br />
that many of these genes represent biological processes that are highly<br />
relevant to the clinical outcome that is being predicted 36 . The sexbased<br />
endpoints have the best overlap, whereas more difficult survival<br />
endpoints (in which disease processes are confounded by many other<br />
factors) have only marginally better overlap with biological processes<br />
relevant to the disease than that expected by random chance.<br />
Summary of MAQC-II observations and recommendations<br />
The MAQC-II data analysis teams comprised a diverse group, some<br />
of whom were experienced microarray analysts whereas others were<br />
graduate students with little experience. In aggregate, the group’s<br />
composition likely mimicked the broad scientific community engaged<br />
in building and publishing models derived from microarray data. The<br />
more than 30,000 models developed by 36 data analysis teams for<br />
13 endpoints from six diverse clinical and preclinical data sets are a<br />
rich source from which to highlight several important observations.<br />
First, model prediction performance was largely endpoint (biology)<br />
dependent (Figs. 2c and 3). The incorporation of multiple data<br />
sets and endpoints (including positive and negative controls) in the<br />
MAQC-II study design made this observation possible. Some endpoints<br />
are highly predictive based on the nature of the data, which<br />
makes it possible to build good models, provided that sound modeling<br />
procedures are used. Other endpoints are inherently difficult to predict<br />
regardless of the model development protocol.<br />
Second, there are clear differences in proficiency between data<br />
analysis teams (organizations) and such differences are correlated<br />
with the level of experience of the team. For example, the topperforming<br />
teams shown in Figure 3 were mainly industrial participants<br />
with many years of experience in microarray data analysis, whereas<br />
bottom-performing teams were mainly less-experienced graduate<br />
students or researchers. Based on results from the positive and negative<br />
endpoints, we noticed that simple errors were sometimes made,<br />
suggesting rushed efforts due to lack of time or unnoticed implementation<br />
flaws. This observation strongly suggests that mechanisms are<br />
needed to ensure the reliability of results presented to the regulatory<br />
agencies, journal editors and the research community. By examining<br />
the practices of teams whose models did not perform well, future<br />
studies might be able to identify pitfalls to be avoided. Likewise,<br />
practices adopted by top-performing teams can provide the basis for<br />
developing good modeling practices.<br />
Third, the internal validation performance from well-implemented,<br />
unbiased cross-validation shows a high degree of concordance with the<br />
external validation performance in a strict blinding process (Fig. 2).<br />
This observation was not possible from previously published studies<br />
owing to the small number of available endpoints tested in them.<br />
Fourth, many models with similar performance can be developed<br />
from a given data set (Fig. 2). Similar prediction performance is<br />
attainable when using different modeling algorithms and parameters,<br />
and simple data analysis methods often perform as well as more<br />
complicated approaches 32,40 . Although it is not essential to include<br />
the same features in these models to achieve comparable prediction<br />
performance, endpoints that were easier to predict generally yielded<br />
models with more common features, when analyzed by different<br />
teams (Supplementary Fig. 11).<br />
Finally, applying good modeling practices appeared to be more<br />
important than the actual choice of a particular algorithm over the<br />
others within the same step in the modeling process. This can be seen<br />
in the diverse choices of the modeling factors used by teams that produced<br />
models that performed well in the blinded validation (Table 2)<br />
where modeling factors did not universally contribute to variations in<br />
model performance among good performing teams (Fig. 5).<br />
Summarized below are the model building steps recommended to<br />
the MAQC-II data analysis teams. These may be applicable to model<br />
building practitioners in the general scientific community.<br />
Step one (design). There is no exclusive set of steps and procedures,<br />
in the form of a checklist, to be followed by any practitioner for all<br />
problems. However, normal good practice on the study design and<br />
the ratio of sample size to classifier complexity should be followed.<br />
The frequently used options for normalization, feature selection and<br />
classification are good starting points (Table 2).<br />
Step two (pilot study or internal validation). This can be accomplished<br />
by bootstrap or cross-validation such as the ten repeats of a<br />
fivefold cross-validation procedure adopted by most MAQC-II teams.<br />
The samples from the pilot study are not replaced for the pivotal<br />
study; rather they are augmented to achieve ‘appropriate’ target size.<br />
Step three (pivotal study or external validation). Many investigators<br />
assume that the most conservative approach to a pivotal study is to<br />
simply obtain a test set completely independent of the training set(s).<br />
However, it is good to keep in mind the exchange 34,35 regarding the<br />
fragility of results when the training and validation sets are swapped.<br />
Results from further resampling (including simple swapping as in<br />
MAQC-II) across the training and validation sets can provide important<br />
information about the reliability of the models and the modeling<br />
procedures, but the complete separation of the training and validation<br />
sets should be maintained 41 .<br />
Finally, a perennial issue concerns reuse of the independent validation<br />
set after modifications to an originally designed and validated<br />
data analysis algorithm or protocol. Such a process turns the validation<br />
set into part of the design or training set 42 . Ground rules must<br />
be developed for avoiding this approach and penalizing it when it<br />
occurs; and practitioners should guard against using it before such<br />
ground rules are well established.<br />
DISCUSSION<br />
MAQC-II conducted a broad observational study of the current community<br />
landscape of gene-expression profile–based predictive model<br />
development. Microarray gene expression profiling is among the most<br />
commonly used analytical tools in biomedical research. Analysis of<br />
the high-dimensional data generated by these experiments involves<br />
multiple steps and several critical decision points that can profoundly<br />
influence the soundness of the results 43 . An important requirement<br />
of a sound internal validation is that it must include feature selection<br />
and parameter optimization within each iteration to avoid overly optimistic<br />
estimations of prediction performance 28,29,44 . To what extent<br />
this information has been disseminated and followed by the scientific<br />
community in current microarray analysis remains unknown 33 .<br />
Concerns have been raised that results published by one group of<br />
investigators often cannot be confirmed by others even if the same<br />
data set is used 26 . An inability to confirm results may stem from any<br />
of several reasons: (i) insufficient information is provided about the<br />
methodology that describes which analysis has actually been done;<br />
(ii) data preprocessing (normalization, gene filtering and feature<br />
selection) is too complicated and insufficiently documented to be<br />
reproduced; or (iii) incorrect or biased complex analytical methods 26<br />
are performed. A distinct but related concern is that genomic data may<br />
yield prediction models that, even if reproducible on the discovery<br />
data set, cannot be extrapolated well in independent validation. The<br />
MAQC-II project provided a unique opportunity to address some of<br />
these concerns.<br />
Notably, we did not place restrictions on the model building methods<br />
used by the data analysis teams. Accordingly, they adopted numerous<br />
different modeling approaches (Table 2 and Supplementary Table 4).<br />
834 VOLUME 28 NUMBER 8 AUGUST 2010 nature biotechnology
A rt i c l e s<br />
© 2010 <strong>Nature</strong> America, Inc. All rights reserved.<br />
For example, feature selection methods varied widely, from statistical<br />
significance tests, to machine learning algorithms, to those more<br />
reliant on differences in expression amplitude, to those employing<br />
knowledge of putative biological mechanisms associated with the<br />
endpoint. Prediction algorithms also varied widely. To make internal<br />
validation performance results comparable across teams for different<br />
models, we recommended that a model’s internal performance was<br />
estimated using a ten times repeated fivefold cross-validation, but this<br />
recommendation was not strictly followed by all teams, which also<br />
allows us to survey internal validation approaches. The diversity of<br />
analysis protocols used by the teams is likely to closely resemble that<br />
of current research going forward, and in this context mimics reality.<br />
In terms of the space of modeling factors explored, MAQC-II is a survey<br />
of current practices rather than a randomized, controlled experiment;<br />
therefore, care should be taken in interpreting the results. For<br />
example, some teams did not analyze all endpoints, causing missing<br />
data (models) that may be confounded with other modeling factors.<br />
Overall, the procedure followed to nominate MAQC-II candidate<br />
models was quite effective in selecting models that performed reasonably<br />
well during validation using independent data sets, although<br />
generally the selected models did not do as well in validation as in<br />
training. The drop in performance associated with the validation<br />
highlights the importance of not relying solely on internal validation<br />
performance, and points to the need to subject every classifier to at<br />
least one external validation. The selection of the 13 candidate models<br />
from many nominated models was achieved through a peer-review<br />
collaborative effort of many experts and could be described as slow,<br />
tedious and sometimes subjective (e.g., a data analysis team could<br />
only contribute one of the 13 candidate models). Even though they<br />
were still subject to over-optimism, the internal and external performance<br />
estimates of the candidate models were more concordant than<br />
those of the overall set of models. Thus the review was productive in<br />
identifying characteristics of reliable models.<br />
An important lesson learned through MAQC-II is that it is almost<br />
impossible to retrospectively retrieve and document decisions that<br />
were made at every step during the feature selection and model development<br />
stage. This lack of complete description of the model building<br />
process is likely to be a common reason for the inability of different<br />
data analysis teams to fully reproduce each other’s results 32 . Therefore,<br />
although meticulously documenting the classifier building procedure<br />
can be cumbersome, we recommend that all genomic publications<br />
include supplementary materials describing the model building and<br />
evaluation process in an electronic format. MAQC-II is making available<br />
six data sets with 13 endpoints that can be used in the future as a<br />
benchmark to verify that software used to implement new approaches<br />
performs as expected. Subjecting new software to benchmarks against<br />
these data sets could reassure potential users that the software is<br />
mature enough to be used for the development of predictive models<br />
in new data sets. It would seem advantageous to develop alternative<br />
ways to help determine whether specific implementations of modeling<br />
approaches and performance evaluation procedures are sound, and to<br />
identify procedures to capture this information in public databases.<br />
The findings of the MAQC-II project suggest that when the same<br />
data sets are provided to a large number of data analysis teams, many<br />
groups can generate similar results even when different model building<br />
approaches are followed. This is concordant with studies 29,33 that<br />
found that given good quality data and an adequate number of informative<br />
features, most classification methods, if properly used, will yield<br />
similar predictive performance. This also confirms reports 6,7,39 on<br />
small data sets by individual groups that have suggested that several<br />
different feature selection methods and prediction algorithms can<br />
yield many models that are distinct, but have statistically similar<br />
performance. Taken together, these results provide perspective on<br />
the large number of publications in the bioinformatics literature that<br />
have examined the various steps of the multivariate prediction model<br />
building process and identified elements that are critical for achieving<br />
reliable results.<br />
An important and previously underappreciated observation from<br />
MAQC-II is that different clinical endpoints represent very different<br />
levels of classification difficulty. For some endpoints the currently<br />
available data are sufficient to generate robust models, whereas for<br />
other endpoints currently available data do not seem to be sufficient<br />
to yield highly predictive models. An analysis done as part of the<br />
MAQC-II project and that focused on the breast cancer data demonstrates<br />
these points in more detail 40 . It is also important to point out<br />
that for some clinically meaningful endpoints studied in the MAQC-II<br />
project, gene expression data did not seem to significantly outperform<br />
models based on clinical covariates alone, highlighting the challenges<br />
in predicting the outcome of patients in a heterogeneous population<br />
and the potential need to combine gene expression data with<br />
clinical covariates (unpublished data).<br />
The accuracy of the clinical sample annotation information may<br />
also play a role in the difficulty to obtain accurate prediction results<br />
on validation samples. For example, some samples were misclassified<br />
by almost all models (Supplementary Fig. 12). It is true even for some<br />
samples within the positive control endpoints H and L, as shown<br />
in Supplementary Table 8. Clinical information of neuroblastoma<br />
patients for whom the positive control endpoint L was uniformly<br />
misclassified were rechecked and the sex of three out of eight cases<br />
(NB412, NB504 and NB522) was found to be incorrectly annotated.<br />
The companion MAQC-II papers published elsewhere give more<br />
in-depth analyses of specific issues such as the clinical benefits of<br />
genomic classifiers (unpublished data), the impact of different<br />
modeling factors on prediction performance 45 , the objective assessment<br />
of microarray cross-platform prediction 46 , cross-tissue prediction<br />
47 , one-color versus two-color prediction comparison 48 ,<br />
functional analysis of gene signatures 36 and recommendation of a<br />
simple yet robust data analysis protocol based on the KNN 32 . For<br />
example, we systematically compared the classification performance<br />
resulting from one- and two-color gene-expression profiles of<br />
478 neuroblastoma samples and found that analyses based on either<br />
platform yielded similar classification performance 48 . This newly generated<br />
one-color data set has been used to evaluate the applicability of<br />
the KNN-based simple data analysis protocol to future data sets 32 . In<br />
addition, the MAQC-II Genome-Wide Association Working Group<br />
assessed the variabilities in genotype calling due to experimental or<br />
algorithmic factors 49 .<br />
In summary, MAQC-II has demonstrated that current methods<br />
commonly used to develop and assess multivariate gene-expression<br />
based predictors of clinical outcome were used appropriately by<br />
most of the analysis teams in this consortium. However, differences<br />
in proficiency emerged and this underscores the importance<br />
of proper implementation of otherwise robust analytical methods.<br />
Observations based on analysis of the MAQC-II data sets may be<br />
applicable to other diseases. The MAQC-II data sets are publicly<br />
available and are expected to be used by the scientific community<br />
as benchmarks to ensure proper modeling practices. The experience<br />
with the MAQC-II clinical data sets also reinforces the notion that<br />
clinical classification problems represent several different degrees<br />
of prediction difficulty that are likely to be associated with whether<br />
mRNA abundances measured in a specific data set are informative for<br />
the specific prediction problem. We anticipate that including other<br />
nature biotechnology VOLUME 28 NUMBER 8 AUGUST 2010 835
A rt i c l e s<br />
© 2010 <strong>Nature</strong> America, Inc. All rights reserved.<br />
types of biological data at the DNA, microRNA, protein or metabolite<br />
levels will enhance our capability to more accurately predict<br />
the clinically relevant endpoints. The good modeling practice guidelines<br />
established by MAQC-II and lessons learned from this unprecedented<br />
collaboration provide a solid foundation from which other<br />
high-dimensional biological data could be more reliably used for the<br />
purpose of predictive and personalized medicine.<br />
Methods<br />
Methods and any associated references are available in the online<br />
version of the paper at http://www.nature.com/naturebiotechnology/.<br />
Accession codes. All MAQC-II data sets are available through<br />
GEO (series accession number: GSE16716), the MAQC Web site<br />
(http://www.fda.gov/nctr/science/centers/toxicoinformatics/maqc/),<br />
ArrayTrack (http://www.fda.gov/nctr/science/centers/toxicoinformatics/ArrayTrack/)<br />
or CEBS (http://cebs.niehs.nih.gov/) accession<br />
number: 009-00002-0010-000-3.<br />
Note: Supplementary information is available on the <strong>Nature</strong> Biotechnology website.<br />
Acknowledgments<br />
The MAQC-II project was funded in part by the FDA’s Office of Critical Path<br />
Programs (to L.S.). Participants from the National Institutes of Health (NIH) were<br />
supported by the Intramural Research Program of NIH, Bethesda, Maryland or<br />
the Intramural Research Program of the NIH, National Institute of Environmental<br />
Health Sciences (NIEHS), Research Triangle Park, North Carolina. J.F. was<br />
supported by the Division of Intramural Research of the NIEHS under contract<br />
HHSN273200700046U. Participants from the Johns Hopkins University were<br />
supported by grants from the NIH (1R01GM083084-01 and 1R01RR021967-01A2<br />
to R.A.I. and T32GM074906 to M.M.). Participants from the Weill Medical College<br />
of Cornell University were partially supported by the Biomedical Informatics<br />
Core of the Institutional Clinical and Translational Science Award RFA-RM-07-<br />
002. F.C. acknowledges resources from The HRH Prince Alwaleed Bin Talal Bin<br />
Abdulaziz Alsaud Institute for Computational Biomedicine and from the David A.<br />
Cofrin Center for Biomedical Information at Weill Cornell. The data set from The<br />
Hamner Institutes for Health Sciences was supported by a grant from the American<br />
Chemistry Council’s Long Range Research Initiative. The breast cancer data set<br />
was generated with support of grants from NIH (R-01 to L.P.), The Breast Cancer<br />
Research Foundation (to L.P. and W.F.S.) and the Faculty Incentive Funds of the<br />
University of Texas MD Anderson Cancer Center (to W.F.S.). The data set from<br />
the University of Arkansas for Medical Sciences was supported by National Cancer<br />
Institute (NCI) PO1 grant CA55819-01A1, NCI R33 Grant CA97513-01, Donna D.<br />
and Donald M. Lambert Lebow Fund to Cure Myeloma and Nancy and Steven<br />
Grand Foundation. We are grateful to the individuals whose gene expression data<br />
were used in this study. All MAQC-II participants freely donated their time and<br />
reagents for the completion and analyses of the MAQC-II project. The MAQC-II<br />
consortium also thanks R. O’Neill for his encouragement and coordination among<br />
FDA Centers on the formation of the RBWG. The MAQC-II consortium gratefully<br />
dedicates this work in memory of R.F. Wagner who enthusiastically worked on the<br />
MAQC-II project and inspired many of us until he unexpectedly passed away in<br />
June 2008.<br />
DISCLAIMER<br />
This work includes contributions from, and was reviewed by, individuals at the<br />
FDA, the Environmental Protection Agency (EPA) and the NIH. This work has<br />
been approved for publication by these agencies, but it does not necessarily reflect<br />
official agency policy. Certain commercial materials and equipment are identified<br />
in order to adequately specify experimental procedures. In no case does such<br />
identification imply recommendation or endorsement by the FDA, the EPA or the<br />
NIH, nor does it imply that the items identified are necessarily the best available<br />
for the purpose.<br />
COMPETING FINANCIAL INTERESTS<br />
The authors declare competing financial interests: details accompany the full-text<br />
HTML version of the paper at http://www.nature.com/naturebiotechnology/.<br />
Published online at http://www.nature.com/naturebiotechnology/.<br />
Reprints and permissions information is available online at http://npg.nature.com/<br />
reprintsandpermissions/.<br />
1. Marshall, E. Getting the noise out of gene arrays. Science 306, 630–631 (2004).<br />
2. Frantz, S. An array of problems. Nat. Rev. Drug Discov. 4, 362–363 (2005).<br />
3. Michiels, S., Koscielny, S. & Hill, C. Prediction of cancer outcome with microarrays:<br />
a multiple random validation strategy. Lancet 365, 488–492 (2005).<br />
4. Ntzani, E.E. & Ioannidis, J.P. Predictive ability of DNA microarrays for cancer<br />
outcomes and correlates: an empirical assessment. Lancet 362, 1439–1444<br />
(2003).<br />
5. Ioannidis, J.P. Microarrays and molecular research: noise discovery? Lancet 365,<br />
454–455 (2005).<br />
6. Ein-Dor, L., Kela, I., Getz, G., Givol, D. & Domany, E. Outcome signature genes in<br />
breast cancer: is there a unique set? Bioinformatics 21, 171–178 (2005).<br />
7. Ein-Dor, L., Zuk, O. & Domany, E. Thousands of samples are needed to generate<br />
a robust gene list for predicting outcome in cancer. Proc. Natl. Acad. Sci. USA<br />
103, 5923–5928 (2006).<br />
8. Shi, L. et al. QA/QC: challenges and pitfalls facing the microarray community and<br />
regulatory agencies. Expert Rev. Mol. Diagn. 4, 761–777 (2004).<br />
9. Shi, L. et al. Cross-platform comparability of microarray technology: intra-platform<br />
consistency and appropriate data analysis procedures are essential. BMC<br />
Bioinformatics 6 Suppl 2, S12 (2005).<br />
10. Shi, L. et al. The MicroArray Quality Control (MAQC) project shows inter- and<br />
intraplatform reproducibility of gene expression measurements. Nat. Biotechnol.<br />
24, 1151–1161 (2006).<br />
11. Guo, L. et al. Rat toxicogenomic study reveals analytical consistency across<br />
microarray platforms. Nat. Biotechnol. 24, 1162–1169 (2006).<br />
12. Canales, R.D. et al. Evaluation of DNA microarray results with quantitative gene<br />
expression platforms. Nat. Biotechnol. 24, 1115–1122 (2006).<br />
13. Patterson, T.A. et al. Performance comparison of one-color and two-color platforms<br />
within the MicroArray Quality Control (MAQC) project. Nat. Biotechnol. 24,<br />
1140–1150 (2006).<br />
14. Shippy, R. et al. Using RNA sample titrations to assess microarray platform<br />
performance and normalization techniques. Nat. Biotechnol. 24, 1123–1131<br />
(2006).<br />
15. Tong, W. et al. Evaluation of external RNA controls for the assessment of microarray<br />
performance. Nat. Biotechnol. 24, 1132–1139 (2006).<br />
16. Irizarry, R.A. et al. Multiple-laboratory comparison of microarray platforms. Nat.<br />
Methods 2, 345–350 (2005).<br />
17. Strauss, E. Arrays of hope. Cell 127, 657–659 (2006).<br />
18. Shi, L., Perkins, R.G., Fang, H. & Tong, W. Reproducible and reliable microarray<br />
results through quality control: good laboratory proficiency and appropriate data<br />
analysis practices are essential. Curr. Opin. Biotechnol. 19, 10–18 (2008).<br />
19. Dudoit, S., Fridlyand, J. & Speed, T.P. Comparison of discrimination methods for<br />
the classification of tumors using gene expression data. J. Am. Stat. Assoc. 97,<br />
77–87 (2002).<br />
20. Goodsaid, F.M. et al. Voluntary exploratory data submissions to the US FDA and<br />
the EMA: experience and impact. Nat. Rev. Drug Discov. 9, 435–445 (2010).<br />
21. van ‘t Veer, L.J. et al. Gene expression profiling predicts clinical outcome of breast<br />
cancer. <strong>Nature</strong> 415, 530–536 (2002).<br />
22. Buyse, M. et al. Validation and clinical utility of a 70-gene prognostic signature for<br />
women with node-negative breast cancer. J. Natl. Cancer Inst. 98, 1183–1192<br />
(2006).<br />
23. Dumur, C.I. et al. Interlaboratory performance of a microarray-based gene expression<br />
test to determine tissue of origin in poorly differentiated and undifferentiated<br />
cancers. J. Mol. Diagn. 10, 67–77 (2008).<br />
24. Deng, M.C. et al. Noninvasive discrimination of rejection in cardiac allograft recipients<br />
using gene expression profiling. Am. J. Transplant. 6, 150–160 (2006).<br />
25. Coombes, K.R., Wang, J. & Baggerly, K.A. Microarrays: retracing steps. Nat. Med.<br />
13, 1276–1277, author reply 1277–1278 (2007).<br />
26. Ioannidis, J.P.A. et al. Repeatability of published microarray gene expression<br />
analyses. Nat. Genet. 41, 149–155 (2009).<br />
27. Baggerly, K.A., Edmonson, S.R., Morris, J.S. & Coombes, K.R. High-resolution serum<br />
proteomic patterns for ovarian cancer detection. Endocr. Relat. Cancer 11,<br />
583–584, author reply 585–587 (2004).<br />
28. Ambroise, C. & McLachlan, G.J. Selection bias in gene extraction on the basis of<br />
microarray gene-expression data. Proc. Natl. Acad. Sci. USA 99, 6562–6566<br />
(2002).<br />
29. Simon, R. Using DNA microarrays for diagnostic and prognostic prediction. Expert<br />
Rev. Mol. Diagn. 3, 587–595 (2003).<br />
30. Dobbin, K.K. et al. Interlaboratory comparability study of cancer gene expression<br />
analysis using oligonucleotide microarrays. Clin. Cancer Res. 11, 565–572<br />
(2005).<br />
31. Shedden, K. et al. Gene expression-based survival prediction in lung adenocarcinoma:<br />
a multi-site, blinded validation study. Nat. Med. 14, 822–827 (2008).<br />
32. Parry, R.M. et al. K-nearest neighbors (KNN) models for microarray gene-expression<br />
analysis and reliable clinical outcome prediction. Pharmacogenomics J. 10, 292–309<br />
(2010).<br />
33. Dupuy, A. & Simon, R.M. Critical review of published microarray studies for cancer<br />
outcome and guidelines on statistical analysis and reporting. J. Natl. Cancer Inst.<br />
99, 147–157 (2007).<br />
34. Dave, S.S. et al. Prediction of survival in follicular lymphoma based on molecular<br />
features of tumor-infiltrating immune cells. N. Engl. J. Med. 351, 2159–2169<br />
(2004).<br />
35. Tibshirani, R. Immune signatures in follicular lymphoma. N. Engl. J. Med. 352,<br />
1496–1497, author reply 1496–1497 (2005).<br />
836 VOLUME 28 NUMBER 8 AUGUST 2010 nature biotechnology
A rt i c l e s<br />
36. Shi, W. et al. Functional analysis of multiple genomic signatures demonstrates that<br />
classification algorithms choose phenotype-related genes. Pharmacogenomics J. 10,<br />
310–323 (2010).<br />
37. Robinson, G.K. That BLUP is a good thing: the estimation of random effects.<br />
Stat. Sci. 6, 15–32 (1991).<br />
38. Hothorn, T., Hornik, K. & Zeileis, A. Unbiased recursive partitioning: a conditional<br />
inference framework. J. Comput. Graph. Statist. 15, 651–674 (2006).<br />
39. Boutros, P.C. et al. Prognostic gene signatures for non-small-cell lung cancer. Proc.<br />
Natl. Acad. Sci. USA 106, 2824–2828 (2009).<br />
40. Popovici, V. et al. Effect of training sample size and classification difficulty on the<br />
accuracy of genomic predictors. Breast Cancer Res. 12, R5 (2010).<br />
41. Yousef, W.A., Wagner, R.F. & Loew, M.H. Assessing classifiers from two independent<br />
data sets using ROC analysis: a nonparametric approach. IEEE Trans. Pattern Anal.<br />
Mach. Intell. 28, 1809–1817 (2006).<br />
42. Gur, D., Wagner, R.F. & Chan, H.P. On the repeated use of databases for testing<br />
incremental improvement of computer-aided detection schemes. Acad. Radiol. 11,<br />
103–105 (2004).<br />
43. Allison, D.B., Cui, X., Page, G.P. & Sabripour, M. Microarray data analysis: from<br />
disarray to consolidation and consensus. Nat. Rev. Genet. 7, 55–65 (2006).<br />
44. Wood, I.A., Visscher, P.M. & Mengersen, K.L. Classification based upon gene expression<br />
data: bias and precision of error rates. Bioinformatics 23, 1363–1370 (2007).<br />
45. Luo, J. et al. A comparison of batch effect removal methods for enhancement of<br />
prediction performance using MAQC-II microarray gene expression data.<br />
Pharmacogenomics J. 10, 278–291 (2010).<br />
46. Fan, X. et al. Consistency of predictive signature genes and classifiers generated using<br />
different microarray platforms. Pharmacogenomics J. 10, 247–257 (2010).<br />
47. Huang, J. et al. Genomic indicators in the blood predict drug-induced liver injury.<br />
Pharmacogenomics J. 10, 267–277 (2010).<br />
48. Oberthuer, A. et al. Comparison of performance of one-color and two-color geneexpression<br />
analyses in predicting clinical endpoints of neuroblastoma patients.<br />
Pharmacogenomics J. 10, 258–266 (2010).<br />
49. Hong, H. et al. Assessing sources of inconsistencies in genotypes and their effects<br />
on genome-wide association studies with HapMap samples. Pharmacogenomics J.<br />
10, 364–374 (2010).<br />
© 2010 <strong>Nature</strong> America, Inc. All rights reserved.<br />
Leming Shi 1 , Gregory Campbell 2 , Wendell D Jones 3 , Fabien Campagne 4 , Zhining Wen 1 , Stephen J Walker 5 ,<br />
Zhenqiang Su 6 , Tzu-Ming Chu 7 , Federico M Goodsaid 8 , Lajos Pusztai 9 , John D Shaughnessy Jr 10 ,<br />
André Oberthuer 11 , Russell S Thomas 12 , Richard S Paules 13 , Mark Fielden 14 , Bart Barlogie 10 , Weijie Chen 2 ,<br />
Pan Du 15 , Matthias Fischer 11 , Cesare Furlanello 16 , Brandon D Gallas 2 , Xijin Ge 17 , Dalila B Megherbi 18 ,<br />
W Fraser Symmans 19 , May D Wang 20 , John Zhang 21 , Hans Bitter 22 , Benedikt Brors 23 , Pierre R Bushel 13 ,<br />
Max Bylesjo 24 , Minjun Chen 1 , Jie Cheng 25 , Jing Cheng 26 , Jeff Chou 13 , Timothy S Davison 27 , Mauro Delorenzi 28 ,<br />
Youping Deng 29 , Viswanath Devanarayan 30 , David J Dix 31 , Joaquin Dopazo 32 , Kevin C Dorff 33 , Fathi Elloumi 31 ,<br />
Jianqing Fan 34 , Shicai Fan 35 , Xiaohui Fan 36 , Hong Fang 6 , Nina Gonzaludo 37 , Kenneth R Hess 38 ,<br />
Huixiao Hong 1 , Jun Huan 39 , Rafael A Irizarry 40 , Richard Judson 31 , Dilafruz Juraeva 23 , Samir Lababidi 41 ,<br />
Christophe G Lambert 42 , Li Li 7 , Yanen Li 43 , Zhen Li 31 , Simon M Lin 15 , Guozhen Liu 44 , Edward K Lobenhofer 45 ,<br />
Jun Luo 21 , Wen Luo 46 , Matthew N McCall 40 , Yuri Nikolsky 47 , Gene A Pennello 2 , Roger G Perkins 1 , Reena Philip 2 ,<br />
Vlad Popovici 28 , Nathan D Price 48 , Feng Qian 6 , Andreas Scherer 49 , Tieliu Shi 50 , Weiwei Shi 47 , Jaeyun Sung 48 ,<br />
Danielle Thierry-Mieg 51 , Jean Thierry-Mieg 51 , Venkata Thodima 52 , Johan Trygg 24 , Lakshmi Vishnuvajjala 2 ,<br />
Sue Jane Wang 8 , Jianping Wu 53 , Yichao Wu 54 , Qian Xie 55 , Waleed A Yousef 56 , Liang Zhang 53 , Xuegong Zhang 35 ,<br />
Sheng Zhong 57 , Yiming Zhou 10 , Sheng Zhu 53 , Dhivya Arasappan 6 , Wenjun Bao 7 , Anne Bergstrom Lucas 58 ,<br />
Frank Berthold 11 , Richard J Brennan 47 , Andreas Buness 59 , Jennifer G Catalano 41 , Chang Chang 50 ,<br />
Rong Chen 60 , Yiyu Cheng 36 , Jian Cui 50 , Wendy Czika 7 , Francesca Demichelis 61 , Xutao Deng 62 ,<br />
Damir Dosymbekov 63 , Roland Eils 23 , Yang Feng 34 , Jennifer Fostel 13 , Stephanie Fulmer-Smentek 58 ,<br />
James C Fuscoe 1 , Laurent Gatto 64 , Weigong Ge 1 , Darlene R Goldstein 65 , Li Guo 66 , Donald N Halbert 67 ,<br />
Jing Han 41 , Stephen C Harris 1 , Christos Hatzis 68 , Damir Herman 69 , Jianping Huang 36 , Roderick V Jensen 70 ,<br />
Rui Jiang 35 , Charles D Johnson 71 , Giuseppe Jurman 16 , Yvonne Kahlert 11 , Sadik A Khuder 72 , Matthias Kohl 73 ,<br />
Jianying Li 74 , Li Li 75 , Menglong Li 76 , Quan-Zhen Li 77 , Shao Li 36 , Zhiguang Li 1 , Jie Liu 1 , Ying Liu 35 , Zhichao Liu 1 ,<br />
Lu Meng 35 , Manuel Madera 18 , Francisco Martinez-Murillo 2 , Ignacio Medina 78 , Joseph Meehan 6 , Kelci Miclaus 7 ,<br />
Richard A Moffitt 20 , David Montaner 78 , Piali Mukherjee 33 , George J Mulligan 79 , Padraic Neville 7 ,<br />
Tatiana Nikolskaya 47 , Baitang Ning 1 , Grier P Page 80 , Joel Parker 3 , R Mitchell Parry 20 , Xuejun Peng 81 ,<br />
Ron L Peterson 82 , John H Phan 20 , Brian Quanz 39 , Yi Ren 83 , Samantha Riccadonna 16 , Alan H Roter 84 ,<br />
Frank W Samuelson 2 , Martin M Schumacher 85 , Joseph D Shambaugh 86 , Qiang Shi 1 , Richard Shippy 87 ,<br />
Shengzhu Si 88 , Aaron Smalter 39 , Christos Sotiriou 89 , Mat Soukup 8 , Frank Staedtler 85 , Guido Steiner 90 ,<br />
Todd H Stokes 20 , Qinglan Sun 53 , Pei-Yi Tan 7 , Rong Tang 2 , Zivana Tezak 2 , Brett Thorn 1 , Marina Tsyganova 63 ,<br />
Yaron Turpaz 91 , Silvia C Vega 92 , Roberto Visintainer 16 , Juergen von Frese 93 , Charles Wang 62 , Eric Wang 21 ,<br />
Junwei Wang 50 , Wei Wang 94 , Frank Westermann 23 , James C Willey 95 , Matthew Woods 21 , Shujian Wu 96 ,<br />
Nianqing Xiao 97 , Joshua Xu 6 , Lei Xu 1 , Lun Yang 1 , Xiao Zeng 44 , Jialu Zhang 8 , Li Zhang 8 , Min Zhang 1 ,<br />
Chen Zhao 50 , Raj K Puri 41 , Uwe Scherf 2 , Weida Tong 1 & Russell D Wolfinger 7<br />
1 National Center for Toxicological Research, US Food and Drug Administration, Jefferson, Arkansas, USA. 2 Center for Devices and Radiological Health, US Food and<br />
Drug Administration, Silver Spring, Maryland, USA. 3 Expression Analysis Inc., Durham, North Carolina, USA. 4 Department of Physiology and Biophysics and HRH<br />
Prince Alwaleed Bin Talal Bin Abdulaziz Alsaud Institute for Computational Biomedicine, Weill Medical College of Cornell University, New York, New York, USA.<br />
5 Wake Forest Institute for Regenerative Medicine, Wake Forest University, Winston-Salem, North Carolina, USA. 6 Z-Tech, an ICF International Company at NCTR/FDA,<br />
Jefferson, Arkansas, USA. 7 SAS Institute Inc., Cary, North Carolina, USA. 8 Center for Drug Evaluation and Research, US Food and Drug Administration, Silver Spring,<br />
Maryland, USA. 9 Breast Medical Oncology Department, University of Texas (UT) M.D. Anderson Cancer Center, Houston, Texas, USA. 10 Myeloma Institute for Research<br />
nature biotechnology VOLUME 28 NUMBER 8 AUGUST 2010 837
A rt i c l e s<br />
© 2010 <strong>Nature</strong> America, Inc. All rights reserved.<br />
and Therapy, University of Arkansas for Medical Sciences, Little Rock, Arkansas, USA. 11 Department of Pediatric Oncology and Hematology and Center for Molecular<br />
Medicine (CMMC), University of Cologne, Cologne, Germany. 12 The Hamner Institutes for Health Sciences, Research Triangle Park, North Carolina, USA. 13 National<br />
Institute of Environmental Health Sciences, National Institutes of Health, Research Triangle Park, North Carolina, USA. 14 Roche Palo Alto LLC, South San Francisco,<br />
California, USA. 15 Biomedical Informatics Center, Northwestern University, Chicago, Illinois, USA. 16 Fondazione Bruno Kessler, Povo-Trento, Italy. 17 Department of<br />
Mathematics & Statistics, South Dakota State University, Brookings, South Dakota, USA. 18 CMINDS Research Center, Department of Electrical and Computer<br />
Engineering, University of Massachusetts Lowell, Lowell, Massachusetts, USA. 19 Department of Pathology, UT M.D. Anderson Cancer Center, Houston, Texas, USA.<br />
20 Department of Biomedical Engineering, Georgia Institute of Technology and Emory University, Atlanta, Georgia, USA. 21 Systems Analytics Inc., Waltham,<br />
Massachusetts, USA. 22 Hoffmann-LaRoche, Nutley, New Jersey, USA. 23 Department of Theoretical Bioinformatics, German Cancer Research Center (DKFZ),<br />
Heidelberg, Germany. 24 Computational Life Science Cluster (CLiC), Chemical Biology Center (KBC), Umeå University, Umeå, Sweden. 25 GlaxoSmithKline, Collegeville,<br />
Pennsylvania, USA. 26 Medical Systems Biology Research Center, School of Medicine, Tsinghua University, Beijing, China. 27 Almac Diagnostics Ltd., Craigavon, UK.<br />
28 Swiss Institute of Bioinformatics, Lausanne, Switzerland. 29 Department of Biological Sciences, University of Southern Mississippi, Hattiesburg, Mississippi, USA.<br />
30 Global Pharmaceutical R&D, Abbott Laboratories, Souderton, Pennsylvania, USA. 31 National Center for Computational Toxicology, US Environmental Protection<br />
Agency, Research Triangle Park, North Carolina, USA. 32 Department of Bioinformatics and Genomics, Centro de Investigación Príncipe Felipe (CIPF), Valencia, Spain.<br />
33 HRH Prince Alwaleed Bin Talal Bin Abdulaziz Alsaud Institute for Computational Biomedicine, Weill Medical College of Cornell University, New York, New York,<br />
USA. 34 Department of Operation Research and Financial Engineering, Princeton University, Princeton, New Jersey, USA. 35 MOE Key Laboratory of Bioinformatics<br />
and Bioinformatics Division, TNLIST / Department of Automation, Tsinghua University, Beijing, China. 36 Institute of Pharmaceutical Informatics, College of<br />
Pharmaceutical Sciences, Zhejiang University, Hangzhou, Zhejiang, China. 37 Roche Palo Alto LLC, Palo Alto, California, USA. 38 Department of Biostatistics,<br />
UT M.D. Anderson Cancer Center, Houston, Texas, USA. 39 Department of Electrical Engineering & Computer Science, University of Kansas, Lawrence, Kansas, USA.<br />
40 Department of Biostatistics, Johns Hopkins University, Baltimore, Maryland, USA. 41 Center for Biologics Evaluation and Research, US Food and Drug<br />
Administration, Bethesda, Maryland, USA. 42 Golden Helix Inc., Bozeman, Montana, USA. 43 Department of Computer Science, University of Illinois at Urbana-<br />
Champaign, Urbana, Illinois, USA. 44 SABiosciences Corp., a Qiagen Company, Frederick, Maryland, USA. 45 Cogenics, a Division of Clinical Data Inc., Morrisville,<br />
North Carolina, USA. 46 Ligand Pharmaceuticals Inc., La Jolla, California, USA. 47 GeneGo Inc., Encinitas, California, USA. 48 Department of Chemical and<br />
Biomolecular Engineering, University of Illinois at Urbana-Champaign, Urbana, Illinois, USA. 49 Spheromics, Kontiolahti, Finland. 50 The Center for Bioinformatics and<br />
The Institute of Biomedical Sciences, School of Life Science, East China Normal University, Shanghai, China. 51 National Center for Biotechnology Information,<br />
National Institutes of Health, Bethesda, Maryland, USA. 52 Rockefeller Research Laboratories, Memorial Sloan-Kettering Cancer Center, New York, New York, USA.<br />
53 CapitalBio Corporation, Beijing, China. 54 Department of Statistics, North Carolina State University, Raleigh, North Carolina, USA. 55 SRA International (EMMES),<br />
Rockville, Maryland, USA. 56 Helwan University, Helwan, Egypt. 57 Department of Bioengineering, University of Illinois at Urbana-Champaign, Urbana, Illinois, USA.<br />
58 Agilent Technologies Inc., Santa Clara, California, USA. 59 F. Hoffmann-La Roche Ltd., Basel, Switzerland. 60 Stanford Center for Biomedical Informatics Research,<br />
Stanford University, Stanford, California, USA. 61 Department of Pathology and Laboratory Medicine and HRH Prince Alwaleed Bin Talal Bin Abdulaziz Alsaud Institute<br />
for Computational Biomedicine, Weill Medical College of Cornell University, New York, New York, USA. 62 Cedars-Sinai Medical Center, UCLA David Geffen School of<br />
Medicine, Los Angeles, California, USA. 63 Vavilov Institute for General Genetics, Russian Academy of Sciences, Moscow, Russia. 64 DNAVision SA, Gosselies, Belgium.<br />
65 École Polytechnique Fédérale de Lausanne (EPFL), Lausanne, Switzerland. 66 State Key Laboratory of Multi-phase Complex Systems, Institute of Process<br />
Engineering, Chinese Academy of Sciences, Beijing, China. 67 Abbott Laboratories, Abbott Park, Illinois, USA. 68 Nuvera Biosciences Inc., Woburn, Massachusetts,<br />
USA. 69 Winthrop P. Rockefeller Cancer Institute, University of Arkansas for Medical Sciences, Little Rock, Arkansas, USA. 70 VirginiaTech, Blacksburg, Virgina, USA.<br />
71 BioMath Solutions, LLC, Austin, Texas, USA. 72 Bioinformatic Program, University of Toledo, Toledo, Ohio, USA. 73 Department of Mathematics, University of<br />
Bayreuth, Bayreuth, Germany. 74 Lineberger Comprehensive Cancer Center, University of North Carolina, Chapel Hill, North Carolina, USA. 75 Pediatric Department,<br />
Stanford University, Stanford, California, USA. 76 College of Chemistry, Sichuan University, Chengdu, Sichuan, China. 77 University of Texas Southwestern Medical<br />
Center (UTSW), Dallas, Texas, USA. 78 Centro de Investigación Príncipe Felipe (CIPF), Valencia, Spain. 79 Millennium Pharmaceuticals Inc., Cambridge,<br />
Massachusetts, USA. 80 RTI International, Atlanta, Georgia, USA. 81 Takeda Global R & D Center, Inc., Deerfield, Illinois, USA. 82 Novartis Institutes of Biomedical<br />
Research, Cambridge, Massachusetts, USA. 83 W.M. Keck Center for Collaborative Neuroscience, Rutgers, The State University of New Jersey, Piscataway, New Jersey,<br />
USA. 84 Entelos Inc., Foster City, California, USA. 85 Biomarker Development, Novartis Institutes of BioMedical Research, Novartis Pharma AG, Basel, Switzerland.<br />
86 Genedata Inc., Lexington, Massachusetts, USA. 87 Affymetrix Inc., Santa Clara, California, USA. 88 Department of Chemistry and Chemical Engineering, Hefei<br />
Teachers College, Hefei, Anhui, China. 89 Institut Jules Bordet, Brussels, Belgium. 90 Biostatistics, F. Hoffmann-La Roche Ltd., Basel, Switzerland. 91 Lilly Singapore<br />
Centre for Drug Discovery, Immunos, Singapore. 92 Microsoft Corporation, US Health Solutions Group, Redmond, Washington, USA. 93 Data Analysis Solutions DA-SOL<br />
GmbH, Greifenberg, Germany. 94 Cornell University, Ithaca, New York, USA. 95 Division of Pulmonary and Critical Care Medicine, Department of Medicine, University of<br />
Toledo Health Sciences Campus, Toledo, Ohio, USA. 96 Bristol-Myers Squibb, Pennington, New Jersey, USA. 97 OpGen Inc., Gaithersburg, Maryland, USA.<br />
838 VOLUME 28 NUMBER 8 AUGUST 2010 nature biotechnology
© 2010 <strong>Nature</strong> America, Inc. All rights reserved.<br />
ONLINE METHODS<br />
MAQC-II participants. MAQC-II participants can be grouped into several<br />
categories. Data providers are the participants who provided data sets to the<br />
consortium. The MAQC-II Regulatory Biostatistics Working Group, whose<br />
members included a number of biostatisticians, provided guidance and standard<br />
operating procedures for model development and performance estimation. One<br />
or more data analysis teams were formed at each organization. Each data analysis<br />
team actively analyzed the data sets and produced prediction models. Other participants<br />
also contributed to discussion and execution of the project. The 36 data<br />
analysis teams listed in Supplementary Table 3 developed data analysis protocols<br />
and predictive models for one or more of the 13 endpoints. The teams included<br />
more than 100 scientists and engineers with diverse backgrounds in machine<br />
learning, statistics, biology, medicine and chemistry, among others. They volunteered<br />
tremendous time and effort to conduct the data analysis tasks.<br />
Six data sets including 13 prediction endpoints. To increase the chance<br />
that MAQC-II would reach generalized conclusions, consortium members<br />
strongly believed that they needed to study several data sets, each of high<br />
quality and sufficient size, which would collectively represent a diverse set of<br />
prediction tasks. Accordingly, significant early effort went toward the selection<br />
of appropriate data sets. Over ten nominated data sets were reviewed<br />
for quality of sample collection and processing consistency, and quality of<br />
microarray and clinical data. Six data sets with 13 endpoints were ultimately<br />
selected among those nominated during a face-to-face project meeting with<br />
extensive deliberations among many participants (Table 1). Importantly, three<br />
preclinical (toxicogenomics) and three clinical data sets were selected to test<br />
whether baseline practice conclusions could be generalized across these rather<br />
disparate experimental types. An important criterion for data set selection<br />
was the anticipated support of MAQC-II by the data provider and the commitment<br />
to continue experimentation to provide a large external validation<br />
test set of comparable size to the training set. The three toxicogenomics data<br />
sets would allow the development of predictive models that predict toxicity<br />
of compounds in animal models, a prediction task of interest to the pharmaceutical<br />
industry, which could use such models to speed up the evaluation of<br />
toxicity for new drug candidates. The three clinical data sets were for endpoints<br />
associated with three diseases, breast cancer (BR), multiple myeloma (MM)<br />
and neuroblastoma (NB). Each clinical data set had more than one endpoint,<br />
and together incorporated several types of clinical applications, including<br />
treatment outcome and disease prognosis. The MAQC-II predictive modeling<br />
was limited to binary classification problems; therefore, continuous endpoint<br />
values such as overall survival (OS) and event-free survival (EFS) times were<br />
dichotomized using a ‘milestone’ cutoff of censor data. Prediction endpoints<br />
were chosen to span a wide range of prediction difficulty. Two endpoints,<br />
H (CPS1) and L (NEP_S), representing the sex of the patients, were used as<br />
positive control endpoints, as they are easily predictable by microarrays. Two<br />
other endpoints, I (CPR1) and M (NEP_R), representing randomly assigned<br />
class labels, were designed to serve as negative control endpoints, as they<br />
are not supposed to be predictable. Data analysis teams were not aware of<br />
the characteristics of endpoints H, I, L and M until their swap prediction<br />
results had been submitted. If a data analysis protocol did not yield models to<br />
accurately predict endpoints H and L, or if a data analysis protocol claims to<br />
be able to yield models to accurately predict endpoints I and M, something<br />
must have gone wrong.<br />
The Hamner data set (endpoint A) was provided by The Hamner Institutes<br />
for Health Sciences. The study objective was to apply microarray gene expression<br />
data from the lung of female B6C3F1 mice exposed to a 13-week treatment<br />
of chemicals to predict increased lung tumor incidence in the 2-year<br />
rodent cancer bioassays of the National Toxicology Program 50 . If successful,<br />
the results may form the basis of a more efficient and economical approach<br />
for evaluating the carcinogenic activity of chemicals. Microarray analysis was<br />
performed using Affymetrix Mouse Genome 430 2.0 arrays on three to four<br />
mice per treatment group, and a total of 70 mice were analyzed and used as<br />
MAQC-II’s training set. Additional data from another set of 88 mice were<br />
collected later and provided as MAQC-II’s external validation set.<br />
The Iconix data set (endpoint B) was provided by Iconix Biosciences.<br />
The study objective was to assess, upon short-term exposure, hepatic tumor<br />
induction by nongenotoxic chemicals 51 , as there are currently no accurate and<br />
well-validated short-term tests to identify nongenotoxic hepatic tumorigens,<br />
thus necessitating an expensive 2-year rodent bioassay before a risk assessment<br />
can begin. The training set consists of hepatic gene expression data from 216<br />
male Sprague-Dawley rats treated for 5 d with one of 76 structurally and mechanistically<br />
diverse nongenotoxic hepatocarcinogens and nonhepatocarcinogens.<br />
The validation set consists of 201 male Sprague-Dawley rats treated for 5 d with<br />
one of 68 structurally and mechanistically diverse nongenotoxic hepatocarcinogens<br />
and nonhepatocarcinogens. Gene expression data were generated using the<br />
Amersham Codelink Uniset Rat 1 Bioarray (GE HealthCare) 52 . The separation<br />
of the training set and validation set was based on the time when the microarray<br />
data were collected; that is, microarrays processed earlier in the study<br />
were used as training and those processed later were used as validation.<br />
The NIEHS data set (endpoint C) was provided by the National Institute<br />
of Environmental Health Sciences (NIEHS) of the US National Institutes<br />
of Health. The study objective was to use microarray gene expression data<br />
acquired from the liver of rats exposed to hepatotoxicants to build classifiers<br />
for prediction of liver necrosis. The gene expression ‘compendium’ data set<br />
was collected from 418 rats exposed to one of eight compounds (1,2-dichlorobenzene,<br />
1,4-dichlorobenzene, bromobenzene, monocrotaline, N-nitrosomorpholine,<br />
thioacetamide, galactosamine and diquat dibromide). All eight<br />
compounds were studied using standardized procedures, that is, a common<br />
array platform (Affymetrix Rat 230 2.0 microarray), experimental procedures<br />
and data retrieving and analysis processes. For details of the experimental<br />
design see ref. 53. Briefly, for each compound, four to six male, 12-week-old<br />
F344 rats were exposed to a low dose, mid dose(s) and a high dose of the toxicant<br />
and sacrificed 6, 24 and 48 h later. At necropsy, liver was harvested for<br />
RNA extraction, histopathology and clinical chemistry assessments.<br />
Animal use in the studies was approved by the respective Institutional<br />
Animal Use and Care Committees of the data providers and was conducted<br />
in accordance with the National Institutes of Health (NIH) guidelines<br />
for the care and use of laboratory animals. Animals were housed in fully<br />
accredited American Association for Accreditation of Laboratory Animal<br />
Care facilities.<br />
The human breast cancer (BR) data set (endpoints D and E) was contributed<br />
by the University of Texas M.D. Anderson Cancer Center. Gene expression data<br />
from 230 stage I–III breast cancers were generated from fine needle aspiration<br />
specimens of newly diagnosed breast cancers before any therapy. The biopsy<br />
specimens were collected sequentially during a prospective pharmacogenomic<br />
marker discovery study between 2000 and 2008. These specimens represent<br />
70–90% pure neoplastic cells with minimal stromal contamination 54 . Patients<br />
received 6 months of preoperative (neoadjuvant) chemotherapy including<br />
paclitaxel (Taxol), 5-fluorouracil, cyclophosphamide and doxorubicin<br />
(Adriamycin) followed by surgical resection of the cancer. Response to preoperative<br />
chemotherapy was categorized as a pathological complete response<br />
(pCR = no residual invasive cancer in the breast or lymph nodes) or residual<br />
invasive cancer (RD), and used as endpoint D for prediction. Endpoint E is the<br />
clinical estrogen-receptor status as established by immunohistochemistry 55 .<br />
RNA extraction and gene expression profiling were performed in multiple<br />
batches over time using Affymetrix U133A microarrays. Genomic analysis of<br />
a subset of this sequentially accrued patient population were reported previously<br />
56 . For each endpoint, the first 130 cases were used as a training set and<br />
the next 100 cases were used as an independent validation set.<br />
The multiple myeloma (MM) data set (endpoints F, G, H and I) was contributed<br />
by the Myeloma Institute for Research and Therapy at the University<br />
of Arkansas for Medical Sciences. Gene expression profiling of highly purified<br />
bone marrow plasma cells was performed in newly diagnosed patients with<br />
MM 57–59 . The training set consisted of 340 cases enrolled in total therapy 2<br />
(TT2) and the validation set comprised 214 patients enrolled in total therapy 3<br />
(TT3) 59 . Plasma cells were enriched by anti-CD138 immunomagnetic bead<br />
selection of mononuclear cell fractions of bone marrow aspirates in a central<br />
laboratory. All samples applied to the microarray contained >85% plasma<br />
cells as determined by two-color flow cytometry (CD38 + and CD45 − /dim)<br />
performed after selection. Dichotomized overall survival (OS) and event-free<br />
survival (EFS) were determined based on a 2-year milestone cutoff. A gene<br />
expression model of high-risk multiple myeloma was developed and validated<br />
by the data provider 58 and later on validated in three additional independent<br />
data sets 60–62 .<br />
doi:10.1038/nbt.1665<br />
nature biotechnology
© 2010 <strong>Nature</strong> America, Inc. All rights reserved.<br />
The neuroblastoma (NB) data set (endpoints J, K, L and M) was contributed<br />
by the Children’s Hospital of the University of Cologne, Germany. Tumor<br />
samples were checked by a pathologist before RNA isolation; only samples<br />
with ≥60% tumor content were used and total RNA was isolated from ~50 mg<br />
of snap-frozen neuroblastoma tissue obtained before chemotherapeutic<br />
treatment. First, 502 preexisting 11 K Agilent dye-flipped, dual-color replicate<br />
profiles for 251 patients were provided 63 . Of these, profiles of 246 neuroblastoma<br />
samples passed an independent MAQC-II quality assessment by majority<br />
decision and formed the MAQC-II training data set. Subsequently, 514 dyeflipped<br />
dual-color 11 K replicate profiles for 256 independent neuroblastoma<br />
tumor samples were generated and profiles for 253 samples were selected to<br />
form the MAQC-II validation set. Of note, for one patient of the validation<br />
set, two different tumor samples were analyzed using both versions of the<br />
2 × 11K microarray (see below). All dual-color gene-expression of the MAQC-II<br />
training set were generated using a customized 2 × 11K neuroblastoma-related<br />
microarray 63 . Furthermore, 20 patients of the MAQC-II validation set were<br />
also profiled using this microarray. Dual-color profiles of the remaining<br />
patients of the MAQC-II validation set were performed using a slightly revised<br />
version of the 2 × 11K microarray. This version V2.0 of the array comprised<br />
200 novel oligonucleotide probes whereas 100 oligonucleotide probes of the<br />
original design were removed due to consistent low expression values (near<br />
background) observed in the training set profiles. These minor modifications<br />
of the microarray design resulted in a total of 9,986 probes present on both<br />
versions of the 2 × 11K microarray. The experimental protocol did not differ<br />
between both sets and gene-expression profiles were performed as described 63 .<br />
Furthermore, single-color gene-expression profiles were generated for 478/499<br />
neuroblastoma samples of the MAQC-II dual-color training and validation sets<br />
(training set 244/246; validation set 234/253). For the remaining 21 samples<br />
no single-color data were available, due to either shortage of tumor material<br />
of these patients (n = 15), poor experimental quality of the generated singlecolor<br />
profiles (n = 5), or correlation of one single-color profile to two different<br />
dual-color profiles for the one patient profiled with both versions of the 2 ×<br />
11K microarrays (n = 1). Single-color gene-expression profiles were generated<br />
using customized 4 × 44K oligonucleotide microarrays produced by Agilent<br />
Technologies. These 4 × 44K microarrays included all probes represented by<br />
Agilent’s Whole Human Genome Oligo Microarray and all probes of the version<br />
V2.0 of the 2 × 11K customized microarray that were not present in the<br />
former probe set. Labeling and hybridization was performed following the<br />
manufacturer’s protocol as described 48 .<br />
Sample annotation information along with clinical co-variates of the patient<br />
cohorts is available at the MAQC web site (http://edkb.fda.gov/MAQC/). The<br />
institutional review boards of the respective providers of the clinical microarray<br />
data sets had approved the research studies, and all subjects had provided<br />
written informed consent to both treatment protocols and sample procurement,<br />
in accordance with the Declaration of Helsinki.<br />
MAQC-II effort and data analysis procedure. This section provides details<br />
about some of the analysis steps presented in Figure 1. Steps 2–4 in a first<br />
round of analysis was conducted where each data analysis team analyzed<br />
MAQC-II data sets to generate predictive models and associated performance<br />
estimates. After this first round of analysis, most participants attended<br />
a consortium meeting where approaches were presented and discussed. The<br />
meeting helped members decide on a common performance evaluation protocol,<br />
which most data analysis teams agreed to follow to render performance<br />
statistics comparable across the consortium. It should be noted that some data<br />
analysis teams decided not to follow the recommendations for performance<br />
evaluation protocol and used instead an approach of their choosing, resulting<br />
in various internal validation approaches in the final results. Data analysis<br />
teams were given 2 months to implement the revised analysis protocol (the<br />
group recommended using fivefold stratified cross-validation with ten repeats<br />
across all endpoints for the internal validation strategy) and submit their final<br />
models. The amount of metadata to collect for characterizing the modeling<br />
approach used to derive each model was also discussed at the meeting.<br />
For each endpoint, each team was also required to select one of its<br />
submitted models as its nominated model. No specific guideline was given<br />
and groups could select nominated models according to any objective or<br />
subjective criteria. Because the consortium lacked an agreed upon reference<br />
performance measure (Supplementary Fig. 13), it was not clear how the<br />
nominated models would be evaluated, and data analysis teams ranked models<br />
by different measures or combinations of measures. Data analysis teams were<br />
encouraged to report a common set of performance measures for each model<br />
so that models could be reranked consistently a posteriori. Models trained<br />
with the training set were frozen (step 6). MAQC-II selected for each endpoint<br />
one model from the up-to 36 nominations as the MAQC-II candidate<br />
for validation (step 6).<br />
External validation sets lacking class labels for all endpoints were distributed<br />
to the data analysis teams. Each data analysis team used its previously<br />
frozen models to make class predictions on the validation data set (step 7).<br />
The sample-by-sample prediction results were submitted to MAQC-II by<br />
each data analysis team (step 8). Results were used to calculate the external<br />
validation performance metrics for each model. Calculations were carried<br />
out by three independent groups not involved in developing models, which<br />
were provided with validation class labels. Data analysis teams that still had<br />
no access to the validation class labels were given an opportunity to correct<br />
apparent clerical mistakes in prediction submissions (e.g., inversion of class<br />
labels). Class labels were then distributed to enable data analysis teams to<br />
check prediction performance metrics and perform in depth analysis of results.<br />
A table of performance metrics was assembled from information collected in<br />
steps 5 and 8 (step 10, Supplementary Table 1).<br />
To check the consistency of modeling approaches, the original validation and<br />
training sets were swapped and steps 4–10 were repeated (step 11). Briefly, each<br />
team used the validation class labels and the validation data sets as a training<br />
set. Prediction models and evaluation performance were collected by internal<br />
and external validation (considering the original training set as a validation<br />
set). Data analysis teams were asked to apply the same data analysis protocols<br />
that they used for the original ‘Blind’ Training → Validation analysis. Swap<br />
analysis results are provided in Supplementary Table 2. It should be noted<br />
that during the swap experiment, the data analysis teams inevitably already<br />
had access to the class label information for samples in the swap validation set,<br />
that is, the original training set.<br />
Model summary information tables. To enable a systematic comparison of<br />
models for each endpoint, a table of information was constructed containing<br />
a row for each model from each data analysis team, with columns containing<br />
three categories of information: (i) modeling factors that describe the model<br />
development process; (ii) performance metrics from internal validation; and<br />
(iii) performance metrics from external validation (Fig. 1; step 10).<br />
Each data analysis team was requested to report several modeling factors for<br />
each model they generated. These modeling factors are organization code, data<br />
set code, endpoint code, summary or normalization method, feature selection<br />
method, number of features used in final model, classification algorithm,<br />
internal validation protocol, validation iterations (number of repeats of crossvalidation<br />
or bootstrap sampling) and batch-effect-removal method. A set of<br />
valid entries for each modeling factor was distributed to all data analysis teams<br />
in advance of model submission, to help consolidate a common vocabulary<br />
that would support analysis of the completed information table. It should be<br />
noted that since modeling factors are self-reported, two models that share a<br />
given modeling factor may still differ in their implementation of the modeling<br />
approach described by the modeling factor.<br />
The seven performance metrics for internal validation and external validation<br />
are MCC (Matthews Correlation Coefficient), accuracy, sensitivity, specificity,<br />
AUC (area under the receiver operating characteristic curve), binary<br />
AUC (that is, mean of sensitivity and specificity) and r.m.s.e. For internal<br />
validation, s.d. for each performance metric is also included in the table.<br />
Missing entries indicate that the data analysis team has not submitted the<br />
requested information.<br />
In addition, the lists of features used in the data analysis team’s nominated<br />
models are recorded as part of the model submission for functional analysis<br />
and reproducibility assessment of the feature lists (see the MAQC Web site at<br />
http://edkb.fda.gov/MAQC/).<br />
Selection of nominated models by each data analysis team and selection<br />
of MAQC-II candidate and backup models by RBWG and the steering<br />
committee. In addition to providing results to generate the model information<br />
nature biotechnology<br />
doi:10.1038/nbt.1665
© 2010 <strong>Nature</strong> America, Inc. All rights reserved.<br />
table, each team nominated a single model for each endpoint as its preferred<br />
model for validation, resulting in a total of 323 nominated models, 318 of<br />
which were applied to the prediction of the validation sets. These nominated<br />
models were peer reviewed, debated and ranked for each endpoint by the<br />
RBWG before validation set predictions. The rankings were given to the<br />
MAQC-II steering committee, and those members not directly involved in<br />
developing models selected a single model for each endpoint, forming the 13<br />
MAQC-II candidate models. If there was sufficient evidence through documentation<br />
to establish that the data analysis team had followed the guidelines<br />
of good classifier principles for model development outlined in the standard<br />
operating procedure (Supplementary Data), then their nominated models<br />
were considered as potential candidate models. The nomination and selection<br />
of candidate models occurred before the validation data were released.<br />
Selection of one candidate model for each endpoint across MAQC-II was<br />
performed to reduce multiple selection concerns. This selection process turned<br />
out to be highly interesting, time consuming, but worthy, as participants had<br />
different viewpoints and criteria in ranking the data analysis protocols and<br />
selecting the candidate model for an endpoint. One additional criterion was<br />
to select the 13 candidate models in such a way that only one of the 13 models<br />
would be selected from the same data analysis team to ensure that a variety<br />
of approaches to model development were considered. For each endpoint, a<br />
backup model was also selected under the same selection process and criteria<br />
as for the candidate models. The 13 candidate models selected by MAQC-II<br />
indeed performed well in the validation prediction (Figs. 2c and 3).<br />
50. Thomas, R.S., Pluta, L., Yang, L. & Halsey, T.A. Application of genomic biomarkers<br />
to predict increased lung tumor incidence in 2-year rodent cancer bioassays. Toxicol.<br />
Sci. 97, 55–64 (2007).<br />
51. Fielden, M.R., Brennan, R. & Gollub, J. A gene expression biomarker provides early<br />
prediction and mechanistic assessment of hepatic tumor induction by nongenotoxic<br />
chemicals. Toxicol. Sci. 99, 90–100 (2007).<br />
52. Ganter, B. et al. Development of a large-scale chemogenomics database to improve<br />
drug candidate selection and to understand mechanisms of chemical toxicity and<br />
action. J. Biotechnol. 119, 219–244 (2005).<br />
53. Lobenhofer, E.K. et al. Gene expression response in target organ and whole blood<br />
varies as a function of target organ injury phenotype. Genome Biol. 9, R100<br />
(2008).<br />
54. Symmans, W.F. et al. Total RNA yield and microarray gene expression profiles from<br />
fine-needle aspiration biopsy and core-needle biopsy samples of breast carcinoma.<br />
Cancer 97, 2960–2971 (2003).<br />
55. Gong, Y. et al. Determination of oestrogen-receptor status and ERBB2 status of<br />
breast carcinoma: a gene-expression profiling study. Lancet Oncol. 8, 203–211<br />
(2007).<br />
56. Hess, K.R. et al. Pharmacogenomic predictor of sensitivity to preoperative<br />
chemotherapy with paclitaxel and fluorouracil, doxorubicin, and cyclophosphamide<br />
in breast cancer. J. Clin. Oncol. 24, 4236–4244 (2006).<br />
57. Zhan, F. et al. The molecular classification of multiple myeloma. Blood 108,<br />
2020–2028 (2006).<br />
58. Shaughnessy, J.D. Jr. et al. A validated gene expression model of high-risk multiple<br />
myeloma is defined by deregulated expression of genes mapping to chromosome 1.<br />
Blood 109, 2276–2284 (2007).<br />
59. Barlogie, B. et al. Thalidomide and hematopoietic-cell transplantation for multiple<br />
myeloma. N. Engl. J. Med. 354, 1021–1030 (2006).<br />
60. Zhan, F., Barlogie, B., Mulligan, G., Shaughnessy, J.D. Jr. & Bryant, B. High-risk<br />
myeloma: a gene expression based risk-stratification model for newly diagnosed<br />
multiple myeloma treated with high-dose therapy is predictive of outcome in<br />
relapsed disease treated with single-agent bortezomib or high-dose dexamethasone.<br />
Blood 111, 968–969 (2008).<br />
61. Chng, W.J., Kuehl, W.M., Bergsagel, P.L. & Fonseca, R. Translocation t(4;14) retains<br />
prognostic significance even in the setting of high-risk molecular signature.<br />
Leukemia 22, 459–461 (2008).<br />
62. Decaux, O. et al. Prediction of survival in multiple myeloma based on gene<br />
expression profiles reveals cell cycle and chromosomal instability signatures in<br />
high-risk patients and hyperdiploid signatures in low-risk patients: a study of the<br />
Intergroupe Francophone du Myelome. J. Clin. Oncol. 26, 4798–4805 (2008).<br />
63. Oberthuer, A. et al. Customized oligonucleotide microarray gene expression-based<br />
classification of neuroblastoma patients outperforms current clinical risk<br />
stratification. J. Clin. Oncol. 24, 5070–5078 (2006).<br />
doi:10.1038/nbt.1665<br />
nature biotechnology
articles<br />
Human hematopoietic stem/progenitor cells modified<br />
by zinc-finger nucleases targeted to CCR5 control<br />
HIV-1 in vivo<br />
Nathalia Holt 1 , Jianbin Wang 2 , Kenneth Kim 2 , Geoffrey Friedman 2 , Xingchao Wang 3 , Vanessa Taupin 3 ,<br />
Gay M Crooks 4 , Donald B Kohn 4 , Philip D Gregory 2 , Michael C Holmes 2 & Paula M Cannon 1<br />
© 2010 <strong>Nature</strong> America, Inc. All rights reserved.<br />
CCR5 is the major HIV-1 co-receptor, and individuals homozygous for a 32-bp deletion in CCR5 are resistant to infection by<br />
CCR5-tropic HIV-1. Using engineered zinc-finger nucleases (ZFNs), we disrupted CCR5 in human CD34 + hematopoietic stem/<br />
progenitor cells (HSPCs) at a mean frequency of 17% of the total alleles in a population. This procedure produces both mono- and<br />
bi-allelically disrupted cells. ZFN-treated HSPCs retained the ability to engraft NOD/SCID/IL2rγ null mice and gave rise to polyclonal<br />
multi-lineage progeny in which CCR5 was permanently disrupted. Control mice receiving untreated HSPCs and challenged with<br />
CCR5-tropic HIV-1 showed profound CD4 + T-cell loss. In contrast, mice transplanted with ZFN-modified HSPCs underwent<br />
rapid selection for CCR5 −/− cells, had significantly lower HIV-1 levels and preserved human cells throughout their tissues. The<br />
demonstration that a minority of CCR5 −/− HSPCs can populate an infected animal with HIV-1-resistant, CCR5 −/− progeny supports<br />
the use of ZFN-modified autologous hematopoietic stem cells as a clinical approach to treating HIV-1.<br />
The entry of HIV-1 into target cells involves sequential binding of<br />
the viral gp120 Env protein to the CD4 receptor and a chemokine<br />
co-receptor 1 . CCR5 is the major co-receptor used by HIV-1 and is<br />
expressed on key T-cell subsets that are depleted during HIV-1 infection,<br />
including memory T cells 2 . A genetic 32-bp deletion in CCR5<br />
(CCR5Δ32) is relatively common in Western European populations<br />
and confers resistance to HIV-1 infection and AIDS in homozygotes<br />
3,4 . The absence of any other significant phenotype associated<br />
with a lack of CCR5 (refs. 5–7) has spurred the development of<br />
therapies aimed at blocking the virus–CCR5 interaction, and CCR5<br />
antagonists have proved to be an effective salvage therapy in patients<br />
with drug-resistant strains of HIV-1 (ref. 8).<br />
Recently, the ability of CCR5 −/− mobilized CD34 + peripheral blood<br />
cells to generate HIV-resistant progeny that suppress HIV-1 replication in<br />
vivo was demonstrated in an HIV-infected patient undergoing transplantation<br />
from a homozygous CCR5Δ32 donor during treatment for acute<br />
myeloid leukemia 9 . The donor cells conferred long-term control of HIV-1<br />
replication and restored the patient’s CD4 + T-cell levels in the absence of<br />
antiretroviral drug therapy. These clinical data support the potential of<br />
gene or stem cell therapies based on the elimination of CCR5. However,<br />
the risks associated with allogeneic transplantation and the impracticality<br />
of obtaining sufficient numbers of matched CCR5Δ32 donors 10<br />
mean that broader application of this approach will require methods for<br />
generating autologous CCR5 −/− cells. Various gene therapy approaches<br />
to block CCR5 expression are being evaluated, including CCR5-specific<br />
ribozymes 11,12 , siRNAs 13 and intrabodies 14 . The targeted cell populations<br />
include both mature T cells and CD34 + HSPCs. Loss of CCR5 in HSPCs<br />
appears to have no adverse effects on hematopoiesis 12,13,15 .<br />
An alternative approach is the use of engineered ZFNs to permanently<br />
disrupt the CCR5 open reading frame. ZFNs comprise a series<br />
of linked zinc fingers engineered to bind specific DNA sequences<br />
and fused to an endonuclease domain 16 . Concerted binding of two<br />
juxtaposed ZFNs on DNA, followed by dimerization of the endonuclease<br />
domains, generates a double-stranded break at the DNA<br />
target. Such double-stranded breaks are rapidly repaired by cellular<br />
repair pathways, notably the mutagenic nonhomologous end-joining<br />
pathway, which leads to frequent disruption of the gene due to the<br />
addition or deletion of nucleotides at the break site 17,18 . A significant<br />
advantage of this approach is that permanent gene disruption can<br />
result from only transient ZFN expression.<br />
CD4 + T cells modified by CCR5-targeted ZFNs 19 are currently being<br />
evaluated in a clinical trial. However, disruption of CCR5 in HSPCs<br />
is likely to provide a more durable anti-viral effect and to give rise to<br />
CCR5 −/− cells in both the lymphoid and myeloid compartments that<br />
HIV-1 infects. To evaluate this approach, we optimized the delivery of<br />
CCR5-specific ZFNs to human CD34 + HSPCs and transplanted the<br />
modified cells into nonobese diabetic/severe combined immunodeficient/interleukin<br />
2rγ null (NOD/SCID/IL2rγ null ; NSG) mice, which support<br />
both human hematopoiesis 20 and HIV-1 infection 13 . Infection of<br />
the mice with a CCR5-tropic strain of HIV-1 led to rapid selection for<br />
CCR5 – human cells, a significant reduction in viral load and protection<br />
of human T-cell populations in the key tissues that HIV-1 infects. These<br />
1 Keck School of Medicine of the University of Southern California, Los Angeles, California, USA. 2 Sangamo BioSciences, Inc., Richmond, California, USA. 3 Childrens<br />
Hospital Los Angeles, Los Angeles, California, USA. 4 David Geffen School of Medicine at the University of California Los Angeles, Los Angeles, California, USA.<br />
Correspondence should be addressed to P.M.C. (pcannon@usc.edu).<br />
Received 20 October 2009; accepted 24 June 2010; published online 2 July 2010; corrected online 22 July 2010; doi:10.1038/nbt.1663<br />
nature biotechnology volume 28 number 8 august 2010 839
articles<br />
© 2010 <strong>Nature</strong> America, Inc. All rights reserved.<br />
Figure 1 ZFN-mediated disruption of CCR5 in<br />
CD34 + HSPCs. (a) Representative gel showing<br />
extent of CCR5 disruption in CD34 + HSPCs<br />
24 h after nucleofection with ZFN-expressing<br />
plasmids (ZFN) or mock nucleofected (mock).<br />
Neg. is untreated CD34 + HSPCs. CCR5<br />
disruption was measured by PCR amplification<br />
across the ZFN target site, followed by Cel<br />
1 nuclease digestion and quantification of<br />
products by PAGE. (b) Graph showing mean<br />
± s.d. percentage of human CD45 + cells in<br />
peripheral blood of mice at 8 weeks after<br />
transplantation with either untreated, mock<br />
nucleofected or ZFN nucleofected CD34 +<br />
HSPCs (n = 5 each group). (c) FACS profiles<br />
of human cells from various organs of one<br />
representative mouse into which ZFN-treated<br />
CD34 + HSPCs were transplanted. Cells were<br />
gated on FSC/SSC (forward scatter/ side<br />
scatter) to remove debris. Staining for human<br />
CD45, a pan leukocyte marker, was used to<br />
reveal the level of engraftment with human<br />
cells in each organ. CD45 + -gated populations<br />
were further analyzed for subsets, as indicated:<br />
CD19 (B cells) in bone marrow, CD14<br />
(monocytes/macrophages) in lung, CD4 and<br />
CD8 (T cells) in thymus and spleen and CD3 (T<br />
cells) in the small intestine (lamina propria).<br />
The CD45 + population from the small intestine<br />
was further analyzed for CD4 and CCR5<br />
expression. Peripheral blood cells from CD45 +<br />
and lymphoid gates were analyzed for CD4<br />
and CD8 expression. The percentage of cells<br />
in each indicated area is shown. No staining<br />
was observed with isotype-matched control<br />
antibodies (Supplementary Fig. 1) or in animals<br />
receiving no human graft (data not shown).<br />
Bone marrow<br />
findings suggest that ZFN engineering of autologous HSPCs may enable<br />
long-term control of HIV-1 in infected individuals.<br />
CD34 + cells<br />
Neg. Mock ZFN<br />
0% 0% 16%<br />
RESULTS<br />
Efficient disruption of CCR5 in human CD34 + HSPCs<br />
Gene delivery methods suitable to express ZFNs include plasmid<br />
DNA nucleofection 16 , integrase-defective lentiviral vectors 21 and<br />
adenoviral vectors 19 . Although nonviral methods are attractive,<br />
nucleofection can be associated with relatively high toxicity for<br />
human CD34 + HSPCs and loss of engraftment potential 22 , although,<br />
more recently, less toxic outcomes have been described 23–25 . We<br />
evaluated different parameters to identify nucleofection conditions<br />
that allowed efficient disruption of CCR5 while limiting toxicity. The<br />
extent of CCR5 disruption was quantified using PCR amplification<br />
across the CCR5 locus, denaturation and reannealing of products,<br />
and digestion with the Cel 1 nuclease, which preferentially cleaves<br />
DNA at distorted duplexes caused by mismatches. The Cel 1 nuclease<br />
assay detects a linear range of CCR5 disruption between 0.69% and<br />
44% of the total alleles in a population, with an upper limit of sensitivity<br />
of 70–80% disruption (ref. 19 and data not shown). We used<br />
this assay to monitor CCR5 disruption as only a minority of human<br />
CD34 + cells expresses CCR5 (ref. 26), making it difficult to measure<br />
CCR5 expression by flow cytometry.<br />
Using CD34 + HSPCs harvested from umbilical cord blood and optimized<br />
nucleofection conditions, we achieved mean disruption rates of<br />
a<br />
c<br />
1,000<br />
SSC<br />
SSC<br />
SSC<br />
74<br />
CD45<br />
0<br />
10 0 10 1 10 2 10 3 10 4<br />
CD45<br />
CD8<br />
CD45<br />
Cel 1 digestion<br />
products<br />
CCR5<br />
Lung<br />
SSC<br />
% CD45 + in blood<br />
CD8<br />
100<br />
17% ± 10 (n = 21) of the total CCR5 alleles in the population (Fig. 1a).<br />
Similar results were also achieved using CD34 + HSPCs isolated from<br />
human fetal liver (data not shown). Previous studies in human cell<br />
lines 16 and primary human T cells 19 have shown that the percentage<br />
of bi-allelically modified cells in a ZFN-treated population is 30–40%<br />
of the total number of disrupted alleles detected by the Cel 1 assay. We<br />
therefore estimated that 5–7% of ZFN-treated cells would be CCR5 −/− ,<br />
although this was not directly measured.<br />
We evaluated toxicity by measuring induction of apoptosis. Although<br />
nucleofection increased toxicity to human CD34 + cells threefold compared<br />
to untreated cells, inclusion of the ZFN plasmids had no additional<br />
effect compared to mock nucleofected controls (data not shown).<br />
Overall, we consider that any adverse effects of nucleofection on cell<br />
viability may be offset by the high levels of CCR5 disruption achieved<br />
as well as the speed and simplicity of the procedure compared to viral<br />
vector systems 19,21 .<br />
ZFN-modified CD34 + HSPCs are capable of multi-lineage<br />
engraftment in NSG mice<br />
NSG mice can be engrafted with human CD34 + HSPCs 20 and thereby<br />
provide a rigorous readout of the hematopoietic potential of genetically<br />
modified HSPCs. We evaluated the effects of nucleofection and/<br />
or CCR5 disruption by transplanting both untreated and ZFN-treated<br />
human CD34 + HSPCs into 1-d-old mice that had received low-dose<br />
(150 cGy) radiation. Engraftment of human cells was efficient and rapid,<br />
80<br />
60<br />
40<br />
20<br />
0<br />
Neg. Mock ZFN<br />
10 4<br />
1,000<br />
10 4<br />
71<br />
10 10 23<br />
3<br />
3<br />
10 2<br />
10 2<br />
13<br />
10 1<br />
10 1<br />
10 0<br />
10<br />
0 0<br />
10 0 10 1 10 2 10 3 10 4 10 0 10 1 10 2 10 3 10 4 10 0 10 1 10 2 10 3 10 4<br />
CD19<br />
CD45<br />
CD14<br />
1 10 2 10 3<br />
10 0 1 10 2 10 3 10 4 10 0 10 2 10 3 10 4<br />
Spleen<br />
Thymus<br />
CD45<br />
1,000<br />
10 4<br />
10 4<br />
21<br />
10 3<br />
10 3<br />
10 2<br />
10 2<br />
66 10 1<br />
33<br />
10 1<br />
0<br />
10 0 10 0 10 0 10 10 0 10 1 10 2 10 3 10 4 10 0 10 1 10 2 10 3 10 4<br />
10 4<br />
10 0 10 1 10 2 10 3 10 4 10 0 10 1 10 2 10 3 10 4 10 1<br />
CD45<br />
CD4<br />
CD4<br />
Small intestine<br />
Blood<br />
CD45 CD4<br />
CD45 Lymphoid<br />
1,000<br />
10 46<br />
10 4<br />
10 4<br />
0<br />
10 0 10 0 10 0<br />
42<br />
10 3<br />
10 3<br />
23<br />
10 3<br />
10 2<br />
10 2<br />
10 2<br />
6<br />
10 1<br />
10 1<br />
10 1<br />
38<br />
CD45 CD3<br />
10<br />
CD4 CD4<br />
b<br />
CD45<br />
CD8<br />
840 volume 28 number 8 august 2010 nature biotechnology
articles<br />
© 2010 <strong>Nature</strong> America, Inc. All rights reserved.<br />
typically resulting in 40% human CD45 + leukocytes<br />
in the peripheral blood at 8 weeks after<br />
transplantation. The animals showed no obvious<br />
toxicity or ill health, as reported for higher<br />
radiation doses 27 . ZFN-treated cells engrafted<br />
NSG mice as efficiently as untreated control<br />
cells (Fig. 1b), with no statistically significant<br />
difference between the two groups (Student’s<br />
t-test, P = 0.26).<br />
Eight to 12 weeks after transplantation, we<br />
analyzed engraftment of various mouse tissues with human CD45 +<br />
leukocytes and with cells from specific hematopoietic lineages (Fig.<br />
1c). Human cells were detected using human-specific antibodies, and<br />
specificity was confirmed using both unengrafted animals and isotypematched<br />
antibody controls (Supplementary Fig. 1). High levels of<br />
human cells were found in both the peripheral blood and tissues, ranging<br />
from 5–15% of the intestine, >50% of blood, spleen and bone marrow,<br />
and >90% of the thymus (Supplementary Table 1). CD4 + and CD8 +<br />
T cells were present in multiple organs, including the thymus, spleen,<br />
and both the intraepithelial and lamina propria regions of the small and<br />
large intestines; B-cell progenitors were present in the bone marrow; and<br />
CD14 + macrophage and/or monocytes were detected in the lung. Of<br />
particular interest was the large population of human CD4 + CCR5 + cells<br />
in the intestines, as these cells are targeted by both HIV-1 in humans 28–31<br />
and SIV in primates 32–34 . Overall, the profile of human cells in mice<br />
receiving ZFN-treated CD34 + HSPCs was indistinguishable from that<br />
of mice transplanted with unmodified cells, both with respect to the<br />
percentage of human cells in each tissue and the frequencies of different<br />
subsets (Supplementary Table 1), suggesting that ZFN-modified CD34 +<br />
HSPCs are functionally normal.<br />
ZFN-treated CD34 + HSPCs produce CCR5-disrupted progeny<br />
after secondary transplantation<br />
To evaluate whether ZFN treatment of the bulk CD34 + population<br />
modified true SCID-repopulating stem cells, we harvested<br />
bone marrow from an animal 18 weeks after engraftment<br />
with ZFN-treated CD34 + HSPCs, in which the extent of CCR5<br />
disruption in the bone marrow was 11% (Table 1). This marrow<br />
was transplanted into three 8-week-old recipients.<br />
At the same time, bone marrow from a control animal engrafted with<br />
Table 1 Secondary transplantation of ZFN-treated HSPCs<br />
Donor animals a CD45 b blood (%) Cel 1 c BM (%) Secondary<br />
recipients<br />
CD45 b blood (%) Cel 1 c blood (%)<br />
ZFN (1) 41 11 ZFN (3) 34 +/- 5 16 +/- 4<br />
Neg. (1) 47 0 Neg. (3) 37 +/- 7 0 +/- 0<br />
a Bone marrow (BM) was harvested from donor mice engrafted with ZFN-treated HSPCs (ZFN) or untreated HSPCs (Neg.) and<br />
transplanted into three secondary recipients for each BM. b Levels of human CD45 + cells were measured in blood of both donor<br />
and recipient mice at 8 weeks post-transplantation. c CCR5 disruption rates, measured by Cel 1 analysis of donor BM at time of<br />
harvest and in blood of recipient mice at 10 weeks post-transplantation.<br />
untreated CD34 + HSPCs was transplanted into three additional animals.<br />
Analysis of the peripheral blood of the secondary recipients 8<br />
weeks later revealed that all six animals had engrafted and that there<br />
was no significant difference in the percentage of human CD45 + leukocytes<br />
between the ZFN-treated and control groups. Furthermore,<br />
human cells in the blood of the ZFN cohort had levels of CCR5 disruption<br />
that slightly exceeded the level in the original donor marrow<br />
(12–20%) (Table 1). These data demonstrate that ZFN activity<br />
can lead to permanent disruption of CCR5 in SCID-repopulating<br />
stem cells and that such modified cells retain their engraftment and<br />
differentiation potential.<br />
Protection of CD4 + T cells in peripheral blood of NSG mice after<br />
HIV-1 infection<br />
Engrafted animals at 8–12 weeks after transplantation that had received<br />
either unmodified or ZFN-treated CD34 + HSPCs were challenged with<br />
the CCR5-tropic virus HIV-1 BAL . This strain of HIV-1 causes a robust<br />
infection and significant CD4 + T-cell depletion in humanized mouse<br />
models 35,36 , mimicking the human infection, in which depletion of<br />
CD4 + CCR5 + lymphocytes results from a combination of direct infection,<br />
systemic immune activation 36 and the upregulation of CCR5 on thymic<br />
precursors 37,38 . After infection, blood samples were collected from the<br />
mice every 2 weeks and analyzed for HIV-1 RNA levels, T-cell subsets and<br />
the extent of CCR5 disruption. At 8–12 weeks after infection, animals were<br />
euthanized and multiple tissues analyzed (Supplementary Fig. 2).<br />
Changes in the ratio of CD4 + to CD8 + T cells in the peripheral blood<br />
are characteristic of progressive infection in individuals with AIDS 39,40 .<br />
We therefore examined the CD4/CD8 ratio in blood samples from individual<br />
mice both before and after infection and found that the mean<br />
ratio before infection was similar for both the untreated and ZFN-treated<br />
a<br />
HIV-1 infected<br />
b<br />
Uninf. (3) Neg. (3) ZFN (9)<br />
CD45 Lymphoid<br />
10 4<br />
2.5<br />
P = 0.8892 P = 0.0001<br />
Neg.<br />
ZFN<br />
Blood<br />
CD8<br />
10 4<br />
10 4<br />
10 3 42 10 3 67 10 3 32<br />
10 2<br />
10 2<br />
10 2<br />
10 1<br />
10 1<br />
10 1<br />
38<br />
0 39<br />
10 0 10 0 10 0<br />
10 0 10 1 10 2 10 3 10 4 10 0 10 1 10 2 10 3 10 4 10 0 10 1 10 2 10 3 10 4<br />
CD4 + /CD8 + ratio<br />
2.0<br />
1.5<br />
1.0<br />
0.5<br />
0.0<br />
CD4<br />
Pre-infection<br />
Post-infection<br />
Figure 2 Protection of human CD4 + T cells in peripheral blood of HIV-infected mice previously engrafted with ZFN-modified CD34 + HSPCs. (a) FACS plots<br />
showing human CD4 + and CD8 + T cells in peripheral blood of representative animals from each of three cohorts: uninfected mice previously engrafted with<br />
either untreated or ZFN-treated CD34 + HSPCs (Uninf.), and HIV-1 infected animals previously engrafted with either untreated (Neg.) or ZFN-treated (ZFN)<br />
CD34 + HSPCs, at 4 weeks post-infection. The total number of animals analyzed in each cohort is indicated. Cells were gated on FSC/SSC to remove debris,<br />
on human CD45, and a lymphoid gate applied. Percentage of cells in indicated compartments is shown. (b) Ratio of human CD4 + to CD8 + lymphocytes in<br />
peripheral blood of individual mice into which untreated (Neg.) or ZFN-modified CD34 + HSPCs were transplanted, measured pre-infection and at 6–8 weeks<br />
post-infection. Statistical analysis comparing Neg. and ZFN cohorts at each time point is shown.<br />
nature biotechnology volume 28 number 8 august 2010 841
articles<br />
groups. After HIV-1 challenge, the ratios became highly skewed in the<br />
control group owing to the pronounced loss of CD4 + cells, whereas the<br />
ZFN-treated animals maintained normal ratios (Fig. 2a,b).<br />
Protection of human cells in mouse tissues after HIV-1 infection<br />
We next analyzed the human cells present in various mouse tissues 12<br />
weeks after infection with HIV-1 BAL . NSG mice into which unmodified<br />
cells were transplanted displayed a characteristic loss of certain<br />
human cell populations, whereas the ZFN-treated cohort retained<br />
normal human cell profiles throughout their tissues despite HIV-1<br />
challenge (Fig. 3a). In the intestines and spleen, which are the organs<br />
harboring the highest percentage of human CD4 + CCR5 + cells in<br />
this model (Supplementary Fig. 3), we observed specific depletion<br />
of CD4 + T cells from the spleen and the complete loss of all human<br />
lymphocytes from the intestines of untreated animals, whereas these<br />
populations were fully preserved in the ZFN-treated cohort (Fig. 3b).<br />
In the bone marrow, which is not a major target organ of HIV-1 infection,<br />
levels of human CD45 + cells were similar in all three groups.<br />
Notably, HIV-1 BAL infection resulted in the loss of virtually all<br />
human cells from the thymus of mice receiving untreated CD34 +<br />
HSPCs by 12 weeks after infection (Fig. 3a). Depletion of thymocytes<br />
has been proposed to occur as a consequence of the upregulation<br />
of CCR5 on these cells during HIV-1 infection 37,38 , and likely<br />
contributed both to the observed depletion in the thymus and to the<br />
reduction in the numbers of mature CD4 + and CD8 + T cells observed<br />
in other tissues.<br />
© 2010 <strong>Nature</strong> America, Inc. All rights reserved.<br />
a<br />
Bone marrow<br />
HIV-1 infected<br />
Spleen<br />
HIV-1 infected<br />
Uninf. (3) Neg. (3) ZFN (9) Uninf. (3) Neg. (3) ZFN (9)<br />
CD45<br />
1,000<br />
1,000<br />
1,000<br />
10 4<br />
1,000<br />
1,000<br />
10 3<br />
21<br />
45 11<br />
10 65<br />
47 41<br />
2<br />
10 33<br />
0<br />
34<br />
1<br />
0<br />
0<br />
0<br />
10 0<br />
0<br />
0<br />
10 0 10 1 10 2 10 3 10 4 10 0 10 1 10 2 10 3 10 4 10 0 10 1 10 2 10 3 10 4 10 0 10 1 10 2 10 3 10 4 10 0 10 1 10 2 10 3 10 4 10 0 10 1 10 2 10 3 10 4<br />
CD45<br />
CD4<br />
Thymus<br />
Small intestine<br />
CD45<br />
CD45<br />
10 4<br />
10 4<br />
10 4<br />
10 4<br />
10 4<br />
10 4<br />
10 83 0 94<br />
3<br />
10 3<br />
10 3<br />
10 3<br />
10 3<br />
10 3<br />
10 79 0 84<br />
2 10 2 10 2<br />
10 2 10 2 10 2<br />
10 1<br />
10 1<br />
10 1<br />
10 1<br />
10 1<br />
10 1<br />
10 0<br />
10 0<br />
10 0<br />
10 0<br />
10 0<br />
10 0<br />
10 0 10 1 10 2 10 3 10 4 10 0 10 1 10 2 10 3 10 4 10 0 10 1 10 2 10 3 10 4 10 0 10 1 10 2 10 3 10 4 10 0 10 1 10 2 10 3 10 4 10 0 10 1 10 2 10 3 10 4<br />
CD4<br />
CD3<br />
b<br />
SSC<br />
CD8<br />
CD8<br />
CD45<br />
HIV-1 infected<br />
No graft (2) Neg. (2) ZFN (2) Neg. (3) ZFN (9)<br />
Small intestine, anti-CD3<br />
Spleen, anti-CD4<br />
Figure 3 Effects of HIV-1 infection on human cells in HSPC-engrafted NSG mice. (a) FACS<br />
analysis of human cells in tissues of representative NSG mice from three cohorts: uninfected<br />
mice previously engrafted with either untreated or ZFN-treated CD34 + HSPCs (Uninf.), and<br />
HIV-1 infected animals previously engrafted with either untreated (Neg.) or ZFN-treated (ZFN)<br />
CD34 + HSPCs. Mice were necropsied at 12 weeks post-infection or at the equivalent time point<br />
for uninfected animals. The total number of animals analyzed in each cohort is indicated. FACS<br />
analysis was performed as described in Figure 1. Small intestine sample is lamina propria, and<br />
similar results were obtained when samples from the large intestine were analyzed. Percentage<br />
of cells in indicated compartments is shown. (b) Immunohistochemical analysis of human CD3<br />
expression in small intestine, and CD4 expression in spleen of representative NSG mice, into<br />
which untreated (Neg.) or ZFN-treated (ZFN) CD34 + HSPCs were transplanted, with and without<br />
HIV-1 infection. Animals were necropsied at 12 weeks after infection or at the same time point<br />
for uninfected animals. Control animals receiving no human CD34 + HSPCs (no graft) were also<br />
analyzed. The number of animals analyzed in each cohort is shown. Scale bars, 50 µM.<br />
HIV-1 infection rapidly selects for<br />
CCR5 – T cells<br />
We examined whether the survival of T cells in<br />
the mice receiving ZFN-treated CD34 + HSPCs<br />
was the result of selection for ZFN-modified<br />
progeny. We measured the percentage of disrupted<br />
CCR5 alleles in the blood of mice at<br />
sequential time points after HIV-1 challenge,<br />
using both the Cel 1 assay and a specific PCR<br />
amplification that detects a common 5-bp<br />
duplication at the ZFN target site that typically<br />
accounts for 10–30% of total modifications 19 .<br />
Both assays revealed a rapid increase in the frequency<br />
of ZFN-disrupted alleles, reaching the<br />
upper limit of the Cel 1 assay by 4 weeks after<br />
infection (Fig. 4a).<br />
We also examined levels of CCR5 disruption<br />
in multiple tissues from ZFN-treated animals,<br />
either uninfected or 12 weeks after HIV-1 BAL<br />
challenge, and observed a sharp increase<br />
in CCR5 disruption after HIV-1 infection<br />
(Fig. 4b). FACS analysis of the spleen and intestine<br />
revealed that, in contrast to uninfected animals,<br />
in which ~25% of CD4 + cells were also<br />
CCR5 + , very little or no CCR5 expression was<br />
detected in the CD4 + T cells that persisted in<br />
the ZFN-treated animals (Fig. 4c,d). Together,<br />
these data suggest that the protection of CD4 +<br />
lymphocytes in ZFN-treated mice was a consequence<br />
of selection for CCR5 – , HIV-1-resistant<br />
cells derived from ZFN-edited cells.<br />
Heterogeneity of CCR5 modifications<br />
suggests polyclonal origins<br />
ZFN-induced double-stranded breaks<br />
repaired by nonhomologous end-joining<br />
result in highly heterogeneous changes at<br />
the targeted locus 19 . We used this property<br />
to investigate whether the CCR5 – cells that<br />
developed in mice that received ZFN-treated<br />
CD34 + HSPCs were polyclonal in origin.<br />
Sequencing of 60 individual CCR5 alleles<br />
amplified from the large intestine of an HIV-<br />
1-infected mouse into which ZFN-treated<br />
CD34 + HSPCs were previously transplanted<br />
revealed that 59 alleles harbored mutations<br />
at the ZFN target site (Fig. 5). As previously<br />
842 volume 28 number 8 august 2010 nature biotechnology
articles<br />
© 2010 <strong>Nature</strong> America, Inc. All rights reserved.<br />
reported for this ZFN pair 19 , a high proportion (13 out of 59) of the<br />
mutated loci contained a characteristic 5-bp duplication, with the<br />
remaining 46 clones bearing 36 unique sequences. In contrast, all<br />
alleles sequenced from a mouse receiving untreated CD34 + HSPCs<br />
contained the wild-type sequence (data not shown). The high degree<br />
of sequence diversity observed strongly suggests that multiple stem<br />
or progenitor cells were modified by the ZFNs. These findings also<br />
predict that the overwhelming majority of cells selected by HIV-1 BAL<br />
infection would be CCR5 −/− , which is in agreement with the data<br />
from flow cytometry analysis (Fig. 4c).<br />
Presence of ZFN-modified cells controls HIV-1 replication in vivo<br />
Quantitative PCR analysis of HIV-1 RNA levels in the peripheral<br />
blood of animals revealed that peak viremia occurred at 6 weeks after<br />
infection for animals that received transplants of either untreated or<br />
ZFN-treated CD34 + HSPCs (Fig. 6a), although the levels were significantly<br />
lower (P = 0.03) in the ZFN cohort. By 8 weeks after infection,<br />
viral loads in both cohorts were dropping but there continued<br />
to be a statistically significant difference between the two groups (P<br />
= 0.001). Measurements of p24 levels in the blood by enzyme-linked<br />
immunosorbent assay (ELISA) corroborated these findings, with a<br />
Figure 4 HIV-1 infection selects for disrupted<br />
CCR5 alleles. (a) Mean ± s.d. levels of CCR5<br />
disruption (Cel 1 assay, black bars) in sequential<br />
peripheral blood samples taken from mice<br />
into which ZFN-treated CD34 + HSPCs were<br />
transplanted and which were subsequently<br />
infected with HIV-1. Upper limit of linearity of<br />
Cel 1 assay is 44% (ref. 19) and is indicated by<br />
the dotted line; upper limit of sensitivity of assay<br />
is 70–80%. White bars show the frequency of<br />
a common 5-bp duplication at the ZFN target<br />
site that typically comprises 10–30% of total<br />
CCR5 mutations 19 . Numbers of mice analyzed<br />
at each time point, and in each assay, are shown<br />
above the appropriate bar. (b) Mean ± s.d. levels<br />
of CCR5 disruption (Cel 1 assay) in indicated<br />
tissues from mice into which ZFN-treated CD34 +<br />
HSPCs were transplanted; mice were necropsied<br />
at 12 weeks after infection (black bars) or at<br />
an equivalent time point for uninfected ZFNtreated<br />
animals (white bars). Numbers analyzed<br />
in each group are shown above the appropriate<br />
bar. One representative Cel 1 analysis from the<br />
large intestine (lamina propria) of uninfected<br />
and infected mice is shown. Animals receiving<br />
untreated cells gave no Cel 1 digestion products<br />
at any time point analyzed (data not shown).<br />
Asterisk indicates levels too low to quantify.<br />
(c) Contour FACS analyses of human CD4 +<br />
cells in the small intestine (lamina propria) and<br />
spleen of one representative animal from each<br />
indicated cohort are shown. Cells were gated<br />
on FSC/SSC to remove debris and gated on<br />
human CD45 and CD4. Numbers indicate the<br />
percentage of cells that are CCR5 + . (d) Mean ±<br />
s.d. numbers of human CD4 + cells (gray bars)<br />
and CD4 + CCR5 + cells (white bars) per 5,000<br />
human CD45 + cells analyzed from different<br />
sections of the intestine and from the indicated<br />
cohorts. Asterisk indicates levels too low to<br />
quantify. Number of animals analyzed in each<br />
cohort is indicated. Abbr. S, small intestine; L,<br />
large intestine; E, intraepithelial lymphocytes; P,<br />
lamina propria lymphocytes; BM, bone marrow.<br />
a<br />
b<br />
c<br />
d<br />
CCR5 disruption in<br />
peripheral blood (%)<br />
CCR5 disruption (%)<br />
Small intestine<br />
Number cells per 5,000<br />
human CD45 + cells<br />
CCR5<br />
100<br />
80<br />
60<br />
40<br />
20<br />
0<br />
80<br />
60<br />
40<br />
20<br />
0<br />
3,000<br />
2,000<br />
1,000<br />
significant difference (P = 0.02) in antigenemia between the two<br />
groups observed by the 6-week time point (data not shown).<br />
These differences between the two cohorts are more striking when<br />
the levels of human CD4 + T cells are also considered (Fig. 6a), as the<br />
loss of CD4 + T cells in the untreated mice probably contributed to the<br />
lowering of overall viral levels seen as the infection progressed. The<br />
continued presence of virus in the blood, despite acute loss of CD4 +<br />
cells, also occurs during progression to AIDS, where high viral load<br />
measurements in serum are typically observed when T-cell death is<br />
rapidly occurring 41 . In contrast, CD4 + T-cell levels in the ZFN-treated<br />
mice rebounded after the 2-week nadir and recovered to normal levels<br />
by 4 weeks after infection. In contrast to these findings with HIV-<br />
1 BAL , ZFN-treated mice challenged with a CXCR4-tropic HIV-1 strain<br />
did not control viral levels or preserve CD4 + T cells, confirming that<br />
the mechanism is CCR5 specific (Supplementary Fig. 4).<br />
We also measured HIV-1 levels in intestinal samples. In tissues<br />
harvested at 8 and 9 weeks after infection, viral levels in the ZFNtreated<br />
mice were 4 orders of magnitude lower than in the untreated<br />
controls. By the 10- and 12-week time points, HIV-1 RNA was undetectable<br />
in the ZFN-treated mice (Fig. 6b). This drop in viral load<br />
occurred despite the maintenance of normal numbers of human<br />
5 3 2 4 Total disuptions<br />
5 bp duplication<br />
2<br />
5<br />
3<br />
4<br />
2 5<br />
1 1<br />
0 2 4 6 8 10<br />
Weeks post-infection<br />
2<br />
Thymus<br />
CD4<br />
SE<br />
3 3<br />
2<br />
Lung<br />
2<br />
Spleen<br />
SP<br />
LE<br />
LP<br />
2<br />
2<br />
SE<br />
3 3 3 3<br />
2<br />
SP<br />
SE<br />
SP<br />
LE<br />
LP<br />
2<br />
LE<br />
HIV-1<br />
2<br />
LP<br />
HIV-1 infected<br />
Uninf. (3) Neg. (3) ZFN (9)<br />
SE<br />
SP<br />
LE<br />
2<br />
BM<br />
LP<br />
3<br />
Uninf.<br />
HIV-1<br />
Spleen<br />
CCR5<br />
CD4<br />
Large intestine<br />
Uninf. HIV-1<br />
8 56<br />
Cel 1 products (%)<br />
HIV-1<br />
Uninf. (3) Neg. (3) ZFN (9)<br />
Uninf. (3) Neg. (3) ZFN (9)<br />
CD45 CD4 CD45 CD4<br />
10 4<br />
10 4<br />
10<br />
10<br />
10 4<br />
10 4<br />
10<br />
10 4<br />
10<br />
10 4<br />
10 3<br />
10 3<br />
10 3<br />
10 3<br />
10 3<br />
10 3<br />
33 0 0 30 0 0<br />
10 2<br />
10 2<br />
10 2<br />
10 2<br />
10 2<br />
10 2<br />
10 1<br />
10 10 10 1<br />
10 1<br />
1<br />
1<br />
10 1<br />
10 0 10 0 10 1 10 2 10 3 10 4 0 10 0 10 1 10 2 10 3 10 4 0 10 0 10 1 10 2 10 3 10 4 0 10 0 10 1 10 2 10 3 10 4 0 10 0 10 1 10 2 10 3 10 4 10 0<br />
10 0 10 1 10 2 10 3 10 4<br />
0<br />
CD4 + CCR5 +<br />
CD4 +<br />
nature biotechnology volume 28 number 8 august 2010 843
articles<br />
© 2010 <strong>Nature</strong> America, Inc. All rights reserved.<br />
Wild-type (1)<br />
gttttgtgggcaacatgctggtcatcctcatcctgataaactgcaaaaggctgaagagcatgactgaca wt<br />
Deletions (43)<br />
gttttgtgggcaacatgctggtcatcctcat-ctgataaactgcaaaaggctgaagagcatgactgaca -1<br />
gttttgtgggcaacatgctggtcatcctcatcctgat--actgcaaaaggctgaagagcatgactgaca -2<br />
gttttgtgggcaacatgctggtcatcctcatcctg--aaactgcaaaaggctgaagagcatgactgaca -2 2X<br />
gttttgtgggcaacatgctggtcatcc---tcctgataaactgcaaaaggctgaagagcatgactgaca -3<br />
gttttgtgggcaacatgctggtcatcctcatc----taaactgcaaaaggctgaagagcatgactgaca -4<br />
gttttgtgggcaacatgctggtcatcctcatc-----aaactgcaaaaggctgaagagcatgactgaca -5 3X<br />
gttttgtgggcaacatgctggAcatcctcatcctgat------caaaaggctgaagagcatgactgaca -6<br />
gttttgtgggcaacatgctggtcatcctcatc------aaTtgcaaaaggctgaagagcatgactgaca -6<br />
gttttgtgggcaacatgctggtcatcctcatcctgat-------aaaaggctgaagagcatgactgaca -7<br />
gttttgtgggcaacatgctggtcat-------ctgataaactgcaaaaggctgaagagcatgactgaca -7<br />
gttttgtgggcaacatgctggtcatcctcatc--------ctgcaaaaggctgaagagcatgactgaca -8<br />
gttttgtgggcaacatgctggtcatcctcatcctgat--------aaaggctgaagagcatgactgaca -8<br />
gttttgtgggcaacatgctggtcatcctc--------aaactgcaaaaggctgaagagcatgactgaca -8<br />
gttttgtgggcaacatgctggtcatcc--------ataaactgcaaaaggctAaagagcatgactgaca -8<br />
gttttgtgggcaacatgctggtcatcctcat---------ctgcaaaaggctgaagagcatgactgaca -9<br />
gttttgtgggcaacatgctggtcatcctcatcctgat----------aggctgaagagcatgactgaca -10<br />
gttttgtgggcaacatgctggt----------ctgataaactgcaaaaggctgaagagcatgactgaca -10<br />
gttttgtgggcaacatgctggtcatcctcatc-----------caaaaggctgaagagcatgactgaca -11<br />
gttttgtgggcaacatgctggtcatcctca-----------tgcaaaaggctgaagagcatgactgaca -11 2X<br />
gttttgtgggcaacatgctggtcatcctcatc------------aaaaggctgaaAagGatgactgaca -12<br />
gttttgtgggcaacatgctg------------ctgGtaaactgcaaaaggctgaagagcatgactgaca -12<br />
gttttgtgggcaacatgctggtcatcct--------------gcaaaaggctgaagagcatgactgaca -14 5X<br />
gttttgtgggcaacatgctggtcat---------------ctgcaaaaggctgaagagcatgactgaca -15<br />
gttttgtgggcaacatgctggtcatcct---------------caaaaggctgaagagcatgactgaca -15 2X<br />
gttttgtgggcaacatgctggtcatcctcatcctgataa----------------gagcatgactgaca -16<br />
gttttgtgggcaacatgctggtcatcctcatcctgat-----------------Cgagcatgactgaca -17<br />
gttttgtgggcaacatgctggtcatcctcatcctga-------------------gagcatgactgaca -19<br />
gttttgtgggcaacatgctggtcatcctcatc-------------------tgaagagcatgactgaca -19<br />
gttttgtgggcaacatgctggtcatcctcatcctgat--------------------gcatgactgaca -20<br />
gttttgtgggcaacatgctggtcatcctcatc----------------------agagcatgactgaca -22<br />
gttttgtgggcaacatgc--------------------------aaaaggctgaagagcatgactgaca -26<br />
gttttgtgggcaa------------------------------caaaaggctgaagagcatgactgaca -30<br />
gttttgtgggcaacatgctggtcatcctcatcctg--------------------------------ca -32<br />
gttttgtgggcaacatgctggt---------------------------------------------ca -45<br />
Insertions (16)<br />
gttttgtgggcaacatgctggtcatcctcatcctCTgataaactgcaaaaggctgaagagcatgactga +2<br />
gttttgtgggcaacatgctggtcatcctcatcctgataTAaactgcaaaaggctgaagagcatgactga +2<br />
gttttgtgggcaacatgctggtcatcctcatcctgatCTGATaaactgcaaaaggctgaagagcatgac +5 13X<br />
T lymphocytes in the intestines and other tissues (Fig. 3). These<br />
observations are consistent with a strong selective pressure for HIVresistant<br />
CCR5 −/− cells to replace CCR5-expressing cells, leading to<br />
control of viral replication.<br />
DISCUSSION<br />
Despite major advances in anti-retroviral therapy, HIV-1 infection<br />
remains an epidemic cause of morbidity and mortality. Effective antiretroviral<br />
therapy often involves costly, multi-drug regimens that are<br />
not well tolerated by a significant percentage of patients 42 , and even<br />
successful adherence to the therapy does not eradicate the virus, and a<br />
rapid rebound in HIV-1 levels can occur if therapy is discontinued 43 .<br />
An alternative approach to controlling HIV-1 replication is engineering<br />
of the body’s immune cells to be resistant to infection 44 . In this regard,<br />
the CCR5 co-receptor is an attractive target because of the HIV-resistant<br />
phenotype of homozygous CCR5Δ32 individuals 3 . In the present study,<br />
we identified conditions that allow efficient disruption of CCR5 in<br />
human CD34 + HSPCs and demonstrated that such modified cells<br />
generate CCR5 −/− , HIV-resistant progeny in a mouse model of human<br />
hematopoiesis and HIV-1 infection, leading to control of HIV-1 replication.<br />
These findings suggest that transplantation of autologous HSPCs<br />
modified by CCR5-specific ZFNs may provide a permanent supply of<br />
HIV-resistant progeny that could replace cells killed by HIV-1, reconstitute<br />
the immune system and control viral replication long term in the<br />
absence of anti-retroviral therapy.<br />
The high levels of CCR5 disruption that we achieved were possible<br />
because of an efficient gene editing technology based on ZFNs.<br />
ZFNs can be designed to bind to a specific genomic DNA sequence<br />
Figure 5 ZFN activity produces heterogeneous<br />
mutations in CCR5. Sequence analysis was<br />
performed on 60 cloned human CCR5 alleles,<br />
PCR amplified from intraepithelial cells from<br />
the large intestine of an HIV-infected mouse into<br />
which ZFN-treated CD34 + HSPCs were previously<br />
transplanted, and at 12 weeks post-infection.<br />
The number of nucleotides deleted or inserted<br />
at the ZFN target site (underlined) in each clone<br />
is indicated on the right of each sequence,<br />
together with the number of times the sequence<br />
was found. Dashes (–) indicate deleted bases<br />
compared to the wild-type sequence; uppercase<br />
letters are point mutations; underlined upper<br />
case letters are inserted bases. Some specific<br />
mutations of CCR5 occurred more frequently,<br />
in particular a 5-bp duplication at the ZFN<br />
target site that was identified 13 times (bottom<br />
sequence). No mutations in CCR5 were observed<br />
in a similar analysis performed on control samples<br />
from a mouse receiving unmodified CD34 +<br />
HSPCs (data not shown).<br />
and effect permanent knockout of the targeted<br />
gene 19,45–47 . Only transient expression<br />
of the ZFNs is required during a brief period<br />
of ex vivo culture, and the genetic mutation<br />
is present for the life of the cell and its progeny.<br />
Thus, a major shortcoming of other gene<br />
therapy technologies—the need for continued<br />
expression of a foreign transgene—is avoided.<br />
Moreover, unlike approaches based on small<br />
molecules, antibodies or RNA interference 44 ,<br />
ZFN-mediated gene disruption can completely<br />
eliminate CCR5 from the surface of<br />
cells through bi-allelic modification. By using an optimized nucleofection<br />
procedure, we were able to overcome the technical challenges to<br />
ZFN-induced genome editing in CD34 + cells previously reported 21 and<br />
achieve, on average, disruption at 17% of the loci, which we estimate will<br />
produce 5–7% bi-allelically modified cells.<br />
The safety and efficacy of T lymphocytes modified with CCR5-<br />
targeted ZFNs are currently being evaluated in a phase 1 clinical trial.<br />
In a preclinical study, investigation of the specificity of the same CCR5-<br />
targeted ZFNs as used in this study revealed off-target cleavage events in<br />
T cells at significant levels only at the homologous CCR2 locus 19 . Studies<br />
in mice have not detected any deleterious phenotype associated with<br />
loss of CCR2 (ref. 48), and human genetic studies have even suggested<br />
a beneficial phenotype from the loss of this gene in HIV-infected individuals<br />
49 . Although not analyzed here, modification of CD34 + HSPCs<br />
with these same CCR5 ZFN reagents is likely to result in similar, low<br />
levels of off-target cleavage events. Any safety concerns associated with<br />
nonspecific cleavage must be evaluated in larger, future studies.<br />
Although T lymphocytes are the primary target of HIV-1 infection,<br />
ZFN modification of HSPCs may allow longer-term production of<br />
CCR5 −/− cells in patients. The scientific rationale for CCR5 modification<br />
of HSPCs is supported by the recent finding that an HIV + leukemia patient<br />
receiving a transplant from a CCR5 −/− donor was effectively cured of his<br />
infection, despite discontinuing antiretroviral therapy 9 . As shown by our<br />
data, ZFN-modified HSPCs retained full functionality and gave rise to<br />
CCR5 – cells in lineages relevant to HIV-1 pathogenesis. ZFNs delivered to<br />
purified CD34 + cell populations by nucleofection were capable of modifying<br />
true SCID-repopulating stem cells, and the high levels of CCR5 editing<br />
were maintained after secondary transplantation.<br />
844 volume 28 number 8 august 2010 nature biotechnology
articles<br />
© 2010 <strong>Nature</strong> America, Inc. All rights reserved.<br />
The experimental mouse model of HIV-1 infection used in these<br />
studies revealed a strong selection for CCR5 – progeny during acute<br />
infection with a CCR5-tropic strain of HIV-1. This suggests that<br />
CCR5 −/− stem cells, even if the minority, produced sufficient numbers<br />
of CCR5 −/− progeny to support immune reconstitution and inhibit<br />
HIV-1 replication. Such selection is consistent with clinical observations<br />
from genetic diseases such as adenosine deaminase deficiency<br />
(ADA)-SCID, X-linked SCID and Wiskott-Aldrich syndrome, in which<br />
normal hematopoietic cells have a selective advantage, so that spontaneous<br />
monoclonal reversions can lead to selective outgrowth of such cells<br />
and amelioration of symptoms 50–53 .<br />
The observation of almost complete replacement of human T cells in<br />
the intestines of the infected mice with CCR5 – cells is consistent with<br />
this tissue harboring the majority of the body’s CD4 + CCR5 + effector<br />
memory cells. A characteristic feature of HIV-1 replication in mucosal<br />
tissues is an ongoing cycle of T-cell death and the recruitment of replacement<br />
T cells, which, in an activated state, are highly permissive for HIV-1<br />
infection 37 . This is especially true in the gut mucosa, a key battleground<br />
in HIV-1 infection 54–56 . We also observed a strong selection for CCR5 –<br />
cells in the thymus, suggesting that CCR5 – cells would be selected at both<br />
a precursor stage in the thymus and at an effector stage in the mucosa.<br />
Ultimately, the presence of HIV-resistant CCR5 – cells in mucosal tissues<br />
should both protect individual cells from infection and help to break<br />
the cycle of immune hyperactivation that may underlie much of the<br />
pathology of AIDS 57 .<br />
a<br />
HIV-1 RNA copies/ml blood<br />
b<br />
10 7 80<br />
10 1 Neg. (3)<br />
ZFN (9)<br />
10 0 8 9 10 12 8 9 10 12 Weeks post-infection<br />
10 6<br />
60<br />
10 5<br />
10 4<br />
40<br />
10 3<br />
20<br />
10 2<br />
0<br />
2 4 6 8<br />
0 2 4 6 8<br />
Weeks post-infection<br />
Weeks post-infection<br />
10 8<br />
2 2 2<br />
2<br />
Neg.<br />
ZFN<br />
10 6<br />
3<br />
2 3<br />
10 4<br />
2<br />
2<br />
2<br />
2 2<br />
10 2<br />
2 9 2 9<br />
HIV-1 RNA copies/10 6 cells<br />
Small intestine<br />
CD4+ in blood (%)<br />
Large intestine<br />
Figure 6 Control of HIV-1 replication in mice receiving ZFN-treated CD34 +<br />
HSPCs . (a) Mean +/− s.d. levels of HIV-1 RNA (left) and percent CD4 +<br />
human T cells (right) in peripheral blood of mice into which untreated (Neg.)<br />
or ZFN-treated CD34 + HSPCs were transplanted, at indicated times postinfection.<br />
Dashed line is limit of detection of assay. Asterisk indicates a<br />
statistically significant difference between two groups (P < 0.05). (b) Mean<br />
± s.d. HIV-1 RNA levels in small and large intestine lamina propria from<br />
Neg. or ZFN mice, from animals necropsied between 8 and 12 weeks postinfection.<br />
Numbers of mice analyzed at each time point are shown above the<br />
appropriate bar. Dashed line indicates limits of detection of assay. Asterisk<br />
indicates undetectable levels.<br />
Although antiretroviral therapy is highly effective in many patients, the<br />
associated costs and potential for side effects can be considerable when<br />
extrapolated over a lifetime. In contrast, our approach may provide a<br />
one-shot treatment that would be most suited to the setting of autologous<br />
HSPC transplantation. Procedures for isolating and processing HSPCs<br />
for autologous or allogeneic transplantation are well established. The use<br />
of a patient’s own stem cells may remove the requirement for full ablation<br />
of the marrow hematopoietic compartment and the immune suppression<br />
that is necessary in allogeneic transplantation. Indeed, the toxicity of such<br />
regimens is one reason that allogeneic stem cell transplantation from<br />
CCR5Δ32 donors is not a realistic treatment option for HIV + patients in<br />
the absence of other conditions that necessitate the transplant.<br />
Of note, certain HIV-infected individuals, such as AIDS lymphoma<br />
patients, already undergo full ablation and autologous HSPC rescue<br />
as part of their therapy 58 and may be suitable candidates for HSPCbased<br />
gene therapies 44 . In addition, the experience of autologous HSPC<br />
transplantation in gene therapy treatments for ADA-SCID 59,60 , chronic<br />
granulomatous disease 61 and X-linked adrenoleukodystrophy 62 is that<br />
nonmyeloablative conditioning can facilitate engraftment of gene-modified<br />
autologous HSPCs with minimal associated toxicity. It is possible<br />
that the use of nonmyeloablative regimens, together with the selective<br />
advantage conferred on CCR5 −/− progeny, could prove an effective combination<br />
for HIV + patients receiving ZFN-treated autologous HSPCs.<br />
Targeting CCR5 is not expected to provide protection against viruses<br />
that use alternate co-receptors such as CXCR4. Although only a handful<br />
of cases of HIV-1 infection of CCR5Δ32 homozygotes have been<br />
reported 63,64 , CXCR4-tropic viruses have been associated with accelerated<br />
disease progression 65 , so that selection for such strains could be an<br />
undesirable consequence of targeting CCR5. However, this outcome is<br />
not generally observed in patients treated with CCR5 inhibitors unless<br />
CXCR4-tropic viruses were present before therapy, and resistance to<br />
these drugs occurs by viral adaptation to the drug-bound form of CCR5<br />
(refs. 66,67). Notably, although the patient who received the CCR5Δ32<br />
transplant harbored CXCR4-tropic virus before the procedure, his HIV-1<br />
infection was still controlled long term 9,10 . Similar to the recommendations<br />
for CCR5 inhibitors, it may be prudent to restrict CCR5 ZFN treatment<br />
of HSPCs to individuals with no detectable CXCR4-tropic virus.<br />
In contrast to the acute HIV-1 infection modeled in this study, HIV-1<br />
patients usually present in a chronic phase of the disease, and their viral<br />
levels can be effectively controlled by antiretroviral therapy. The requirement<br />
for the selective pressure of active HIV-1 replication in the success<br />
of this, or other, anti-HIV gene therapies is at present unknown. It has<br />
been suggested that low-level viral replication continues in certain sanctuary<br />
sites, even in well-controlled patients on antiretroviral therapy 43,68 ,<br />
which could provide a low level of selection, although drug intensification<br />
trials have not provided evidence of ongoing replication 69 . It is also<br />
possible that the high levels of CCR5 disruption we achieved without<br />
selection, if extrapolated to HIV + patients, could be sufficient to provide<br />
a therapeutic effect even in the absence of a strong selective pressure.<br />
Alternatively, ZFN knockout of CCR5 in HSPCs could be viewed<br />
as a backup strategy in the event that antiretroviral therapy fails or is<br />
withdrawn. It may also be possible to incorporate antiretroviral therapy<br />
interruptions into an overall therapeutic strategy, as recently described<br />
for HIV-infected individuals receiving autologous HSPCs engineered<br />
with anti-HIV ribozymes, where gene-marked progeny were found at<br />
higher levels after treatment interruptions 70 .<br />
In summary, our data demonstrate that transient ZFN treatment of<br />
human CD34 + HSPCs can efficiently disrupt CCR5 while yielding cells<br />
that remain competent to engraft and support hematopoiesis. In the<br />
presence of CCR5-tropic HIV-1, CCR5 −/− progeny rapidly replaced cells<br />
depleted by the virus, leading to a polyclonal population that ultimately<br />
nature biotechnology volume 28 number 8 august 2010 845
articles<br />
© 2010 <strong>Nature</strong> America, Inc. All rights reserved.<br />
preserved human immune cells in multiple tissues. Our findings indicate<br />
that the modification of only a minority of human CD34 + HSPCs may<br />
provide the same strong anti-viral benefit as was conferred by a complete<br />
CCR5Δ32 stem cell transplantation in a patient 9 . And they further<br />
suggest that a partially modified autologous transplant, administered<br />
under only mildly ablative transplantation regimens may also be effective,<br />
opening up the treatment to many more HIV-infected individuals.<br />
Finally, the identification of conditions that allow the efficient use of<br />
ZFNs in human CD34 + HSPCs suggests the use of this technology in<br />
other diseases for which HSPC modification may be curative.<br />
METHODS<br />
Methods and any associated references are available in the online version<br />
of the paper at http://www.nature.com/naturebiotechnology/.<br />
Note: Supplementary information is available on the <strong>Nature</strong> Biotechnology website.<br />
ACKNOWLEDGMENTS<br />
We would like to thank A. Cuddihy, S. Ge, R. Hollis and N. Smiley for expert<br />
technical assistance; C. Lutzko, V. Garcia, R. Akkina, B. Torbett and M. McCune for<br />
advice regarding humanized mice; and M. McCune for communicating unpublished<br />
data. This work was supported by funding from the California HIV/AIDS Research<br />
Project (P.M.C.), The Saban Research Institute (V.T.), and the National Heart, Lung,<br />
and Blood Institute P01 HL73104 (G.M.C., D.B.K. and P.M.C.).<br />
AUTHOR CONTRIBUTIONS<br />
N.H. performed most of the experiments; J.W., K.K., G.F. and X.W. developed assays<br />
and analyzed samples; V.T. contributed to discussions; N.H., G.M.C., D.B.K., P.D.G.,<br />
M.C.H. and P.M.C. designed the experiments and analyzed data; N.H. and P.M.C.<br />
wrote the manuscript.<br />
COMPETING FINANCIAL INTERESTS<br />
The authors declare competing financial interests: details accompany the full-text<br />
HTML version of the paper at http://www.nature.com/naturebiotechnology/.<br />
Published online at http://www.nature.com/naturebiotechnology/.<br />
Reprints and permissions information is available online at<br />
http://npg.nature.com/reprintsandpermissions/.<br />
1. Wu, L. et al. CD4-induced interaction of primary HIV-1 gp120 glycoproteins with the<br />
chemokine receptor CCR-5. <strong>Nature</strong> 384, 179–183 (1996).<br />
2. deRoda Husman, A.M., Blaak, H., Brouwer, M. & Schuitemaker, H. CC chemokine<br />
receptor 5 cell-surface expression in relation to CC chemokine receptor 5 genotype and<br />
the clinical course of HIV-1 infection. J. Immunol. 163, 84597–84603 (1999).<br />
3. Samson, M. et al. Resistance to HIV-1 infection in Caucasian individuals bearing mutant<br />
alleles of the CCR-5 chemokine receptor gene. <strong>Nature</strong> 382, 722–725 (1996).<br />
4. Novembre, J. et al. The geographic spread of the CCR5 Delta32 HIV-resistance allele.<br />
PLoS Biol. 3, e339 (2005).<br />
5. Glass, W.G. et al. CCR5 deficiency increases risk of symptomatic West Nile virus<br />
infection. J. Exp. Med. 203, 35–40 (2006).<br />
6. Kantarci, O.H. et al. CCR5∆32 polymorphism effects on CCR5 expression, patterns<br />
of immunopathology and disease course in multiple sclerosis. J. Neuroimmunol. 169,<br />
137–143 (2005).<br />
7. Rossol, M. et al. Negative association of the chemokine receptor CCR5 d32 polymorphism<br />
with systemic inflammatory response, extra-articular symptoms and joint<br />
erosion in rheumatoid arthritis. Arthritis Res. Ther. 11, R91–98 (2009).<br />
8. Dau, B. & Holodiny, M. Novel targets for antiretroviral therapy: clinical progress to<br />
date. Drugs 69, 31–50 (2009).<br />
9. Hutter, G. et al. Long-term control of HIV by CCR5 Delta32/Delta32 stem-cell transplantation.<br />
N. Engl. J. Med. 360, 692–698 (2009).<br />
10. Hutter, G., Schneider, T. & Thiel, E. Transplantation of selected or transgenic blood<br />
stem cells—a future treatment for HIV/AIDS? J. Int. AIDS Soc. 12, 10–14 (2009).<br />
11. Anderson, J. et al. Safety and efficacy of a lentiviral vector containing three anti-HIV<br />
genes–CCR5 ribozyme, tat-rev siRNA, and TAR decoy–in SCID-hu mouse-derived T<br />
cells. Mol. Ther. 15, 1182–1188 (2007).<br />
12. Bai, J. et al. Characterization of anti-CCR5 ribozyme-transduced CD34+ hematopoietic<br />
progenitor cells in vitro and in a SCID-hu mouse model in vivo. Mol. Ther. 1, 244–254<br />
(2000).<br />
13. Kumar, P. et al. T cell-specific siRNA delivery suppresses HIV-1 infection in humanized<br />
mice. Cell 134, 577–586 (2008).<br />
14. Swan, C.H. et al. T-cell protection and enrichment through lentiviral CCR5 intrabody<br />
gene delivery. Gene Ther. 13, 1480–1492 (2006).<br />
15. Swan, C.H. & Torbett, B.E. Can gene delivery close the door to HIV-1 entry after<br />
escape? J. Med. Primatol. 35, 236–247 (2006).<br />
16. Urnov, F.D. et al. Highly efficient endogenous human gene correction using designed<br />
zinc-finger nucleases. <strong>Nature</strong> 435, 646–651 (2005).<br />
17. Jasin, M. et al. Genetic manipulation of genomes with rare-cutting endonucleases.<br />
Trends Genet. 12, 224–228 (1996).<br />
18. Sonoda, E. et al. Differential usage of non-homologous end-joining and homologous<br />
recombination in double strand break repair. DNA Repair (Amst.) 5, 1021–1029<br />
(2006).<br />
19. Perez, E.E. et al. Establishment of HIV-1 resistance in CD4+ T cells by genome editing<br />
using zinc-finger nucleases. Nat. Biotechnol. 26, 808–816 (2008).<br />
20. Ishikawa, F. et al. Development of functional human blood and immune systems in NOD/<br />
SCID/IL2 receptor {gamma} chain(null) mice. Blood 106, 1565–1573 (2005).<br />
21. Lombardo, A. et al. Gene editing in human stem cells using zinc finger nucleases<br />
and integrase-defective lentiviral vector delivery. Nat. Biotechnol. 25, 1298–1306<br />
(2007).<br />
22. Hollis, R.P. et al. Stable gene transfer to human CD34(+) hematopoietic cells using<br />
the Sleeping Beauty transposon. Exp. Hematol. 34, 1333–1343 (2006).<br />
23. Sumiyoshi, T. et al. Stable transgene expression in primitive human CD34+ hematopoietic<br />
stem/progenitor cells, using the Sleeping Beauty transposon system. Hum. Gene<br />
Ther. 20, 1607–1626 (2009).<br />
24. Mátés, L. et al. Molecular evolution of a novel hyperactive Sleeping Beauty transposase<br />
enables robust stable gene transfer in vertebrates. Nat. Genet. 41, 753–761<br />
(2009).<br />
25. Xue, X. et al. Stable gene transfer and expression in cord blood-derived CD34+<br />
hematopoietic stem and progenitor cells by a hyperactive Sleeping Beauty transposon<br />
system. Blood 114, 1319–1330 (2009).<br />
26. Basu, S. & Broxmeyer, H.E. CCR5 ligands modulate CXCL12-induced chemotaxis,<br />
adhesion, and Akt phosphorylation of human cord blood CD34+ cells. J. Immunol.<br />
183, 7478–7488 (2009).<br />
27. Watanabe, S. et al. Hematopoietic stem cell-engrafted NOD/SCID/IL2Rgamma null<br />
mice develop human lymphoid systems and induce long-lasting HIV-1 infection with<br />
specific humoral immune responses. Blood 109, 212–218 (2007).<br />
28. Brenchley, J.M. et al. CD4 + T cell depletion during all stages of HIV disease occurs<br />
predominantly in the gastrointestinal tract. J. Exp. Med. 200, 749–759 (2004).<br />
29. Brenchley, J.M. et al. HIV disease: fallout from a mucosal catastrophe? Nat. Immunol.<br />
7, 235–239 (2006).<br />
30. Guadalupe, M. et al. Severe CD4+ T-cell depletion in gut lymphoid tissue during<br />
primary human immunodeficiency virus type 1 infection and substantial delay in<br />
restoration following highly active antiretroviral therapy. J. Virol. 77, 11708–11717<br />
(2003).<br />
31. Talal, A.H. et al. Effect of HIV-1 infection on lymphocyte proliferation in gut-associated<br />
lymphoid tissue. J. Acquir. Immune Defic. Syndr. 26, 208–217 (2001).<br />
32. Li, Q. et al. Peak SIV replication in resting memory CD4 + T cells depletes gut lamina<br />
propria CD4 + T cells. <strong>Nature</strong> 434, 1148–1152 (2005).<br />
33. Mattapallil, J.J. et al. Massive infection and loss of memory CD4 + T cells in multiple<br />
tissues during acute SIV infection. <strong>Nature</strong> 434, 1093–1097 (2005).<br />
34. Veazey, R.S. et al. Gastrointestinal tract as a major site of CD4 + T cell depletion and<br />
viral replication in SIV infection. Science 280, 427–431 (1998).<br />
35. Berges, B.K. et al. HIV-1 infection and CD4 T cell depletion in the humanized<br />
Rag2−/−gamma c−/− (RAG-hu) mouse model. Retrovirology 3, 76–90 (2006).<br />
36. Appay, V. & Sauce, D. Immune activation and inflammation in HIV-1 infection: causes<br />
and consequences. J. Pathol. 214, 231–241 (2008).<br />
37. Stoddart, C.A. et al. IFN-alpha-induced upregulation of CCR5 leads to expanded HIV<br />
tropism in vivo. PLoS Pathog. 6, e1000766 (2010).<br />
38. Choudhary, S.K. et al. R5 human immunodeficiency virus type 1 infection of fetal<br />
thymic organ culture induces cytokine and CCR5 expression. J. Virol. 79, 458–471<br />
(2005).<br />
39. Kahn, J.O. & Walker, B.D. Acute human immunodeficiency virus type 1 infection. N.<br />
Engl. J. Med. 339, 33–39 (1998).<br />
40. Margolick, J.B. et al. Impact of inversion of the CD4/CD8 ratio on the natural history<br />
of HIV-1 infection. J. Acquir. Immune Defic. Syndr. 42, 620–626 (2007).<br />
41. Henrard, D.R. et al. Natural History of HIV-1 cell-free viremia. J. Am. Med. Assoc.<br />
274, 554–558 (1995).<br />
42. Chen, R.Y. et al. Distribution of health care expenditures for HIV-infected patients.<br />
Clin. Infect. Dis. 42, 1003–1010 (2006).<br />
43. Richman, D.D. et al. The challenge of finding a cure for HIV infection. Science 323,<br />
1304–1307 (2009).<br />
44. Rossi, J.J., June, C.H. & Kohn, D.B. Genetic therapies against HIV. Nat. Biotechnol.<br />
25, 1444–1454 (2007).<br />
45. Bibikova, M. et al. Targeted chromosomal cleavage and mutagenesis in Drosophila<br />
using zinc-finger nucleases. Genetics 161, 1169–1175 (2002).<br />
46. Doyon, Y. et al. Heritable targeted gene disruption in zebrafish using designed zincfinger<br />
nucleases. Nat. Biotechnol. 26, 702–708 (2008).<br />
47. Santiago, Y. et al. Targeted gene knockout in mammalian cells by using engineered<br />
zinc-finger nucleases. Proc. Natl. Acad. Sci. USA 105, 5809–5814 (2008).<br />
48. Peters, W., Dupuis, M. & Charo, I.F. A mechanism for the impaired IFN-gamma production<br />
in C–C chemokine receptor 2 (CCR2) knockout mice: Role of CCR2 in linking<br />
the innate and adaptive immune responses. J. Immunol. 165, 7072–7077 (2000).<br />
49. Smith, M.W. et al. CCR2 chemokine receptor and AIDS progression. Nat. Med. 3,<br />
1052–1053 (1997).<br />
50. Davis, B.R. & Candotti, F. Revertant somatic mosaicism in the Wiskott-Aldrich syndrome.<br />
Immunol. Res. 44, 127–131 (2009).<br />
51. Hirschhorn, R. et al. Spontaneous in vivo reversion to normal of an inherited mutation<br />
in a patient with adenosine deaminase deficiency. Nat. Genet. 3, 290–295 (1996).<br />
846 volume 28 number 8 august 2010 nature biotechnology
articles<br />
52. Hirschhorn, R. et al. In vivo reversion to normal of inherited mutations in humans.<br />
J. Med. Genet. 40, 721–728 (2003).<br />
53. Stephan, V. et al. Atypical X-linked severe combined immunodeficiency due to possible<br />
spontaneous reversion of the genetic defect in T cells. N. Engl. J. Med. 335,<br />
1563–1567 (1996).<br />
54. Chun, T.W. et al. Persistence of HIV in gut-associated lymphoid tissue despite longterm<br />
antiretroviral therapy. J. Infect. Dis. 197, 714–720 (2008).<br />
55. Lackner, A.A. et al. The gastrointestinal tract and AIDS pathogenesis. Gastroenterology<br />
136, 1965–1978 (2009).<br />
56. Picker, L.J. Immunopathogenesis of acute AIDS virus infection. Curr. Opin. Immunol.<br />
18, 399–405 (2006).<br />
57. Veazey, R.S., Marx, P.A. & Lackner, A.A. The mucosal immune system: primary target<br />
for HIV infection and AIDS. Trends Immunol. 22, 626–633 (2001).<br />
58. Krishnan, A. et al. Autologous stem cell transplantation for HIV associated lymphoma.<br />
Blood 98, 3857–3859 (2001).<br />
59. Aiuti, A. et al. Correction of ADA-SCID by stem cell gene therapy combined with<br />
nonmyeloablative conditioning. Science 296, 2410–2413 (2002).<br />
60. Aiuti, A. et al. Gene therapy for immunodeficiency due to adenosine deaminase<br />
deficiency. N. Engl. J. Med. 360, 447–458 (2009).<br />
61. Ott, M.G. et al. Correction of X-linked chronic granulomatous disease by gene therapy,<br />
augmented by insertional activation of MDS1–EVI1, PRDM16 or SETBP1. Nat. Med.<br />
12, 401–409 (2006).<br />
62. Cartier, N. et al. Hematopoietic stem cell gene therapy with a lentiviral vector in<br />
X-linked adrenoleukodystrophy. Science 326, 818–823 (2009).<br />
63. Biti, R. et al. HIV-1 infection in an individual homozygous for the CCR5 deletion allele.<br />
Nat. Med. 3, 252–253 (1997).<br />
64. Oh, D.Y. et al. CCR5Delta32 genotypes in a German HIV-1 seroconverter cohort and<br />
report of HIV-1 infection in a CCR5Delta32 homozygous individual. PLoS ONE 3,<br />
e2747–2753 (2008).<br />
65. Weiser, B. et al. HIV-1 coreceptor usage and CXCR4-specific viral load predict clinical<br />
disease progression during combination antiretroviral therapy. AIDS 22, 469–479<br />
(2008).<br />
66. Ogert, R.A. et al. Mapping Resistance to the CCR5 co-receptor antagonist vicriviroc<br />
using heterologous chimeric HIV-1 envelope genes reveals key determinants in the<br />
C2–V5 domain of gp120. Virology 373, 387–399 (2008).<br />
67. Soulie, C. et al. Primary genotypic resistance of HIV-1 to CCR5 antagonist treatmentnaïve<br />
patients. AIDS 22, 2212–2214 (2008).<br />
68. Palmer, S. et al. Low-level viremia persists for at least 7 years in patients on suppressive<br />
antiretroviral therapy. Proc. Natl. Acad. Sci. USA 105, 3879–3884 (2008).<br />
69. Dinoso, J.B. et al. Treatment intensification does not reduce residual HIV-1 viremia<br />
in patients on highly active antiretroviral therapy. Proc. Natl. Acad. Sci. USA 106,<br />
9403–9408 (2009).<br />
70. Mitsuyasu, R.T. et al. Phase 2 gene therapy trial of an anti-HIV ribozyme in autologous<br />
CD34+ cells. Nat. Med. 15, 285–292 (2009).<br />
© 2010 <strong>Nature</strong> America, Inc. All rights reserved.<br />
nature biotechnology volume 28 number 8 august 2010 847
© 2010 <strong>Nature</strong> America, Inc. All rights reserved.<br />
ONLINE METHODS<br />
Hematopoietic stem/progenitor cell isolation. Human CD3 + HSPCs were<br />
isolated from umbilical cord blood collected from normal deliveries at local<br />
hospitals, according to guidelines approved by the Children’s Hospital Los<br />
Angeles Committee on Clinical Investigation, or as waste cord blood material<br />
from StemCyte Corp. Immunomagnetic enrichment for CD34 + cells<br />
was performed using the magnetic-activated cell sorting (MACS) system<br />
(Miltenyi Biotec), per the manufacturer’s instructions, with the modification<br />
that the initial purified CD34 + population was put through a second<br />
column and washed three times with 3 ml of the supplied buffer per wash<br />
before the final elution. This additional step gave a > 99% pure CD34 + population,<br />
as measured by FACS analysis using the anti-CD34 antibody, 8G12<br />
(BD Biosciences).<br />
Nucleofection of CD34 + HSPCs with ZFN expression plasmids. Freshly<br />
isolated CD34 + cells were stimulated for 5–12 h in X-VIVO 10 media (Lonza)<br />
containing 2 nM l-glutamine, 50 ng/ml SCF, 50 ng/ml Flt-3 and 50 ng/ml<br />
TPO (R&D Systems). 1 × 10 6 cells were nucleofected with 2.5 µg each of a<br />
plasmid pair expressing ZFNs binding upstream (ZFN-L) or downstream<br />
(ZFN-R) of codon Leu55 within TM1 of human CCR5 (ref. 19). The CD34 +<br />
cell/DNA mix was processed in an X series Amaxa Nucleofector (Lonza)<br />
using the U-01 setting and the human CD34 + nucleofector solution, according<br />
to the manufacturer’s instructions. Following nucleofection, cells were<br />
immediately placed in pre-warmed IMDM media (Lonza) containing 26%<br />
FBS (Mediatech), 0.35% BSA, 2nM l-glutamine, 0.5% 10 −3 mol/l hydrocortisone<br />
(Stem Cell Technologies), 5 ng/ml IL-3, 10 ng/ml IL-6 and 25 ng/ml<br />
SCF (R&D Systems). Cells were allowed to recover in this media for 2–12 h<br />
before injection into mice.<br />
Apoptosis assay. CD34 + HSPCs were collected at 24 h post-nucleofection<br />
and analyzed for the percent of viable cells marked for apoptosis using the<br />
PE apoptosis detection kit (BD Biosciences) according to the manufacturer’s<br />
instructions. Cells were stained with 7-AAD (detects viable cells) and annexin<br />
V (detects apoptotic cells) and analyzed using a FACScan flow cytometer (BD<br />
Biosciences). This double staining allowed the identification of cells in the<br />
early stages of apoptosis.<br />
NSG mouse transplantation. NOD.Cg-Prkdc scid Il2rg tm1Wj/SzJ (NOD/<br />
SCID/IL2rγ null , NSG) mice 71 were obtained from Jackson Laboratories.<br />
Neonatal mice within 48 h of birth received 150 cGy radiation, then 2–4 h<br />
later 1 × 10 6 ZFN-modified or mock-treated human CD34 + HSPCs in 50 µl<br />
PBS containing 1% heparin were injected through the facial vein. For secondary<br />
transplantations, bone marrow was harvested by needle aspiration<br />
from the upper and lower limbs of 18-week-old animals previously engrafted<br />
with human CD34 + HSPCs, filtered through a 70 µm nylon mesh screen<br />
(Fisher Scientific) and washed in PBS. The cells were transplanted into three<br />
8-week-old mice that had previously received 350 cGy radiation, using retroorbital<br />
injection of 2 × 10 7 bone marrow cells per mouse. Mouse cohorts are<br />
described in Supplementary Table 2.<br />
Analysis of CCR5 disruption. The percentage of CCR5 alleles disrupted by<br />
ZFN treatment was measured by performing PCR across the ZFN target site<br />
followed by digestion with the Surveyor (Cel 1) nuclease (Transgenomic),<br />
which detects heteroduplex formation, as previously described 19 . Briefly,<br />
genomic DNA was extracted from mouse tissues and subject to nested PCR<br />
amplification using human CCR5-specific primers, with the resulting radiolabeled<br />
products digested with Cel 1 nuclease and resolved by PAGE. The<br />
ratio of cleaved to uncleaved products was calculated to give a measure of<br />
the frequency of gene disruption. The assay is sensitive enough to detect<br />
single-nucleotide changes and has a linear detection range between 0.69 and<br />
44% 19 .<br />
In addition, a common 5-bp (pentamer) duplication that occurs<br />
after nonhomologous end-joining repair of ZFN-cleaved CCR5 (ref. 19)<br />
was detected by PCR. The first-round PCR product generated during<br />
Cel 1 analysis was diluted 1:5,000 and 5 µl used in a Taqman qPCR reaction<br />
using primers (5′-GGTCATCCTCATCCTGATCTGA-3′ and<br />
5′-GATGATGAAGAAGATTCCAGAGAAGAAG-3′) and probe 5′-FAM d<br />
(CCTTCTTACTGTCCCCTTCTGGGCTCAC) BHQ-1-3′ (Biosearch<br />
Technologies), and analyzed using a 7,900HT real-time PCR machine<br />
(Applied Biosystems). At the same time, 5 µl of a 1:50,000 dilution of<br />
the PCR product were used in a Taqman qPCR reaction using primers<br />
(5′- CCAAAAAATCAATGTGAAGCAAATC-3′ and 5′- TGCCCACAAAAC<br />
CAAAGATG -3′) and probe 5′- FAM d(CAGCCCGCCTCCTGCCTCC)<br />
BHQ-1-3′ to detect total copies of human CCR5. Data were analyzed using<br />
software supplied by the manufacturer and the frequency of pentamer insertions<br />
in CCR5 calculated. The assay is sensitive enough to detect a single<br />
pentamer insertion event in 100,000 cells (data not shown).<br />
ZFN-induced modifications of CCR5 were analyzed by directly sequencing<br />
cloned CCR5 alleles, isolated by PCR amplification as described above, and<br />
TOPO-TA cloning (Invitrogen). Plasmid DNA was isolated from 60 individual<br />
bacterial colonies for each tissue analyzed.<br />
HIV-1 infection and analysis. A cell-free virus stock of HIV-1 BaL and a<br />
molecular clone of HIV-1 NL4-3 were obtained from the AIDS Research and<br />
Reference Reagent Program (ARRRP), Division of AIDS, NIAID, NIH from<br />
material deposited by Suzanne Gartner, Mikulas Popovic, Robert Gallo and<br />
Malcolm Martin. HIV-1 BaL virus was propagated in PM1 cells, obtained from<br />
the ARRRP and deposited by Marvin Reitz and harvested 10 d post-infection.<br />
HIV-1 NL4-3 viruses were generated by transient transfection of 293T<br />
cells (ATCC). Viruses were titrated using the Alliance HIV-1 p24 ELISA<br />
kit (PerkinElmer) and by TCID 50 analysis on U373-MAGI cells (ARRRP,<br />
deposited by Michael Emerman and Adam Geballe). Mice to be infected<br />
with HIV-1 were anesthetized with inhalant 2.5% isoflourane and injected<br />
intraperitoneally with virus stocks containing 200 ng p24, 7 × 10 4 TCID 50<br />
units, in 100 µl total volume.<br />
HIV-1 levels in peripheral blood or tissues harvested at necropsy were<br />
determined by extracting RNA from 5 × 10 5 cells using the master pure<br />
complete DNA and RNA purification kit (Epicentre Biotechnologies) and<br />
performing Taqman qPCR using a primer and probe set targeting the HIV-1<br />
LTR region, as previously described 72 . In addition, p24 levels were measured<br />
in blood samples by ELISA.<br />
Mouse blood and tissue collection. Peripheral blood samples were collected<br />
every 2 weeks starting at 8 weeks of age, using retro-orbital sampling. Whole<br />
blood was blocked in FBS (Mediatech) for 30 min., the red blood cells were<br />
lysed using Pharmlyse solution (BD Biosciences) and cells were washed with<br />
PBS. Tissue samples were collected at necropsy and processed immediately<br />
for cell isolation and FACS analysis, or kept in freezing media (IMDM plus<br />
20% DMSO) in liquid nitrogen, for later analysis and DNA extraction. Tissue<br />
samples were manually agitated in PBS before filtering through a sterile 70<br />
µm nylon mesh screen (Fisher Scientific) and suspension cell preparations<br />
produced as previously described 19 . Intestinal samples were processed as<br />
previously described 73 , with the modification that the mononuclear cell<br />
population was isolated after incubation in citrate buffer and collagenase<br />
enzyme for 2 h, followed by nylon wool filtration (Amersham Biosciences)<br />
and ficoll-hypaque gradient isolation (GE Healthcare).<br />
Analysis of human cells in mouse tissues. FACS analysis of human cells was<br />
performed using a FACSCalibur instrument (BD Biosciences) with either<br />
BD CellQuest Pro version 5.2 (BD Biosciences) or FlowJo software version<br />
8.8.6 for Macintosh (Treestar). The gating strategy performed was an initial<br />
forward scatter versus side scatter (FSC/SSC) gate to exclude debris, followed<br />
by a human CD45 gate. For analysis of lymphocyte populations in peripheral<br />
blood, a further lymphoid gate (low side scatter) was also applied to exclude<br />
cells of monocytic origin 74 . All antibodies used were fluorochrome conjugated<br />
and human specific, and obtained from BD Biosciences: CD45 (clone 2D1),<br />
CD19 (clone HIB19), CD14 (clone MϕP9), CD3 (clone SK7), CD4 (clone<br />
SK3), CD8 (clone HIT8a), CCR5 (2D7). Gates were set using fluorescence<br />
minus one controls, where cells were stained with all antibodies except the one<br />
of interest. Specificity was also confirmed using isotype-matched nonspecific<br />
antibodies (BD Biosciences) (Supplementary Fig. 1) and with tissues from<br />
animals that had not been engrafted with human cells.<br />
Immunohistochemical analysis of human CD3 and CD4 expression,<br />
respectively, in the small intestine and spleen tissue from HSPC-engrafted<br />
nature biotechnology doi:10.1038/nbt.1663
mice was performed on fixed paraffin-embedded tissue sections, as previously<br />
described 73 . Controls included isotype-matched nonspecific antibodies and<br />
unengrafted NSG mice.<br />
Statistical analysis. All statistical analysis was performed using GraphPad<br />
Prism version 5.0b for Mac OSX (GraphPad Software). Unpaired two-tailed<br />
t-tests were performed assuming equal variance to calculate P-values. A 95%<br />
confidence interval was used to determine significance. A minimum of three<br />
data points was used for each analysis.<br />
71. Shultz, L.D. et al. Human lymphoid and myeloid cell development in NOD/LtSz-scid<br />
IL2R gamma null mice engrafted with mobilized human hematopoietic stem cells.<br />
J. Immunol. 174, 6477–6489 (2005).<br />
72. Rouet, F. et al. Transfer and evaluation of an automated, low-cost real-time reverse<br />
transcription-PCR test for diagnosis and monitoring of human immunodeficiency<br />
virus type 1 infection in a West African resource-limited setting. J. Clin. Microbiol.<br />
43, 2709–2717 (2005).<br />
73. Sun, Z. et al. Intrarectal transmission, systemic infection, and CD4+ T cell depletion<br />
in humanized mice infected with HIV-1. J. Exp. Med. 204, 705–714 (2007).<br />
74. Loken, M.R. et al. Establishing lymphocyte gates for immunophenotyping by flow<br />
cytometry. Cytometry 11, 453–459 (1990).<br />
© 2010 <strong>Nature</strong> America, Inc. All rights reserved.<br />
doi:10.1038/nbt.1663<br />
nature biotechnology
articles<br />
Cell type of origin influences the molecular and<br />
functional properties of mouse induced pluripotent<br />
stem cells<br />
© 2010 <strong>Nature</strong> America, Inc. All rights reserved.<br />
Jose M Polo 1–4 , Susanna Liu 5 , Maria Eugenia Figueroa 6 , Warakorn Kulalert 1–4 , Sarah Eminli 1–4 ,<br />
Kah Yong Tan 1,4,7 , Effie Apostolou 1–4 , Matthias Stadtfeld 1–4 , Yushan Li 6 , Toshi Shioda 2 , Sridaran Natesan 8 ,<br />
Amy J Wagers 1,4,7 , Ari Melnick 6 , Todd Evans 5 & Konrad Hochedlinger 1–4<br />
Induced pluripotent stem cells (iPSCs) have been derived from various somatic cell populations through ectopic expression of defined<br />
factors. It remains unclear whether iPSCs generated from different cell types are molecularly and functionally similar. Here we<br />
show that iPSCs obtained from mouse fibroblasts, hematopoietic and myogenic cells exhibit distinct transcriptional and epigenetic<br />
patterns. Moreover, we demonstrate that cellular origin influences the in vitro differentiation potentials of iPSCs into embryoid bodies<br />
and different hematopoietic cell types. Notably, continuous passaging of iPSCs largely attenuates these differences. Our results<br />
suggest that early-passage iPSCs retain a transient epigenetic memory of their somatic cells of origin, which manifests as differential<br />
gene expression and altered differentiation capacity. These observations may influence ongoing attempts to use iPSCs for disease<br />
modeling and could also be exploited in potential therapeutic applications to enhance differentiation into desired cell lineages.<br />
IPSCs are usually obtained from fibroblasts after infection with viral constructs<br />
expressing the four transcription factors Oct4, Sox2, Klf4 and<br />
c-Myc 1–10 . In addition, other cell types, including blood 2,4,11 , stomach<br />
and liver cells 1 , keratinocytes 12,13 , melanocytes 14 , pancreatic β cells 7 and<br />
neural progenitors 3,15–17 have been reprogrammed into iPSCs. Although<br />
these iPSC lines have been shown to express pluripotency genes and<br />
support the differentiation into cell types of all three germ layers, recent<br />
studies detected substantial molecular and functional differences among<br />
iPSCs derived from distinctive cell types. For example, iPSCs produced<br />
from various fibroblasts, stomach and liver cells showed different propensities<br />
to form tumors in mice, although the underlying molecular<br />
mechanisms remain elusive 18 . Another study identified persistent donor<br />
cell–specific gene expression patterns in human iPSCs produced from<br />
different cell types, suggesting an influence of the somatic cell of origin<br />
on the molecular properties of resultant iPSCs 19 . Whether cellular origin<br />
also affected the functional properties of iPSCs remained unexplored<br />
in that report. Of note, the findings of some of these studies may be<br />
confounded by the presence of different viral insertions in individual<br />
iPSC lines and by the fact that the analyzed iPSC lines were of different<br />
genetic background, which can affect both gene expression patterns 20<br />
and the functionality 9,21 of cells. Indeed, we have recently shown that<br />
many mouse iPSC lines derived from different somatic cell types show<br />
aberrant silencing of a surprisingly small set of transcripts compared with<br />
embryonic stem cells (ESCs) 22 . However, our study did not investigate<br />
whether additional cell-of-origin–specific differences may exist in iPSC<br />
lines derived from different cell types.<br />
Patient-specific iPSCs are a valuable tool for the study of disease and<br />
possibly for the development of therapies 20,23–26 . Thus, resolving the question<br />
of whether iPSCs produced from different cell types are molecularly<br />
and functionally equivalent is crucial for using these cells to model disease,<br />
which entails detecting subtle differences in the differentiation potential<br />
of patient-derived iPSCs 24,27 . Furthermore, the identification of somatic<br />
cells that influence the differentiation capacities of resultant iPSCs into<br />
desired cell lineages could be useful in a therapeutic setting.<br />
To assess whether iPSCs derived from different somatic cell types are<br />
distinguishable, we compared here the transcriptional and epigenetic<br />
patterns, as well as the in vitro differentiation potentials, of iPSCs produced<br />
from four genetically identical adult mouse cell types that differed<br />
only in the lineage from which they were derived.<br />
RESULTS<br />
Genetically matched iPSCs derived from different cell types<br />
Because the genetic background of ESCs can influence their transcriptional<br />
and functional behaviors, we used a previously described<br />
‘secondary system’ to generate genetically identical iPSCs 2,28 (Fig. 1a).<br />
Briefly, iPSCs were generated from somatic cells using doxycyclineinducible<br />
lentiviruses expressing Oct4, Sox2, Klf4 and c-Myc 29 , and<br />
then injected into blastocysts to produce isogenic chimeric mice.<br />
1 Howard Hughes Medical Institute and Department of Stem Cell and Regenerative Biology, Harvard University and Harvard Medical School, Cambridge,<br />
Massachusetts, USA. 2 Massachusetts General Hospital Cancer Center, Charlestown, Massachusetts, USA. 3 Massachusetts General Hospital Center for<br />
Regenerative Medicine, Boston, Massachusetts, USA. 4 Harvard Stem Cell Institute, Cambridge, Massachusetts, USA. 5 Department of Surgery, Weill Cornell<br />
Medical College, New York, New York, USA. 6 Department of Medicine, Hematology Oncology Division, Weill Cornell Medical College, New York, New York, USA.<br />
7 Joslin Diabetes Center, Boston, Massachusetts, USA. 8 Sanofi-Aventis Cambridge Genomics Center, Cambridge, Massachusetts, USA. Correspondence should be<br />
addressed to K.H. (khochedlinger@helix.mgh.harvard.edu).<br />
Received 26 March; accepted 9 July; published online 19 July 2010; doi:10.1038/nbt1667<br />
848 volume 28 number 8 august 2010 nature biotechnology
articles<br />
a<br />
Blast<br />
injection<br />
Secondary iPSC clone<br />
(carry dox-inducible copies<br />
of Oct4, Sox2, Klf4, c-Myc)<br />
Chi no. 1<br />
Granulocytes<br />
SMP cells<br />
+ dox<br />
B cells<br />
Gra-iPSC<br />
SMP-iPSC<br />
B-iPSC<br />
• Gene expression<br />
• DNA methylation<br />
• ChIP for histone modifications<br />
• In vitro differentiation<br />
Chi no. 2<br />
TTFs<br />
TTF-iPSC<br />
b<br />
Cxcr4<br />
Itgb1<br />
Gr-1<br />
Lysozyme<br />
0.12<br />
1.00<br />
0.05<br />
0.05<br />
© 2010 <strong>Nature</strong> America, Inc. All rights reserved.<br />
Fold GAPDH<br />
c<br />
0.10<br />
0.08<br />
0.06<br />
0.04<br />
0.02<br />
0.00<br />
SMPiPSC<br />
GraiPSC<br />
SMPiPSC<br />
Fold GAPDH<br />
0.80<br />
0.60<br />
0.40<br />
0.20<br />
0.00<br />
Chi no. 1 Chi no. 2<br />
SMPiPSC<br />
GraiPSC<br />
Fold GAPDH<br />
d<br />
0.04<br />
0.03<br />
0.02<br />
0.01<br />
0.00<br />
SMP-iPSC1<br />
SMP-iPSC2<br />
SMP-iPSC3<br />
Gra-iPSC3<br />
Gra-iPSC1<br />
Gra-iPSC2<br />
Fold GAPDH<br />
0.04<br />
0.03<br />
0.02<br />
0.01<br />
0.00<br />
B-iPSC3<br />
B-iPSC1<br />
B-iPSC2<br />
TTF-iPSC3<br />
TTF-iPSC1<br />
TTF-iPSC2<br />
Chi no. 1 Chi no. 2<br />
1 2 3 1 2 3 1 2 3 1 2 3<br />
GraiPSC<br />
SMPiPSC<br />
B-<br />
iPSC<br />
TTFiPSC<br />
GraiPSC<br />
SMPiPSC<br />
GraiPSC<br />
Figure 1 iPSCs derived from different cell types are transcriptionally distinguishable. (a) Flow chart explaining the derivation and analysis of genetically<br />
matched iPSCs from different cell types. Secondary iPSCs were first injected into blastocysts to generate chimeric mice, from which the indicated somatic<br />
cell types were isolated. Exposure of these cells to doxycycline (dox) then gave rise to iPSCs. ChIP, chromatin immunoprecipitation. (b) Quantification of<br />
the expression levels of Cxcr4, Itgb1, Gr-1 and Lysozyme by quantitative PCR in SMP-iPSCs, in red, and Gra-iPSCs, in gray. The values were normalized to<br />
GAPDH expression; the error bars depict the s.e.m. (n = 3). (c) Heat map showing top 104 probes with highest variance in their expression levels. Left panel,<br />
SMP-iPSCs and Gra-iPSCs derived from chimera no. 1. Right panel, TTF-iPSCs and B-iPSCs derived from chimera no. 2. (d) Hierarchical, unsupervised<br />
clustering of iPSC expression profiles using the correlation distance and the Ward method. SMP-iPSCs and Gra-iPSCs were derived from chimera no. 1 (left<br />
panel), TTF-iPSCs and B-iPSCs originate from chimera no. 2 (right panel). Chi no. 1, chimera no. 1; chi no. 2, chimera no. 2.<br />
Thus, isolation of different cell types from these chimeras and their<br />
subsequent exposure to doxycycline gave rise to iPSCs with the same<br />
genetic makeup. In this study, we focused on iPSCs derived from tail<br />
tip–derived fibroblasts (TTFs), splenic B cells (B), bone marrow–<br />
derived granulocytes and skeletal muscle precursors (SMPs) 30 , which<br />
were continuously cultured for 2–3 weeks (passage 4 to 6) after picking.<br />
The pluripotency of some of these cell lines has been previously<br />
documented 2 , or was analyzed in this study (Supplementary Table<br />
1 and Supplementary Fig. 1). All cell lines grew at similar rates and<br />
independently of viral transgene expression (Supplementary Fig.<br />
2) and upregulated the endogenous pluripotency genes Nanog,<br />
Sox2 and Oct4, indicating successful molecular reprogramming<br />
(Supplementary Table 1). Moreover, all lines gave rise to differentiated<br />
teratomas, and all tested lines supported the development of<br />
chimeric animals upon blastocyst injection, demonstrating their<br />
pluripotency (Supplementary Table 1). We therefore concluded that<br />
the cell lines analyzed here qualify as bona fide iPSC lines.<br />
iPSCs produced from different cell types are transcriptionally<br />
distinguishable<br />
We first evaluated whether iPSCs derived from defined somatic cell<br />
types retain gene expression patterns indicative of their cells of origin.<br />
Specifically, we assessed the expression of cell lineage–specific<br />
candidate genes in iPSCs derived from granulocytes (Gra-iPSCs)<br />
and SMPs (SMP-iPSCs). As expected, the SMP markers Cxcr4 and<br />
Integrin B1 and the granulocyte markers Lysozyme (also known as<br />
Lyz1 and Lyz2) and Gr-1 (also known as Ly6g) were expressed at considerably<br />
higher levels in the somatic cells of origin than in resultant<br />
nature biotechnology volume 28 number 8 august 2010 849
articles<br />
a<br />
Chi no. 1 Chi no. 2<br />
b<br />
Gra-iPSC2<br />
Gra-iPSC1<br />
B-iPSC1<br />
B-iPSC3<br />
d = 0.02 d = 0.02<br />
Gra-iPSC3<br />
B-iPSC2<br />
SMP-iPSC2<br />
TTF-iPSC1<br />
SMP-iPSC3<br />
TTF-iPSC3<br />
SMP-iPSC1<br />
TTF-iPSC2<br />
Chi no. 1 Chi no. 2<br />
© 2010 <strong>Nature</strong> America, Inc. All rights reserved.<br />
c<br />
SMP-iPSC1<br />
SMP-iPSC2<br />
SMP-iPSC3<br />
Gra-iPSC1<br />
Gra-iPSC2<br />
Gra-iPSC3<br />
ESC<br />
d<br />
Percent input<br />
0.12<br />
0.1<br />
0.08<br />
0.06<br />
0.04<br />
0.02<br />
Gr-1<br />
Gr-1<br />
Lysozyme<br />
Percent of methylation<br />
0% 100% Not analyzed<br />
Percent input<br />
Itgb1<br />
Cxcr4<br />
0.6<br />
0.5<br />
0.4<br />
0.3<br />
0.2<br />
0.1<br />
Cxcr4<br />
H3Ac<br />
H3K4me3<br />
H3K27me3<br />
IgG<br />
0<br />
0<br />
Gra<br />
SMP<br />
Gra SMP GraiPSC<br />
SMPiPSC<br />
GraiPSC<br />
SMPiPSC<br />
0.4<br />
Lysozyme<br />
0.8<br />
Itgb1<br />
Percent input<br />
0.3<br />
0.2<br />
Percent input<br />
0.6<br />
0.4<br />
0.1<br />
0.2<br />
0<br />
0<br />
Gra SMP GraiPSC<br />
SMPiPSC<br />
Gra SMP<br />
GraiPSC<br />
SMPiPSC<br />
Figure 2 iPSCs derived from different cell types exhibit distinguishable epigenetic signatures. (a) Hierarchical unsupervised clustering analysis of<br />
HELP genome-wide methylation data from indicated iPSC lines. (b) Correspondence analysis of SMP-iPSCs and Gra-iPSCs (left panel) from chimera<br />
no. 1, TTF-iPSCs and B-iPSCs (right panel) from chimera no. 2. (c) Graphic representation of DNA methylation quantification of specific CpGs<br />
(circles) in the promoter regions of the indicated candidate genes using EpiTYPER DNA methylation analyses. Yellow indicates 0% methylation and<br />
blue 100% methylation. (d) Chromatin immunoprecipitation (ChIP) for H3 pan-acetylated (H3Ac, in blue), H3K4 trimethylated (H3K4me3, in green),<br />
H3K27 trimethylated (H3K27me3, in red) and isotype control (IgG, in light blue) of granulocytes (Gra), SMPs, Gra-iPSCs and SMP-iPSCs. Chi no. 1,<br />
chimera no. 1; chi no. 2, chimera no. 2. The error bars depict the s.e.m. (n = 3).<br />
850 volume 28 number 8 august 2010 nature biotechnology
articles<br />
© 2010 <strong>Nature</strong> America, Inc. All rights reserved.<br />
EryP colonies<br />
a<br />
b<br />
c<br />
EB diameter<br />
(in arbitrary units)<br />
2,000<br />
1,600<br />
1,200<br />
800<br />
400<br />
0<br />
B-iPSC<br />
TTF-iPSC<br />
Gra-iPSC<br />
SMP-iPSC<br />
8<br />
7<br />
6<br />
5<br />
4<br />
3<br />
2<br />
1<br />
0<br />
B-<br />
iPSC<br />
B-iPSC<br />
B-<br />
iPSC<br />
P < 0.001<br />
5,000 cells/ml<br />
6 days<br />
P < 0.001<br />
Chi no. 2<br />
2,500<br />
2,000<br />
1,500<br />
1,000<br />
500<br />
0<br />
P < 0.05<br />
EBs<br />
TTF-iPSC<br />
Dissociate and<br />
plate 100,000/ml<br />
iPSCs (Supplementary Fig. 3). Moreover, SMP-iPSCs expressed substantially<br />
higher levels of Cxcr4 and Itgb1 than did Gra-iPSCs (Fig.<br />
1b), and Gra-iPSCs showed higher expression levels of Lysozyme<br />
and Gr-1 compared with SMP-iPSCs (Fig. 1b). Together, these data<br />
suggest that iPSCs retain a transcriptional memory of their somatic<br />
cell of origin.<br />
To test this notion globally, we compared the transcriptional profiles<br />
of iPSC lines originating from SMPs (n = 3) with those derived from<br />
granulocytes (n = 3), as well as expression profiles of iPSC lines originating<br />
from B cells (n = 3) with those produced from TTFs (n = 3).<br />
Note that iPSCs were compared with each other only if they originated<br />
from the same chimeric mouse (SMP-iPSCs versus Gra-iPSCs and<br />
B-iPSCs versus TTF-iPSCs) (Fig. 1a) to eliminate potential variability<br />
d<br />
250<br />
200<br />
150<br />
100<br />
50<br />
0<br />
eryPs<br />
250<br />
200<br />
150<br />
100<br />
50<br />
0<br />
Gra-iPSC<br />
e f g<br />
EryP colonies<br />
SMPiPSC<br />
TTFiPSC<br />
GraiPSC<br />
SMPiPSC<br />
Chi no. 1<br />
Macrophage colonies<br />
B-<br />
iPSC<br />
Macrophage colonies<br />
P < 0.07<br />
EPO<br />
4 days<br />
7 days<br />
cytokines<br />
8 days<br />
Macrophages<br />
IL-3/M-CSF<br />
3<br />
2<br />
1<br />
0<br />
B-<br />
iPSC<br />
SMP-iPSC<br />
eryPs<br />
Macrophages<br />
Mixed colonies<br />
Mixed colonies<br />
Chi no. 2 Chi no. 1<br />
Chi no. 2 Chi no. 1<br />
Chi no. 2<br />
Chi no. 1<br />
4<br />
3<br />
2<br />
1<br />
0<br />
P < 0.05<br />
Figure 3 iPSCs derived from different cell types have distinctive in vitro differentiation potentials. (a) Experimental<br />
outline. iPSCs were first differentiated into embryoid bodies. At day 6, embryoid bodies were dissociated and<br />
plated in conditions to favor differentiation into erythrocyte progenitors (eryP) and macrophage and mixed<br />
hematopoietic colonies. (b) Phase contrast images showing embryoid bodies derived from B-iPSCs, TTF-iPSCs,<br />
Gra-iPSCs and SMP-iPSCs at same magnification. (c) Quantification of embryoid body sizes derived from B-iPSCs,<br />
TTF-iPSCs, Gra-iPSCs and SMP-iPSCs; the diameter of the embryoid bodies was measured using arbitrary units<br />
(AU). The error bars depict the s.e.m. (n = 30) (d) Representative images of erythrocyte progenitors (eryPs),<br />
macrophage colonies and mixed hematopoietic colonies. (e–g) Quantification of in vitro differentiation potentials<br />
of the different iPSCs into EryPs (e), macrophage colonies (f) and mixed hematopoietic colonies (g). Chi no. 1,<br />
chimera no. 1; chi no. 2, chimera no. 2. The error bars depict the s.e.m. (n = 12).<br />
Mixed colonies<br />
Mixed colonies<br />
TTFiPSC<br />
GraiPSC<br />
SMPiPSC<br />
TTFiPSC<br />
TTFiPSC<br />
GraiPSC<br />
SMPiPSC<br />
GraiPSC<br />
between different experiments and<br />
individual animals. All iPSC lines<br />
analyzed were between passage (p)<br />
4 and 6. There were 1,388 genes differentially<br />
expressed (twofold, corrected<br />
P = 0.05) between SMP-iPSCs<br />
and Gra-iPSCs, and 1,090 genes<br />
between B-iPSCs and TTF-iPSCs<br />
(Supplementary Table 2). An analysis<br />
of the 100 genes with the greatest<br />
range of expression levels across<br />
all samples indicated that iPSCs<br />
with the same cell of origin clustered<br />
together (Fig. 1c). Consistent<br />
with this observation, unsupervised<br />
hierarchical clustering (Fig.<br />
1d) as well as principal component<br />
analysis (Supplementary Fig. 4)<br />
of all genes placed SMP-iPSCs and<br />
Gra-iPSCs, as well as B-iPSCs and<br />
TTF-iPSCs, into different groups<br />
according to their cells of origin.<br />
Notably, Gene Ontology (GO)<br />
analysis of the 100 genes with the<br />
greatest range of expression between<br />
SMP-iPSCs and Gra-iPSCs indicated<br />
an enrichment for genes belonging<br />
to the categories ‘myofibril’ (7.6-<br />
fold enrichment), ‘contractile fiber’<br />
(7.3-fold enrichment) and ‘muscle<br />
development’ (5.9-fold enrichment)<br />
as well as ‘B-cell activation’<br />
(6.8-fold enrichment) and ‘leukocyte<br />
activation’ (3.7-fold enrichment)<br />
(when compared with the<br />
expected background). Together,<br />
these results show that genetically<br />
identical iPSCs obtained from four<br />
different somatic cell types are distinguishable<br />
from each other using<br />
genome-wide transcriptional analyses,<br />
further supporting the notion<br />
that the donor cell type influences<br />
the overall gene expression pattern<br />
of resultant iPSCs.<br />
To determine the effect on gene<br />
expression patterns of deriving<br />
iPSCs from different animals in<br />
independent experiments, we compared the expression profiles of<br />
Gra-iPSCs derived from chimera no. 1 (n = 3) with Gra-iPSCs from<br />
chimera no. 2 (n = 3) as well as with SMP-iPSCs from chimera no. 1<br />
and TTF-iPSCs from chimera no. 2 (Fig. 1a). Hierarchical clustering<br />
separated Gra-iPSCs according to their origin from different animals,<br />
suggesting a significant contribution of this experimental variable to<br />
gene expression patterns (Supplementary Fig. 5). However, when the<br />
expression data from TTF-iPSCs and SMP-iPSCs were included in the<br />
analysis, we found that differences due to cell of origin were stronger<br />
than those arising from variations in experimental conditions or animals.<br />
These data reinforce the observation that iPSCs derived from<br />
different somatic cell types are transcriptionally distinguishable, even<br />
when they originate from different animals.<br />
nature biotechnology volume 28 number 8 august 2010 851
articles<br />
© 2010 <strong>Nature</strong> America, Inc. All rights reserved.<br />
Figure 4 Continuous<br />
passaging of iPSCs<br />
abrogates transcriptional,<br />
epigenetic and functional<br />
differences. (a) Hierarchical<br />
unsupervised clustering of<br />
expression profiles from<br />
B-iPSCs, T-iPSCs, TTFiPSCs<br />
and Gra-iPSCs from<br />
chimera no. 2. Left panel<br />
shows clustering analysis of<br />
all iPSC samples at passage<br />
p4, the middle panel at p10<br />
and the right panel at p16.<br />
(b) Number of differentially<br />
expressed probes between<br />
pairs of iPSC samples used<br />
in a; iPSCs at p4 are shown<br />
in blue bars, iPSCs at p10<br />
are shown in orange bars<br />
and iPSCs at p16 are shown<br />
in red bars. The number<br />
of differently expressed<br />
probes between iPSCs was<br />
calculated using a pairwise<br />
analysis (twofold), with t-test<br />
P = 0.05, with Bejamini and<br />
Hochberg correction (n = 3).<br />
(c) Venn diagram and GO<br />
analysis showing overlap of<br />
genes that change from p4<br />
to p16 in Gra-IPSCs, TTFiPSCs<br />
and B-iPSCs. Red line<br />
marks functional GO cluster<br />
of genes shared between all<br />
three iPSC groups. Black<br />
line marks functional GO<br />
cluster of genes shared<br />
by at least two of the<br />
iPSC groups. Functional<br />
ontology cluster analysis was<br />
performed using the DAVIS<br />
algorithm. (d) Hierarchical<br />
unsupervised clustering<br />
using HELP genome-wide<br />
methylation profiles of<br />
B-iPSCs and TTF-iPSCs at<br />
p16. (e–g) Quantification<br />
of in vitro differentiation<br />
potentials of B-iPSCs and<br />
TTF-iPSCs at p16 into EryPs<br />
(e), macrophage colonies<br />
(f) and mixed hematopoietic<br />
colonies (g). The error bars<br />
depict the s.e.m. (n = 9).<br />
a<br />
T-iPSC2<br />
T-iPSC1<br />
T-iPSC3<br />
TTF-iPSC3<br />
TTF iPSC1<br />
TTF iPSC2<br />
Gra-iPSC3<br />
Gra-iPSC1<br />
Gra-iPSC2<br />
B-iPSC3<br />
B-iPSC1<br />
B-iPSC2<br />
c<br />
Gra-iPSC p4 vs. p16<br />
TTF-iPSC p4 vs. p16<br />
d<br />
TTF iPSC2<br />
B-iPSC3<br />
T-iPSC2<br />
Gra-iPSC1<br />
Gra-iPSC2<br />
Gra-iPSC3<br />
B-iPSC3<br />
TTF-iPSC1<br />
TTF-iPSC2<br />
B-iPSC2<br />
B-iPSC1<br />
TTF-iPSC3<br />
B-iPSC1<br />
T-iPSC1<br />
T-iPSC3<br />
685<br />
474<br />
TTF iPSC1<br />
125<br />
56<br />
508<br />
Organ development:<br />
EGLN1, EN2, AA409316,<br />
GYS1, IQGAP2, LOXL3, MGP,<br />
NDRG1, NOPE, PHF21A,<br />
BC021588, CYB5R3,<br />
SNRPD3, NM_008681,<br />
NM_030247<br />
B-iPSC p4 vs. p16<br />
B-iPSC2<br />
B-iPSC1<br />
T-iPSC1<br />
T-iPSC2<br />
TTF-iPSC3<br />
B-iPSC2<br />
Gra-iPSC2<br />
TTF-iPSC2<br />
Gra-iPSC3<br />
T-iPSC3<br />
Gra-iPSC1<br />
B-iPSC3<br />
TTF-iPSC1<br />
p4 p10 p16<br />
68 15<br />
TTF-iPSC3<br />
e<br />
EryP colonies<br />
900<br />
800<br />
700<br />
600<br />
500<br />
400<br />
300<br />
200<br />
100<br />
0<br />
g<br />
Mixed colonies<br />
1.5<br />
1<br />
0.5<br />
0<br />
b<br />
Differentially expressed probes<br />
B-iPSC<br />
B-iPSC<br />
2,500 p4<br />
2,000<br />
1,500<br />
1,000<br />
500<br />
0<br />
T-iPSC<br />
vs.<br />
B-iPSC<br />
T-iPSC<br />
vs.<br />
TTF-iPSC<br />
Functional cluster<br />
Tube morphogenesis<br />
B-iPSC<br />
vs.<br />
TTF-iPSC<br />
T-iPSC<br />
vs.<br />
Gra-iPSC<br />
Positive regulation of cellular process<br />
Morphogenesis of a branching structure<br />
Response to heat<br />
Organ development<br />
mRNA metabolic process<br />
Cellular component assembly<br />
Cartilage and skeletal development<br />
Regulation of cell cycle<br />
Tissue development<br />
Spermatogenesis<br />
TTF-iPSC<br />
TTF-iPSC<br />
f<br />
Macrophage colonies<br />
140<br />
120<br />
100<br />
80<br />
60<br />
40<br />
20<br />
0<br />
B-iPSC<br />
B-iPSC<br />
vs.<br />
Gra-iPSC<br />
Gra-iPSC<br />
vs.<br />
TTF-iPSC<br />
Enrichment score<br />
2.75<br />
2.09<br />
2.04<br />
1.98<br />
1.96<br />
1.95<br />
1.79<br />
1.75<br />
1.69<br />
1.41<br />
1.40<br />
TTF-iPSC<br />
p10<br />
p16<br />
To exclude the possibility that the observed gene expression differences<br />
were due to the specific secondary system used, we derived<br />
iPSCs from SMPs, granulocytes, B cells and peritoneal fibroblasts<br />
from reprogrammable mice 31 , which carry dox-inducible copies of<br />
all four reprogramming factors in a defined genomic locus. All iPSC<br />
lines grew independently of dox and gave rise to differentiated teratomas<br />
(Supplementary Fig. 6a). Analysis of gene expression profiles of<br />
these lines at p4 showed clustering according to their cells of origin,<br />
with the exception of peritoneal fibroblast–derived iPSCs, which<br />
may be a consequence of the heterogeneity of the starting population.<br />
Collectively, these results corroborate the notion that iPSCs<br />
generated from different cell types exhibit distinct transcriptional<br />
patterns (Supplementary Fig. 6b).<br />
iPSCs derived from different cell types exhibit distinguishable<br />
epigenetic patterns<br />
We next asked whether the differential gene expression patterns we<br />
observed correlated with differences in epigenetic marks. To this end, we<br />
performed a genome-wide, restriction enzyme–based methylation analysis<br />
of promoters termed ‘HpaII tiny fragment enrichment by ligationmediated<br />
PCR’ (HELP) on the same cell lines we used for expression<br />
analysis. Unsupervised hierarchical clustering showed that Gra-iPSCs<br />
852 volume 28 number 8 august 2010 nature biotechnology
articles<br />
Reprogramming<br />
(transgene-dependent phase)<br />
Reprogramming<br />
(transgene-independent phase)<br />
two genes. A similar pattern was observed for the<br />
granulocyte-specific genes in Gra-iPSCs compared<br />
with SMP-iPSCs, with Gr-1 and Lysozyme being<br />
elevated for H3K4me3 (Fig. 2d). These data show<br />
that the observed expression differences among<br />
iPSCs derived from different cell types may be predominantly<br />
the consequence of differences in histone<br />
marks, further suggesting that iPSCs retain an<br />
epigenetic memory of their cells of origin.<br />
© 2010 <strong>Nature</strong> America, Inc. All rights reserved.<br />
Cell of origin<br />
Partially reprogrammed cells<br />
• No endogenous pluripotent<br />
gene expression<br />
• No contribution to chimeras<br />
• Teratoma formation<br />
Early passage iPSC<br />
• Activation of endogenous<br />
pluripotency genes<br />
• Promoter demethylation<br />
• Teratoma formation<br />
• Chimera contribution<br />
• Transcriptionally distinguishable<br />
• Transient epigenetic memory<br />
• Altered differentiation<br />
Continuous passaging of iPSCs abrogates transcriptional,<br />
epigenetic and functional differences<br />
Previously published data suggest that early-passage, human iPSCs<br />
derived from fibroblasts are transcriptionally distinct from late-passage<br />
iPSCs 32 . However, that study did not examine the effect of passaging on<br />
the iPSC functionality. We therefore wondered whether continuous passaging<br />
of the various iPSC lines would eliminate the observed differences<br />
in gene expression and differentiation potential. For this analysis, we<br />
added to the B-iPSC/TTF-iPSC group, studied before (Figs. 1 and 2a,b), a<br />
new set of T cell– and granulocyte-derived iPSCs, which were all derived<br />
from chimera no. 2. These 12 iPSC lines were subjected to several additional<br />
rounds of passaging under identical culture conditions, and RNA<br />
was harvested at p10 and p16 for expression profiling. Whereas unsupervised<br />
hierarchical clustering of these cell lines at early passage (p4)<br />
clearly separated each of the different iPSC lines according to their cells<br />
of origin (Fig. 4a, left panel), unsupervised clustering of these lines at p10<br />
showed that B-iPSCs, TTF-iPSCs and T-iPSCs were indistinguishable<br />
from each other, whereas the Gra-iPSCs still clustered together (Fig. 4a,<br />
middle panel). Further passaging of these cells until p16 entirely eliminated<br />
these differences (Fig. 4a, right panel). Together, these data indiand<br />
SMP-iPSCs, as well as B-iPSCs and TTF-iPSCs, which clustered<br />
separately in the transcriptional assays, were also distinguishable based<br />
on their methylation patterns (Fig. 2a). Correspondence analysis of the<br />
same samples corroborated this finding (Fig. 2b), indicating that the<br />
donor cell type affects not only the overall transcriptional pattern but<br />
also the promoter methylation pattern of resultant iPSCs.<br />
Despite the separation of Gra-iPSCs from SMP-iPSCs and of<br />
TTF-iPSCs from B-iPSCs (Fig. 2a,b) by hierarchical clustering, we<br />
detected few loci that were differentially methylated with statistical<br />
significance using supervised analysis (69 genes between GraiPSCs<br />
and SMP-iPSCs and 0 genes between B-iPSCs and TTF-iPSCs;<br />
Supplementary Table 3). To complement these results, we interrogated<br />
the DNA methylation status at the promoter regions of the<br />
previously analyzed markers Cxcr4, Itgb1, Lysozyme and Gr-1 (Fig.<br />
1b) using EpiTYPER DNA methylation analysis, which quantifies<br />
gene-specific CpG methylation. We failed to detect differences in the<br />
methylation levels of these candidate genes between SMP-iPSCs and<br />
Gra-iPSCs (Fig. 2c), further indicating that methylation differences<br />
are more subtle than the observed gene expression differences and<br />
raising the possibility that other chromatin marks may be responsible<br />
for the observed expression differences.<br />
Indeed, we observed high levels of the activating marks H3Ac and<br />
H3K4me3 and low levels of the repressive marks H3K27me3 at the promoters<br />
of Cxcr4 and Itgb1 in SMPs and at the promoters of Lysozyme and<br />
Gr-1 in granulocytes, respectively, consistent with their abundant expression<br />
in these cell types (Fig. 2d). Notably, SMP-iPSCs, which showed<br />
higher expression levels of Cxcr4 and Itgb1 than did Gra-iPSCs (Fig.<br />
1b), were enriched for H3K4me3 compared with Gra-iPSCs at these<br />
iPSCs derived from different cell types have<br />
distinctive in vitro differentiation potentials<br />
Because the gene expression differences we observed<br />
among different iPSC lines affected genes known to<br />
be involved in the lineage-specific differentiation<br />
and function of the somatic cell types from which<br />
they were derived, we reasoned that these differences<br />
might affect their capacity to differentiate<br />
into defined cell lineages. Thus, we evaluated the<br />
autonomous differentiation potential of the four<br />
types of iPSC lines by assessing their abilities to<br />
produce embryoid bodies, erythrocyte progenitors,<br />
macrophages and mixed hematopoietic colonies<br />
using established semiquantitative differentiation<br />
protocols (Fig. 3a). Most notably, TTF-iPSCs produced<br />
significantly smaller and fewer embryoid<br />
bodies compared with all the other iPSC lines (P<br />
< 0.001; Fig. 3b,c). Moreover, the embryoid bodies<br />
derived from TTF-iPSC generated relatively<br />
few erythrocyte, macrophage and mixed colony<br />
progenitors compared with B-iPSCs derived from<br />
the same animal despite equal numbers of input<br />
cells, indicating striking differences in the differentiation<br />
potentials of these iPSCs (Fig. 3d–g). In contrast, SMP-iPSCs<br />
and Gra-iPSCs showed equivalent abilities to produce embryoid bodies<br />
(Fig. 3d–g). However, Gra-iPSCs gave rise to erythrocyte, macrophages<br />
and mixed colonies at higher efficiencies than SMP-iPSCs, suggesting<br />
a pattern of differentiation that reflects their cells of origin. Together,<br />
these data show that the cell type of origin may bias the differentiation<br />
potential of resultant iPSC lines.<br />
Late passage iPSC<br />
• Activation of endogenous<br />
pluripotency genes<br />
• Promoter demethylation<br />
• Teratoma formation<br />
• Chimera contribution<br />
Figure 5 Model summarizing the presented data. iPSCs derived from different somatic cell<br />
types retain a transient epigenetic and transcriptional memory of their cell type of origin at early<br />
passage, despite acquiring pluripotent gene expression, transgene-independent growth and the<br />
ability to contribute to tissues in chimeras. Continuous passaging resolves these differences,<br />
giving rise to iPSCs that are molecularly and functionally indistinguishable. Note the difference<br />
between early passage iPSCs and partially reprogrammed cells, which require continuous<br />
viral transgene expression and fail to activate endogenous pluripotency genes or support the<br />
development of viable mice.<br />
nature biotechnology volume 28 number 8 august 2010 853
articles<br />
© 2010 <strong>Nature</strong> America, Inc. All rights reserved.<br />
cate that continuous cell division resolves transcriptional differences<br />
among iPSC lines. Consistent with this observation, the total number<br />
of differentially expressed genes between various pairs of iPSC lines<br />
derived from different cellular origins was reduced from ~500–2,000<br />
in early-passage cultures to only ~50 or even 0 in late-passage cultures,<br />
further demonstrating that after extensive in vitro propagation, these<br />
iPSC lines have become very similar to each other (Fig. 4b).<br />
Analysis of the genes whose expression changed between p4 and p16<br />
in Gra-iPSCs, B-iPSCs and TTF-iPSCs showed 25% overlap with at least<br />
one of the other two groups of iPSC lines, suggesting that iPSCs undergo<br />
some common changes during passaging, irrespective of their cell of origin<br />
(Fig. 4c). GO analysis of these changes indicated a strong enrichment<br />
for developmental regulators. Moreover, the only GO cluster common to<br />
all three groups was ‘organ development’, indicating that the passaging of<br />
iPSCs results in a change of differentiation-associated gene expression<br />
patterns (Fig. 4c). The expression levels of the pluripotency genes Sox2<br />
and Oct4, which are high already at early passage (Supplementary Table<br />
1), increased even further during the passaging process, supporting the<br />
notion that the pluripotency network becomes increasingly solidified<br />
during culture (Supplementary Fig. 7), consistent with a previous report<br />
showing gradual upregulation of pluripotency-associated genes upon<br />
passaging of human iPSC lines 32 .<br />
To evaluate whether the passaging of iPSCs attenuates the observed<br />
epigenetic differences, we performed HELP analysis on B-iPSCs and<br />
TTF-iPSCs at late passage. In contrast to early-passage iPSCs, the latepassage<br />
iPSCs could not be separated by hierarchical unsupervised<br />
clustering analysis based on their cells of origin (Fig. 4d). Accordingly,<br />
the methylation levels of histones at candidate genes in Gra-iPSCs and<br />
SMP-iPSCs became indistinguishable (Supplementary Fig. 8). Notably,<br />
several of the analyzed loci showed an enrichment for both H3K4me3<br />
and H3K27me3, indicative of bivalent domains that are characteristic of<br />
pluripotent stem cells 33 . Thus, continuous passaging leads to an equilibration<br />
of the epigenetic differences detected in early-passage iPSCs.<br />
Two possible mechanisms could account for the observed loss of<br />
epigenetic and transcriptional memory with increased passage number:<br />
(i) passive replication-dependent loss of somatic marks in the majority<br />
of iPSCs and (ii) selection of rare, preexisting, fully reprogrammed cells<br />
over time. Because the selection model predicts that such rare clones<br />
would have a growth or survival advantage, we would expect to see<br />
impaired growth rates of bulk iPSC cultures at early passage compared<br />
with late passage, which we did not observe (Supplementary Fig. 9a).<br />
We also did not detect significant differences when the growth rates of<br />
single-cell clones established from early and late passage iPSC lines were<br />
examined using a colorimetric assay (XTT assay) that detects metabolic<br />
activity (Supplementary Fig. 10) or by measuring the increase<br />
in cell numbers on three consecutive days (Supplementary Figs. 11<br />
and 12). Similarly, an analysis of the colony formation efficiency of<br />
single cell-sorted iPSC from early- and late-passage cultures did not<br />
yield detectable differences (Supplementary Fig. 9b). Collectively, these<br />
data argue against the presence of rare subclones that become selected<br />
over time and are consistent with the notion that all iPSC lines gradually<br />
resolve transcriptional and epigenetic differences with increased<br />
passaging. However, our results do not exclude a combined model<br />
involving passive resolution of epigenetic marks as well as selection<br />
of multiple clones.<br />
Finally, we asked whether the similar transcriptional and epigenetic<br />
patterns of late-passage iPSCs derived from distinct cells of origin would<br />
translate into an equalization of their differentiation potentials. We first<br />
performed an embryoid-body formation assay at different passages for<br />
TTF-iPSCs and B-iPSCs, which showed a strong difference at early passage.<br />
TTF-iPSCs gave rise to similarly-sized embryoid bodies as B-iPSCs<br />
around p10–p12 (Supplementary Fig. 13a,b) and were indistinguishable<br />
at p16 (Supplementary Fig. 13c,d). Moreover, embryoid bodies derived<br />
from TTF-iPSCs and B-iPSCs at p16 differentiated into similar numbers<br />
of erythrocyte (Fig. 4e), macrophage (Fig. 4f) and mixed-colony progenitors<br />
(Fig. 4g), thus proving that extensive cellular passaging eliminates<br />
differences in the differentiation potentials of these iPSCs.<br />
DISCUSSION<br />
Our study shows that genetically matched iPSCs retain a transient transcriptional<br />
and epigenetic memory of their cell of origin at early passage,<br />
which can substantially affect their potential to differentiate into<br />
embryoid bodies and different hematopoietic cell types (Fig. 5). These<br />
molecular and functional differences are lost upon continuous passaging,<br />
however, indicating that complete reprogramming is a gradual<br />
process that continues beyond the acquisition of a bona fide iPSC state<br />
as measured by the activation of endogenous pluripotency genes, viral<br />
transgene–independent growth and the ability to differentiate into<br />
cell types of all three germ layers. Notably, the previously seen silencing<br />
of the Dlk1-Dio3 locus in many iPSC lines 22 is not affected by the<br />
passaging of cells (data not shown). Of note, the early-passage iPSCs<br />
described here are different from “partially reprogrammed iPSCs” 34,35 ,<br />
which depend on the continuous expression of viral transgenes and do<br />
not activate and demethylate pluripotency genes or contribute to the<br />
formation of viable chimeras (Fig. 5).<br />
The mechanism by which passaging eliminates the molecular and<br />
functional differences between iPSCs of different origins remains to<br />
be determined. Three key observations argue against the possibility<br />
of selective expansion of a rare subset of completely reprogrammed<br />
iPSCs: (i) both early- and late-passage iPSCs had similar proliferation<br />
rates; (ii) there was little variability in the growth rate of single-cell<br />
iPSC clones from early- and late-passage lines; and (iii) the number<br />
of passages required to resolve cell-of-origin differences was dependent<br />
upon the starting cell type. These observations suggest that the<br />
consolidation of the pluripotent transcriptional network upon passaging<br />
is a slow process, potentially facilitated by a positive feedback<br />
mechanism that gradually resolves the residual cell-of-origin–specific<br />
epigenetic marks and transcriptional patterns. In accordance with this<br />
idea is the finding that telomeres become gradually elongated with<br />
increased passage number of iPSCs 36 . Our results are also consistent<br />
with the previous observation that cloned embryos often retain donor<br />
cell–specific transcriptional patterns and do not efficiently activate<br />
embryonic genes over many cell divisions 37–40 , suggesting possible<br />
similarities in the mechanisms of reprogramming by nuclear transfer<br />
and induced pluripotency.<br />
Because of the lack of ESC lines genetically matched to the secondary<br />
iPSC lines used here, we did not include ESC lines in our<br />
comparative analysis. Nevertheless, the present results may help to<br />
explain some of the previously reported differences between ESCs<br />
and iPSCs 41,42 . Some of these studies compared late-passage ESC lines<br />
with iPSC lines of undefined, but presumably earlier, passage that may<br />
not yet have reached an ESC-equivalent ground state. It should be<br />
informative to revisit these studies with genetically matched, transgene-free<br />
late-passage iPSCs to determine whether this abrogates such<br />
gene expression and differentiation differences.<br />
The observed tendency of early-passage iPSC lines to differentiate preferentially<br />
into the cell lineage of origin could potentially be exploited<br />
in clinical settings to produce certain somatic cell types that have been<br />
difficult to obtain from ESCs thus far. However, these data also serve as a<br />
cautionary note for ongoing attempts to recapitulate disease phenotypes<br />
in vitro using patient-specific, early-passage iPSC lines, as the epigenetic,<br />
transcriptional and functional ‘immaturity’ of these cells might confound<br />
854 volume 28 number 8 august 2010 nature biotechnology
articles<br />
© 2010 <strong>Nature</strong> America, Inc. All rights reserved.<br />
the data obtained from them. Further elucidation of the molecular indicators<br />
of fully reprogrammed iPSCs should help in the establishment of<br />
standardized iPSC lines that can be compared with confidence in basic<br />
biological and drug discovery studies.<br />
METHODS<br />
Methods and any associated references are available in the online version<br />
of the paper at http://www.nature.com/naturebiotechnology/.<br />
Accession code. GEO: GSE22043, GSE22827, GSE22908.<br />
Note: Supplementary information is available on the <strong>Nature</strong> Biotechnology website.<br />
ACKNOWLEDGMENTS<br />
We thank N. Maherali and R. Walsh for helpful suggestions and critical reading of<br />
the manuscript, B. Wittner for statistical advice, J. LaVecchio, G. Buruzula,<br />
K. Folz-Donahue and L. Prickett for expert cell sorting and K. Coser for technical<br />
assistance. J.M.P. was supported by an MGH ECOR fellowship, E.A. by a Jane<br />
Coffin Childs fellowship, M.S. by a Schering fellowship and K.Y.T. by the Agency<br />
of Science, Technology and Research Singapore. Support to A.M. was from the<br />
Lymphoma Society, SCOR no. 7132-08; to T.E. from National Institutes of Health<br />
(NIH) grant HL056182 and NYSTEM; to A.J.W. in part from the Burroughs<br />
Wellcome Fund, Harvard Stem Cell Institute, Peabody Foundation, and NIH 1<br />
DP2 OD004345-01, and the Joslin Diabetes Center DERC (P30DK036836); to<br />
K.H. from Howard Hughes Medical Institute, the NIH Director’s Innovator Award<br />
and the Harvard Stem Cell Institute. The content is solely the responsibility of the<br />
authors and does not necessarily represent the official views of the NIH.<br />
AUTHOR CONTRIBUTIONS<br />
J.M.P. and K.H. conceived the study, interpreted results and wrote the manuscript;<br />
J.M.P. performed most of the experiments with help from W.K.; S.L. and T.E.<br />
performed and interpreted in vitro differentiation assays; M.E.F and A.M.<br />
performed and analyzed HELP methylation experiments; K.Y.T. and A.J.W. isolated<br />
SMPs and derived most SMP-iPSCs; T.S. and S.N. performed expression arrays;<br />
and S.E., E.A. and M.S. provided essential study material. All authors gave critical<br />
input to the manuscript draft.<br />
COMPETING FINANCIAL INTERESTS<br />
The authors declare competing financial interests: details accompany the full-text<br />
HTML version of the paper at http://www.nature.com/naturebiotechnology/.<br />
Published online at http://www.nature.com/naturebiotechnology/.<br />
Reprints and permissions information is available online at http://npg.nature.com/<br />
reprintsandpermissions/.<br />
Note added in proof: We thank George Daley for sharing unpublished results,<br />
which show similar differences in DNA methylation patterns and differentiation<br />
propensity of iPSCs derived from distinctive cell types. Of note, this report 43 also<br />
suggests that somatic cell nuclear transfer more faithfully reprograms cells to a<br />
pluripotent state than transcription factor overexpression.<br />
1. Aoi, T. et al. Generation of pluripotent stem cells from adult mouse liver and stomach<br />
cells. Science 321, 699–702 (2008).<br />
2. Eminli, S. et al. Differentiation stage determines potential of hematopoietic cells for<br />
reprogramming into induced pluripotent stem cells. Nat. Genet. 41, 968–976 (2009).<br />
3. Eminli, S., Utikal, J., Arnold, K., Jaenisch, R. & Hochedlinger, K. Reprogramming of<br />
neural progenitor cells into induced pluripotent stem cells in the absence of exogenous<br />
Sox2 expression. Stem Cells 26, 2467–2474 (2008).<br />
4. Hanna, J. et al. Direct reprogramming of terminally differentiated mature B lymphocytes<br />
to pluripotency. Cell 133, 250–264 (2008).<br />
5. Lowry, W.E. et al. Generation of human induced pluripotent stem cells from dermal<br />
fibroblasts. Proc. Natl. Acad. Sci. USA 105, 2883–2888 (2008).<br />
6. Park, I.H. et al. Reprogramming of human somatic cells to pluripotency with defined<br />
factors. <strong>Nature</strong> 451, 141–146 (2008).<br />
7. Stadtfeld, M., Brennand, K. & Hochedlinger, K. Reprogramming of pancreatic beta<br />
cells into induced pluripotent stem cells. Curr. Biol. 18, 890–894 (2008).<br />
8. Takahashi, K. et al. Induction of pluripotent stem cells from adult human fibroblasts<br />
by defined factors. Cell 131, 861–872 (2007).<br />
9. Takahashi, K. & Yamanaka, S. Induction of pluripotent stem cells from mouse embryonic<br />
and adult fibroblast cultures by defined factors. Cell 126, 663–676 (2006).<br />
10. Yu, J. et al. Induced pluripotent stem cell lines derived from human somatic cells.<br />
Science 318, 1917–1920 (2007).<br />
11. Loh, Y.H. et al. Generation of induced pluripotent stem cells from human blood. Blood<br />
113, 5476–5479 (2009).<br />
12. Aasen, T. et al. Efficient and rapid generation of induced pluripotent stem cells from<br />
human keratinocytes. Nat. Biotechnol. 26, 1276–1284 (2008).<br />
13. Maherali, N. et al. A high-efficiency system for the generation and study of human<br />
induced pluripotent stem cells. Cell Stem Cell 3, 340–345 (2008).<br />
14. Utikal, J., Maherali, N., Kulalert, W. & Hochedlinger, K. Sox2 is dispensable for the<br />
reprogramming of melanocytes and melanoma cells into induced pluripotent stem<br />
cells. J. Cell Sci. 122, 3502–3510 (2009).<br />
15. Kim, J.B. et al. Pluripotent stem cells induced from adult neural stem cells by reprogramming<br />
with two factors. <strong>Nature</strong> 454, 646–650 (2008).<br />
16. Shi, Y. et al. A combined chemical and genetic approach for the generation of induced<br />
pluripotent stem cells. Cell Stem Cell 2, 525–528 (2008).<br />
17. Silva, J. et al. Promotion of reprogramming to ground state pluripotency by signal<br />
inhibition. PLoS Biol. 6, e253 (2008).<br />
18. Miura, K. et al. Variation in the safety of induced pluripotent stem cell lines. Nat.<br />
Biotechnol. 27, 743–745 (2009).<br />
19. Ghosh, Z. et al. Persistent donor cell gene expression among human induced pluripotent<br />
stem cells contributes to differences with human embryonic stem cells. PLoS<br />
One 5, e8975 (2010).<br />
20. Soldner, F. et al. Parkinson’s disease patient-derived induced pluripotent stem cells<br />
free of viral reprogramming factors. Cell 136, 964–977 (2009).<br />
21. Okita, K., Ichisaka, T. & Yamanaka, S. Generation of germline-competent induced<br />
pluripotent stem cells. <strong>Nature</strong> 448, 313–317 (2007).<br />
22. Stadtfeld, M. et al. Aberrant silencing of imprinted genes on chromosome 12qF1 in<br />
mouse induced pluripotent stem cells. <strong>Nature</strong> 465, 175–181 (2010).<br />
23. Dimos, J.T. et al. Induced pluripotent stem cells generated from patients with ALS<br />
can be differentiated into motor neurons. Science 321, 1218–1221 (2008).<br />
24. Ebert, A.D. et al. Induced pluripotent stem cells from a spinal muscular atrophy<br />
patient. <strong>Nature</strong> 457, 277–280 (2009).<br />
25. Park, I.H. et al. Disease-specific induced pluripotent stem cells. Cell 134, 877–886<br />
(2008).<br />
26. Saha, K. & Jaenisch, R. Technical challenges in using human induced pluripotent<br />
stem cells to model disease. Cell Stem Cell 5, 584–595 (2009).<br />
27. Lee, G. et al. Modelling pathogenesis and treatment of familial dysautonomia using<br />
patient-specific iPSCs. <strong>Nature</strong> 461, 402–406 (2009).<br />
28. Wernig, M. et al. A drug-inducible transgenic system for direct reprogramming of<br />
multiple somatic cell types. Nat. Biotechnol. 26, 916–924 (2008).<br />
29. Stadtfeld, M., Maherali, N., Breault, D.T. & Hochedlinger, K. Defining molecular<br />
cornerstones during fibroblast to iPS cell reprogramming in mouse. Cell Stem Cell 2,<br />
230–240 (2008).<br />
30. Cerletti, M. et al. Highly efficient, functional engraftment of skeletal muscle stem<br />
cells in dystrophic muscles. Cell 134, 37–47 (2008).<br />
31. Stadtfeld, M., Maherali, N., Borkent, M. & Hochedlinger, K. A reprogrammable mouse<br />
strain from gene-targeted embryonic stem cells. Nat. Methods 7, 53–55 (2010).<br />
32. Chin, M.H. et al. Induced pluripotent stem cells and embryonic stem cells are distinguished<br />
by gene expression signatures. Cell Stem Cell 5, 111–123 (2009).<br />
33. Bernstein, B.E. et al. A bivalent chromatin structure marks key developmental genes<br />
in embryonic stem cells. Cell 125, 315–326 (2006).<br />
34. Mikkelsen, T.S. et al. Dissecting direct reprogramming through integrative genomic<br />
analysis. <strong>Nature</strong> 454, 49–55 (2008).<br />
35. Sridharan, R. et al. Role of the murine reprogramming factors in the induction of<br />
pluripotency. Cell 136, 364–377 (2009).<br />
36. Marion, R.M. et al. Telomeres acquire embryonic stem cell characteristics in induced<br />
pluripotent stem cells. Cell Stem Cell 4, 141–154 (2009).<br />
37. Boiani, M., Eckardt, S., Scholer, H.R. & McLaughlin, K.J. Oct4 distribution and<br />
level in mouse clones: consequences for pluripotency. Genes Dev. 16, 1209–1219<br />
(2002).<br />
38. Bortvin, A. et al. Incomplete reactivation of Oct4-related genes in mouse embryos<br />
cloned from somatic nuclei. Development 130, 1673–1680 (2003).<br />
39. Ng, R.K. & Gurdon, J.B. Epigenetic memory of active gene transcription is inherited<br />
through somatic cell nuclear transfer. Proc. Natl. Acad. Sci. USA 102, 1957–1962<br />
(2005).<br />
40. Ng, R.K. & Gurdon, J.B. Epigenetic memory of an active gene state depends on histone<br />
H3.3 incorporation into chromatin in the absence of transcription. Nat. Cell Biol. 10,<br />
102–109 (2008).<br />
41. Feng, Q. et al. Hemangioblastic derivatives from human induced pluripotent stem<br />
cells exhibit limited expansion and early senescence. Stem Cells 28, 704–712<br />
(2010).<br />
42. Hu, B.Y. et al. Neural differentiation of human induced pluripotent stem cells follows<br />
developmental principles but with variable potency. Proc. Natl. Acad. Sci. USA 107,<br />
4335–4340 (2010).<br />
43. Kim, K. et al. Epigenetic memory in induced pluripotent stem cells. <strong>Nature</strong><br />
doi:10.1038/nature09342 (19 July 2010).<br />
nature biotechnology volume 28 number 8 august 2010 855
© 2010 <strong>Nature</strong> America, Inc. All rights reserved.<br />
ONLINE METHODS<br />
Generation of iPSC lines. iPSC lines were generated as described previously<br />
2 . Briefly, iPSC-derived somatic cells were isolated from chimeras<br />
by fluorescence-activated cell sorting (FACS), plated on feeders in the<br />
presence of cytokines in ESC culture conditions. Resultant iPSC colonies<br />
were picked and expanded in the absence of doxycycline and used for<br />
subsequent analyses.<br />
SMP isolation. Myofiber-associated cells were prepared from intact<br />
limb muscles (extensor digitorum longus, gastrocnemius, quadriceps,<br />
soleus, traverus abdominis and triceps brachii) as described<br />
previously 44,45 . Briefly, intact mouse limb muscles were digested<br />
with collagenase II to dissociate individual myofibers. These were<br />
triturated and digested with collagenase II and dispase to release<br />
myofiber-associated cells. The myofiber-associated cells were next<br />
unfractionated by FACS, using the following marker profiles for each<br />
population: (i) SMPs: CD45 − Sca-1 − Mac-1 − CXCR4 + β1-integrin + ; (ii)<br />
Myoblast-containing population: CD45 − Sca-1 − Mac-1 − CXCR4 − ; (iii)<br />
Sca1 + mesenchymal cells: D45 − Sca-1 + Mac-1 − . After the initial sort, cells<br />
were resorted by FACS using the same gating profile to increase the<br />
purity of the obtained population 46 .<br />
Blastocyst injections. For blastocyst injections, female BDF1 mice were<br />
superovulated by intraperitoneal injection of PMS and hCG and mated<br />
to BDF1 stud males. Zygotes were isolated from females with a vaginal<br />
plug 24 h after hCG injection. Zygotes for 2n injections were cultured<br />
for 3 d in vitro in KSOM media, blastocysts were identified, injected with<br />
ESCs or iPSCs and transferred into pseudopregnant recipient females.<br />
Teratoma formation. iPSCs were harvested by trypsinization, preplated<br />
onto untreated culture plates to remove feeders as well as differentiating<br />
cells and injected into flanks of nonobese diabetic/severe combined<br />
immunodeficient NOD/SCID mice, using ~5 million cells per injection.<br />
The mice were euthanized 3–5 weeks after injection, teratomas dissected<br />
out and processed for histological analysis.<br />
Cellular growth assays. To measure the clonal growth potential of iPSCs,<br />
SSEA1-positive cells from the different iPSC lines were sorted into<br />
96-well plates by FACS (BD). After 7 d, the presence of iPSC colonies<br />
was scored based on morphology. To establish growth rates, the different<br />
bulk iPSCs lines or derivative subclones were plated in six gelatinized<br />
wells of a 12-well plates and each day the number of cells was counted<br />
in duplicate using a Countess cell counter (Invitrogen). For colorimetric<br />
measurement of growth, iPSCs lines were subcloned into 96-well plates<br />
and after 7 d, the cells were exposed to XTT (TOX-2) (Sigma) reagent<br />
overnight and the absorbance at 450 nm measured with a multiwell plate<br />
reader (Molecular Devices).<br />
Cell culture. ESCs and iPSCs were cultured in ESC medium (DMEM<br />
with 15% FBS, l-glutamin, penicillin-streptomycin, nonessential amino<br />
acids, β-mercaptoethanol and 1,000 U/ml leukemia inhibitor factor) on<br />
irradiated feeder cells. TTF cultures were established by trypsin digestion<br />
of tail-tip biopsies taken from newborn (3–8 d of age) chimeric mice<br />
produced by blastocyst injection of iPSCs.<br />
RNA isolation. ESCs and iPSCs grown on 35-mm dishes were harvested<br />
when they reached about 50% confluency and preplated on<br />
nongelatinized T25 flasks for 45 min to remove feeder cells. Cells<br />
were spun down and the pellet used for isolation of total RNA using<br />
the miRNeasy Mini Kit (Qiagen) without DNase digestion. RNA was<br />
eluted from the columns using 50 ml RNAse-free water or TE buffer,<br />
pH7.5 (10 mM Tris-HCl and 0.1 mM EDTA) and quantified using a<br />
Nanodrop (Nanodrop Technologies).<br />
Quantitative PCR. cDNA was produced with the First Strand cDNA<br />
Synthesis Kit (Roche) using 1 mg of total RNA input. Real-time quantitative<br />
PCR reactions were set up in triplicate using 5 ml of cDNA<br />
(1:100 dilution) with the Brilliant II SYBR Green QPCR Master Mix<br />
(Stratagene) and run on a Mx3000P QPCR System (Stratagene). Primer<br />
sequences are listed in Supplementary Table 4.<br />
mRNA profiling. Total RNA samples (RIN (RNA integrity number) > 9)<br />
were subjected to transcriptomal analyses using Affymetrix HTMG- 430A<br />
mRNA expression microarray as previously described.<br />
Statistical analyses. Hierarchical clustering was performed using the<br />
GeneSifter software (Geospiza). Correlation distance and subsequent clustering<br />
were done using Ward’s method. The differentially expressed genes<br />
(twofold) were calculated using a t-test (P = 0.05) with Benjamini and<br />
Hochberg correction. Principal component analysis was performed using<br />
the GeneSifter software. Gene ontology analysis was performed using the<br />
DAVID software 47 , with the classification stringency set to ‘high’.<br />
Embryoid body formation. Before plating embryoid bodies, the iPSCs<br />
were depleted of mouse embryonic fibroblasts by splitting the cells 1:3<br />
onto gelatin-coated plates on each day, for 2 consecutive days. On the 3rd<br />
day (designated day 0), iPSCs were trypsinized and plated at a density of<br />
5,000 cells/ml in Isocove’s Modified Dulbecco’s Medium (IMDM) with<br />
15% FCS (Atlanta Biologicals), 10% protein-free hybridoma medium<br />
(PFHM-II; Gibco), 2 mM l-glutamine (Gibco), 200 µg/ml transferrin<br />
(Roche), 0.5 mM ascorbic acid (Sigma) and 4.5 × 10⁻⁴ M monothioglycerol<br />
(MTG; Sigma). Differentiation was carried out in 60-mm ethylene<br />
oxide–treated Petri grade dishes (Parter Medical). The embryoid bodies<br />
were left to differentiate until day 6, when the cells were harvested to<br />
assay for hematopoietic colonies.<br />
Hematopoietic colony formation assays. Day 6 embryoid bodies were<br />
collected by gravity, dissociated with trypsin and then passed several<br />
times through a 20 gauge needle to ensure dissociation. For the growth<br />
of hematopoietic progenitors, the cells were then seeded at a density<br />
of 100,000 cells/ml in IMDM containing 1% methylcellulose (Fluka<br />
Biochemika), 15% plasma-derived serum (PDS; Animal Technologies),<br />
5% PFHM-II and specific cytokines as follows: primitive erythrocytes<br />
(erythropoietin (EPO, 2 U/ml)); macrophages (IL-3 (10ng/ml), M-CSF<br />
(5 ng/ml)); megakaryocytes (IL-3 (10 ng/ml), IL-11 (5 ng/ml), thrombopoietin<br />
(TPO, 5 ng/ml)); mixed colonies (SCF (5ng/ml), IL-3 (10 ng/<br />
ml), G-CSF (30 ng/ml), GM-CSF (10 ng/ml), IL-11 (5 ng/ml), IL-6 (5 ng/<br />
ml), TPO (5 ng/ml), and M-CSF (5 ng/ml)). All cytokines were purchased<br />
from R&D Systems. Primitive erythroctye colonies (eryPs) were counted<br />
on day 10 (4 d after embryoid body harvest). Macrophage colonies were<br />
counted on day 13 (7 d after embryoid body harvest). Mixed colonies<br />
were counted on day 14 (8 d after embryoid body harvest) and consist of<br />
a layer of macrophages, a layer of granulocytes, and a central core of red<br />
erythroid cells. Statistical analysis was performed using the Krward software.<br />
P values were calculated using the nonparametric Wilkinson test.<br />
HELP DNA methylation analysis. High molecular weight DNA<br />
was isolated from iPSCs using the PureGene kit from Qiagen and<br />
the HELP (HpaII tiny fragment enrichment by ligation-mediated<br />
PCR) assay was carried out as previously described 1,2 . Briefly, 1 µg<br />
of genomic DNA was digested overnight with either HpaII or MspI<br />
(New England Biolabs). On the following day, the reactions were<br />
nature biotechnology <br />
doi:10.1038/nbt.1667
© 2010 <strong>Nature</strong> America, Inc. All rights reserved.<br />
extracted once with phenol-chloroform and resuspended in 11 µl of<br />
10 mM Tris-HCl pH 8.0 and the digested DNA was used to set up an<br />
overnight ligation of the JHpaII adaptor using T4 DNA ligase. The<br />
adaptor-ligated DNA was used to carry out the PCR amplification<br />
of the HpaII- and MspI-digested DNA as previously described 48 .<br />
All samples for microarray hybridization were processed at the<br />
Roche-NimbleGen Service Laboratory. Samples were labeled using<br />
Cy-labeled random primers (9 mers) and then hybridized onto a<br />
mouse custom-designed oligonucleotide array (50-mers) covering<br />
25,720 HpaII amplifiable fragments (HAF) (>50,000 CpGs), annotated<br />
to 15,465 unique gene symbols (Roche NimbleGen, Design<br />
name: 2006-10-26_MM5_HELP_Promoter Design ID = 4803).<br />
HpaII-amplifiable fragments are defined as genomic sequences contained<br />
between two flanking HpaII sites found within 200–2,000 bp<br />
from each other and is represented on the array by 15 individual<br />
probes, randomly distributed across the microarray slide. HAF were<br />
first realigned to the MM9 July 2007 build of the mouse genome and<br />
then annotated to the nearest transcription start site (TSS), allowing<br />
for a maximum distance of 5 kb from the TSS. Scanning was<br />
performed using a GenePix 4000B scanner (Axon Instruments) as<br />
previously described 49 . Quality control and data analysis of HELP<br />
microarrays was performed as described 50 .<br />
Signal intensities at each HpaII-amplifiable fragment were calculated<br />
as a robust (25% trimmed) mean of their component probe-level signal<br />
intensities. Any fragments found within the level of background MspI<br />
signal intensity, measured as 2.5 mean-absolute-differences (MAD) above<br />
the median of random probe signals, were categorized as ‘failed’. These<br />
failed loci therefore represent the population of fragments that did not<br />
amplify by PCR, whatever the biological (e.g., genomic deletions and<br />
other sequence errors) or experimental cause. On the other hand, ‘methylated’<br />
loci were so designated when the level of HpaII signal intensity<br />
was similarly indistinguishable from background. PCR-amplifying fragments<br />
(those not flagged as either methylated or failed) were normalized<br />
using an intra-array quantile approach wherein HpaII/MspI ratios are<br />
aligned across density-dependent sliding windows of fragment size–sorted<br />
data. DNA methylation was therefore measured as the log 2 (HpaII/MspI)<br />
ratio, where HpaII reflects the hypomethylated fraction of the genome<br />
and MspI represents the whole genome reference. Analysis of normalized<br />
data revealed the presence of a bimodal distribution. For each sample,<br />
a cutoff was selected at the point that more clearly separated these two<br />
populations and the data were centered around this point. Each fragment<br />
was then categorized as either methylated, if the centered log HpaII/MspI<br />
ratio < 0, or hypomethylated if on the other hand the log ratio > 0.<br />
HELP data analysis. Statistical analysis was performed using R 2.9 and<br />
BioConductor 51 . Unsupervised hierarchical clustering of HELP data was<br />
performed using the subset of probe sets (n = 3745) with s.d. > 1 across<br />
all cases. We used 1– Pearson correlation distance, followed by a Lingoes<br />
transformation of the distance matrix to a Euclidean one and subsequent<br />
clustering using Ward’s method. Correspondence analysis was performed<br />
using the BioConductor package MADE4. The top 100 genes whose<br />
methylation status varied the most across the different groups were identified<br />
as those with the greatest s.d. across all samples.<br />
Quantitative DNA methylation analysis by MassARRAY EpiTyping.<br />
Validation of HELP findings was performed by matrix-assisted laser<br />
desorption ionization/time-of-flight (MALDI-TOF) mass spectrometry<br />
using EpiTyper by MassARRAY (Sequenom) on bisulfite-converted<br />
DNA following manufacturer’s instructions 52 but using the Fast Start<br />
High Fidelity Taq polymerase from Roche for the PCR amplification<br />
of the bisulfite-converted DNA. MassArray primers were designed to<br />
cover the promoter regions of the indicated genes. (Primer sequences<br />
available as Supplementary Table 5).<br />
Chromatin immunoprecipitation (ChIP). Cells were fixed in 1%<br />
formaldehyde for 10 min, quenched with glycine and washed three<br />
times with PBS. Cells were then resuspended in lysis buffer and<br />
sonicated 10 × 30 s in a Bioruptor (Diagenode) to shear the chromatin<br />
to an average length of 600 bp. Supernatants were precleared<br />
using protein-A agarose beads (Roche) and 10% input was collected.<br />
Immunoprecipitations were performed using polyclonal antibodies<br />
to H3K4trimethylated, H3K27trimethylated, H3 pan-acetylation and<br />
normal rabbit serum (Upstate). DNA-protein complexes were pulled<br />
down using protein-A agarose beads and washed. DNA was recovered<br />
by overnight incubation at 65 °C to reverse cross-links and purified<br />
using QIAquick PCR purification columns (Qiagen). Enrichment of<br />
the modified histones in different genes was detected by quantitative<br />
real-time PCR using the primers in the Supplementary Table 4.<br />
44. Conboy, I.M., Conboy, M.J., Smythe, G.M. & Rando, T.A. Notch-mediated restoration<br />
of regenerative potential to aged muscle. Science 302, 1575–1577 (2003).<br />
45. sherwood, R.I. et al. Isolation of adult mouse myogenic progenitors: functional heterogeneity<br />
of cells within and engrafting skeletal muscle. Cell 119, 543–554 (2004).<br />
46. cheshier, S.H., Morrison, S.J., Liao, X. & Weissman, I.L. In vivo proliferation and cell<br />
cycle kinetics of long-term self-renewing hematopoietic stem cells. Proc. Natl. Acad.<br />
Sci. USA 96, 3120–3125 (1999).<br />
47. Huang, D.W. et al. Systematic and integrative analysis of large gene lists using DAVID<br />
Bioinformatics Resources. Nat. Protoc. 4, 44–57 (2009).<br />
48. Figueroa, M.E., Melnick, A. & Greally, J.M. Genome-wide determination of DNA methylation<br />
by Hpa II tiny fragment enrichment by ligation-mediated PCR (HELP) for the<br />
study of acute leukemias. Methods Mol. Biol. 538, 395–407 (2009).<br />
49. selzer, R.R. et al. Analysis of chromosome breakpoints in neuroblastoma at sub-kilobase<br />
resolution using fine-tiling oligonucleotide array CGH. Genes Chromosom. Cancer<br />
44, 305–319 (2005).<br />
50. Thompson, R.F. et al. An analytical pipeline for genomic representations used for<br />
cytosine methylation studies. Bioinformatics 24, 1161–1167 (2008).<br />
51. Culhane, A.C., Thioulouse, J., Perriere, G. & Higgins, D.G. MADE4: an R package<br />
for multivariate analysis of gene expression data. Bioinformatics 21, 2789–2790<br />
(2005).<br />
52. Ehrich, M. et al. Quantitative high-throughput analysis of DNA methylation patterns<br />
by base-specific cleavage and mass spectrometry. Proc. Natl. Acad. Sci. USA 102,<br />
15785–15790 (2005).<br />
doi:10.1038/nbt.1667<br />
nature biotechnology
A rt i c l e s<br />
Rapid profiling of a microbial genome using mixtures<br />
of barcoded oligonucleotides<br />
Joseph R Warner 1 , Philippa J Reeder 1 , Anis Karimpour-Fard 2 , Lauren B A Woodruff 1 & Ryan T Gill 1<br />
© 2010 <strong>Nature</strong> America, Inc. All rights reserved.<br />
A fundamental goal in biotechnology and biology is the development of approaches to better understand the genetic basis of<br />
traits. Here we report a versatile method, trackable multiplex recombineering (TRMR), whereby thousands of specific genetic<br />
modifications are created and evaluated simultaneously. To demonstrate TRMR, in a single day we modified the expression of<br />
>95% of the genes in Escherichia coli by inserting synthetic DNA cassettes and molecular barcodes upstream of each gene.<br />
Barcode sequences and microarrays were then used to quantify population dynamics. Within a week we mapped thousands of<br />
genes that affect E. coli growth in various media (rich, minimal and cellulosic hydrolysate) and in the presence of several growth<br />
inhibitors (b-glucoside, d-fucose, valine and methylglyoxal). This approach can be applied to a broad range of traits to identify<br />
targets for future genome-engineering endeavors.<br />
Microbial genomes hold the potential for tremendous combinatorial<br />
diversity, comprising a sequence space of 4 4,600,000 . Researchers’ ability<br />
to search this diversity for genetic features that affect pertinent traits<br />
remains limited by the number of individuals that can be tested, which<br />
is a small fraction of all possibilities. Thus, there is a demand for strategies<br />
for first defining relevant genetic variation and then thoroughly<br />
searching that space. This issue has been studied in great depth at the<br />
level of individual genes 1,2 , where high-throughput protein engineering<br />
methods are available for introducing specific mutations and then<br />
mapping the effects of such mutations onto protein activity. Advances<br />
in genomics 3 , and more recently multiplex DNA synthesis 4–8 and<br />
homologous recombination (or recombineering) 9–11 , now enable the<br />
extension of such a strategy to the genome scale.<br />
Advances in genomics have resulted in several methods for highly<br />
parallel mapping of genes to traits, such as profiling of gene-knockout<br />
and plasmid-based libraries 12–20 . In some instances, microarray<br />
technology has been used to enable parallel tracking of genetically<br />
distinct individuals throughout growth in selective environments.<br />
One such tool, molecular barcoding 12,17 , involves the replacement<br />
of every gene in Saccharomyces cerevisiae with a specific DNA<br />
sequence that could be tracked via microarray. Although these tools<br />
are a powerful way to profile the effect of mutation, the difficulty<br />
of specifically creating new mutations limits these studies to one of<br />
two types of mutations that have previously been introduced (insertions<br />
or increases in copy number). These limitations have challenged<br />
efforts to apply these methods for dissecting phenotypes and reengineering<br />
phenotypes that rely upon the coordinated action of multiple<br />
genes and mutations.<br />
Research over the past decade has resulted in recombination-based<br />
methods (recombineering) that make it easier to specifically modify<br />
the E. coli genome using synthetic DNA (synDNA) 9–11,21–23 . Recently,<br />
a recombineering-based method, called MAGE, was reported 24 ,<br />
whereby the expression levels of 24 genes were optimized in parallel<br />
to improve lycopene production more than all previously reported<br />
efforts, in considerably less time. This demonstration was enabled by<br />
a priori knowledge of what genes to modify, which is not known in<br />
many genome-engineering efforts, such as engineering growth and<br />
tolerance. Here we describe TRMR, a complementary method for<br />
simultaneously mapping genetic modifications that affect a trait of<br />
interest. The method combines parallel DNA synthesis, recombineering<br />
and molecular barcode technology to enable rapid modification of<br />
all E. coli genes (Fig. 1 and Supplementary Fig. 1). We demonstrate<br />
this general approach through the construction of two comprehensive<br />
E. coli genomic libraries comprising 8,000 distinct mutations and<br />
gene-trait mapping of these cells in seven environments.<br />
Results<br />
Synthetic DNA cassettes for promoter replacement<br />
We designed a comprehensive library of synDNA cassettes that<br />
have predictable effects when inserted into the genome of E. coli.<br />
Although various genetic features could have been incorporated into<br />
the cassettes (such as point mutations or sequences affecting mRNA<br />
stability, translational efficiency and other processes), we chose to<br />
demonstrate TRMR using functional modifications that either generally<br />
increase the expression of a target gene, called ‘up’, or generally<br />
decrease the gene’s expression, called ‘down’. The up cassette contains<br />
a strong and repressible P LtetO-1 promoter 25 and ribosome binding<br />
site (RBS) 26 sequences, which in general will increase downstream<br />
gene transcription and translation (Fig. 2). The down cassette was<br />
designed to replace the native RBS with an inert sequence that will<br />
generally cause a decrease in translation initiation. Both cassette<br />
designs include a blasticidin-S resistance gene 27 , allowing for selection<br />
of recombinant alleles. Molecular barcodes 12 (also called ‘tags’)<br />
were incorporated to track the presence of each synDNA oligo and to<br />
1 Department of Chemical and Biological Engineering, University of Colorado, Boulder, Colorado, USA. 2 School of Medicine, University of Colorado at Health Science<br />
Center, Denver, Colorado, USA. Correspondence should be addressed to R.T.G. (rtg@colorado.edu).<br />
Received 4 February; accepted 8 June; published online 18 July 2010; doi:10.1038/nbt.1653<br />
856 VOLUME 28 NUMBER 8 AUGUST 2010 nature biotechnology
A rt i c l e s<br />
© 2010 <strong>Nature</strong> America, Inc. All rights reserved.<br />
track each allele (engineered cell) within the<br />
mixed population on a barcode microarray 28<br />
(Supplementary Notes).<br />
Because the length of the synDNA cassettes<br />
used here is beyond the current<br />
capabilities of commercially available oligo<br />
library synthesis, we developed a strategy<br />
for multiplex cassette construction that<br />
involves the ligation of sequences shared by<br />
all cassettes to a mixture of shorter oligos<br />
specific to each targeted gene. Construction<br />
of this library was complicated by the fact<br />
that each synDNA cassette must contain<br />
unique sequences in the flanking positions<br />
that are homologous to the chromosome<br />
where the cassette is to be inserted. This is<br />
traditionally accomplished by using PCR to<br />
amplify a DNA cassette with primers that<br />
contain the flanking homology regions 21,29 .<br />
Using such a method to construct thousands<br />
of alleles is resource- and timeintensive<br />
3,11,19 , thus limiting the number<br />
and type of allelic libraries that can be investigated.<br />
(iii) Multiplex recombineering<br />
(ii) Multiplex<br />
synthesis<br />
(i) Design<br />
Targeting Tracking<br />
Bacterial cells<br />
wild-type genome<br />
To address these issues, we developed a procedure to generate thousands<br />
of synDNAs containing multiple desirable sequence features<br />
(such as homology regions and expression modulators) that can be<br />
carried out in a complex mixture. Briefly, ‘targeting oligos’ were first<br />
synthesized on a microarray. Then, we ligated these to the cassette<br />
that modifies gene function, amplified the resulting product with<br />
rolling-circle amplification and then cleaved the long amplified DNA<br />
molecule into the synDNAs (Fig. 2a–c).<br />
Targeting oligos were designed for every protein-coding gene in the<br />
E. coli MG1655 genome (Supplementary Table 1 and Supplementary<br />
Notes). In all, 8,154 targeting oligos were designed to create two possible<br />
expression alleles for 4,077 genes. Targeting regions were chosen<br />
such that DNA cassettes would insert upstream of genes, replace the<br />
translation start codon and account for gene overlap. Once designed,<br />
the set of targeting oligos, each 189 nucleotides long, was purchased<br />
through limited access at a cost of roughly $1 per unique oligo<br />
(Oligonucleotide Library Synthesis, Agilent).<br />
To test cassette design and construction and to optimize the procedure<br />
for allele production, we attempted promoter replacement<br />
for the lacZ and galK genes. After optimizing design, we were able<br />
to efficiently generate these alleles using the procedures outlined in<br />
Figure 2. Alleles were isolated as colonies and all showed the expected<br />
change in regulation and expression of the lacZ gene (Fig. 2d,e) or<br />
the galK gene. Furthermore, in PCR confirmations and sequencing,<br />
30 of 30 alleles tested showed the correct site of insertion. By counting<br />
colonies we estimated that we were able to routinely generate at<br />
least 75 alleles per microliter of cells transformed and determined<br />
that yields increased linearly with transformation volumes from<br />
40 ml up to 400 ml tested. With increases in scale, it is conceivable that<br />
one could generate 10 5 –10 7 alleles in a single day, enough to profile<br />
several modifications of every E. coli gene.<br />
Efficient construction of genome-scale allele libraries<br />
Using a library of 8,154 targeting oligos, we attempted to construct<br />
4,077 up synDNA oligos and 4,077 down synDNA oligos<br />
in separate pools. Both oligo pools were constructed in 1 week<br />
and resulted in enough material for several rounds of multiplex<br />
recombineering. The synDNA oligos were then used in a day of<br />
Mixture of ≈ 8,000<br />
unique oligomers<br />
Functional<br />
Targeting<br />
(iv) Enrichment of improved cells<br />
Engineered<br />
genomes<br />
Frequency of designed<br />
mutation (F x = C x /C tot )<br />
geneC<br />
geneD<br />
geneE<br />
geneF<br />
microarray<br />
(v) Multiplex identification<br />
Frequency of designed<br />
mutation (F x = C x /C tot )<br />
geneC<br />
geneD<br />
geneE<br />
geneF<br />
microarray<br />
Improved<br />
genomes<br />
(vi) Genome mapping<br />
Fitness conferred by<br />
mutation (W′ = F x x,f /F x,i )<br />
Genome<br />
plot<br />
Figure 1 TRMR method. (i) Design DNA cassettes encoding the suite of mutations of interest.<br />
(ii) Synthesize those cassettes, along with associated molecular barcodes, in a single pool.<br />
(iii) Introduce cassettes into recombination-proficient E. coli 46 and produce thousands of variants,<br />
each with a distinct region of the chromosome that is engineered. (iv) Perform selections or screens<br />
on the mixture of variants to enrich for those possessing a desired trait. (v) Quantify changes in<br />
allele frequency using molecular barcode technology 47 . (vi) Use these frequency measurements<br />
to map specific genetic changes onto the trait of interest. C x , concentration of allele x; C tot ,<br />
total concentration; F x,f and F x,i , final and initial allele frequencies (see equations in Results).<br />
recombineering experiments, separately generating thousands of<br />
up and down recombinant colonies. Colonies were scraped from<br />
plates and frozen in aliquots for subsequent experiments.<br />
To confirm that desired mutant alleles were generated, we PCR<br />
amplified and sequenced barcode tags from 390 colonies. Sequencing<br />
of the cassette and neighboring chromosome DNA indicated that in<br />
34 of 34 distinct alleles, the cassettes had inserted into the correct<br />
location of the genome. Sequencing also provided an estimate of the<br />
number of alleles containing an error in DNA sequence. Outside<br />
of the barcode sequences, DNA errors were observed in only three<br />
of 34 alleles, two of which had errors in regions of the cassette that<br />
should not affect allele identification or function. The barcode tag<br />
sequences provide an estimate of DNA errors present in the initial<br />
oligo libraries because barcodes are not subject to the experimental<br />
bias (bias includes selection for correct sequences during PCR<br />
amplification and during homologous recombination) that would<br />
filter out incorrect sequences. High fidelity of the molecular barcode<br />
sequences is also required to accurately detect the presence of each<br />
allele in cell mixtures. Only 5% of the 390 sequenced tags showed<br />
an error, usually substitution or loss of a single nucleotide. The<br />
high percentage of correct alleles observed here is a first indication<br />
that complex oligonucleotide mixtures may be used to engineer and<br />
identify thousands of distinct genomic loci with high fidelity.<br />
To assess our ability to make complete and uniform libraries in<br />
multiplex, we used Affymetrix Geneflex TAG4 arrays 28 to measure<br />
the concentration of each barcode tag in the synDNA mixture (before<br />
recombineering) and in genomic DNA from cell mixtures (after<br />
recombineering). We observed microarray signals from hybridization<br />
of each of the 8,154 library tags, ten positive-control tags that<br />
we spiked into the samples to calculate tag concentrations (see<br />
Supplementary Fig. 2), and 1,642 negative-control tags used to provide<br />
a measure of background hybridization and noise. The barcode<br />
signals from the synDNA mixtures indicated that 8,016 of the oligos<br />
were present (detected above background). Therefore, we successfully<br />
generated nearly complete (98%) up and down oligo libraries.<br />
Microarray analysis of the cell mixtures indicated successful generation<br />
of at least 7,829 unique alleles (96% of designed alleles; Fig. 3a<br />
and Supplementary Table 2). We found that the concentration of<br />
each unique allele depended on the concentration of synDNA used<br />
nature biotechnology VOLUME 28 NUMBER 8 AUGUST 2010 857
A rt i c l e s<br />
a<br />
Target<br />
oligos<br />
Two mixtures of<br />
target oligos<br />
geneX up<br />
geneY up<br />
geneZ up<br />
Shared DNA<br />
geneX up<br />
Shared DNA<br />
Two mixtures of 4,077<br />
synDNA oligos<br />
X up X<br />
Y up Y<br />
Z up Z<br />
geneX down<br />
i geneY down<br />
ii iii iv<br />
geneZ down<br />
X down X<br />
Y down Y<br />
Z down Z<br />
b<br />
Target oligo (189 nucleotides)<br />
P1 H2 x Cut site H1 x P3 Tag x P2<br />
synDNA oligo (~ 800 base pairs)<br />
H1 P3 Tag P2 antibiotic R x<br />
x<br />
Up/Down H2 x<br />
c<br />
E. coli cell<br />
Chromosome<br />
geneX<br />
up<br />
up<br />
up<br />
geneY<br />
Recombineering enzymes<br />
4,077 genes<br />
targeted<br />
simultaneously<br />
geneZ<br />
© 2010 <strong>Nature</strong> America, Inc. All rights reserved.<br />
d<br />
Up<br />
Down<br />
(P LtetO-1 & RBS)<br />
(no RBS)<br />
Up allele (761 bp insertion)<br />
Chromosome Tag blasticidin R lacZ+ P LtetO-1 RBS<br />
Down allele (703 bp insertion)<br />
Chromosome Tag blasticidin R<br />
lacZ– No RBS<br />
Chromosome<br />
Chromosome<br />
Chromosome<br />
lacZ<br />
lacZ<br />
up<br />
geneX<br />
geneX<br />
geneX<br />
e<br />
up<br />
geneY<br />
lacZ up<br />
geneY<br />
geneY<br />
Glucose + X-gal<br />
Wild type<br />
geneZ<br />
up<br />
geneZ<br />
geneZ<br />
lacZ down<br />
IPTG + X-gal<br />
Figure 2 Multiplex strategy to rapidly generate cell mixtures with defined genetic modifications. (a) Construction of synDNA library. (i) ‘Target’ oligos<br />
that contain chromosome homology and barcodes are synthesized on a chip, cleaved from the chip, amplified by two rounds of PCR and modified<br />
with (ligation) sequences by uracil excision 48 . (ii) This pool of target oligos is ligated with oligos containing a selectable marker and promoter and<br />
RBS variants (Shared DNA), resulting in a pool of DNA circles. (iii) DNA circles are copied into a pool of linear concatemers by rolling-circle<br />
amplification 49 . (iv) Concatemers are cleaved at a repeating site linking the homology regions to provide a pool of synDNA ready for multiplex<br />
recombineering. (b) Schematic of target oligos and synDNA oligos for gene x. Red, unique regions; black, shared regions; P, PCR priming site;<br />
H, chromosome targeting region; Tag, barcode tag sequence; Up/Down, functional region. Sequence is shown for amplifying barcode tags and for<br />
functional regions (promoter sequence in italic, RBS in bold, start codon underlined). (c) Pool of synDNA oligos is inserted into electrocompetent E. coli<br />
cells. Recombineering enzymes catalyze the insertion of the synDNA oligos at thousands of unique loci in the genome. (d) Schematic of lacZ alleles<br />
used to test the method. Up allele is designed to increase gene transcription and translation. Down allele is designed to decrease translation. (e) LacZ<br />
up and down alleles yield the intended phenotypes. Up mutation of the lacZ gene causes cells to turn blue on the surface of agar containing glucose and<br />
X-gal. Down mutation of the lacZ gene causes cells to remain colorless on the surface of agar containing IPTG and X-gal.<br />
Wild type<br />
to construct that allele (Supplementary Fig. 3). After normalization<br />
of the concentration of each allele for differences in synDNA concentrations<br />
used in recombineering, the s.d. for generating each mutant<br />
was ± 65% of the average, distributed uniformly around the genome<br />
(Fig. 3b). We also observed a modest dependence of recombineering<br />
frequency on the hybridization free energy 30 of the homology regions<br />
(Supplementary Fig. 4).<br />
A small percentage of the alleles were not detected (4%), and in all<br />
these cases the preceding synDNA was either absent or found in low<br />
concentrations. In subsequent attempts to create allele libraries, most<br />
of these missing alleles were detected, suggesting that the alleles were<br />
initially not detected because of low concentrations of the synDNA<br />
oligos. These results indicate that the uniformity of cell mixtures in<br />
future multiplex recombineering experiments may easily be improved<br />
by supplementation with synDNA oligos that are initially present in<br />
low concentrations. Improvements in the uniformity of the initial<br />
mixture should enable the more efficient identification of cells with<br />
improved traits.<br />
Notably, a single researcher was able to create these two genomescale<br />
up and down allele libraries in a single day, demonstrating that<br />
multiplex recombineering is a rapid strategy for reprogramming<br />
thousands of genes.<br />
Genome-scale mapping of alleles to selectable traits<br />
To illustrate the potential of TRMR to rapidly generate and identify<br />
cells with new traits, we plated the cell mixtures on agar medium<br />
supplemented to create four different conditions (salicin, d-fucose,<br />
methylglyoxal and valine) in which wild-type E. coli typically do not<br />
grow. Colonies representing resistant mutants arose from our allele<br />
mixtures at frequencies >100-fold greater than from unmodified control<br />
cells that relied on spontaneous mutation to generate resistance<br />
(Supplementary Table 3). We characterized individual colonies (83<br />
total) by sequencing the barcode tags. Additionally, we used TAG4<br />
microarrays to characterize the populations obtained by scraping all<br />
colonies off of the surfaces of selection plates. Using microarray data,<br />
we ranked each allele in each condition according to fitness (fitness of<br />
858 VOLUME 28 NUMBER 8 AUGUST 2010 nature biotechnology
A rt i c l e s<br />
a<br />
Number of probes<br />
2,000<br />
1,500<br />
1,000<br />
500<br />
Number of probes<br />
1,200<br />
900<br />
600<br />
300<br />
0<br />
20 80 140 200 260<br />
Unassigned tag signals<br />
0<br />
0 1,200 2,400 3,600 4,800 6,000 7,200 8,400<br />
Allele tag signals<br />
Threshold<br />
Figure 3 Analysis of synDNA and cell library. (a) Histogram showing<br />
the distribution of barcode signals of the up and down allele libraries<br />
detected by the TAG4 microarray. The unassigned tag signals (shown<br />
in gray) provide a measure of the background signal for each probe on<br />
the microarray. Probes that are assigned to unique alleles are shown in<br />
green. The unassigned tag signals have a low signal distribution (inset),<br />
and the threshold is shown for signals that are significantly above the<br />
background signal. The threshold for detection was such that the rate<br />
of false positives would be less than 2.2%. (b) TAG4 microarray results<br />
showing the distribution of synDNA oligos and alleles plotted by genomic<br />
location on the circular E. coli genome. Blue, up library; red, down<br />
library; inner circles, the concentration of each unique synDNA oligo<br />
before recombineering; outer circles, efficiency of generating each allele,<br />
calculated by dividing allele concentration by synDNA concentration.<br />
© 2010 <strong>Nature</strong> America, Inc. All rights reserved.<br />
b<br />
Up library<br />
pop. 3,869<br />
allele x = W ′ x = F x,f / F x,i , which is the ratio of the final allele frequency<br />
(F x = concentration of x/total concentration) after growth to the initial<br />
allele frequency). The allele fitness determined by microarray agreed<br />
well with the results from picking and sequencing individual colonies<br />
(Fig. 4 and Supplementary Table 4).<br />
Constructing mutants with beneficial traits and identifying the<br />
genetic cause has traditionally been a slow and laborious process.<br />
Using TRMR, we were able to rapidly identify traits present in our<br />
cell mixtures that are consistent with previous<br />
studies and identify unexpected genetic<br />
modifications that could be used in future<br />
metabolic engineering. The allele(s) that<br />
conferred the highest frequency or fitness<br />
from these selections were reconstructed<br />
separately to confirm that improved growth is<br />
due to the insertion of the identified cassette.<br />
These alleles are summarized in Figure 4 and<br />
described in detail below.<br />
Salicin is a carbon source that E. coli normally<br />
cannot metabolize owing to repression<br />
of the enzymes BglF and BglB. We identified<br />
the hns down mutation, using both array<br />
Down library<br />
pop. 3,960<br />
a<br />
b<br />
Frozen cell<br />
mixture<br />
Salicin<br />
hns<br />
results and sequencing, as having the greatest effect on fitness in<br />
medium supplemented with salicin. Mutations in the hns (histonelike<br />
nucleoid structuring protein) regulator 31 are known to confer<br />
improved growth on salicin. Its identification here confirms that the<br />
TRMR method can effectively uncover gene-trait relationships.<br />
d-fucose is a nonmetabolizable analog of arabinose that inhibits the<br />
ability of E. coli to use arabinose as a carbon source by inhibiting induction<br />
of the l-arabinose operon. We identified the xylA up allele, which<br />
causes overexpression of xylA and xylB, as conferring the ability to grow<br />
in the presence of d-fucose. Notably, these results suggest that E. coli<br />
xylose isomerase (XylA) may have in vivo l-arabinose isomerase activity.<br />
This discovery is corroborated by the observation that overexpression<br />
of E. coli xylAB in Pseudomonas putida confers the ability to metabolize<br />
both xylose and l-arabinose 32 . Such a trait is of potential value for the<br />
efficient use of cellulosic biomass as a renewable feedstock.<br />
Methylglyoxal is an important intracellular metabolite because it<br />
can be used as an intermediate for production of commodity chemicals<br />
and because, when metabolism is disrupted, it can accumulate,<br />
Recovered<br />
cells<br />
Growth on selective agars<br />
Microarray analysis, allele sequencing & reconstruction, phenotype validation<br />
xyIA<br />
D-fucose<br />
Methylglyoxal<br />
sodC<br />
ilvN<br />
Valine<br />
Figure 4 Trait-conferring genotypes identified<br />
in four selective environments. (a) Up and down<br />
alleles were recovered from frozen cultures and<br />
spread on agar medium in conditions where<br />
wild-type cells would not grow (indicated as<br />
column headings). (b) Fitness (W′) calculated<br />
by microarray detection of barcode tags was<br />
plotted for each allele by genomic location.<br />
Blue, up allele; red, down allele. (c) Known<br />
or hypothesized mechanisms whereby the<br />
identified genomic modifications confer<br />
the ability to grow. High-fitness alleles were<br />
detected on microarrays, except for leuL down,<br />
which was identified by sequencing of barcode<br />
tags within colonies.<br />
c<br />
hns down<br />
Salicin<br />
BgIF<br />
H-NS<br />
BgIB<br />
H-NS<br />
Glycolysis<br />
D-xylose<br />
XylA<br />
XyIB<br />
xyIA up sodC down IeuL down ilvN down<br />
D-fucose<br />
L-arabinose<br />
D-fucose<br />
Pentose phosphate<br />
pathway<br />
Methylglyoxal<br />
Toxic<br />
oxygen radicals<br />
SodC<br />
Overexpression<br />
LeuABCD<br />
Valine<br />
2-KIV<br />
LeuABCD<br />
Leucine<br />
&<br />
isoleucine<br />
Pyruvate<br />
+<br />
2-ketobutyrate<br />
IIvB<br />
ilvN<br />
Valine<br />
IIvB<br />
Acetohydroxybutyrate<br />
Isoleucine<br />
nature biotechnology VOLUME 28 NUMBER 8 AUGUST 2010 859
A rt i c l e s<br />
© 2010 <strong>Nature</strong> America, Inc. All rights reserved.<br />
Figure 5 Alleles identified during pooled growth in<br />
media and cellulosic hydrolysate. (a) TRMR alleles<br />
were recovered from frozen cultures and allowed<br />
to grow in a rich medium, minimal medium or<br />
cellulosic hydrolysate. (b) Allele frequencies after<br />
growth in media plotted by genomic location. Inner<br />
circle, rich; outer circle, minimal; blue, up allele;<br />
red, down allele; black, control allele frequency × 10.<br />
(c) Allele fitness in minimal medium plotted<br />
against fitness of the same allele in rich medium.<br />
Shapes describe the affected gene function as<br />
determined by clusters of orthologous groups:<br />
◊, information storage and processing; , cellular<br />
processes; , metabolism; ×, poorly characterized;<br />
blue, up allele; red, down allele; black, control<br />
allele. Fitness trend was fit to a line shown in<br />
black (R 2 = 0.748). (d) The fitness of down<br />
alleles compared with the corresponding up<br />
alleles. Brown , rich medium; green , minimal<br />
medium. For alleles that cluster toward either<br />
the x or the y axis, the up allele and the down<br />
allele report opposite effects. Inset shows fitness<br />
benefits (W′ > 1) of top 40 alleles for growth in<br />
minimal medium, and the fitness effects (usually<br />
detrimental, W′ < 1) of the orthogonal alleles.<br />
(e) Fitness (lnW′) plotted by genomic location of<br />
alleles isolated after growth in hydrolysate. Inner<br />
circle, 15–17% hydrolysate; outer circle, 18–20%<br />
hydrolysate; blue, up allele; red, down allele.<br />
Some alleles conferring high fitness are labeled.<br />
(f) Growth curves of isolated variants in cellulosic<br />
hydrolysate. Each growth curve is the average of<br />
three replicates. Curves are fit with a Gompertz<br />
function 50 (black). Alleles are denoted with roman<br />
numerals, as follows: (i) puuE down (pale blue),<br />
(ii) yciV down (purple), (iii) ygaZ up (green), (iv) lpp<br />
down (pink), (v) ugpE down (blue), (vi) ptsI down<br />
(pale green), (vii) wild-type MG1655 (red),<br />
(viii) ahpC up (blue). Error bars are minimal and are<br />
not shown for clarity. A 600 , absorbance at 600 nm.<br />
(g) Percent change in biomass productivity and<br />
maximum growth rate for isolated variants grown<br />
in hydrolysate relative to E. coli MG1655 grown<br />
in hydrolysate. Biomass productivity (gray bars) is<br />
the area under each growth curve. Growth rate (red<br />
bars) is the maximum growth rate as calculated<br />
from the Gompertz function. Values are the average<br />
of three replicates; error bars denote s.d.<br />
a<br />
b<br />
c<br />
Minimal medium allele fitness (W′)<br />
d<br />
Down allele fitness (W′)<br />
3.0<br />
2.5<br />
2.0<br />
1.5<br />
1.0<br />
0.5<br />
3.0<br />
2.5<br />
2.0<br />
1.5<br />
1.0<br />
0.5<br />
Growth in<br />
minimal nutrients<br />
Growth in<br />
rich nutrients<br />
0<br />
0 0.5 1.0 1.5 2.0<br />
Rich medium allele fitness (W′)<br />
Fitness<br />
Gain<br />
Loss<br />
0<br />
0 0.5 1.0 1.5 2.0 2.5 3.0<br />
Up allele fitness (W′)<br />
3<br />
2<br />
1<br />
0<br />
Freezer<br />
stock<br />
e<br />
f<br />
Number of cells (A 600 )<br />
g<br />
% change in biomass productivity<br />
and growth rate relative to wild-type<br />
1.5<br />
1.0<br />
0.5<br />
cyaA<br />
ygjQ<br />
ahpC<br />
up<br />
cyaA<br />
ilvM<br />
Growth in 15–17%<br />
cellulosic hydrolysate<br />
Growth in 18–20%<br />
cellulosic hydrolysate<br />
eutL<br />
ptsI<br />
eutL<br />
moeA<br />
ybaB<br />
ydjG<br />
0<br />
0 2 4 6 8 10<br />
3.5<br />
3.0<br />
2.5<br />
2.0<br />
1.5<br />
1.0<br />
0.5<br />
0<br />
0 2 4 6 8 10<br />
Time (h)<br />
248 ± 18%<br />
233 ± 22%<br />
80<br />
60<br />
40<br />
20<br />
0<br />
–20<br />
puuE ptsI lpp yciV<br />
down down down down<br />
ygaZ<br />
up<br />
ahpC<br />
IsrA<br />
yciV<br />
vi<br />
12 14<br />
12 14<br />
ugpE<br />
down<br />
i<br />
ii<br />
iii<br />
iv & v<br />
vii<br />
viii<br />
vii<br />
resulting in oxidative damage and eventual cell death 33 . We used<br />
TRMR to discover a previously unknown phenotype: decreased<br />
expression of sodC, which produces a superoxide-mediating enzyme 34 ,<br />
confers resistance to exogenous methylglyoxal, possibly by affecting<br />
superoxide concentrations in the periplasm.<br />
Excess valine causes feedback inhibition of leucine and isoleucine<br />
biosynthesis, leading to inhibition of cell growth as these amino<br />
acids become scarce. Microarray results identified ilvN down as the<br />
allele conferring the best growth, and this genomic region has been<br />
indicated in several previous studies 35,36 . Unexpectedly, sequencing<br />
showed that the leuL down allele also could grow well on valine plates.<br />
The leuL down mutation would cause increased expression of the<br />
leucine biosynthesis operon leuABCD by circumventing the alleged<br />
transcription attenuation caused by leuL 37 . Mutations of this operon<br />
have not previously been associated with valine resistance. However, a<br />
recent attempt to increase production of noncanonical amino acids in<br />
engineered E. coli cells demonstrated that overexpression of leuABCD<br />
shifts metabolite pools from valine toward isoleucine and leucine 38 .<br />
Genome-scale quantitative growth phenotypes<br />
To further demonstrate that TRMR performs well at the genome scale,<br />
we combined the up and down allele libraries and measured fitness in<br />
liquid cultures that contained rich or minimal nutrients (Fig. 5a). The<br />
liquid cultures were allowed to grow for an average of eight generations,<br />
before and after which aliquots of cells were plated for analysis of<br />
individuals or frozen for microarray analysis. Additionally, an aliquot<br />
of control cells (barcoded and kanamycin resistant; Supplementary<br />
Notes) was spiked into the culture at the start of selections. A known<br />
concentration of these control cells was used to assess the ability of<br />
barcode technology to measure allele concentrations during pooled<br />
growth. The control cells also serve as a wild-type standard with which<br />
the fitness of alleles can be compared.<br />
Using barcode microarrays, we simultaneously tracked all of<br />
the alleles, which were reduced to approximately 2,500 alleles after<br />
growth selections (Fig. 5b). The numbers of control cells in the<br />
populations determined by microarray was not substantially different<br />
from estimates of control-cell numbers obtained from counting<br />
860 VOLUME 28 NUMBER 8 AUGUST 2010 nature biotechnology
A rt i c l e s<br />
© 2010 <strong>Nature</strong> America, Inc. All rights reserved.<br />
kanamycin-resistant colonies. Microarrays revealed that the majority<br />
of alleles had similar growth phenotypes in both rich and minimal<br />
media (Fig. 5c, x-y diagonal). Noteworthy alleles that do not fit this<br />
trend are those that allow growth in the rich medium but are no<br />
longer observed in the minimal medium (Fig. 5c, alleles along x axis).<br />
Consistent with previous observations 19 , many of these alleles consist<br />
of changes in the expression of genes involved in metabolism. Also<br />
of interest are those alleles that confer faster growth than that of the<br />
control cells in the minimal medium (a list of fitness values can be<br />
found in Supplementary Table 5).<br />
These experiments also offer the first genome-wide glimpse of<br />
generally orthogonal expression alleles grown competitively in the<br />
same culture. We anticipated that if a particular up allele shows a<br />
fitness benefit, then the down allele is likely to show a negative effect<br />
on fitness, possibly being lost from the culture, and vice versa. This<br />
is often the case (see Fig. 5d, allele clustering toward the axes), providing<br />
further evidence that our synthetic cassettes are generally<br />
causing the intended effects at genome-wide loci. Exceptions such as<br />
improved growth resulting from both up and down expression alleles<br />
in the same environment may be due to secondary effects (such as<br />
increased transcription of multiple downstream genes) and require<br />
further investigation.<br />
Mapping tolerance to lignocellulosic hydrolysate<br />
We next applied TRMR to identify genes that improve tolerance to<br />
lignocellulosic hydrolysate derived from corn stover (provided by the<br />
US National Renewable Energy Laboratory). This class of feedstocks<br />
contains a variable array of growth inhibitors (known inhibitors<br />
include organic acids, aldehydes and phenolic-based compounds) 39,40 .<br />
To take hydrolysate variability into account, we measured growth of<br />
variants bearing our alleles in several mixtures of hydrolysate and<br />
minimal medium.<br />
Microarray analysis of the alleles indicated that only a small<br />
subset of the population remained after each selection (Fig. 5e;<br />
see Supplementary Table 6 for fitness values and gene ontology<br />
analysis). Many of the modifications that improved growth in lower<br />
concentrations of corn stover hydrolysate affected genes known to be<br />
involved in primary metabolism (pgi up, eno up and tdcG up), RNA<br />
metabolism (rlmG down, rimM up, rsmE down and rrmA down) and<br />
transport of sugars (ptsI down, ptsI up and directly downstream crr).<br />
Growth in higher concentrations of hydrolysate selected alleles related<br />
to secondary metabolism (ispF up and dxs up), vitamin metabolic<br />
processes (nadD up, menD up, apbE up, pabC up, dxs up and ribB<br />
up) and antioxidant activity (ahpC up, tpx up and bcp up). The down<br />
mutation of the adenylate cyclase gene (cyaA) conferred a growth<br />
advantage in every selection.<br />
To confirm that the mutations conferred fitness advantages, we<br />
isolated seven alleles after the selections and characterized growth<br />
in hydrolysate relative to unmutated E. coli. (Fig. 5f,g). All seven<br />
alleles (ahpC up, ugpE down, puuE down, ptsI down, ygaZ up, yciV<br />
down and lpp down) yielded improvement in either growth rate or<br />
biomass productivity relative to the wild-type strain. Notably, the<br />
up allele of ahpC resulted in a large improvement. The ahpC gene<br />
and its downstream counterpart ahpF have not previously been<br />
identified as important for growth in hydrolysate. However, they<br />
have been implicated in resistance to organic solvents 41 and various<br />
oxidants 42,43 , possibly indicating that during growth in cellulosic<br />
hydrolysate, reactive oxygen species in the form of peroxides and<br />
other oxidants are present or forming as a result of imbalances in<br />
metabolism 44 . In addition to identifying several important targets for<br />
future genome-engineering endeavors, many of which would have<br />
been difficult to predict a priori, these profiling studies shed light on<br />
general mechanisms of hydrolysate toxicity (such as the presence of<br />
oxidants) and growth advantage in hydrolysate (such as metabolism<br />
of preferred carbon sources).<br />
Discussion<br />
We have described a new method for the genome-scale mapping<br />
of genes to traits and have shown that this method can increase<br />
the throughput of genetic studies by several orders of magnitude.<br />
Although some of the trait-conferring modifications we identified<br />
correspond to previously identified genomic regions, the majority<br />
would have been difficult to predict. Such unanticipated outcomes<br />
provide insight into many uncharacterized genes and, in some cases,<br />
into known genes with uncharacterized functions. We have already<br />
begun applying this method toward understanding a range of traits of<br />
importance in biotechnology, including improved growth in industrially<br />
relevant conditions and enhanced product formation.<br />
We have designed TRMR to be easy to use and versatile. The<br />
molecular cloning procedures were accomplished within a week by<br />
a single researcher, with two additional days providing enough cells<br />
for 60 genome-wide selection and screening studies. Notably, data<br />
acquisition and analysis from TRMR is similar to genomics methods<br />
currently used by the yeast community and is amenable to a range<br />
of freely and commercially available software packages. The primary<br />
challenge to the broad dissemination of this method is the acquisition<br />
of oligonucleotide libraries, which will be overcome as DNA synthesis<br />
technologies continue to improve.<br />
We envision that a broad range of additional studies could be performed<br />
using the basic TRMR platform described here by changing<br />
the targeting, functional or tracking design. For example, although the<br />
functional regions we used were promoters and translation sites, one<br />
might conceivably use sites associated with additional functions such<br />
as switches, oscillators or sensors 45 . Moreover, the TRMR approach<br />
is not limited to engineering or examining the E. coli genome. The<br />
design could be adapted for rapidly engineering yeast and a range<br />
of Gram-negative bacteria 23 , provided the host has sufficient transformation<br />
and recombination capabilities. Additionally, TRMR may<br />
be carried out recursively, allowing for the accumulation of multiple<br />
beneficial mutations within a genome. Researchers could produce<br />
second- and third-generation recombinant cells by removing the antibiotic<br />
cassette between rounds of recombineering to allow isolation<br />
of cells containing an additional mutation, by using different antibiotic<br />
cassettes in the modular construction of the synDNA oligos so<br />
that different antibiotics could be used to isolate recombinants after<br />
each round of TRMR, or by eliminating altogether the need to isolate<br />
recombinants by relying on the increased efficiency of recombineering<br />
strategies such as those used in MAGE 24 . Integration of TRMR<br />
into directed-evolution programs would provide genome-scale construction<br />
and tracking of combinations of mutations, which would<br />
improve both the understanding and engineering of complex traits.<br />
Methods<br />
Methods and any associated references are available in the online<br />
version of the paper at http://www.nature.com/naturebiotechnology/.<br />
Note: Supplementary information is available on the <strong>Nature</strong> Biotechnology website.<br />
Acknowledgments<br />
We thank D. Court (Center for Cancer Research, National Cancer Institute at<br />
Frederick, Maryland) for sharing plasmid pSIM5, C. Nislow and G. Giaever<br />
(University of Toronto, Ontario) for help with microarray analysis, A. Mohagheghi<br />
and M. Zhang (US National Renewable Energy Laboratories) for hydrolysate<br />
samples, M. O’Donnell for help in preparation of selective agar plates, Agilent for<br />
nature biotechnology VOLUME 28 NUMBER 8 AUGUST 2010 861
A rt i c l e s<br />
© 2010 <strong>Nature</strong> America, Inc. All rights reserved.<br />
access to the Oligonucleotide Library Synthesis product, and H. Marshall and the<br />
University of Colorado Microarray Facility for molecular barcode genotyping.<br />
The authors appreciate financial support provided by Shell, the Colorado Center<br />
for Biorefining and Biofuels (http://www.C2B2web.org) and the Colorado Energy<br />
Initiative (http://rasei.colorado.edu).<br />
Author Contributions<br />
J.R.W. and R.T.G. conceived the study; J.R.W. designed and performed all<br />
experiments except for growth selections and allele confirmations in hydrolysate,<br />
which were conducted by P.J.R.; A.K.-F. aided J.R.W. in selection of targeting<br />
sequences and selection of barcode tags; A.K.-F. and P.J.R. assigned gene ontology<br />
terms; L.B.A.W. aided J.R.W. in selection design and microarray analysis; L.B.A.W.<br />
constructed circle plots; P.J.R., A.K.-F. and L.B.A.W. helped in manuscript<br />
preparation; J.R.W. and R.T.G. wrote the manuscript; R.T.G. supervised all aspects<br />
of the study.<br />
COMPETING FINANCIAL INTERESTS<br />
The authors declare no competing financial interests.<br />
Published online at http://www.nature.com/naturebiotechnology/.<br />
Reprints and permissions information is available online at http://npg.nature.com/<br />
reprintsandpermissions/.<br />
1. Fox, R.J. et al. Improving catalytic function by ProSAR-driven enzyme evolution.<br />
Nat. Biotechnol. 25, 338–344 (2007).<br />
2. Turner, N.J. Directed evolution drives the next generation of biocatalysts. Nat. Chem.<br />
Biol. 5, 567–573 (2009).<br />
3. Winzeler, E.A. et al. Functional characterization of the S. cervisiase genome by<br />
gene geletion and parallel analysis. Science 285, 901–906 (1999).<br />
4. Fodor, S. et al. Light-directed, spatially addressable parallel chemical synthesis.<br />
Science 251, 767–773 (1991).<br />
5. Blanchard, A.P., Kaiser, R.J. & Hood, L.E. High-density oligonucleotide arrays.<br />
Biosens. Bioelectron. 11, 687–690 (1996).<br />
6. Singh-Gasson, S. et al. Maskless fabrication of light-directed oligonucleotide microarrays<br />
using a digital micromirror array. Nat. Biotechnol. 17, 974–978 (1999).<br />
7. Cleary, M.A. et al. Production of complex nucleic acid libraries using highly parallel<br />
in situ oligonucleotide synthesis. Nat. Methods 1, 241–248 (2004).<br />
8. Ghindilis, A. et al. CombiMatrix oligonucleotide arrays: genotyping and gene<br />
expression assays employing electrochemical detection. Biosens. Bioelectron. 22,<br />
1853–1860 (2007).<br />
9. Yu, D. et al. An efficient recombination system for chromosome engineering in<br />
Escherichia coli. Proc. Natl. Acad. Sci. USA 97, 5978–5983 (2000).<br />
10. Murphy, K. Use of bacteriophage lambda recombination functions to promote gene<br />
replacement in Escherichia coli. J. Bacteriol. 180, 2063–2071 (1998).<br />
11. Zhang, Y., Buchholz, F., Muyrers, J. & Stewart, A.F. A new logic for DNA engineering<br />
using recombination in Escherichia coli. Nat. Genet. 20, 123–128 (1998).<br />
12. Shoemaker, D.D., Lashkari, D.A., Morris, D., Mittmann, M. & Davis, R.W. Quantitative<br />
phenotypic analysis of yeast deletion mutants using a highly parallel molecular<br />
bar-coding strategy. Nat. Genet. 14, 450–456 (1996).<br />
13. Cho, R.J. et al. Parallel analysis of genetic selections using whole genome<br />
oligonucleotide arrays. Proc. Natl. Acad. Sci. USA 95, 3752–3757 (1998).<br />
14. Gill, R.T. et al. Genome wide screening for trait conferring genes using DNA microarrays.<br />
Proc. Natl. Acad. Sci. USA 99, 7033–7038 (2002).<br />
15. Lynch, M.D., Warnecke, T. & Gill, R.T. SCALEs: multiscale analysis of library<br />
enrichment. Nat. Methods 4, 87–93 (2007).<br />
16. Badarinarayana, V. et al. Selection analyses of insertional mutants using subgenic<br />
resolution arrays. Nat. Biotechnol. 19, 1060–1065 (2001).<br />
17. Giaever, G. et al. Functional profiling of the Saccharomyces cerevisiae genome.<br />
<strong>Nature</strong> 418, 387–391 (2002).<br />
18. Ho, C.H. et al. A molecular barcoded yeast ORF library enables mode-of-action<br />
analysis of bioactive compounds. Nat. Biotechnol. 27, 369–377 (2009).<br />
19. Baba, T. et al. Construction of Escherichia coli K-12 in-frame, single-gene knockout<br />
mutants: the Keio collection. Mol. Syst. Biol. 2, 1–11 (2006).<br />
20. Kitagawa, M. et al. Complete set of ORF clones of Escherichia coli ASKA library<br />
(a complete set of E. coli K-12 ORF archive): unique resources for biological<br />
research. DNA Res. 12, 291–299 (2006).<br />
21. Datsenko, K. & Wanner, B. One-step inactivation of chromosomal genes in<br />
E. coli K12 using PCR products. Proc. Natl. Acad. Sci. USA 97, 6640–6645<br />
(2000).<br />
22. Ellis, H.M., Yu, D., DiTizio, T. & Court, D.L. High efficiency mutagenesis, repair,<br />
and engineering of chromosomal DNA using single-stranded oligonucleotides.<br />
Proc. Natl. Acad. Sci. USA 98, 6742–6746 (2001).<br />
23. Datta, S., Costantino, N., Zhou, X. & Court, D.L. Identification and analysis of<br />
recombineering functions from Gram-negative and Gram-positive bacteria and their<br />
phages. Proc. Natl. Acad. Sci. USA 105, 1626–1631 (2008).<br />
24. Wang, H. et al. Programming cells by multiplex genome engineering and accelerate<br />
evolution. <strong>Nature</strong> 460, 894–898 (2009).<br />
25. Lutz, R. & Bujard, H. Independent and tight regulation of transcriptional units in<br />
Escherichis coli via the LacR/O, the TetR/O and AraC/I1–I2 regulatory elements.<br />
Nucleic Acids Res. 25, 1203–1210 (1997).<br />
26. Shine, J. & Dalgarno, L. The 3′-terminal sequence of Escherichia coli 16S ribosomal<br />
RNA: complementarity to nonsense triplets and ribosome binding sites. Proc. Natl.<br />
Acad. Sci. USA 71, 1342–1346 (1974).<br />
27. Kimura, M., Takatsuki, A., Yamaguchi, I. & Blasticidin, S. Deaminase gene from<br />
Aspergillus terreus (BSD): a new drug resistance gene for transfection of mammalian<br />
cells. Biochim. Biophys. Acta 1219, 653–659 (1994).<br />
28. Pierce, S.E. et al. A unique and universal molecular barcode array. Nat. Methods<br />
3, 601–603 (2006).<br />
29. Baudin, A., Ozier-Kalogeropoulos, O., Denouel, A., Lacroute, F. & Culin, C. A simple<br />
and efficient method for direct gene deletion in Saccharomyces cerevisiae.<br />
Nucleic Acids Res. 21, 3329–3330 (1993).<br />
30. Markham, N.R. & Zuker, M. DINAMelt web server for nucleic acid melting prediction.<br />
Nucleic Acids Res. 33, W577–W581 (2005).<br />
31. Defez, R. & de Felice, M. Cryptic operon for beta-glucoside metabolism in<br />
Escherichia coli K12: genetic evidence for a regulatory protein. Genetics 97, 11–25<br />
(1981).<br />
32. Meijnen, J.P., de Winde, J.H. & Ruijssenaars, H.J. Engineering Pseudomonas putida<br />
S12 for efficient utilization of d-xylose and l-arabinose. Appl. Environ. Microbiol.<br />
74, 5031–5037 (2008).<br />
33. Zhu, M.M., Skraly, F.A. & Cameron, D.C. Accumulation of methylglyoxal in<br />
anaerobically grown Escherichia coli and its detoxification by expression of the<br />
Pseudomonas putida glyoxalase i gene. Metab. Eng. 3, 218–225 (2001).<br />
34. Gort, A.S., Ferber, D.M. & Imlay, J.A. The regulation and role of the periplasmic copper,<br />
zinc superoxide dismutase of Escherichia coli. Mol. Microbiol. 32, 179–191 (1999).<br />
35. Sutton, A., Newman, T., Francis, M. & Freundlich, M. Valine-resistant Escherichia<br />
coli K-12 strains with mutations in the ilvB operon. J. Bacteriol. 148, 998–1001<br />
(1981).<br />
36. Weinstock, O., Sella, C., Chipman, D.M. & Barak, Z. Properties of subcloned<br />
subunits of bacterial acetohydroxy acid synthases. J. Bacteriol. 174, 5560–5566<br />
(1992).<br />
37. Wessler, S.R. & Calvo, J.M. Control of leu operon expression in Escherichia coli by<br />
a transcription attenuation mechanism. J. Mol. Biol. 149, 579–597 (1981).<br />
38. Sycheva, E.V. et al. Overproduction of noncanonical amino acids by Escherichia<br />
coli cells. Microbiology 76, 712–718 (2007).<br />
39. Chen, S.F., Mowery, R.A., Castleberry, V.A., van Walsum, G.P. & Chambliss, C.K.<br />
High-performance liquid chromatography method for simultaneous determination<br />
of aliphatic acid, aromatic acid and neutral degradation products in biomass<br />
pretreatment hydrolysates. J. Chromatogr. A 1104, 54–61 (2006).<br />
40. Mohagheghi, A. & Schell, D.J. Impact of recycling stillage on conversion of dilute sulfuric<br />
acid pretreated corn stover to ethanol. Biotechnol. Bioeng. 105, 992–996 (2010).<br />
41. Ferrante, A.A., Augliera, J., Lewis, K. & Klibanov, A.M. Cloning of an organic<br />
solvent-resistance gene in Escherichia coli: the unexpected role of alkylhydroperoxide<br />
reductase. Proc. Natl. Acad. Sci. USA 92, 7617–7621 (1995).<br />
42. Poole, L.B. Bacterial defenses against oxidants: mechanistic features of cysteinebased<br />
peroxidases and their flavoprotein reductases. Arch. Biochem. Biophys. 433,<br />
240–254 (2005).<br />
43. Seaver, L.C. & Imlay, J.A. Alkyl hydroperoxide reductase is the primary scavenger<br />
of endogenous hydrogen peroxide in Escherichia coli. J. Bacteriol. 183, 7173–7181<br />
(2001).<br />
44. Kohanski, M.A., Dwyer, D.J., Hayete, B., Lawrence, C.A. & Collins, J.J. A common<br />
mechanism of cellular death induced by bactericidal antibiotics. Cell 130, 797–810<br />
(2007).<br />
45. Lu, T.K., Khalil, A.S. & Collins, J.J. Next-generation synthetic gene networks.<br />
Nat. Biotechnol. 27, 1139–1150 (2009).<br />
46. Datta, S., Constantino, N. & Court, D.L. A set of recombineering plasmids for<br />
gram-negative bacteria. Gene 379, 109–115 (2006).<br />
47. Pierce, S.E., Davis, R.W., Nislow, C. & Giaever, G. Genome-wide analysis of barcoded<br />
Saccharomyces cerevisiae gene-deletion mutants in pooled cultures. Nat. Protoc.<br />
2, 2958–2974 (2007).<br />
48. Nour-Eldin, H.H., Hansen, B.G., Norholm, M.H.H., Jensen, J.K. & Halkier, B.A.<br />
Advancing uracil-excision based cloning towards an ideal technique for cloning PCR<br />
fragments. Nucleic Acids Res. 34, e122 (2006).<br />
49. Dean, F.B., Nelson, J.R., Giesler, T.L. & Lasken, R.S. Rapid amplification of plasmid<br />
and phage DNA using Phi29 DNA polymerase and multiply-primed rolling circle<br />
amplification. Genome Res. 11, 1095–1099 (2001).<br />
50. Perni, S., Andrew, P.W. & Shama, G. Estimating the maximum growth rate from microbial<br />
growth curves: definition is everything. Food Microbiol. 22, 491–495 (2005).<br />
862 VOLUME 28 NUMBER 8 AUGUST 2010 nature biotechnology
© 2010 <strong>Nature</strong> America, Inc. All rights reserved.<br />
ONLINE METHODS<br />
Strains, DNA and reagents. Escherichia coli MG1655 (wild type) was obtained<br />
from ATCC 700926. Genomic sequences were obtained from GenBank<br />
U00096.2, and gene annotation was from the Ecogene database version 2.20<br />
(http://www.ecogene.org/). Pseudogenes and insertion elements were excluded<br />
from the protein-coding genes that were targeted. The kanamycin-resistant<br />
control strain (also called JWKAN) was constructed from E. coli ATCC 700926,<br />
with nucleotide 3,909,796 replaced with a barcoded kanamycin cassette 21<br />
(Supplementary Notes). Up and down DNA cassettes were constructed using<br />
PCR and cloned into the pEM7/BSD plasmid (Invitrogen, Supplementary<br />
Notes). Oligonucleotide libraries were purchased from Agilent; all other oligonucleotides<br />
were purchased from Integrated DNA Technologies with standard<br />
desalting except where noted. The pSIM5 plasmid 46 was a gift from D. Court.<br />
All reagents were obtained from common commercial sources. All enzymes<br />
were from New England Biolabs except where noted. All sequencing was performed<br />
by Macrogen USA or Eurofins MGW Operon. Recipes and additional<br />
information can be found in Supplementary Notes.<br />
Preparation of synthetic DNA and recombineering. A portion of the oligonucleotide<br />
library provided by Agilent (8,154 unique 189-mers) was amplified<br />
by two rounds of PCR. Products were treated with the USER enzymes (New<br />
England Biolabs), purified and ligated to the up cassette. Rolling-circle amplification,<br />
nuclease treatment and purification resulted in 8–10 μg synDNA. This<br />
procedure was also carried out in parallel to separately generate TRMR down<br />
synDNA. More details are available in Supplementary Notes.<br />
E. coli cells containing the recombineering plasmid pSIM5 were grown<br />
in 800 ml SOB cultures at 30 °C and made recombineering proficient with<br />
minor modifications to reported methods 46 . Briefly, when cells reached an<br />
optical density at 600 nm of 0.7, flasks were transferred to water baths at 42 °C<br />
to induce the λRed enzymes for 15 min. Flasks were then transferred to an<br />
ice-water bath and cells were kept close to 4 °C for the remaining steps. Cells<br />
were collected by centrifugation and suspended with cold deionized water. Cell<br />
collection and washing was repeated once more, then cells were suspended to a<br />
final volume of 6.4 ml in water. Aliquots of cells (400 μl) were transformed in<br />
a 0.2-cm electrocuvette with approximately 1 μg of up or down synDNA and a<br />
pulse of 12.5 kV cm −1 . Transformation was carried out eight times to generate<br />
the up allele library and eight times to generate the down allele library. The<br />
cells from each transformation were recovered in 12 ml SOC medium for 1 h<br />
at 37 °C. Cells were collected by centrifugation and resuspended in 30 ml MA<br />
salts (Supplementary Notes). Centrifugation and resuspension was repeated<br />
twice more, with the final resuspension to a volume of 2 ml in MA salts. The<br />
up and down allele libraries were separately spread onto a total of 40 low-salt<br />
LB agar plates containing blasticidin-S (90 μg ml −1 ) and allowed to grow at<br />
37 °C for 22 h. Colonies were scraped from the agar plates and up and down<br />
allele libraries were each suspended in a total of 35 ml LB. Cells were collected<br />
by centrifugation and suspended to 3 × 10 9 cells per milliliter in LB medium<br />
containing 16% (vol/vol) glycerol and blasticidin-S (90 μg ml −1 ). Aliquots of<br />
the up or down cell mixtures were stored at −80 °C.<br />
Screens and selections. Freezer stocks were used to inoculate 50 ml low-salt<br />
LB medium containing 80 μg ml −1 blasticidin-S with 5 × 10 8 TRMR up cells<br />
and 5 × 10 8 TRMR down cells. This culture was allowed to grow with shaking<br />
at 37 °C to an optical density at 600 nm of 0.8. The cells were centrifuged<br />
at 4,500g for 6 min, decanted and suspended in 30 ml of MA salts. The cells<br />
were collected once more by centrifugation and suspended in MA salts to a<br />
concentration of 5 × 10 8 cells per milliliter. The JWKAN cells were added to a<br />
final concentration of 7.7 × 10 4 cells per milliliter. A 1.7 ml aliquot of the cell<br />
library (called the recovery culture) was frozen for microarray analysis, and<br />
the remainder was used for various growth selections.<br />
Liquid selections were carried out with shaking at 37 °C in 600 ml of MOPS<br />
minimal medium containing 2 mM phosphate and 4% (wt/vol) glucose or in<br />
600 ml LB medium. Each medium was inoculated with 2.4 × 10 8 cells from a<br />
recovery culture and allowed to grow to an optical density at 600 nm of 1.0–1.2.<br />
Cells were collected from each culture by centrifugation of 10-ml aliquots<br />
at 4,500g for 6 min, decanted and stored at −80 °C for microarray analysis.<br />
Growth results are the average of three array hybridizations.<br />
Hydrolysate growth selections were carried out in various dilutions of<br />
hydrolysate in minimal media (15%, 16%, 17%, 18%, 19% and 20%). During<br />
selections, cell samples were taken for microarray analysis of populations, and<br />
cells were plated to isolate and identify individual alleles growing as colonies.<br />
Unique alleles from selections were identified and confirmed by PCR and<br />
studied for growth characteristics in hydrolysate. All growth curves were done<br />
in complete triplicate. More details are available in Supplementary Notes.<br />
Growth on various selective agars was carried out by spreading a total of 0.7 ×<br />
10 8 cells of the allele mixtures recovered from freezer aliquots on five plates<br />
for each selective condition (salicin, d-fucose plus l-arabinose, valine, and<br />
methylglyoxal; plate recipes in Supplementary Notes). Plates were incubated<br />
at 37 °C until colonies were visible (1–3 d). Selection for galK down alleles was<br />
carried out on plates containing 2-deoxygalactose 9 , and screens were carried<br />
out on MacConkey agar containing 1% (wt/vol) d-galactose. Screens of lacZ<br />
up alleles were carried out on LB agar plates containing 0.2% (wt/vol) glucose<br />
and 40 μg ml −1 X-gal. Screens of lacZ down alleles were carried out on LB<br />
agar plates containing 0.05% (wt/vol) IPTG and 40 μg ml −1 X-gal. Selections<br />
for control cells were carried out on LB agar plates containing kanamycin<br />
(30 μg ml −1 ).<br />
Microarray tracking. Genomic DNA was extracted from ~10 9 E. coli cells<br />
using Purelink Genomic Mini kit (Invitrogen). Barcode tags are amplified in<br />
300 μl PCR reactions (final concentrations: 1× PCR buffer, 2.5 mM MgCl 2 ,<br />
0.2 mM each dNTP, 1 μM each primer 5′-GTAGCACACGAGGTCTCT-3′ and<br />
Biotin-5′-TACGACTCACTATAGGGAGA-3′, 0.6 U μl −1 Taq polymerase and<br />
0.5 μg genomic DNA or 30 pg synDNA). Reactions were cycled 25 times with<br />
an annealing temperature of 55 °C. Barcode tags were purified by agarose gel<br />
electrophoresis and extraction using the QIAquick gel extraction protocols<br />
(Qiagen, substitute buffer QX1 for QG). Tag purification was shown to reduce<br />
background hybridization. Microarray hybridizations to the Geneflex Tag4<br />
16K V2 array (Affymetrix) were carried out according to published procedures<br />
47 with the following modifications: 600 ng of purified tags (combined<br />
up tags and down tags) were hybridized along with ten tags (amplified and<br />
purified as above) included at known concentrations (0.5 pM to 10 nM).<br />
Intensity values are calculated for each tag after removal of replicate outliers<br />
and averaging of unmasked replicates using software (raw_file_maker.pl) that<br />
can be downloaded from http://chemogenomics.stanford.edu/supplements/<br />
04tag/download.html. Background hybridization was calculated from the<br />
average intensity of 1,642 unused tag probes; threshold intensity was set to<br />
background hybridization plus 2 s.d. The intensities of the ten spiked tags<br />
were used to calculate allele concentrations from array signals and correct for<br />
array saturation (Supplementary Fig. 2). Barcode frequencies were calculated<br />
by dividing barcode concentrations by the total concentration of all barcodes<br />
detected on the array.<br />
doi:10.1038/nbt.1653<br />
nature biotechnology
l e t t e r s<br />
Implications of the presence of N-glycolylneuraminic<br />
acid in recombinant therapeutic glycoproteins<br />
Darius Ghaderi 1,2 , Rachel E Taylor 1 , Vered Padler-Karavani 1 , Sandra Diaz 1 & Ajit Varki 1<br />
© 2010 <strong>Nature</strong> America, Inc. All rights reserved.<br />
Recombinant glycoprotein therapeutics produced in nonhuman<br />
mammalian cell lines and/or with animal serum are often<br />
modified with the nonhuman sialic acid N-glycolylneuraminic<br />
acid (Neu5Gc; refs. 1,2). This documented contamination<br />
has generally been ignored in drug development because<br />
healthy individuals were not thought to react to Neu5Gc<br />
(ref. 2). However, recent findings indicate that all humans<br />
have Neu5Gc-specific antibodies, sometimes at high levels 3,4 .<br />
Working with two monoclonal antibodies in clinical use,<br />
we demonstrate the presence of covalently bound Neu5Gc<br />
in cetuximab (Erbitux) but not panitumumab (Vectibix).<br />
Anti-Neu5Gc antibodies from healthy humans interact with<br />
cetuximab in a Neu5Gc-specific manner and generate immune<br />
complexes in vitro. Mice with a human-like defect in Neu5Gc<br />
synthesis generate antibodies to Neu5Gc after injection with<br />
cetuximab, and circulating anti-Neu5Gc antibodies can<br />
promote drug clearance. Finally, we show that the Neu5Gc<br />
content of cultured human and nonhuman cell lines and their<br />
secreted glycoproteins can be reduced by adding a human<br />
sialic acid to the culture medium. Our findings may be relevant<br />
to improving the half-life, efficacy and immunogenicity of<br />
glycoprotein therapeutics.<br />
Therapeutic glycoproteins, including antibodies, growth factors,<br />
cytokines, hormones and clotting factors, generate sales with annual<br />
double-digit growth rates 5 . They must often be produced in mammalian<br />
expression systems because of the crucial influence of the location,<br />
number and structure of N-glycans on their yields, bioactivity, solubility,<br />
stability against proteolysis, immunogenicity and rate of clearance<br />
from the bloodstream 6–8 .<br />
Two differences between the protein glycosylation apparatus of<br />
humans and rodents account for major potential differences between<br />
the N-glycans on glycoproteins made in cultured human cells and<br />
those made using rodent cell lines. First, humans cannot synthesize a<br />
terminal Galα1-3Gal motif (known as alpha-Gal) on N-glycans. As a<br />
consequence, they express antibodies against this structure 9 . Second,<br />
unlike other mammals, humans cannot biosynthesize the sialic acid<br />
Neu5Gc because the human gene CMAH, encoding CMP-N-acetylneuraminic<br />
acid hydroxylase, the enzyme responsible for producing<br />
CMP-Neu5Gc from CMP-N-acetylneuraminic acid (CMP-Neu5Ac),<br />
is irreversibly mutated 10 . The use of cultured human cells to address<br />
this issue is not a solution, as Neu5Gc can be taken up from animal<br />
products present in the culture medium and then metabolically incorporated<br />
into secreted glycoproteins 11 .<br />
Owing largely to limitations of the assays originally used to detect<br />
anti-Neu5Gc antibodies, including the fact that only a small number<br />
of possible Neu5Gc-containing epitopes were tested, healthy humans<br />
were long believed to show no immune reaction to Neu5Gc (ref. 2).<br />
Subsequent reports that all humans possess anti-Neu5Gc antibodies 3 ,<br />
sometimes at high levels, approaching 0.1–0.2% of circulating IgG 3,4 ,<br />
have led to re-evaluation of the potential significance of Neu5Gc<br />
contamination 7,8 . Especially in light of trends toward administering<br />
increasingly higher amounts of certain biotherapeutics over longer<br />
periods of time, some biopharmaceutical companies are exploring<br />
steps to reduce levels of Neu5Gc in their products 12 .<br />
Given that they are produced using nonhuman cell lines, animal<br />
serum or serum-derived factors, or a combination of these, it is likely<br />
that most recombinant therapeutic glycoproteins carry some Neu5Gc.<br />
However, given the diversity of products and production protocols,<br />
it is difficult to make generalizations. Thus, we chose to compare<br />
two US Food and Drug Administration (FDA)-approved monoclonal<br />
antibodies with the same therapeutic target, the EGF receptor. The<br />
first, Erbitux (cetuximab, obtained from the University of California,<br />
San Diego Pharmacy), is a chimeric antibody produced in mouse<br />
myeloma cells 13,14 . The second, Vectibix (panitumumab, obtained<br />
from Amgen), is a fully human antibody produced in Chinese<br />
hamster ovary (CHO) cells 15 . The samples studied were preparations<br />
that would normally be administered to patients.<br />
We first performed enzyme-linked immunosorbent assays (ELISAs)<br />
using an affinity-purified polyclonal chicken Neu5Gc-specific antibody<br />
preparation that is highly monospecific for Neu5Gc (ref. 16,<br />
alongside a nonreactive control IgY). Bound Neu5Gc was easily<br />
detectable on cetuximab but not on panitumumab (Fig. 1a). Sialidase<br />
pretreatment abolished binding, confirming specificity. Western blot<br />
analysis also showed sialidase-sensitive anti-Neu5Gc IgY reactivity<br />
on the heavy chains of cetuximab but not those of panitumumab<br />
(Fig. 1b). The specificity of anti-Neu5Gc IgY binding was reaffirmed<br />
by pretreatment with mild sodium periodate under conditions that<br />
selectively cleave sialic acid side chains (Fig. 1c) and abolish reactivity<br />
of such antibodies 3,16 . Finally, we quantified sialic acids on the therapeutic<br />
antibodies, as described in Online Methods. Panitumumab<br />
carries 0.22 mol of sialic acids per mole of protein, with
l e t t e r s<br />
a b<br />
c<br />
d e<br />
A 495<br />
0.6<br />
0.4<br />
0.2<br />
0<br />
Anti-Neu5Gc<br />
IgY<br />
Cet<br />
Pan<br />
Control IgY<br />
***<br />
Anti-Neu5Gc<br />
IgY<br />
Control IgY<br />
Active Heat-inactivated<br />
sialidase sialidase<br />
Sialidase:<br />
Coomassie<br />
staining<br />
Anti-Neu5Gc<br />
IgY<br />
Control IgY<br />
Cet Pan<br />
– + – +<br />
A 495<br />
0.8<br />
0.4<br />
0<br />
Cet<br />
Pan<br />
Anti-Neu5Gc<br />
IgY<br />
Control IgY<br />
Periodate<br />
treatment<br />
***<br />
Anti-Neu5Gc<br />
IgY<br />
Control IgY<br />
Mock<br />
treatment<br />
A 495<br />
0.2<br />
0<br />
Human anti-<br />
Neu5Gc IgG<br />
Cet<br />
Pan<br />
Control<br />
human IgG<br />
Periodate<br />
treatment<br />
***<br />
Human anti-<br />
Neu5Gc IgG<br />
Control<br />
human IgG<br />
Mock<br />
treatment<br />
Cet Pan<br />
Sialidase: – + – +<br />
Anti-Neu5Gc<br />
Human IgG<br />
f<br />
Concentration (ng µl –1 )<br />
2<br />
1<br />
0<br />
**<br />
**<br />
Cet Pan No Ab<br />
S34<br />
S30<br />
© 2010 <strong>Nature</strong> America, Inc. All rights reserved.<br />
Figure 1 ELISA and western blot detection of Neu5Gc on biotherapeutic antibodies by Neu5Gc IgY antibodies from chickens or IgG antibodies from<br />
normal human serum. Cetuximab (Cet) and panitumumab (Pan) were treated with active sialidase to eliminate sialic acid epitopes or with heatinactivated<br />
sialidase as control. (a,b) Samples were used for ELISA (a) or western blot (b), in which Neu5Gc was detected using an affinity-purified<br />
chicken anti-Neu5Gc IgY or control IgY. A 495 , absorbance at 495 nm. ***P < 0.001, paired two-tailed t-test. (c) In an additional ELISA, Cet and Pan<br />
were used for coating, then blocked, and sialic acid epitopes were modified chemically using mild sodium metaperiodate pretreatment. The reaction<br />
was stopped using sodium borohydride. As a control, periodate and borohydride were mixed and then added to the wells (the borohydride inactivates the<br />
periodate). ELISA samples were studied at least in triplicate and data shown are means ± s.d. ***P < 0.001, paired two-tailed t-test. (d) Cet and Pan<br />
were pretreated with mild periodate as in c and used to coat ELISA wells before blocking and incubation with human anti-Neu5Gc IgG that had been<br />
purified from the serum of healthy humans and biotinylated as previously described 4 . Samples were studied in triplicate and data shown are means ±<br />
s.d. ***P < 0.001, paired two-tailed t-test. (e) Cet and Pan (1 μg each) were treated with sialidase or heat-inactivated sialidase as in a separated by<br />
SDS-PAGE, Coomassie-stained, blotted (see b), and Neu5Gc detected using biotinylated human anti-Neu5Gc IgG. (f) Immune complex formation with<br />
Cet or Pan in whole human serum was detected using the CIC (C1Q) ELISA Kit (Buehlmann) as described in the manufacturer’s guidelines. Absorbance<br />
was measured at 405 nm. Samples were studied in triplicate and data shown are means ± s.d. **P < 0.01, paired two-tailed t-test. Gels in b and e were<br />
cropped for clarity of presentation. Full-length blots and gels are presented in Supplementary Figures 1–4.<br />
In contrast, cetuximab carries 1.84 mol of sialic acids per mole of<br />
protein, mostly as Neu5Gc (see Supplementary Table 1). The differences<br />
probably reflect different cell-expression systems. For example,<br />
in contrast to CHO cells, murine myeloma cell lines express a greater<br />
proportion of sialic acids as Neu5Gc (ref. 17; see Supplementary<br />
Tables 2 and 3 for a listing of other potential examples). Pull-down<br />
assays of cetuximab with SNA-agarose (modified with the lectin<br />
Sambucus nigra agglutinin, which recognizes α2-6-linked sialic acids),<br />
followed by ELISAs of unbound proteins, showed that only about half<br />
of cetuximab molecules actually carry bound sialic acids and Neu5Gc<br />
(data not shown). Such heterogeneity is typical for glycoproteins.<br />
To address the potential significance of the high levels of anti-<br />
Neu5Gc antibodies found in certain humans, we affinity purified anti-<br />
Neu5Gc antibodies from normal human sera and biotinylated them<br />
exactly as previously described 4 , before their analysis using ELISA<br />
and western blotting assays (Fig. 1d,e). As with Neu5Gc-specific<br />
chicken IgY, these affinity-purified human Neu5Gc-specific antibodies<br />
reacted with cetuximab but not with panitumumab. Again,<br />
reactivity was abrogated by pretreatment with mild sodium periodate<br />
(Fig. 1d) or sialidase (Fig. 1e).<br />
To further address potential clinical relevance, we studied whether<br />
addition of cetuximab to normal human sera is capable of promoting<br />
the formation of immune complexes (Fig. 1f). Cetuximab formed<br />
immune complexes in a human serum with high levels of anti-Neu5Gc<br />
antibodies (serum S34; ref. 4) but not in a low-titer serum (serum S30;<br />
ref. 4). In contrast, we detected no formation of immune complexes<br />
with either serum in the presence of panitumumab. Assuming that<br />
similar interactions occur between cetuximab and circulating anti-<br />
Neu5Gc antibodies in humans, these complexes could potentially fix<br />
complement and cause untoward reactions in some patients and/or<br />
affect half-life, possibly explaining some reported clinical differences<br />
between cetuximab and panitumumab 13,15 ,<br />
We next evaluated whether Neu5Gc affects clearance rate when circulating<br />
anti-Neu5Gc antibodies are present. To mimic the situation<br />
in humans, we used mice with a human-like defect in the Cmah<br />
gene, which encodes the enzyme that generates activated Neu5Gc<br />
(CMP-Neu5Gc) 18 . Such mice can make anti-Neu5Gc antibodies upon<br />
immunization with glycosidically bound, but not free, Neu5Gc 19–21 .<br />
However, the previous studies reporting these mouse anti-Neu5Gc<br />
antibodies used whole rodent or chimpanzee cells for immunization<br />
19,20 , an artificial approach. In contrast, feeding of Neu5Gc (which<br />
is present in mouse chow) does not induce a human-like immune<br />
response in the mutant mice 21 . We could not immunize the mice with<br />
cetuximab itself, as other antibodies directed against the partly human<br />
IgG protein backbone would confound any results. To most closely<br />
mimic the situation in humans, we therefore immunized with Neu5Gcloaded<br />
Haemophilus influenzae (see Online Methods and ref. 21;<br />
this is very similar to the mechanism by which human Neu5Gc-specific<br />
antibodies appear to be generated naturally 21 ). Given the great variability<br />
in isotypes and affinities of the naturally occurring human<br />
anti-Neu5Gc antibodies, as well as their different relative reactivities<br />
against various Neu5Gc-containing antigens 4 , it is impractical to<br />
model all possible human conditions. We therefore chose to mimic<br />
a situation in a human with relatively high levels of the IgG antibodies<br />
against the kind of Neu5Gc epitope (Neu5Gcα2-6Galβ1-4Glc-)<br />
found in cetuximab 22 . It also happens that this epitope is commonly<br />
recognized by human anti-Neu5Gc antibodies 4 .<br />
Each of the therapeutic antibodies, cetuximab and panitumumab,<br />
was injected intravenously at levels estimated to ensure a concentration<br />
of 1 μg ml −1 in the extracellular fluid volume according to mouse<br />
body weight 23 . Next, sera pooled from naïve, control-immunized or<br />
Neu5Gc-immunized syngeneic mice were passively transferred via<br />
intraperitoneal injection, ensuring equal starting concentrations of<br />
circulating Neu5Gc-specific antibodies. Anti-Neu5Gc IgG levels in<br />
the pooled sera from Neu5Gc-immunized mice were quantified using<br />
ELISA with a Neu5Gcα2-6Galβ1-4Glc-conjugate as a target, as previously<br />
described 4 (97.5 μg ml −1 , data not shown). The amount of<br />
pooled antibody injected was then calculated to achieve an approximate<br />
864 VOLUME 28 NUMBER 8 AUGUST 2010 nature biotechnology
l e t t e r s<br />
© 2010 <strong>Nature</strong> America, Inc. All rights reserved.<br />
Figure 2 Effects of Neu5Gc-specific antibodies on the kinetics of<br />
therapeutic antibodies in mice with a human-like Neu5Gc deficiency,<br />
levels of anti-Neu5Gc IgG in mice after injections of the therapeutic<br />
antibodies, and binding of IgG Neu5Gc-specific antibodies from whole<br />
human serum to Neu5Gc on the Fab fragment of cetuximab. (a) Cmahnull<br />
mice were first injected intravenously with either of the therapeutic<br />
antibodies, cetuximab (Cet) or panitumumab (Pan). Serum from Cmah-null<br />
mice containing anti-Neu5Gc antibodies (or serum from naïve mice or<br />
control-immunized mice) was then passively transferred by intraperitoneal<br />
injection. Mice were bled periodically after the passive transfer of serum.<br />
Concentrations of Cet or Pan in the isolated sera were determined by<br />
sandwich ELISA. Absorbance was measured at 495 nm. The y axis starts<br />
at 60% to better display the difference in kinetics. Error bars, s.d.;<br />
***P < 0.001, unpaired two-tailed t-test. (b) Cmah-null mice were injected<br />
intravenously with Cet, Pan or mouse IgG weekly and were bled initially<br />
and after the third intravenous injection. To detect Neu5Gc-specific<br />
antibodies by ELISA, we coated wells with human (Neu5Gc-deficient)<br />
or chimpanzee (Neu5Gc-positive) serum glycoproteins (upper chart), or<br />
alternatively with human or bovine fibrinogen (lower chart). Data were<br />
obtained in triplicate. (c) Fab fragments of Cet and Pan were isolated using<br />
the Pierce Fab Preparation Kit according to the manufacturer’s manual for use as target molecules in ELISA (1 μg per well). Sialic acid–specific binding<br />
was determined using mild sodium metaperiodate pretreatment. Wells were then blocked and incubated with human sera (S30 and S34, with low and<br />
high anti-Neu5Gc IgG titers, respectively 4 ). Binding of human IgG was detected using anti-human IgG-Fc. Absorbance was measured at 490 nm and<br />
ELISA samples were studied in triplicate. Error bars, s.d.; *P < 0.05, paired two-tailed t-test.<br />
starting concentration of 4 μg ml −1 IgG in the extracellular fluid<br />
volumes of the mice, which is about a four fold excess of anti-Neu5Gc<br />
antibodies compared to the injected drug in the mice, and similar to<br />
levels found in some humans 4 .<br />
Clearance was monitored by a sandwich ELISA specific for human<br />
IgG-Fc. Although both drugs had a similar clearance rate in mice<br />
pre-injected with serum from naïve or control-immunized mice,<br />
circulating levels of cetuximab decreased significantly (P < 0.001)<br />
when Neu5Gc-specific antibodies were pre-injected (Fig. 2a).<br />
Assuming that a similar interaction between cetuximab and<br />
circulating anti-Neu5Gc antibodies occurs in patients, there could<br />
be relevant effects on clearance rate and efficacy. This might help to<br />
explain the wide range of half-life values reported for such antibodies<br />
in clinical studies 14,15 .<br />
To further simulate the clinical situation, we injected equal<br />
amounts of cetuximab or panitumumab intravenously into Neu5Gcdeficient<br />
Cmah −/− mice in typical human dosages (4 μg per gram of<br />
body weight) at weekly intervals. To exclude any effect of the human<br />
portion of the protein (cetuximab) or of the fully human protein<br />
(panitumumab) in mice, we also injected murine IgG as a positive<br />
control, as it happens to carry Neu5Gc as the predominant sialic<br />
acid (Supplementary Table 1). Notably, cetuximab and murine IgG<br />
(but never panitumumab) induced a Neu5Gc-specific IgG immune<br />
response (Fig. 2b). As with humans, responses of individual mice<br />
varied greatly, and more positive signals were obtained with the<br />
Neu5Gc epitope mixture found in chimp serum than that in bovine<br />
fibrinogen. Thus, even patients without pre-existing high levels of<br />
anti-Neu5Gc antibodies may be at risk of developing them after injection<br />
of Neu5Gc-carrying agents, potentially affecting the outcome<br />
of subsequent injections. Moreover, repeated injections of Neu5Gccarrying<br />
agents could result in the accumulation of this nonhuman<br />
sugar in human tissues. Together with Neu5Gc-specific antibodies,<br />
accumulation of Neu5Gc in tissues can mediate chronic inflammation<br />
and potentially facilitate progression of diseases such as cancer 19 and<br />
atherosclerosis 24 . Thus, chronic use of Neu5Gc-bearing therapeutics<br />
might increase future risk of such diseases.<br />
Finally, we studied direct binding of anti-Neu5Gc antibodies from<br />
whole human sera to both cetuximab and panitumumab. To avoid<br />
a<br />
Circulating Cet or Pan<br />
(normalized)<br />
100<br />
Cet<br />
Pan<br />
80<br />
60<br />
0<br />
NaÏve<br />
mouse<br />
serum<br />
*** ***<br />
50<br />
Hours<br />
Serum of<br />
controlimmunized<br />
mice<br />
100<br />
Serum of<br />
Neu5Gcimmunized<br />
mice<br />
b<br />
Change in A 495<br />
A 495<br />
0.8<br />
mlgG Pan Cet<br />
0.6<br />
0.4<br />
0.2<br />
0<br />
–0.2<br />
0.3<br />
0.2<br />
0.1<br />
0<br />
–0.1<br />
S34<br />
S30<br />
0<br />
Periodate Mock Periodate Mock<br />
Fab Cet Fab Pan<br />
excessive cross-reactivity involving the secondary reagent, we prepared<br />
Fab fragments of both of the agents, used them to coat ELISA<br />
plate wells, exposed them to human sera and then detected serum<br />
antibody binding with a human IgG-Fc–specific secondary antibody<br />
(note that cetuximab is known to have an additional glycosylation<br />
site in the V-region 21 ). We detected mild periodate–sensitive binding<br />
of serum IgG from a high–anti-Neu5Gc titer serum (S34, ref. 4),<br />
which had >15 μg ml −1 IgG antibodies against Neu5Gcα2-6Galβ1-<br />
4Glc-) to the Fab fragments of cetuximab and not to those of panitumumab<br />
(Fig. 2c). In contrast, incubation with another human serum<br />
containing very low Neu5Gc-antibodies (serum S30, ref. 4, which had<br />
l e t t e r s<br />
a b c d e<br />
Neu5Gc<br />
(% of total sialic acids)<br />
80<br />
60<br />
40<br />
20<br />
0<br />
Day 0<br />
Ethanol-soluble fraction<br />
Ethanol-precipitable fraction<br />
Secreted protein<br />
Membrane fraction<br />
Control 5 mM Neu5Ac Control 5 mM Neu5Ac<br />
Control 5 mM Neu5Ac Control 5 mM Neu5Ac<br />
80<br />
10<br />
60<br />
15<br />
40<br />
10<br />
5<br />
20<br />
5<br />
0<br />
0<br />
0<br />
Day 1<br />
Day 2<br />
Day 3<br />
Day 4<br />
Day 5<br />
Neu5Gc<br />
(% of total sialic acids)<br />
Day 0<br />
Day 1<br />
Day 2<br />
Day 3<br />
Day 4<br />
Day 5<br />
Neu5Gc (% of total sialic acids)<br />
Day 3<br />
Day 5<br />
Day 7<br />
Neu5Gc (% of total sialic acids)<br />
Day 3<br />
Day 5<br />
Day 7<br />
5 mM Neu5Ac<br />
– + Size<br />
197 (kDa)<br />
125<br />
83<br />
Figure 3 An approach to reducing Neu5Gc contamination in biotherapeutic products. (a,b) Human 293T cells were grown in the presence of 5 mM Neu5Gc<br />
for 3 d. The cells were then washed with PBS and split into two identical cultures, and 5 mM Neu5Ac was added to one of the cultures. Cells were harvested<br />
as described in Online Methods, and the Neu5Gc and Neu5Ac content of both the ethanol-soluble (a) and ethanol-precipitable proteins (b) was analyzed<br />
by HPLC. (c–e) Feeding of CHO cells with free Neu5Ac reduced Neu5Gc in the whole-cell membranes and in secreted glycoproteins. Stably transfected<br />
CHO-KI cells expressing a recombinant soluble IgG-Fc fusion protein were grown in the absence or presence of 5 mM Neu5Ac. The individually collected<br />
medium was centrifuged to remove cell debris and adjusted to 5 mM Tris-HCl pH 8. The fusion protein was purified using protein A–Sepharose, and sialic<br />
acid content was determined by DMB-HPLC analysis as described in Online Methods (c). Total cell membranes from the same CHO cells were prepared and<br />
used for DMB-HPLC analysis (d). CHO membrane proteins from d were separated by SDS-PAGE and transferred onto nitrocellulose membranes. Expression<br />
of Neu5Gc (e) was detected by incubating with polyclonal affinity-purified chicken anti-Neu5Gc IgY, as described in Online Methods.<br />
37<br />
© 2010 <strong>Nature</strong> America, Inc. All rights reserved.<br />
small amounts of Neu5Gc in recombinant glycoproteins produced in<br />
CHO cells 1,16 , we next asked whether feeding Neu5Ac could reduce total<br />
glycoprotein Neu5Gc levels in CHO cells. This was successful for all membrane<br />
glycoproteins and for a secreted recombinant protein (Fig. 3c–e).<br />
Similar feeding of murine myeloma cells with Neu5Ac did not substantially<br />
reduce the higher initial Neu5Gc content (~70–80% of sialic acids),<br />
most probably because of the higher baseline levels of Cmah in these cells.<br />
Regardless, given that the CHO cell expresses its own Cmah enzyme, these<br />
data suggest a novel mechanism, in addition to Neu5Ac competing out<br />
recycled Neu5Gc. Whatever that mechanism, reduction of Neu5Gc content<br />
of a recombinant glycoprotein can be achieved even in a nonhuman<br />
Cmah-positive cell line that starts with low levels of Neu5Gc.<br />
Despite their successful use for a variety of indications, infusionrelated<br />
reactions, immunogenicity and accelerated clearance remain<br />
important concerns for many therapeutic glycoproteins 7,25 . The incidence<br />
and severity of an immune reaction depends on the interplay<br />
of infused agents with the immune system and can vary greatly from<br />
patient to patient. Understanding the underlying nature of these<br />
events will help to identify patients at risk with the use of specific<br />
markers. Humanized and fully human antibodies have been developed<br />
to reduce immunogenicity due to peptide epitopes 5 . However, the<br />
potential immunogenicity of the glycans they carry has not been as<br />
well considered. It is known that immune reactions can be mediated<br />
by binding of pre-existing IgEs against the nonhuman alpha-Gal epitope<br />
carried by some agents, such as cetuximab 13 . However, in our studies<br />
alpha-Gal residues are not an issue, as Cmah-null mice already express<br />
this sequence and do not have antibodies against it.<br />
A further concern arises here because pre-existing antibodies<br />
against a glycan on a glycoprotein can secondarily enhance antibody<br />
reactivity against the underlying protein backbone 26 , perhaps because<br />
immune complexes are cleared efficiently by Fc receptors into dendritic<br />
cells and other antigen-presenting cells 27,28 . Such a mechanism<br />
might help explain why patients’ immunogenicity to some glycoprotein<br />
therapeutics sometimes increases over time 26,29,30 . If this were<br />
true, it would likely have a further impact in long-term replacement<br />
therapy with recombinant therapeutic glycoproteins.<br />
Our findings suggest that the potential significance of the presence<br />
of Neu5Gc on glycoprotein biotherapeutics should be revisited.<br />
Despite a natural tendency to downplay potential new problems<br />
involving currently useful drugs, it is worthwhile to consider lessons<br />
from other fields, where initial enthusiasm was not balanced by full<br />
appreciation of immunological implications 31 . With this in mind, we<br />
have also suggested that Neu5Gc contamination of stem cells and<br />
other cell types intended for human therapy could pose risks 32,33 . In<br />
addition, others have recently reported that Cmah-null mice can reject<br />
Neu5Gc-positive wild-type organ transplants via complement-fixing<br />
Neu5Gc-specific antibodies 20 .<br />
For new drugs, it may be possible to avoid Neu5Gc contamination<br />
from the outset by using Neu5Gc-deficient cells and media.<br />
Meanwhile, as an immediate practical solution, we have also demonstrated<br />
a nontoxic way to reduce the Neu5Gc content of some currently<br />
used expression systems and their secreted glycoproteins, by simply<br />
adding Neu5Ac to the culture media. This could bypass the need<br />
to establish new Neu5Gc-deficient cell lines for already approved<br />
drugs. The addition of Neu5Ac to the media could also potentially<br />
increase total sialylation of a glycoprotein biotherapeutic agent. But<br />
if anything, such an increase would only be beneficial—for example,<br />
leading to a longer half-life of the agent in vivo.<br />
Methods<br />
Methods and any associated references are available in the online<br />
version of the paper at http://www.nature.com/naturebiotechnology/.<br />
Note: Supplementary information is available on the <strong>Nature</strong> Biotechnology website.<br />
Acknowledgments<br />
This work was supported by US National Institutes of Health grants R01-GM32373<br />
and R01-CA38701 to A.V. and The International Sephardic Education Foundation<br />
for V.P.-K. Haemophilus influenzae strain 2019 was a generous gift from M. Apicella,<br />
Department of Microbiology, University of Iowa.<br />
AUTHOR CONTRIBUTIONS<br />
All authors helped design the studies; D.G. and S.D. performed the research; R.E.T.<br />
and V.P.-K. generated crucial reagents; D.G. and A.V. wrote the paper; and all<br />
authors read the paper.<br />
COMPETING FINANCIAL INTERESTS<br />
The authors declare competing financial interests: details accompany the full-text<br />
HTML version of the paper at http://www.nature.com/naturebiotechnology/.<br />
Published online at http://www.nature.com/naturebiotechnology/.<br />
Reprints and permissions information is available online at http://npg.nature.com/<br />
reprintsandpermissions/.<br />
1. Hokke, C.H. et al. Sialylated carbohydrate chains of recombinant human<br />
glycoproteins expressed in Chinese hamster ovary cells contain traces of<br />
N-glycolylneuraminic acid. FEBS Lett. 275, 9–14 (1990).<br />
866 VOLUME 28 NUMBER 8 AUGUST 2010 nature biotechnology
l e t t e r s<br />
© 2010 <strong>Nature</strong> America, Inc. All rights reserved.<br />
2. Noguchi, A., Mukuria, C.J., Suzuki, E. & Naiki, M. Failure of human immunoresponse<br />
to N-glycolylneuraminic acid epitope contained in recombinant human erythropoietin.<br />
Nephron 72, 599–603 (1996).<br />
3. Tangvoranuntakul, P. et al. Human uptake and incorporation of an immunogenic<br />
nonhuman dietary sialic acid. Proc. Natl. Acad. Sci. USA 100, 12045–12050<br />
(2003).<br />
4. Padler-Karavani, V. et al. Diversity in specificity, abundance, and composition of<br />
anti-Neu5Gc antibodies in normal humans: potential implications for disease.<br />
Glycobiology 18, 818–830 (2008).<br />
5. Aggarwal, S. What′s fueling the biotech engine—2007. Nat. Biotechnol. 26,<br />
1227–1233 (2008).<br />
6. Arnold, J.N., Wormald, M.R., Sim, R.B., Rudd, P.M. & Dwek, R.A. The impact of<br />
glycosylation on the biological function and structure of human immunoglobulins.<br />
Annu. Rev. Immunol. 25, 21–50 (2007).<br />
7. Durocher, Y. & Butler, M. Expression systems for therapeutic glycoprotein production.<br />
Curr. Opin. Biotechnol. 20, 700–707 (2009).<br />
8. Higgins, E. Carbohydrate analysis throughout the development of a protein<br />
therapeutic. Glycoconj. J. 27, 211–225 (2009).<br />
9. Galili, U. Immune response, accommodation, and tolerance to transplantation<br />
carbohydrate antigens. Transplantation 78, 1093–1098 (2004).<br />
10. Varki, A. Glycan-based interactions involving vertebrate sialic-acid-recognizing<br />
proteins. <strong>Nature</strong> 446, 1023–1029 (2007).<br />
11. Bardor, M., Nguyen, D.H., Diaz, S. & Varki, A. Mechanism of uptake and incorporation<br />
of the non-human sialic acid N-glycolylneuraminic acid into human cells. J. Biol.<br />
Chem. 280, 4228–4237 (2005).<br />
12. Borys, M.C. et al. Effects of culture conditions on N-glycolylneuraminic acid<br />
(Neu5Gc) content of a recombinant fusion protein produced in CHO cells. Biotechnol.<br />
Bioeng. 105, 1048–1057 (2009).<br />
13. Chung, C.H. et al. Cetuximab-induced anaphylaxis and IgE specific for galactosealpha-1,3-galactose.<br />
N. Engl. J. Med. 358, 1109–1117 (2008).<br />
14. Delbaldo, C. et al. Pharmacokinetic profile of cetuximab (Erbitux) alone and in<br />
combination with irinotecan in patients with advanced EGFR-positive adenocarcinoma.<br />
Eur. J. Cancer 41, 1739–1745 (2005).<br />
15. Saadeh, C.E. & Lee, H.S. Panitumumab: a fully human monoclonal antibody with<br />
activity in metastatic colorectal cancer. Ann. Pharmacother. 41, 606–613<br />
(2007).<br />
16. Diaz, S.L. et al. Sensitive and specific detection of the non-human sialic acid<br />
N-glycolylneuraminic acid in human tissues and biotherapeutic products. PLoS ONE<br />
4, e4241 (2009).<br />
17. Muchmore, E.A., Milewski, M., Varki, A. & Diaz, S. Biosynthesis of N-glycolyneuraminic<br />
acid. The primary site of hydroxylation of N-acetylneuraminic acid<br />
is the cytosolic sugar nucleotide pool. J. Biol. Chem. 264, 20216–20223<br />
(1989).<br />
18. Hedlund, M. et al. N-glycolylneuraminic acid deficiency in mice: implications for<br />
human biology and evolution. Mol. Cell. Biol. 27, 4340–4346 (2007).<br />
19. Hedlund, M., Padler-Karavani, V., Varki, N.M. & Varki, A. Evidence for a humanspecific<br />
mechanism for diet and antibody-mediated inflammation in carcinoma<br />
progression. Proc. Natl. Acad. Sci. USA 105, 18936–18941 (2008).<br />
20. Tahara, H. et al. Immunological property of antibodies against N-glycolylneuraminic<br />
acid epitopes in cytidine monophospho-n-acetylneuraminic acid hydroxylasedeficient<br />
mice. J. Immunol. 184, 3269–3275 (2010).<br />
21. Taylor, R.E. et al. Novel mechanism for the generation of human xeno-autoantibodies<br />
against the non-human sialic acid N-glycolylneuraminic acid. J. Exp.<br />
Med. published online, doi: 10.1084/jem.20100575 (12 July 2010).<br />
22. Qian, J. et al. Structural characterization of N-linked oligosaccharides on monoclonal<br />
antibody cetuximab by the combination of orthogonal matrix-assisted laser<br />
desorption/ionization hybrid quadrupole-quadrupole time-of-flight tandem mass<br />
spectrometry and sequential enzymatic digestion. Anal. Biochem. 364, 8–18<br />
(2007).<br />
23. Axworthy, D.B. et al. Cure of human carcinoma xenografts by a single dose of<br />
pretargeted yttrium-90 with negligible toxicity. Proc. Natl. Acad. Sci. USA 97,<br />
1802–1807 (2000).<br />
24. Pham, T. et al. Evidence for a novel human-specific xeno-auto-antibody response<br />
against vascular endothelium. Blood 114, 5225–5235 (2009).<br />
25. Jahn, E.M. & Schneider, C.K. How to systematically evaluate immunogenicity of<br />
therapeutic proteins—regulatory considerations. New Biotechnol. 25, 280–286<br />
(2009).<br />
26. Galili, U. et al. Enhancement of antigen presentation of influenza virus hemagglutinin<br />
by the natural human anti-Gal antibody. Vaccine 14, 321–328 (1996).<br />
27. Benatuil, L. et al. The influence of natural antibody specificity on antigen<br />
immunogenicity. Eur. J. Immunol. 35, 2638–2647 (2005).<br />
28. Abdel-Motal, U.M., Wigglesworth, K. & Galili, U. Mechanism for increased<br />
immunogenicity of vaccines that form in vivo immune complexes with the natural<br />
anti-Gal antibody. Vaccine 27, 3072–3082 (2009).<br />
29. Koren, E. et al. Recommendations on risk-based strategies for detection and<br />
characterization of antibodies against biotechnology products. J. Immunol. Methods<br />
333, 1–9 (2008).<br />
30. Shankar, G., Pendley, C. & Stein, K.E. A risk-based bioanalytical strategy for the<br />
assessment of antibody immune responses against biological drugs. Nat. Biotechnol.<br />
25, 555–561 (2007).<br />
31. Wilson, J.M. Medicine. A history lesson for stem cells. Science 324, 727–728<br />
(2009).<br />
32. Martin, M.J., Muotri, A., Gage, F. & Varki, A. Human embryonic stem cells express<br />
an immunogenic nonhuman sialic acid. Nat. Med. 11, 228–232 (2005).<br />
33. Martin, M.J., Muotri, A., Gage, F. & Varki, A. Response to Cerdan et al.: Complement<br />
targeting of nonhuman sialic acid does not mediate cell death of human embryonic<br />
stem cells. Nat. Med. 12, 1115 (2006).<br />
34. Van Hoeyveld, E. & Bossuyt, X. Evaluation of seven commercial ELISA kits compared<br />
with the C1q solid-phase binding RIA for detection of circulating immune complexes.<br />
Clin. Chem. 46, 283–285 (2000).<br />
35. Campagnari, A.A., Gupta, M.R., Dudas, K.C., Murphy, T.F. & Apicella, M.A. Antigenic<br />
diversity of lipooligosaccharides of nontypable Haemophilus influenzae. Infect.<br />
Immun. 55, 882–887 (1987).<br />
36. Greiner, L.L. et al. Nontypeable Haemophilus influenzae strain 2019 produces a<br />
biofilm containing N-acetylneuraminic acid that may mimic sialylated O-linked<br />
glycans. Infect. Immun. 72, 4249–4260 (2004).<br />
37. Gagneux, P. et al. Proteomic comparison of human and great ape blood plasma<br />
reveals conserved glycosylation and differences in thyroid hormone metabolism.<br />
Am. J. Phys. Anthropol. 115, 99–109 (2001).<br />
38. Debeire, P., Montreuil, J., Moczar, E., van Halbeek, H. & Vliegenthart, J.F.G. Primary<br />
structure of two major glycans of bovine fibrinogen. Eur. J. Biochem. 151, 607–611<br />
(1985).<br />
nature biotechnology VOLUME 28 NUMBER 8 AUGUST 2010 867
© 2010 <strong>Nature</strong> America, Inc. All rights reserved.<br />
ONLINE METHODS<br />
Mice. The Cmah-null mice used for this study have been described previously 18<br />
and were backcrossed to C57Bl/6 mice for over ten generations. All experiments<br />
were approved by the University of California, San Diego Institutional<br />
Review Board committee responsible for approving animal experiments.<br />
Sialidase treatment of therapeutic antibodies. One milligram each of cetuximab<br />
or panitumumab (obtained from the University of California, San Diego<br />
pharmacy or the manufacturer) were treated with 50 mU of active or heatinactivated<br />
Arthrobacter ureafaciens sialidase (EY Laboratories) in 100 mM<br />
sodium acetate pH 5.5, at 37 °C for 24 h. Samples were used for ELISA or<br />
western blots.<br />
Periodate treatment of therapeutic antibodies on ELISA plate. Untreated<br />
cetuximab and panitumumab (1 μg per well) were used for coating, then<br />
blocked with PBST for 2 h and incubated with freshly made 2 mM sodium<br />
metaperiodate in PBS for 20 min at 4 °C in the dark. The reaction was stopped<br />
by addition of 200 mM sodium borohydride to a final concentration of 20 mM.<br />
As a control, periodate and borohydride were premixed and then added to the<br />
wells (the borohydride inactivates the periodate). To remove resulting borates,<br />
wells were then washed three times with 100 mM sodium acetate with 100 mM<br />
NaCl pH 5.5 before further analysis.<br />
ELISA detection of Neu5Gc on therapeutic antibodies. For the ELISA, wells<br />
were coated with 1 μg of cetuximab or panitumumab (either before sialidase<br />
treatment or after periodate treatment), blocked with TBST for 2 h and then<br />
incubated with affinity-purified chicken anti-Neu5Gc IgY or control IgY for 1 h<br />
(1:20,000 in TBST). Binding of IgY was detected using horseradish peroxidase<br />
(HRP)-conjugated donkey anti-chicken IgY (1:50,000 in TBST) and developed<br />
with O-phenylenediamine in citrate-phosphate buffer, pH 5.5, with absorbance<br />
measured at 495 nm. ELISA samples were studied at least in triplicate. Similar<br />
to the ELISA with the anti-Neu5Gc chicken IgY, human anti-Neu5Gc IgG that<br />
had been purified from the serum of healthy humans and biotinylated (exactly<br />
as described in ref. 4) was also used as the primary antibody (1:100 in TBST).<br />
Binding of the human antibodies to the therapeutic antibodies was detected<br />
using HRP-conjugated streptavidin (1:10,000) followed by development as<br />
described above. Samples were studied in triplicate.<br />
Western blot detection of Neu5Gc on therapeutic antibodies. For western<br />
blot detection, cetuximab or panitumumab (1 μg per lane) was separated<br />
by 12.5% SDS-PAGE and Coomassie-stained or blotted on nitrocellulose<br />
membranes. Blotted membranes were blocked with TBST containing 0.5%<br />
cold-water fish-skin gelatin overnight at 4 °C and subsequently incubated<br />
with affinity-purified chicken anti-Neu5Gc IgY for 4 h at room temperature<br />
(1:100,000 in TBST). Binding of the chicken anti-Neu5Gc IgY was detected<br />
using HRP-conjugated donkey anti-chicken IgY for 1 h (1:50,000 in TBST),<br />
followed by incubation with SuperSignal West Pico Substrate (Pierce) as per<br />
the manufacturer’s recommendation, exposure to X-ray film and development<br />
of the film. Similar to the western blot with the chicken anti-Neu5Gc IgY,<br />
purified biotinylated human anti-Neu5Gc IgG was also used as the primary<br />
antibody (1:100 in TBST). Binding of the human antibodies to the therapeutic<br />
antibodies was detected using HRP-conjugated streptavidin (1:10,000 in<br />
TBST) followed by development as described above.<br />
CIC-C1q binding assay. Immune complex formation was detected using<br />
the CIC (C1Q) ELISA Kit (Buehlmann) as described in the manufacturer’s<br />
guidelines 34 . Briefly, 100 μl of human serum with low or high anti-Neu5Gc<br />
(S30 and S34, respectively 4 ) was incubated with 40 μg of cetuximab or panitumumab<br />
for 14 h at 4 °C. We applied 1:50 dilutions of the mix to human<br />
C1q–coated ELISA wells and incubated for 1 h at 25 °C. Binding was detected<br />
using alkaline phosphatase–conjugated protein A. After another washing step,<br />
the enzyme substrate (para-nitrophenylphosphate) was added, followed by a<br />
stopping step. The absorbance was measured at 405 nm. Samples were studied<br />
in triplicate.<br />
Generation of murine Neu5Gc-specific antibodies. Haemophilus influenzae<br />
strain 2019 (ref. 35) was a generous gift from M. Apicella, Department of<br />
Microbiology, University of Iowa. Bacteria were grown to mid log phase in<br />
sialic acid–free media 36 with or without addition of 1 mM Neu5Gc 21 , heatkilled<br />
and injected intraperitoneally (200 μl of culture at an absorbance of<br />
600 nm of 0.4) into Cmah-null mice.<br />
Effects of anti-Neu5Gc antibodies on in vivo kinetics of therapeutic antibodies.<br />
Cetuximab or panitumumab in PBS (0.24 μg per gram mouse body<br />
weight) were injected intravenously, and 14 h later, mouse serum pooled from<br />
syngeneic Cmah-null mice containing anti-Neu5Gc antibodies (or pooled<br />
serum from syngeneic naïve or control-immunized mice) was passively transferred<br />
via intraperitoneal injection into syngeneic Cmah-null mice that were<br />
prescreened for the absence of pre-existing antibodies against human IgG.<br />
Mice were bled 0, 2, 8, 32, 56 and 80 h after the passive transfer of mouse<br />
serum. For quantification of therapeutic antibody concentrations in the sera,<br />
wells of ELISA plates were coated with 1 μg of anti-human IgG (Biorad), then<br />
blocked with TBST for 2 h and incubated with 1:500 dilutions of the sera in<br />
each well. Captured therapeutic antibodies were detected by HRP-conjugated<br />
anti-human Fc (Jackson; 1:10,000), with development by O-phenylenediamine<br />
in citrate-phosphate buffer, pH 5.5, and absorbance measured at 495 nm<br />
(n = 5 for injections of both control sera groups; n = 10 for injections of anti-<br />
Neu5Gc serum groups).<br />
Quantification of Neu5Gc-specific IgG antibodies in Neu5Gc-immunized<br />
mice. A Neu5Gcα2-6Galβ1-4Glc-conjugate 4 (1 μg per well) and serial dilutions<br />
of mouse IgG as standards (0.625–20 ng per well) were used for coating<br />
overnight, then blocked with PBST for 2 h and incubated with pooled serum<br />
from Neu5Gc-immunized mice (1:250 dilution) for 2 h at 25 °C. Binding<br />
of mouse IgG was detected using HRP-conjugated goat anti-mouse IgG-Fc<br />
(Jackson; 1:10,000 in PBST) and developed with O-phenylenediamine in<br />
citrate-phosphate buffer, pH 5.5, with absorbance measured at 490 nm. ELISA<br />
samples were studied in triplicate.<br />
Levels of anti-Neu5Gc IgG after injections of the antibodies. Cmah-null mice<br />
were injected intravenously with 4 μg antibody per gram of mouse body weight<br />
in PBS weekly for 3 weeks. Mice were bled initially, and again 1 week after the<br />
third intravenous injection. Wells of ELISA plates were coated with 1:1,000<br />
dilutions of human (Neu5Gc-deficient) or chimpanzee (Neu5Gc-positive)<br />
serum glycoproteins (note that the only major difference between human<br />
and chimp serum glycosylation is the absence or presence of Neu5Gc;<br />
ref. 37). Alternatively, wells were coated with human or bovine fibrinogen,<br />
which carry Neu5Ac or Neu5Gc on otherwise identical N-glycans 38 . Wells<br />
were then blocked with TBST for 2 h followed by incubation with 1:100<br />
dilutions of the mouse sera. Binding of the mouse antibodies was detected<br />
using HRP-conjugated goat anti-mouse IgG Fc fragment (1:10,000 in TBST).<br />
Neu5Gc-specific binding (change in absorbance at 495 nm) was determined<br />
by subtracting the background signal of the wells coated with human serum or<br />
human fibrinogen (no Neu5Gc) from the signal of chimpanzee serum–coated<br />
or bovine fibrinogen–coated wells (containing Neu5Gc). Data were obtained<br />
in triplicate (n = 5 for injection of mouse IgG; n = 4 for injection of panitumumab;<br />
n = 6 for injection of cetuximab ).<br />
An approach to reduce Neu5Gc contamination in biotherapeutic products.<br />
Human 293T kidney cells were grown in DME supplemented with 10% (vol/vol)<br />
fetal calf serum. Cells were lifted from the culture plate using 20 mM EDTA in<br />
PBS and allowed to grow to 50% confluence. At this point, buffered 100 mM<br />
Neu5Gc was added to the culture in duplicate for a final 5 mM concentration,<br />
and the cells were grown in this supplemented media for 3 d. At the end of<br />
this Neu5Gc pulse, the cells were once again lifted using 20 mM EDTA in<br />
PBS, pelleted, washed once with PBS to remove any excess Neu5Gc and then<br />
suspended in 30 ml of growth medium. We added 5 ml of this cell suspension<br />
to each of five P-100 dishes. We immediately harvested the last aliquot of cell<br />
suspension, at time 0, by pelleting the cells, washing once with PBS, suspending<br />
them in 1 ml of PBS and transferring them to a 1.5-ml microcentrifuge<br />
tube. The cells were repelleted and frozen until all time points were collected.<br />
Buffered 100 mM Neu5Ac was added to each of the other five plates for the<br />
‘Neu5Ac chase’ and an equivalent amount of media added to the ‘minus chase’<br />
samples. We harvested cells at days 1, 2, 3, 4 and 5 by scraping them into the<br />
nature biotechnology<br />
doi:10.1038/nbt.1651
culture media, collecting by pelleting, washing once with PBS, transferring<br />
them to a 1.5-ml microcentrifuge tube, pelleting and freezing the cell pellet.<br />
At the end of the 5 d of chase, all collected cell pellets were homogenized in<br />
300 μl of ice-cold 20 mM potassium phosphate pH 7 using a 3- to 20-s burst<br />
with a Fisher Sonicator. We precipitated glycoconjugate-bound sialic acids by<br />
adding 700 μl of 100% ice-cold ethanol (final 70% (vol/vol) correct ethanol) and<br />
incubating at −20 °C overnight. The samples were spun at 20,000g for 15 min<br />
and the supernatants transferred to clean tubes and dried on a speed vac.<br />
The precipitated glycoconjugates and dried ethanol supernatants were each<br />
suspended in 100 μl of 20 mM potassium phosphate pH 7 by sonication. Sialic<br />
acids were released from both fractions by acid hydrolysis with 2 M acetic<br />
acid (final) and incubation at 80 °C for 3 h. Samples were passed through<br />
a Microcon-10 filter and the filtrate derivatized with DMB (1,2-diamino-4,<br />
5-methylenedioxybenzene) reagent for analysis of sialic acids by HPLC.<br />
A similar approach was taken with CHO cells stably expressing a Siglec-Fc<br />
protein in the medium, except that the Neu5Gc pulse was omitted and the<br />
secreted glycoproteins were captured on protein A–Sepharose beads. The<br />
cells were also processed similarly, except that total cell membranes were<br />
pelleted by centrifugation. The sialic acid content of the secreted proteins and<br />
cell membranes was determined by acid hydrolysis, DMB derivatization and<br />
HPLC. The cell membranes were also studied by western blotting with the<br />
chicken anti-Neu5Gc IgY, as described above.<br />
© 2010 <strong>Nature</strong> America, Inc. All rights reserved.<br />
doi:10.1038/nbt.1651<br />
nature biotechnology
l e t t e r s<br />
Global analysis of lysine ubiquitination by ubiquitin<br />
remnant immunoaffinity profiling<br />
Guoqiang Xu, Jeremy S Paige & Samie R Jaffrey<br />
© 2010 <strong>Nature</strong> America, Inc. All rights reserved.<br />
Protein ubiquitination is a post-translational modification<br />
(PTM) that regulates various aspects of protein function by<br />
different mechanisms. Characterization of ubiquitination has<br />
lagged behind that of smaller PTMs, such as phosphorylation,<br />
largely because of the difficulty of isolating and identifying<br />
peptides derived from the ubiquitinated portion of proteins.<br />
To address this issue, we generated a monoclonal antibody<br />
that enriches for peptides containing lysine residues modified<br />
by diglycine, an adduct left at sites of ubiquitination after<br />
trypsin digestion. We use mass spectrometry to identify 374<br />
diglycine-modified lysines on 236 ubiquitinated proteins from<br />
HEK293 cells, including 80 proteins containing multiple<br />
sites of ubiquitination. Seventy-two percent of these proteins<br />
and 92% of the ubiquitination sites do not appear to have<br />
been reported previously. Ubiquitin remnant profiling of the<br />
multi-ubiquitinated proteins proliferating cell nuclear antigen<br />
(PCNA) and tubulin -1A reveals differential regulation of<br />
ubiquitination at specific sites by microtubule inhibitors,<br />
demonstrating the effectiveness of our method to characterize<br />
the dynamics of lysine ubiquitination.<br />
Protein ubiquitination occurs on a wide variety of eukaryotic proteins<br />
and affects processes ranging from protein degradation and subcellular<br />
localization to gene expression and DNA repair 1 . Ubiquitination<br />
involves the transfer of ubiquitin to a target protein using E1 ubiquitin–<br />
activating enzymes, E2 ubiquitin–conjugating enzymes and E3 ubiquitin<br />
ligases 1 . This process typically leads to the formation of an amide<br />
linkage comprising the ε-amine of lysine of the target protein and the<br />
C terminus of ubiquitin, and can involve ubiquitination at distinct sites<br />
within the same protein, although the roles of ubiquitination at distinct<br />
sites are incompletely understood. The human genome is predicted to<br />
encode 16 E1, 53 E2 and 527 E3 proteins 2 , which underscores the likely<br />
importance of ubiquitination in molecular signaling.<br />
In most cases, proteins suspected to be ubiquitinated have been<br />
identified based on their susceptibility to proteasome-mediated degradation,<br />
as evidenced by their increased levels following application<br />
of proteasome inhibitors. These proteins are immunopurified and<br />
ubiquitin adducts are confirmed by anti-ubiquitin immunoblotting 3 .<br />
Mutagenesis experiments can identify ubiquitination sites 4 . Global<br />
identification of ubiquitinated proteins has been performed by<br />
purifying ubiquitinated proteins, using ubiquitin-binding proteins<br />
such as anti-ubiquitin antibodies 5 , or by purifying hexahistidine<br />
(His 6 )-tagged ubiquitin-protein conjugates 6 . The enriched set of proteins<br />
are then proteolyzed and subjected to tandem mass spectrometry<br />
(MS/MS). However, as only one or a few lysines are typically modified<br />
in any ubiquitinated protein, most peptides do not exhibit any<br />
ubiquitin-derived modifications 7 . This introduces uncertainty<br />
whether they are derived from the nonubiquitinated portion of a<br />
protein or from coprecipitated proteins.<br />
Alternatively, proteolytic digests can be screened for peptides that<br />
contain remnants of ubiquitin modification. Digestion of ubiquitinconjugated<br />
proteins results in peptides that contain a ubiquitin remnant<br />
derived from the ubiquitin C terminus. The three C-terminal<br />
residues of ubiquitin are Arg-Gly-Gly, with the C-terminal glycine<br />
conjugated to a lysine residue in the target. After digestion with<br />
trypsin, ubiquitin is cleaved after arginine, leaving a Gly-Gly dipeptide<br />
remnant on the conjugated lysine. Therefore, tryptic digests<br />
will include peptides that contain a diglycine-modified lysine,<br />
indicating the prior conjugation of ubiquitin to that region of the<br />
target protein. The diglycine-modified lysine serves as a signature<br />
of ubiquitination and also identifies the specific site of modification.<br />
Sequencing of ubiquitin remnant–containing peptides in tryptic<br />
digests has been used to identify 110 ubiquitination sites from<br />
yeast expressing His 6 -ubiquitin 7 . Despite the availability of these<br />
approaches for several years, analysis of the Swiss-Prot database<br />
indicates that only 255 mammalian proteins have been reported to<br />
be ubiquitinated based on experimental evidence. In most cases, the<br />
ubiquitination sites have not been identified. Direct enrichment of<br />
ubiquitin remnant–containing peptides would facilitate the highthroughput<br />
identification of ubiquitination sites.<br />
To identify ubiquitinated proteins and simultaneously report their<br />
sites of ubiquitination, we generated an antibody that recognizes<br />
peptides containing the ubiquitin remnant left after trypsin digestion<br />
of ubiquitinated proteins. To prepare a protein antigen containing<br />
diglycine-modified lysines, we first reacted purified lysine-rich histone<br />
III-S protein with t-butyloxycarbonyl-Gly-Gly-N-hydroxysuccinimide<br />
(Boc-Gly-Gly-NHS) to introduce amide-linked Boc-Gly-Gly adducts<br />
on all amines (Fig. 1a). Nearly complete modification of the amines was<br />
confirmed by the reduction in labeling of the Boc-Gly-Gly–modified<br />
protein by the lysine-modifying reagent biotin-NHS, as assessed by<br />
anti-biotin immunoblotting (Fig. 1b). The modified protein was treated<br />
with trifluoroacetic acid (TFA) to remove the Boc moiety. Quantitative<br />
Department of Pharmacology, Weill Medical College, Cornell University, New York, New York, USA. Correspondence should be addressed to S.R.J.<br />
(srj2003@med.cornell.edu).<br />
Received 25 March; accepted 11 June; published online 18 July 2010; doi:10.1038/nbt.1654<br />
868 VOLUME 28 NUMBER 8 AUGUST 2010 nature biotechnology
l e t t e r s<br />
© 2010 <strong>Nature</strong> America, Inc. All rights reserved.<br />
Figure 1 Generation of monoclonal antibodies that selectively recognize<br />
diglycine-modified lysines. (a) The antigen used to raise antibodies was<br />
synthesized by modifying the ε-amines of all lysines in a histone with<br />
t-butyloxycarbonyl-Gly-Gly-N-hydroxysuccinimide (Boc-Gly-Gly-NHS)<br />
and then removing the Boc group by treatment with TFA. The lysines<br />
in the final protein contain Gly-Gly adducts on the ε-amine of all lysine<br />
residues. (b) To validate the synthesis of Gly-Gly–modified histone,<br />
we monitored the reaction of the histone with Boc-Gly-Gly-NHS by<br />
detecting amines, such as those in unmodified lysine, through the<br />
reaction of the protein with the amine-modifying agent biotin-NHS,<br />
and subsequent western blot analysis with an anti-biotin antibody.<br />
Amines in the histone were completely lost after treatment with<br />
Boc-Gly-Gly-NHS, indicating complete modification of all the<br />
lysines in the histone. Removal of the Boc protecting group with<br />
TFA resulted in the formation of an amine at the N terminus of the<br />
Gly-Gly adduct. This step was essentially complete, as the TFA-treated<br />
protein exhibited nearly complete recovery of amine reactivity.<br />
The position of the bands in the different samples is slightly<br />
shifted due to the different molecular weights and number of<br />
positive charges in the modified and unmodified samples. The<br />
bands above 50 kDa represent impurities in the histone sample.<br />
(c) We evaluated the specificity of the GX41 monoclonal antibody by western blot analysis of β-lactoglobulin, lysozyme or rat brain lysate, in which<br />
the lysines were either unmodified (A), or modified with Boc-Gly-Gly (B) or Gly-Gly- (C) adducts, respectively.<br />
conversion of the Boc-Gly-Gly adduct, which does not contain an<br />
amine, to Gly-Gly, which contains an amine, was confirmed by the<br />
reactivity of the TFA-treated protein with biotin-NHS (Fig. 1b).<br />
We injected the diglycine-modified histone into mice, and screened<br />
hybridoma lines for antibodies that specifically recognize proteins<br />
containing diglycine-modified lysines. Hybridoma line GX41 generated<br />
monoclonal antibodies that exhibited pronounced specificity for<br />
proteins containing the diglycine-modified lysines. The antibodies<br />
failed to interact with unmodified lysozyme or lactoglobulin (Fig. 1c),<br />
or either of these proteins after they have been modified with Boc-Gly-<br />
Gly. However, the antibody recognized Gly-Gly–modified lysozyme<br />
and lactoglobulin obtained after removal of the Boc group.<br />
These results indicate that the antibody recognizes Gly-Gly–modified<br />
lysines, and suggest that the antibody only recognizes Gly-Gly adducts<br />
that contain an unmodified primary amine. Similarly, the antibody<br />
exhibits negligible reactivity with rat brain lysate (Fig. 1c), or brain<br />
lysate modified with Boc-Gly-Gly, but exhibits substantial reactivity<br />
with Gly-Gly–modified proteins from brain lysate. Notably, the brain<br />
lysate includes highly abundant proteins containing internal Gly-<br />
Gly peptide sequences, such as β-actin, glyceraldehyde-3-phosphate<br />
dehydrogenase and α-tubulin, as well as histone H2A, which contains<br />
an internal Gly-Gly-Lys sequence. This indicates that internal Gly-Gly<br />
sequences are not recognized by the antibody. Additionally, peptides<br />
that contain Gly-Gly as the first two amino acids are not recognized<br />
(Supplementary Fig. 1). Together, these data indicate that the antibody<br />
recognizes Gly-Gly sequences that are present as an adduct on<br />
the ε-amine of lysine.<br />
We next investigated whether the anti–diglycyl-lysine antibody was<br />
able to immunoprecipitate peptides containing Gly-Gly–modified lysine.<br />
A flow chart for sample preparation, immunoprecipitation, and MS/MS<br />
analysis is shown in Figure 2a. We prepared a peptide containing an<br />
N-terminal Gly-Gly sequence (GGDRVYIHPFHL), and a peptide containing<br />
a diglycyl adduct on lysine (Ac-SYSMEHFRWGK*PV-NH 2 ; K*<br />
and Ac represent Gly-Gly–modified lysine and an acetyl group, respectively).<br />
An equimolar mixture of the peptides was immunoprecipitated<br />
with the anti–diglycyl-lysine antibody, resulting in selective enrichment<br />
(≥50×) of the peptide containing the Gly-Gly–modified lysine (Fig. 2b).<br />
Additionally, this peptide was quantitatively immunoprecipitated<br />
with a nearly 100% yield (Supplementary Fig. 2). These experiments<br />
a<br />
NH 2<br />
NH 2<br />
NH<br />
NH<br />
NH<br />
NH 2<br />
NH<br />
NH 2<br />
Boc-Gly-Gly-NHS<br />
NH<br />
TFA<br />
NH<br />
NH<br />
NH<br />
Boc-Gly-Gly-<br />
Boc-Gly-Gly-<br />
Boc-Gly-Gly-<br />
Boc-Gly-Gly-<br />
Gly-Gly-<br />
Gly-Gly-<br />
Gly-Gly-<br />
Gly-Gly-<br />
Histone<br />
Boc-Gly-Gly-NHS<br />
TFA<br />
Biotin-NHS<br />
demonstrated that the GX41 antibody is capable of enriching peptides<br />
containing diglycine-modified lysines and does not immunoprecipitate<br />
peptides containing a Gly-Gly sequence at their N termini.<br />
We next sought to assess the diversity of lysine ubiquitination in<br />
cultured cells. To distinguish diglycine remnants derived from ubiquitin<br />
from those originating from less common ubiquitin-like proteins<br />
(such as ISG15 and NEDD8, which also leave a diglycine remnant<br />
on lysines after trypsinization 8 ), we used HEK293 cells expressing<br />
His 6 -tagged ubiquitin. Ubiquitinated proteins were purified<br />
by immobilized metal-affinity chromatography, before proteolysis<br />
and anti–diglycyl-lysine immunopurification. Ubiquitin remnant–<br />
containing peptides were subjected to liquid chromatography (LC)-<br />
MS/MS followed by database searching and spectral validation. To<br />
minimize alterations in ubiquitination levels after cell lysis, 5 mM<br />
chloroacetamide was included in lysis buffer to inhibit deubiquitinase<br />
and ubiquitin ligase activity 9 . To measure post-lysis ubiquitination,<br />
we spiked a lysate with excess glutathione S-transferase. This protein<br />
showed no detectable level of ubiquitination (Supplementary Fig. 3),<br />
suggesting that negligible ubiquitination occurred after cell lysis.<br />
MS/MS spectra of ubiquitin remnant–containing peptides exhibited<br />
normal y- and b-ion series, typically with a pair of ions separated by<br />
a mass of 242.14 Da, consistent with the masses of a lysine residue<br />
(128.09) and a Gly-Gly adduct (114.04 Da) on the ε-amine of lysine.<br />
Whereas most peptides contained a single diglycine-modified lysine<br />
(Fig. 2c), 17 peptides contained two diglycine-modified lysines. The<br />
majority (>92%) of ubiquitin remnant–containing peptides have a +3 or<br />
+4 charge (Supplementary Fig. 4), which reflects the additional charge<br />
from the N-terminal amine on the Gly-Gly adduct. Gly-Gly–modified<br />
lysines as the C-terminal residue of peptides were also detected (~2% of<br />
total) (Supplementary Fig. 5), and reflect use of the Gly-Gly–modified<br />
lysine as a substrate for trypsin, as described previously 10 .<br />
In total, we identified 374 diglycine-modified lysines on 236 ubiquitinated<br />
mammalian proteins. Analysis of the Swiss-Prot database<br />
suggests that 72% of these proteins were not previously known to<br />
be ubiquitinated. Similarly, 92% of the ubiquitination sites that we<br />
identified were not previously known. Among the identified proteins,<br />
156 proteins have one ubiquitination site and 80 have two or more<br />
ubiquitination sites (Supplementary Table 1 and Supplementary<br />
Fig. 6). To validate the ubiquitination detected using the ubiquitin<br />
b<br />
WB: anti-biotin<br />
c<br />
180<br />
115<br />
82<br />
64<br />
49<br />
37<br />
26<br />
15<br />
6<br />
250<br />
150<br />
100<br />
75<br />
50<br />
37<br />
25<br />
15<br />
A B C<br />
– + +<br />
– –<br />
+ +<br />
+<br />
β-Lact Lysozyme<br />
A B C A B C Brain lysate<br />
A B C<br />
185<br />
98<br />
52<br />
31<br />
19<br />
17<br />
14<br />
WB: anti–diglycyl-lysine<br />
nature biotechnology VOLUME 28 NUMBER 8 AUGUST 2010 869
l e t t e r s<br />
© 2010 <strong>Nature</strong> America, Inc. All rights reserved.<br />
Figure 2 Profiling immunopurified ubiquitin<br />
remnant–containing peptides to identify<br />
ubiquitinated proteins. (a) Strategy to identify<br />
ubiquitinated proteins by immunoprecipitation<br />
of peptides containing diglycyl-lysine,<br />
followed by MS analysis. (b) Confirmation<br />
of antibody specificity using two peptides,<br />
GGDRVYIHPFHL and Ac-SYSMEHFRWGK*PV-<br />
NH 2 . Equimolar amounts (0.3 nmol) of the two<br />
peptides were mixed and immunoprecipitated<br />
with immobilized anti–diglycyl-lysine<br />
monoclonal antibody. Matrix-assisted laser<br />
desorption ionization/time-of-flight (MALDI-<br />
TOF)-MS analysis for the starting material<br />
and the antibody-purified material suggests<br />
an enrichment factor of at least 50, based on<br />
the comparison of the MS signals of the two<br />
peptides before and after immunoprecipitation.<br />
(c) Representative annotated MS/MS spectra<br />
of two ubiquitin remnant–containing peptides<br />
obtained by immunoprecipitation from a<br />
HEK293 cell lysate. The sequence of<br />
the ubiquitinated peptide, including the<br />
diglycine-modified lysine (K * ), is indicated<br />
and the fragment ions are labeled. The<br />
symbols \, / and | represent b-ions, y-ions,<br />
and both b-ions and y-ions, respectively.<br />
(d) Biochemical verification of the<br />
ubiquitination of six proteins. Proteins were<br />
immunoprecipitated using target-specific<br />
antibodies and the immunoprecipitate<br />
was detected by western blotting using an<br />
anti-ubiquitin antibody. IgG was used as a<br />
control for nonspecific immunoprecipitation.<br />
The proteasome inhibitor N-acetyl-Leu-<br />
Leu-norleucinal (LLnL) was added to allow<br />
accumulation of the ubiquitinated protein.<br />
remnant–profiling approach, we selected a subset of six proteins identified<br />
by MS and assessed whether they were ubiquitinated in cells.<br />
Lysates from HEK293 cells were immunoprecipitated with antibodies<br />
specific for the protein under investigation and immunoblotted<br />
using an anti-ubiquitin antibody (Fig. 2d). In these experiments, the<br />
HEK293 cells were not transfected with plasmids expressing His 6 -<br />
tagged ubiquitin. In each case, the immunopurified protein exhibits<br />
anti-ubiquitin immunoreactivity consistent with the endogenous<br />
ubiquitination of these proteins.<br />
The ubiquitination targets include disease-related proteins, such<br />
as 14-3-3ε, ataxin, β-catenin, BRCA1-associated protein and TTRAP<br />
(TRAF and TNF receptor-associated protein). The proteins identified<br />
by ubiquitin remnant profiling have roles in numerous biological<br />
processes, of which the largest number involve metabolism, cell cycle/<br />
apoptosis and signal transduction (Fig. 3a). Additionally, we identified<br />
proteins that influence the trafficking, localization and structure of<br />
proteins, as well as regulate the immune system, consistent with previously<br />
reported roles for ubiquitination 11–14 . Ubiquitination of many<br />
ubiquitin-conjugating enzymes, ubiquitin ligases and 26S proteasome<br />
regulatory subunits also supports previous studies that reported the<br />
prevalence of ubiquitination of proteins involved in proteasome<br />
degradation pathways 15,16 . Some of the proteins found to be ubiquitinated<br />
extend earlier findings regarding the role of ubiquitination in<br />
certain cellular processes. For example, although histone H2 ubiquitination<br />
has been described 3 , we found that histone H1, H3 and H4 isoforms<br />
are also ubiquitinated, as are subunits of histone acetyltransferases and<br />
histone deacetylases. These findings support the idea that ubiquitin<br />
a<br />
b<br />
Relative intensity<br />
Relative intensity<br />
Trypsin<br />
digestion<br />
Immunopurification<br />
Ub(RGG-)HN<br />
GG<br />
K<br />
GG<br />
K<br />
nLC-MS/MS analysis<br />
Before purification<br />
100<br />
GGDRVYIHPFHL<br />
Ac-SYSMEHFRWGK*PV-NH 2<br />
80<br />
60<br />
Met-Ox<br />
40<br />
20<br />
+Na<br />
0<br />
1,000 1,200 1,400 1,600 1,800 2,000<br />
m/z<br />
After purification<br />
100<br />
Ac-SYSMEHFRWGK*PV-NH 2<br />
80<br />
60<br />
40<br />
Met-Ox<br />
20<br />
0<br />
1,000 1,200 1,400 1,600 1,800 2,000<br />
m/z<br />
c<br />
Relative intensity<br />
Relative intensity<br />
4<br />
b<br />
60S ribosomal protein L7a<br />
GA|L|A| 217 K*|L|V|E/A/I/R<br />
100 R I A E V L<br />
K*<br />
80<br />
y<br />
60<br />
a 2 y 1<br />
y y<br />
40<br />
3<br />
5 y<br />
y 6<br />
2 -NH 3<br />
y<br />
y 5<br />
2+ 4<br />
y 1<br />
y 2 y y<br />
20<br />
3 6<br />
2+<br />
b 2+<br />
2 b y y 6 y 7 7 4 y y8<br />
11<br />
20<br />
b b 3 y 2<br />
2+<br />
2+ y<br />
y 8<br />
7<br />
2+<br />
y 9 2 2+<br />
a 7 b 4<br />
b 5 6<br />
b y 7<br />
0<br />
7<br />
100 200 300 400 500 600 700 800 900 1,000<br />
m/z<br />
Splicing factor, arginine/serine-rich 1<br />
a<br />
100<br />
2 DI|ED\V/F/Y/ 38 K*/Y/G/A/I/R<br />
80<br />
R I A G Y K*<br />
Y F<br />
60<br />
40<br />
0<br />
200 400 600 800 1,000 1,200<br />
m/z<br />
d<br />
Western blotting: ubiquitin<br />
IP: β-14-3-3 IgG IP: Vimentin IgG<br />
LLnL – + – + LLnL – + – +<br />
250<br />
250<br />
150<br />
150<br />
100<br />
75<br />
100<br />
75<br />
50<br />
IP: NAP1L1 IgG IP: PARP1 IgG<br />
LLnL<br />
250<br />
– + – + LLnL – + – +<br />
150<br />
250<br />
100<br />
150<br />
75<br />
100<br />
50<br />
IP: HSP70 IgG IP: β-Catenin IgG<br />
LLnL – + – + LLnL – + – +<br />
250<br />
150<br />
100<br />
75<br />
250<br />
150<br />
100<br />
contributes to epigenetic gene regulation through multiple pathways.<br />
Many heat shock proteins, such as HSP70, HSP105, and<br />
HSC71, are ubiquitinated, linking ubiquitination to stress responses.<br />
Ubiquitination of several heterogeneous nuclear ribonucleoproteins<br />
reveals a role for ubiquitination in mRNA processing, metabolism,<br />
transport and splicing. Our studies also identify numerous transcription<br />
factors, splicing factors, DNA repair proteins and kinases. This<br />
supports the well-characterized role for ubiquitination in regulating<br />
cellular signal transduction.<br />
The subcellular distribution of the detected proteins is likely to<br />
reflect, in part, the subcellular fractions that were used for MS/MS<br />
analysis. Subcellular localization analysis of the identified proteins<br />
indicates that essentially all the ubiquitinated proteins are cytosolic<br />
(Fig. 3a, right panel), which is consistent with the general observation<br />
that ubiquitination occurs primary in the cytosolic compartment of the<br />
cell 12 . Many of the identified proteins are localized to the nucleus, and<br />
several proteins are localized to the mitochondria, suggesting a role for<br />
ubiquitination in regulating aspects of mitochondrial function.<br />
We next wanted to gain insight into how lysine ubiquitination<br />
might be regulated at the level of primary and secondary structure.<br />
Interestingly, ubiquitin remnant–modified lysines have a slight<br />
tendency to be localized in regions enriched in small hydrophobic<br />
residues, such as alanine, leucine, isoleucine, glycine, proline and<br />
valine (Supplementary Fig. 7a). Examination of a six-amino-acid<br />
window adjacent to ubiquitinated lysines in the human proteome<br />
revealed that cysteine, histidine and lysine are found at a ~40%<br />
lower frequency than when they are adjacent to lysines in general<br />
75<br />
870 VOLUME 28 NUMBER 8 AUGUST 2010 nature biotechnology
l e t t e r s<br />
© 2010 <strong>Nature</strong> America, Inc. All rights reserved.<br />
Figure 3 Bioinformatic analysis of ubiquitinated<br />
proteins and ubiquitin-modified lysines. (a) Pie<br />
charts of biological processes and subcellular<br />
localization of ubiquitinated proteins analyzed<br />
using the PANTHER and PENCE Proteome<br />
Analyst databases, respectively. Proteins were<br />
designated ‘other’ if their localizations or<br />
functions were not annotated in the database.<br />
(b) Backbone amino acid sequence analysis<br />
of ubiquitinated peptides. A density map of<br />
the ratios of the frequencies of each of the<br />
20 amino acids adjacent to the ubiquitinated<br />
lysines and adjacent to lysines in general was<br />
plotted using MATLAB. Several amino acids<br />
are slightly enriched at certain positions,<br />
such as leucine at +2, valine at −2, alanine<br />
at −5, glycine at +6, and tyrosine at −1 and<br />
+1, determined by Rosner’s test with a 95%<br />
confidence. (c) Ubiquitinated lysines (Ub<br />
Lys) possess an increased solvent accessible<br />
area (SAA) relative to lysines in general. The<br />
distribution of SAA of both populations of lysines indicates an increase in SAA among ubiquitinated lysines. The two distributions are significantly<br />
different (Student’s t test, P < 0.001). The results were obtained from an analysis of 89 PDB structures (140 ubiquitinated lysines, 3,970 total lysines).<br />
(d) Distribution of secondary structures of all lysines and ubiquitinated lysines obtained from an analysis of 89 PDB structures. The disordered region<br />
was predicted by DisEMBL for all ubiquitinated proteins identified by our MS experiments. χ 2 test: P < 0.001.<br />
(Supplementary Fig. 7a). Analysis involving Motif-x 17 identified<br />
K*XL as a potential consensus ubiquitination site. This motif appears<br />
to be ~1.8 times more common among ubiquitinated lysines than<br />
lysines in general (Supplementary Fig. 7b). To compare all 20 amino<br />
acids for their propensity to be found at specific residues adjacent to<br />
ubiquitinated lysines, we prepared a density map that indicates the<br />
frequency of each amino acid at any of the ten proximal positions on<br />
either side of the ubiquitinated lysines, compared to the frequency of<br />
that amino acid next to lysines in general, as assessed by surveying<br />
the human proteome (Fig. 3b). This analysis shows that there is only<br />
a subtle enrichment for specific residues at some positions, such as<br />
leucine at the +2 position, valine at the −2 position, alanine at the −5<br />
position, glycine at the +6 position, and tyrosine at the −1 and +1<br />
positions. In contrast, an analysis of ubiquitinated proteins in yeast 7<br />
indicates an significant enrichment of aspartic acid, glutamic acid,<br />
histidine and proline at some positions (Supplementary Fig. 7c).<br />
To determine whether the sequence of the immunogen affected the<br />
specificity of the immunoprecipitated peptides, we generated a similar<br />
density map to present the frequency of each amino acid adjacent to<br />
the Gly-Gly–modified lysines in the immunogen. Although there are<br />
a<br />
Metabolism<br />
(49.6%)<br />
Cell cycle/apoptosis (13.0%)<br />
Structure (4.4%)<br />
Small-molecule transport (2.3%)<br />
Immunity/defence (4.2%)<br />
Protein trafficking/localization (8.3%)<br />
Other/unclassified (9.1%)<br />
Signal transduction (9.1%)<br />
Mitochondria<br />
(3.6%)<br />
Endoplamic<br />
reticulum (2.4%)<br />
b c d<br />
A<br />
CDE<br />
F<br />
G<br />
H<br />
K L<br />
M<br />
NP<br />
Q<br />
RSTV<br />
W<br />
YK<br />
I<br />
–10 –5 0 5 10<br />
2.5<br />
2.0<br />
1.5<br />
1.0<br />
0.5<br />
0<br />
Percentage<br />
40<br />
30<br />
20<br />
10<br />
0<br />
All Lys<br />
Ub Lys<br />
0–20<br />
20–40<br />
40–60<br />
60–80<br />
80–100<br />
Relative solvent accessible area (%)<br />
Cytoplasm (48.2%)<br />
Nucleus (28.7%)<br />
Plasma<br />
membrane (1.2%)<br />
Other (15.8%)<br />
Golgi (2.4%)<br />
All Lys<br />
0.6<br />
Ub Lys<br />
0.5<br />
0.4<br />
0.3<br />
0.2<br />
0.1<br />
0.0<br />
Helix Strand Coil Disordered<br />
marked amino acid preferences adjacent to lysine in the immunogen<br />
(Supplementary Fig. 7d), these preferences are not seen in peptides<br />
pulled down by the anti–diglycyl-lysine antibody (Supplementary<br />
Fig. 7d). This suggests that the sequence of the immunogen used to<br />
generate our immunoaffinity reagent does not substantially bias the<br />
sequences of the immunoprecipitated peptides the antibody recovers.<br />
We found that ubiquitinated lysines have a slight tendency to appear<br />
on protein surfaces in preferred structural contexts. Structural information<br />
is available in Protein Data Bank (PDB) for 89 of the proteins<br />
identified in this study. Measurements of the solvent-accessible area<br />
of lysines in these proteins indicate that ubiquitinated lysines tend<br />
to be exposed slightly more to solvent than other lysines (Fig. 3c,<br />
Student’s t test, P < 0.001). If lysines with >50% surface exposure are<br />
considered solvent exposed 18 , 60% of the ubiquitinated lysines are<br />
exposed, which is more than for lysines in general (45%). Overall,<br />
ubiquitinated lysines are ~6.5% more exposed than all the lysines.<br />
This is in agreement with a ubiquitination site survey for yeast 19 .<br />
Interestingly, in some cases, the ubiquitinated lysine is fully buried<br />
(e.g., Supplementary Fig. 8). In these proteins, ubiquitination may<br />
be regulated by stimuli that induce the exposure of the lysine to the<br />
Fraction<br />
Relative intensity<br />
Relative intensity<br />
1.0<br />
0.8<br />
0.6<br />
0.4<br />
0.2<br />
0<br />
1.0<br />
0.8<br />
0.6<br />
0.4<br />
0.2<br />
0<br />
Lys0 Lys8 DLSHIGDAVVISCA 164 K*DGVK<br />
Lys0:Lys8 = 1.08 ± 0.05<br />
524 526 528 530<br />
m/z<br />
Lys0<br />
532 534<br />
YYLAP 254 K*IEDEEGS<br />
Lys0:Lys8 = 1.47 ± 0.09<br />
Lys8<br />
814 816 818 820 822<br />
m/z<br />
Figure 4 Colchicine differentially regulates the ubiquitination of two<br />
lysines in PCNA. HEK293 cells were grown in SILAC medium containing<br />
either light (Lys0) or heavy (Lys8) lysine, and transfected with a plasmid<br />
expressing His 6 -ubiquitin. Whereas Lys0-labeled cells were treated with<br />
10 μM colchicine, Lys8-labeled cells were treated with vehicle for 16 h.<br />
Identical amounts of cells from each treatment were mixed and processed<br />
for MS analysis of ubiquitin remnant–containing peptides. The relative<br />
ratio of MS signals between Lys0- and Lys8-labeled peptides was used<br />
for relative quantification of the change in ubiquitination at K164 and<br />
K254. The observed ratio was normalized to the change in PCNA protein<br />
abundance in the two samples by measuring two unmodified PCNA<br />
peptides in the initial mixed cell lysate (Supplementary Fig. 11). The<br />
observation that the ion intensity of the novel ubiquitination site (K254)<br />
is about 20% of that of K164 suggests that its ubiquitination may be less<br />
common or more transient than K164. This may explain why it was not<br />
detected previously in mutagenesis studies 33 . All data are the averages<br />
of experiments repeated three times. Note that the peptide ubiquitinated<br />
at K254 is the C-terminal tryptic peptide of the protein so that the last<br />
amino acid is neither K nor R, and the charge state of this peptide is +2.<br />
nature biotechnology VOLUME 28 NUMBER 8 AUGUST 2010 871
l e t t e r s<br />
© 2010 <strong>Nature</strong> America, Inc. All rights reserved.<br />
surface. Analysis of the local secondary structure surrounding all<br />
lysines and ubiquitinated lysines indicates that ubiquitinated lysines<br />
prefer helical structures compared to all lysines, although ubiquitination<br />
sites can also be found in other structural contexts (Fig. 3d).<br />
Additional crystal structures of proteins that are susceptible to ubiquitination<br />
are needed to fully assess the solvent exposure and structural<br />
contexts of ubiquitinated lysines.<br />
Recently, a large number of lysine acetylation sites have been discovered<br />
by proteomic approaches 20–23 . Although only 0.6% of lysines<br />
are predicted to be acetylated based on yeast studies 24 , >20% of the<br />
lysines that we found to be ubiquitinated are also sites of acetylation.<br />
For example, all the ubiquitinated lysines in H2B, H3.1 and H4 were<br />
reported to be acetylated. In the case of tubulin α-1A, four of the six<br />
ubiquitinated lysines were reported to be acetylated. The surprisingly<br />
high degree of concordance of lysine ubiquitination and acetylation<br />
sites suggests that acetylation of a specific lysine residue could serve<br />
as a means to prevent lysine ubiquitination 25 , or vice versa. A BLAST<br />
analysis of ubiquitination sites in human proteins against mouse, rat<br />
and yeast revealed that modified lysines are statistically more conserved<br />
between these species than lysines in general (Supplementary<br />
Fig. 9). This suggests that the pathways leading to the ubiquitination<br />
of these sites may be evolutionarily conserved.<br />
In cases where a protein is ubiquitinated at more than one site, it is<br />
particularly challenging to monitor how the ubiquitination at the individual<br />
sites is independently regulated. We therefore examined two<br />
proteins exhibiting multi-ubiquitination: tubulin α-1A and PCNA,<br />
a protein that regulates cell cycle progression 26 and has been linked<br />
to tumorigenesis 27 . We labeled His 6 -ubiquitin-expressing HEK293T<br />
cells with either light (Lys0) or heavy (Lys8) lysine to quantify ubiquitination<br />
using the SILAC (stable isotope labeling by amino acids in<br />
cell culture) approach 28 (Supplementary Fig. 10). We treated cells for<br />
16 h with either vehicle (Lys8) or 10 μM colchicine (Lys0), an inhibitor<br />
of microtubule polymerization that affects progression through the<br />
cell cycle 29 , before mixing, lysing and processing cells as described in<br />
the Online Methods. We then analyzed the samples by nanoLC-MS<br />
to quantify ubiquitination at the PCNA ubiquitination sites that we<br />
had previously identified using MS/MS based on their retention time,<br />
mass-to-charge ratio (m/z) and charge states. We quantified relative<br />
ubiquitination at each modification site by normalization using protein<br />
abundance, as measured by the averaged light-to-heavy ratio of<br />
unmodified peptides detected from initial mixed cell lysate before any<br />
affinity purification 30 (Supplementary Fig. 11). Interestingly, whereas<br />
the ubiquitination of K164 was unaffected by colchicine treatment,<br />
the ubiquitination of K254 was increased by 47% (Fig. 4).<br />
We also examined the multi-ubiquitination of tubulin α-1A.<br />
Treatment with colchicine resulted in a similar ~80% decrease in<br />
the ubiquitination of K326, K336 and K370. Surprisingly, treatment<br />
with vinblastine, which also disrupts microtubules, albeit through a<br />
distinct mechanism 31,32 , resulted in an opposite effect on ubiquitination,<br />
with a ~40% increase in ubiquitination at each of these sites<br />
(Supplementary Figs. 12 and 13). These results highlight how some<br />
ubiquitination sites may be ubiquitinated in a dynamic manner, for<br />
example, in response to specific signals, whereas other ubiquitination<br />
sites may be ‘constitutive’. In the case of both PCNA and tubulin α-1A,<br />
ubiquitin remnant profiling provided insights into how distinct<br />
ubiquitination sites respond to different experimental treatments in<br />
a manner not readily available using currently available approaches.<br />
The ubiquitin remnant–profiling approach described here provides<br />
a simple and robust strategy to identify and quantify sites of ubiquitination<br />
in cells. It could be used to identify ubiquitination patterns<br />
in cells and tissues with altered expression of ubiquitin ligases,<br />
deubiquitinating enzymes, as well as to profile changes in ubiquitination<br />
elicited by various signaling molecules, drugs and disease states.<br />
Although the present data used cells expressing His 6 -tagged ubiquitin<br />
to reduce the likelihood of obtaining diglycine-modified peptides from<br />
ISG15- and NEDD8-modified proteins, ubiquitin-modified proteins<br />
could readily be enriched using immobilized ubiquitin-binding<br />
proteins, such as S5a, or ubiquitin antibodies 5 in cells and tissues not<br />
amenable to transfection.<br />
Methods<br />
Methods and any associated references are available in the online<br />
version of the paper at http://www.nature.com/naturebiotechnology/.<br />
Accession code. MS/MS data and the identifications are deposited<br />
in the open access public repository PRIDE (http://www.ebi.ac.uk/<br />
pride/) with the accession code of 12018.<br />
Note: Supplementary information is available on the <strong>Nature</strong> Biotechnology website.<br />
Acknowledgments<br />
We thank T. Neubert and G. Zhang (New York University) for useful suggestions,<br />
P. Zhou (Weill Cornell Medical College, WCMC) for the His 6 -ubiquitin plasmid,<br />
U. Hengst, A. Deglincerti, R. Almeida and B. Derakhshan for the assistance<br />
during initial cell culturing, S. Gross and Y. Ma (WCMC Mass Spectrometry Core<br />
Facility) for helpful discussion in MS/MS analysis, F. Campagne, L. Skrabanek,<br />
J. Sun (WCMC Institute for Computational Biomedicine) for instructions and<br />
assistance in bioinformatic analysis. The mass spectrometry work was performed<br />
at the WCMC Mass Spectrometry Core Facility using instrumentation supported<br />
by US National Institutes of Health (NIH) RR19355 and RR22615. This work<br />
was supported by grants from Weill Cornell, NIH (MH086128) (S.R.J.), and<br />
a pharmacology cancer training grant from the National Cancer Institute<br />
(T32CA062948) (G.X. and J.S.P.).<br />
AUTHOR CONTRIBUTIONS<br />
S.R.J. and G.X. conceived and designed the study. G.X. and J.S.P. conducted<br />
the experiments, and G.X. and S.R.J. analyzed the data. S.R.J. and G.X. wrote<br />
the manuscript.<br />
COMPETING FINANCIAL INTERESTS<br />
The authors declare no competing financial interests.<br />
Published online at http://www.nature.com/naturebiotechnology/.<br />
Reprints and permissions information is available online at http://npg.nature.com/<br />
reprintsandpermissions/.<br />
1. Hershko, A. & Ciechanover, A. The ubiquitin system. Annu. Rev. Biochem. 67,<br />
425–479 (1998).<br />
2. Xu, P. & Peng, J. Dissecting the ubiquitin pathway by mass spectrometry. Biochim.<br />
Biophys. Acta 1764, 1940–1947 (2006).<br />
3. Ericsson, C., Goldknopf, I.L. & Daneholt, B. Inhibition of transcription does not<br />
affect the total amount of ubiquitinated histone 2A in chromatin. Exp. Cell Res.<br />
167, 127–134 (1986).<br />
4. Galluzzi, L., Paiardini, M., Lecomte, M.C. & Magnani, M. Identification of the main<br />
ubiquitination site in human erythroid alpha-spectrin. FEBS Lett. 489, 254–258<br />
(2001).<br />
5. Tomlinson, E., Palaniyappan, N., Tooth, D. & Layfield, R. Methods for the purification<br />
of ubiquitinated proteins. Proteomics 7, 1016–1022 (2007).<br />
6. Beers, E.P. & Callis, J. Utility of polyhistidine-tagged ubiquitin in the purification<br />
of ubiquitin-protein conjugates and as an affinity ligand for the purification of<br />
ubiquitin-specific hydrolases. J. Biol. Chem. 268, 21645–21649 (1993).<br />
7. Peng, J. et al. A proteomics approach to understanding protein ubiquitination.<br />
Nat. Biotechnol. 21, 921–926 (2003).<br />
8. Srikumar, T., Jeram, S.M., Lam, H. & Raught, B. A ubiquitin and ubiquitin-like<br />
protein spectral library. Proteomics 10, 337–342 (2010).<br />
9. Hershko, A., Heller, H., Elias, S. & Ciechanover, A. Components of ubiquitin-protein<br />
ligase system. Resolution, affinity purification, and role in protein breakdown.<br />
J. Biol. Chem. 258, 8206–8214 (1983).<br />
10. Denis, N.J., Vasilescu, J., Lambert, J.P., Smith, J.C. & Figeys, D. Tryptic digestion<br />
of ubiquitin standards reveals an improved strategy for identifying ubiquitinated<br />
proteins by mass spectrometry. Proteomics 7, 868–874 (2007).<br />
11. Rechsteiner, M. Ubiquitin-mediated pathways for intracellular proteolysis. Annu.<br />
Rev. Cell Biol. 3, 1–30 (1987).<br />
12. Bonifacino, J.S. & Weissman, A.M. Ubiquitin and the control of protein fate in the<br />
secretory and endocytic pathways. Annu. Rev. Cell Dev. Biol. 14, 19–57 (1998).<br />
872 VOLUME 28 NUMBER 8 AUGUST 2010 nature biotechnology
l e t t e r s<br />
13. Kirkpatrick, D.S., Denison, C. & Gygi, S.P. Weighing in on ubiquitin: the expanding<br />
role of mass-spectrometry-based proteomics. Nat. Cell Biol. 7, 750–757 (2005).<br />
14. Sun, L. & Chen, Z.J. The novel functions of ubiquitination in signaling. Curr. Opin.<br />
Cell Biol. 16, 119–126 (2004).<br />
15. Etlinger, J.D., Li, S.X., Guo, G.G. & Li, N. Phosphorylation and ubiquitination of<br />
the 26S proteasome complex. Enzyme Protein 47, 325–329 (1993).<br />
16. Peters, J.M. Subunits and substrates of the anaphase-promoting complex. Exp. Cell<br />
Res. 248, 339–349 (1999).<br />
17. Schwartz, D. & Gygi, S.P. An iterative statistical approach to the identification of<br />
protein phosphorylation motifs from large-scale data sets. Nat. Biotechnol. 23,<br />
1391–1398 (2005).<br />
18. Ahmad, S. & Gromiha, M.M. NETASA: neural network based prediction of solvent<br />
accessibility. Bioinformatics 18, 819–824 (2002).<br />
19. Catic, A., Collins, C., Church, G.M. & Ploegh, H.L. Preferred in vivo ubiquitination<br />
sites. Bioinformatics 20, 3302–3307 (2004).<br />
20. Choudhary, C. et al. Lysine acetylation targets protein complexes and co-regulates<br />
major cellular functions. Science 325, 834–840 (2009).<br />
21. Gnad, F. et al. PHOSIDA (phosphorylation site database): management, structural<br />
and evolutionary investigation, and prediction of phosphosites. Genome Biol. 8,<br />
R250 (2007).<br />
22. Kim, S.C. et al. Substrate and functional diversity of lysine acetylation revealed by<br />
a proteomics survey. Mol. Cell 23, 607–618 (2006).<br />
23. Zhao, S. et al. Regulation of cellular metabolism by protein lysine acetylation.<br />
Science 327, 1000–1004 (2010).<br />
24. Basu, A. et al. Proteome-wide prediction of acetylation substrates. Proc. Natl. Acad.<br />
Sci. USA 106, 13785–13790 (2009).<br />
25. Yang, X.J. & Seto, E. Lysine acetylation: codified crosstalk with other posttranslational<br />
modifications. Mol. Cell 31, 449–461 (2008).<br />
26. Prosperi, E. Multiple roles of the proliferating cell nuclear antigen: DNA replication,<br />
repair and cell cycle control. Prog. Cell Cycle Res. 3, 193–210 (1997).<br />
27. Mayer, A. et al. The prognostic significance of proliferating cell nuclear antigen,<br />
epidermal growth factor receptor, and mdr gene expression in colorectal cancer.<br />
Cancer 71, 2454–2460 (1993).<br />
28. Ong, S.E. et al. Stable isotope labeling by amino acids in cell culture, SILAC, as<br />
a simple and accurate approach to expression proteomics. Mol. Cell. Proteomics<br />
1, 376–386 (2002).<br />
29. Jordan, M.A. Mechanism of action of antitumor drugs that interact with microtubules<br />
and tubulin. Curr. Med. Chem. Anticancer Agents 2, 1–17 (2002).<br />
30. Wisniewski, J.R. et al. Constitutive and dynamic phosphorylation and acetylation<br />
sites on NUCKS, a hypermodified nuclear protein, studied by quantitative<br />
proteomics. Proteins 73, 710–718 (2008).<br />
31. Gigant, B. et al. Structural basis for the regulation of tubulin by vinblastine. <strong>Nature</strong><br />
435, 519–522 (2005).<br />
32. Ravelli, R.B. et al. Insight into tubulin regulation from a complex with colchicine<br />
and a stathmin-like domain. <strong>Nature</strong> 428, 198–202 (2004).<br />
33. Unk, I. et al. Human SHPRH is a ubiquitin ligase for Mms2-Ubc13-dependent<br />
polyubiquitylation of proliferating cell nuclear antigen. Proc. Natl. Acad. Sci. USA<br />
103, 18107–18112 (2006).<br />
© 2010 <strong>Nature</strong> America, Inc. All rights reserved.<br />
nature biotechnology VOLUME 28 NUMBER 8 AUGUST 2010 873
© 2010 <strong>Nature</strong> America, Inc. All rights reserved.<br />
ONLINE METHODS<br />
Antigen synthesis and antibody production. Lysine-rich histone from<br />
calf thymus (type III-S, Sigma) was dissolved in 100 mM NaHCO 3 buffer<br />
(10 ml) at pH 10. 500 μl t-butyloxycarbonyl-Gly-Gly-N-hydroxysuccinimide<br />
(50 mM, Boc-Gly-Gly-NHS, ref. 34) in DMSO was added to histone solution<br />
and the reaction was carried out at 25° C for 1 h by constant shaking on a<br />
plate rotator. This step was repeated three additional times and sample B<br />
was obtained. For deprotection of the Boc group, neat trifluoroacetic acid<br />
(6 ml, TFA, Sigma) was added and the solution was shaken for 2 h at 25° C.<br />
The reaction was stopped by neutralizing with 10 M NaOH dropwise on<br />
ice (sample C). Sample A, B and C were dialyzed four times against 20 mM<br />
acetic acid followed by lyophilization. The degree of the reaction was assessed<br />
by anti-biotin (Sigma) western blot analysis after samples A, B and C were<br />
reacted with 5 mM biotin-NHS (Sigma) for 10 min. The same protocol<br />
was used to prepare Boc-Gly-Gly– and Gly-Gly–modified β-lactoglobulin,<br />
hen egg white lysozyme, rat brain lysate and peptides (DRVYIHPFHL and<br />
Ac-SYSMEHFRWGKPV-NH 2 ) for antibody evaluation.<br />
The antigen was injected into mice for antibody production, and hybridoma<br />
clones were made by Promab. Cells of monoclonal clones were grown<br />
in MegaCell Dulbecco’s Modified Eagle’s Medium (MegaCell DMEM, pH 7.2,<br />
Sigma) supplemented with 10% FBS (FBS), 50 μg/ml of kanamycin, 1 mM<br />
glutamine, and cells were split and cell culture supernatant was collected<br />
every week.<br />
Hybridoma clone GX41 was obtained after screening a panel of hybridomas<br />
to assess their utility in detecting diglycine-modified lysines. Antibodies<br />
from each hybridoma clone were first evaluated by western blot analysis using<br />
Gly-Gly–modified β-lactoglobulin, lysozyme and rat brain lysate. Clones were<br />
selected based on the absence of reactivity with unmodified protein and lysates,<br />
absence of reactivity with proteins and lysate modified with Boc-Gly-Gly, and<br />
reactivity with Gly-Gly–modified proteins and lysate. The top five clones that<br />
were further characterized were based on their ability to recognize the largest<br />
number of bands in the Gly-Gly–modified rat brain lysate. Antibodies from<br />
these clones were purified and used for immunoprecipitation of ubiquitin<br />
remnant–containing peptides from His 6 -ubiquitin–expressing HEK 293 cells,<br />
and tandem MS identification of tryptic ubiquitinated peptides to assess the<br />
degeneracy of antibodies. Only clone GX41 pulled down peptides that contained<br />
each of the 20 amino acids N-terminal to the modified lysine and each<br />
of the 20 amino acids C-terminal to the modified lysine, suggesting that the<br />
antibody can bind peptides which contain the diglycyl-lysine in a wide range<br />
of sequence contexts, which was supported by subsequent characterization of<br />
the amino acid context of the diglycyl-lysine obtained from a larger data set of<br />
ubiquitin remnant peptides (Fig. 3b and Supplementary Fig. 7a). The GX41<br />
anti–diglycyl-lysine monoclonal antibody was found to be IgG1κ isotype. This<br />
antibody was used for all the experiments in this study.<br />
Antibody purification and coupling. Gly-Gly–modified β-lactoglobulin was<br />
coupled to Affi-Gel 10 resin (Bio-Rad) in a concentration of 5 mg protein/ml<br />
resin in a pH 8 HEPES buffer overnight in 4 °C. The resin was quenched by 1 M<br />
Tris-HCl (pH 8), washed with three volumes of 10 mM citric acid (pH 3)<br />
and PBS. Cell culture supernatant (50 ml) from monoclonal cell lines was<br />
loaded six times into an 8-cm column with 1 ml Affi-Gel 10 resin coupled with<br />
Gly-Gly–modified β-lactoglobulin in 4 °C using a peristaltic pump. The resin<br />
was washed three times with 6 ml of 2× PBS and three times with 6 ml of PBS.<br />
The antibody was eluted four times with 0.5 ml 10 mM citric acid (pH 3) and<br />
immediately neutralized by 50 μl of 1 M HEPES (pH 8). The pH was adjusted<br />
to 8.5 and the antibody was concentrated by a 15 ml filter device (30 kDa<br />
molecular weight cutoff, Millipore). The antibody concentration was measured<br />
by Bradford protein assay (Bio-Rad). Typically, 0.1~0.2 mg of antibody was<br />
coupled to 20 μl Affi-Gel 10 resin according to the method described above.<br />
The antibody resin was stored in PBS buffer with 0.1% sodium azide at 4 °C.<br />
Cell culture and sample preparation. Human embryo kidney (HEK) 293 cells<br />
were cultured in Dulbecco’s Modified Eagle’s Medium (DMEM, Invitrogen)<br />
supplemented with 4.5 g/l glucose, 10% FBS, 100 units/ml penicillin G and<br />
100 μg/ml streptomycin. When the confluence reached ~50%, cells were<br />
transfected with 10 μg of a His 6 -tagged ubiquitin plasmid per 10-cm Petri<br />
dish using the calcium phosphate transfection method. Cells were used 1 d<br />
after transfection and treated with vehicle or proteasome inhibitor 25 μM<br />
LLnL (Calbiochem) in DMSO and incubated for 16 h before harvest. The<br />
His 6 -ubiquitin is expressed at a fraction of the level of endogenous ubiquitin<br />
(Supplementary Fig. 14) suggesting that it is unlikely to perturb endogenous<br />
ubiquitin pathways. The expression of tagged ubiquitin has been widely used<br />
in proteomics studies of protein ubiquitination 7,35,36 .<br />
Twenty 10-cm Petri dishes were cultured and cells were washed twice with<br />
ice-cold PBS. The cells were detached, collected and centrifuged at 1,000g for<br />
5 min at 4 °C. To increase coverage of ubiquitinated proteins, crude lysates, as<br />
well as subcellular fractions, including nuclear, membrane and cytosolic fractions,<br />
were prepared for analysis. For the crude lysate, the cell pellet was lysed<br />
and His 6 -tagged proteins were purified by Ni-NTA resin (Qiagen) in native<br />
and denaturing conditions according to the manufacturer’s protocol. The lysis<br />
buffer contained 5 mM chloroacetamide to alkylate cysteines and to inhibit<br />
ubiquitin ligases and deubiquitinases 9 . The membrane fraction was obtained<br />
by centrifuging at 100,000g for 60 min after removing the nuclear pellet in the<br />
presence of 250 mM sucrose. The pellet from nuclear and membrane fraction<br />
was dissolved in 8 M urea with 1% triton X-100 and 0.1% SDS and the proteins<br />
were purified by Ni-NTA resin in the presence of 10 mM β-mercaptoethanol.<br />
After immobilized metal affinity purification, ubiquitinated proteins are significantly<br />
enriched (Supplementary Fig. 15).<br />
All the samples after Ni-NTA purification were concentrated on an Amicon<br />
YM10 filter device (Millipore) and separated by SDS-PAGE. Gel pieces were<br />
treated with 10 mM dithiothreitol at 50 °C for 30 min, followed by 55 mM<br />
chloroacetamide at 25 °C for 45 min, using methods described previously 37 ,<br />
except that chloroacetamide was used in place of iodoacetamide. In-gel digestion<br />
and peptide extraction were performed as described 37 .<br />
The lyophilized peptide mixture was dissolved in 300 μl of buffer containing<br />
150 mM NaCl, 50 mM Tris-HCl (pH7.4) and 2 mM EDTA. The sample<br />
was boiled in a water bath for 10 min to deactivate residual trypsin activity.<br />
The peptide mixture was incubated with 20 μl antibody resin for 4 h in 4 °C,<br />
loaded on a micro-spin column (Pierce) six times, washed three times with<br />
2× PBS and three times with PBS, and eluted six times with 20 μl 10 mM<br />
citric acid (pH 3). The eluted peptide mixture was concentrated to 20 μl for<br />
tandem MS analysis.<br />
For the MALDI-TOF-MS experiment, a sample containing ~0.3 nmol of<br />
each peptide, GGDRVYIHPFHL and Ac-SYSMEHFRWGK*PV-NH 2 , was prepared<br />
and subjected to immunoprecipitation using the agarose-immobilized<br />
antibody described above.<br />
For SILAC quantification, five 10-cm dishes of HEK293T cells were grown<br />
in the media containing either light lysine (Lys0: 12 C 6 14 N 2 -Lys) or heavy lysine<br />
(Lys8: 13 C 6 15 N 2 -Lys) (Cambridge Isotope Labs) using previously described<br />
procedures for SILAC experiments 38 . The cells were transfected with His 6 -<br />
ubiquitin plasmid as described above, and treated with vehicle or drugs<br />
(10 μM colchicine or 1 μM vinblastine, Sigma) in the presence of LLnL (PCNA:<br />
25 μM for 16 h; tubulin α-1A: 50 μM for 30 min). The cells were mixed and<br />
purified under denaturing condition as described above without fractionation.<br />
To normalize the ubiquitinated peptides by unmodified peptides in the<br />
cell lysate, a small amount of initial mixed cell lysate was digested by trypsin<br />
followed by tandem MS analysis 30 .<br />
Mass spectrometric analysis. For MALDI-TOF-MS, samples were desalted<br />
by Millipore C18 ZipTip according to manufacturer’s protocol and eluted<br />
in a 2 μl solvent with 50% acetonitrile and 0.1% TFA in the presence of<br />
10 mg/ml α-cyano-4-hydroxycinnamic acid (Sigma). The masses of the samples<br />
were analyzed in the reflector mode by Voyager-DE PRO MALDI-TOF-MS<br />
(Applied Biosystems).<br />
The samples purified from cell lysate were analyzed by nanoLC Q-TOF<br />
MS/MS (Agilent) to obtain peptide sequence information using settings as<br />
described previously 39 . Briefly, 8 μl of peptide mixtures were loaded onto<br />
an enrichment column with 97% solvent A and 3% solvent B with a flow rate<br />
of 3 μl/min. Solvent A consists of 0.1% formic acid (Fluka) and solvent B of<br />
90% acetonitrile (Fisher) and 0.1% formic acid. Peptides were eluted with a<br />
gradient from 3% to 40% solvent B in 20 min, followed by a steep gradient<br />
to 90% solvent B in 5 min at a flow rate of 0.3 μl/min. Mass spectra were<br />
acquired in the positive-ion mode with automated data-dependent MS/MS<br />
on the five most intense ions from precursor MS scans and every selected<br />
nature biotechnology<br />
doi:10.1038/nbt.1654
© 2010 <strong>Nature</strong> America, Inc. All rights reserved.<br />
precursor peak was analyzed twice within 3 min. In some runs, a list of previous<br />
identified peptides was excluded for MS/MS fragmentation.<br />
Database search of MS/MS spectra for peptide and protein identification.<br />
Analysis of MS/MS spectra for peptide and protein identification was<br />
performed by protein database searching with Spectrum Mill software<br />
(Rev A.03.02, Agilent) against the Swiss-Prot database (v57.2, May 5, 2009)<br />
containing a concatenated reverse database with the same entries and the<br />
same length for each protein, as described 40 . The use of a decoy database<br />
to evaluate the false-positive rate for modified peptides may underestimate<br />
the false identifications as protein modifications can greatly expand the<br />
search space. Raw spectra were first extracted to MS/MS spectra that could<br />
be assigned to at least four y- or b-series ions. Scans with the same precursor<br />
within a mass window of ±0.4 m/z were merged within a time frame of ±15 s,<br />
charges up to a maximum of 7 were assigned to the precursor ion and the<br />
12 C peak was determined by the Data Extractor. Key search parameters were<br />
a minimum matched peak intensity of 50%, a precursor mass tolerance of<br />
±20 p.p.m., and a product mass tolerance of ±40 p.p.m. A fixed modification<br />
was carbamidomethylation (same modification as chloroacetamide) for<br />
cysteines and variable modifications were Gly-Gly modification for lysines<br />
and oxidation for methionines. It should be noted that there are potentially<br />
a large number of naturally occurring sequence variants in mammals, but<br />
very limited data in the databases on these sequences. These variants may<br />
be missed or misidentified if the sequence variation lies in the same peptide<br />
that contains the diglycine modified–lysine. The maximal number of<br />
diglycine modifications was set as two. Trypsin was selected as enzyme for<br />
sample digestion and four missed cleavages were allowed during the database<br />
search. The threshold used for peptide identification was a Spectrum Mill<br />
score of ≥ 9, an SPI% (the percentage of the scored peak intensity) of ≥ 50%<br />
and the difference between forward and reverse scores of ≥2. Under these<br />
criteria, the false-positive rate is 1, there is a commensurately<br />
higher likelihood for Pro at the −1 position to be adjacent to a ubiquitinated<br />
lysine. The highest relative ratio detected was 2.3 and the range of the color<br />
map was set from 0 to 2.5. The density map was prepared by MATLAB. The<br />
enriched amino acids were obtained by determining the outliers with a 95%<br />
confidence using the Rosner’s test 46 .<br />
To access the structural features of ubiquitinated lysine residues for human<br />
proteins, we searched crystal structures for all the ubiquitinated proteins in<br />
protein database bank (PDB). In total, 89 PDB structures (Supplementary<br />
Table 2) contained lysines that we found are susceptible to ubiquitination<br />
(140 modified lysines and 3970 total lysines). In cases when multiple PDB<br />
structures for a ubiquitinated protein were reported, the structure with best<br />
quality was used. The secondary structure types for lysines were determined<br />
using the program DSSP 47 . H and G were considered to be helix, E and B to<br />
be strand, S, T and others for coil. The fraction of each secondary structure<br />
type of modified lysines was compared to that of all the lysine residues in<br />
89 PDB structures. The disordered region was predicted by DisEMBL 48<br />
for all identified ubiquitinated proteins and the information for modified<br />
lysines and all lysines was extracted. The relative solvent-accessible area<br />
for the modified and all lysines in 89 crystal structures was calculated<br />
using NACCESS 49 with a probe of 1.4 Å, which corresponds to the size of a<br />
water molecule.<br />
doi:10.1038/nbt.1654<br />
nature biotechnology
34. Derrien, D. et al. Muramyl dipeptide bound to poly-l-lysine substituted with mannose<br />
and gluconoyl residues as macrophage activators. Glycoconj. J. 6, 241–255 (1989).<br />
35. Kirkpatrick, D.S., Weldon, S.F., Tsaprailis, G., Liebler, D.C. & Gandolfi, A.J.<br />
Proteomic identification of ubiquitinated proteins from human cells expressing<br />
His-tagged ubiquitin. Proteomics 5, 2104–2111 (2005).<br />
36. Xu, P. et al. Quantitative proteomics reveals the function of unconventional ubiquitin<br />
chains in proteasomal degradation. Cell 137, 133–145 (2009).<br />
37. Shevchenko, A., Wilm, M., Vorm, O. & Mann, M. Mass spectrometric sequencing<br />
of proteins silver-stained polyacrylamide gels. Anal. Chem. 68, 850–858 (1996).<br />
38. de Godoy, L.M. et al. Status of complete proteome analysis by mass spectrometry:<br />
SILAC labeled yeast as a model system. Genome Biol. 7, R50 (2006).<br />
39. Xu, G., Shin, S.B. & Jaffrey, S.R. Global profiling of protease cleavage sites by<br />
chemoselective labeling of protein N-termini. Proc. Natl. Acad. Sci. USA 106,<br />
19310–19315 (2009).<br />
40. Elias, J.E. & Gygi, S.P. Target-decoy search strategy for increased confidence in<br />
large-scale protein identifications by mass spectrometry. Nat. Methods 4, 207–214<br />
(2007).<br />
41. Silva, J.C. et al. Quantitative proteomic analysis by accurate mass retention time<br />
pairs. Anal. Chem. 77, 2187–2200 (2005).<br />
42. Mortensen, P. et al. MSQuant, an open source platform for mass spectrometry-based<br />
quantitative proteomics. J. Proteome Res. 9, 393–403 (2010).<br />
43. Thomas, P.D. et al. PANTHER: a library of protein families and subfamilies indexed<br />
by function. Genome Res. 13, 2129–2141 (2003).<br />
44. Dennis, G. Jr. et al. DAVID: database for annotation, visualization, and integrated<br />
discovery. Genome Biol. 4, 3 (2003).<br />
45. Lu, Z. et al. Predicting subcellular localization of proteins using machine-learned<br />
classifiers. Bioinformatics 20, 547–556 (2004).<br />
46. Rosner, J. Test of auditory analysis skills (TAAS) in helping children overcome<br />
learning difficulties: a step-by-step guide for parents and teachers (Academic<br />
Therapy, New York, 1979).<br />
47. Kabsch, W. & Sander, C. Dictionary of protein secondary structure: pattern<br />
recognition of hydrogen-bonded and geometrical features. Biopolymers 22,<br />
2577–2637 (1983).<br />
48. Linding, R. et al. Protein disorder prediction: implications for structural proteomics.<br />
Structure 11, 1453–1459 (2003).<br />
49. Hubbard, S.J., Campbell, S.F. & Thornton, J.M. Molecular recognition. Conformational<br />
analysis of limited proteolytic sites and serine proteinase protein inhibitors. J. Mol.<br />
Biol. 220, 507–530 (1991).<br />
© 2010 <strong>Nature</strong> America, Inc. All rights reserved.<br />
nature biotechnology<br />
doi:10.1038/nbt.1654
careers and recruitment<br />
Second quarter biotech job picture<br />
Michael Francisco<br />
© 2010 <strong>Nature</strong> America, Inc. All rights reserved.<br />
In the second quarter of 2010, biotech and pharmaceutical postings on<br />
the three representative job databases tracked by <strong>Nature</strong> Biotechnology<br />
(Tables 1 and 2) largely stayed the same from the previous quarter<br />
(Nat. Biotechnol. 28, 527, 2010). Noteworthy increases in job openings<br />
were seen from instrument systems and consumables manufacturers Life<br />
Table 1 Who’s hiring? Advertised openings at the 25 largest biotech<br />
companies<br />
Number of advertised openings b<br />
Company a<br />
Number of<br />
employees<br />
Monster Biospace <strong>Nature</strong>jobs<br />
Monsanto 21,700 0 0 31<br />
Amgen 16,800 29 29 1<br />
Genentech 11,186 6 26 100<br />
Genzyme 11,000 63 0 0<br />
Life Technologies 9,700 71 89 0<br />
PerkinElmer 7,900 52 0 0<br />
Bio-Rad Laboratories 6,600 12 17 0<br />
Biomerieux 6,140 9 0 0<br />
Millipore 5,900 15 11 0<br />
IDEXX Laboratories 4,700 14 0 0<br />
Biogen Idec 4,700 38 104 1<br />
Gilead Sciences 3,441 0 26 0<br />
WuXi PharmaTech 3,172 0 0 0<br />
Qiagen 3,041 0 0 1<br />
Cephalon 2,780 0 0 0<br />
Biocon 2,772 0 0 0<br />
Celgene 2,441 13 10 0<br />
Biotest 2,108 0 11 0<br />
Actelion 2,054 4 1 0<br />
Amylin Pharmaceuticals 1,800 9 3 0<br />
Elan 1,687 7 2 0<br />
Illumina 1,536 2 27 9<br />
Albany Molecular<br />
Research<br />
1,357 0 0 0<br />
Vertex Pharmaceuticals 1,322 40 58 2<br />
CK Life Sciences 1,315 0 0 0<br />
a As defined in <strong>Nature</strong> Biotechnology’s survey of public companies (27, 710–721, 2009). b As<br />
searched on Monster.com, Biospace.com and <strong>Nature</strong>jobs.com, 21 July 2010. Jobs may overlap.<br />
Michael Francisco is Senior Editor, <strong>Nature</strong> Biotechnology<br />
Technologies (Carlsbad, CA, USA), PerkinElmer (Waltham, MA, USA),<br />
Bio-Rad Laboratories (Hercules, CA, USA) and Illumina (San Diego).<br />
Table 3 shows selected downsizings within the life science industry.<br />
<strong>Nature</strong> Biotechnology will continue to follow hiring and firing trends<br />
throughout 2010.<br />
Table 2 Advertised job openings at the ten largest pharma companies<br />
Number of advertised openings b<br />
Company a<br />
Number of<br />
employees Monster Biospace <strong>Nature</strong>jobs<br />
Johnson & Johnson 119,200 522 8 19<br />
Bayer 106,200 78 27 3<br />
GlaxoSmithKline 103,483 5 1 2<br />
Sanofi-Aventis 99,495 12 1 4<br />
Novartis 98,200 144 94 20<br />
Pfizer 86,600 2 81 88<br />
Roche 78,604 35 31 20<br />
Abbott Laboratories 68,697 67 42 1<br />
AstraZeneca 67,400 71 7 4<br />
Merck & Co. 59,800 0 10 0<br />
a Data obtained from MedAdNews. b As searched on Monster.com, Biospace.com and <strong>Nature</strong>jobs.com,<br />
21 July 2010. Jobs may overlap.<br />
Table 3 Selected biotech and pharma downsizings<br />
Company<br />
Albany Molecular<br />
Research<br />
Number of<br />
employees<br />
cut Details<br />
80 Restructured its US operations, including reducing head<br />
count by about 10% and suspending operations at one of<br />
its research laboratories in Rensselaer, New York.<br />
Cell Therapeutics 36 Reduced head count by 29% to 88 to conserve cash,<br />
with the cuts coming mostly from sales and marketing.<br />
GTC<br />
Biotherapeutics<br />
Helicos<br />
BioSciences<br />
50 Will restructure and reduce head count by 46% to 59 to<br />
save cash.<br />
40 Reduced head count by 50% to 40 and plans to refocus<br />
its business on molecular diagnostics development.<br />
InterMune 60 Reduced head count by 40% to 85, with the cuts<br />
coming predominantly in the commercial and discovery<br />
research areas.<br />
Lonza Group 193 Reducing head count by 6% to 2,899 at its R&D and<br />
production site in Visp, Switzerland, to save cash.<br />
Myriad<br />
Pharmaceuticals<br />
21 Restructured and reduced head count by 13% to about<br />
140 to focus on its cancer pipeline.<br />
Novartis 383 Will restructure Novartis Pharmaceuticals and reduce head<br />
count at the US unit. Thirty-five percent of the cuts will<br />
be achieved by not filling vacant positions. The cuts will<br />
primarily come from “headquarter-based functions,” with<br />
minimal impact on the commercial sales organization.<br />
Pfizer 6,000 Announced plans to restructure its global manufacturing<br />
plant network and reduce manufacturing head count by<br />
18% to 27,000 over the next five years. Plans to close<br />
eight sites in Puerto Rico, Ireland and the US and reduce<br />
operations at another six sites.<br />
Sanofi-Aventis 400 Cuts will primarily come from US sales force, which<br />
previously had 5,700 employees.<br />
Takeda<br />
Pharmaceutical<br />
Source: BioCentury.<br />
~1,900 Will reduce head count by about 10% to reduce costs in<br />
its fiscal year 2010 ending March 31, 2011.<br />
nature biotechnology volume 28 number 8 august 2010 875
people<br />
© 2010 <strong>Nature</strong> America, Inc. All rights reserved.<br />
Biogen Idec (Cambridge, MA, USA) has named George Scangos<br />
(left) as its new CEO as well as a member of the board of<br />
directors, replacing the recently retired Jim Mullen. Scangos<br />
joins Biogen Idec from Exelixis, where he has served as president<br />
and CEO since 1996. Previously, he spent 10 years at Bayer,<br />
leaving as president of Bayer Biotechnology.<br />
“George’s appointment is the culmination of the board’s<br />
comprehensive selection process to identify the best leader to<br />
take Biogen Idec to the next level,” says chairman William D.<br />
Young. “Science is at the heart of our business, and George has<br />
an exceptional scientific background, as well as significant operational expertise and a<br />
strong leadership track record.”<br />
Nile Therapeutics (San Francisco) has appointed<br />
Richard B. Brewer as executive chairman.<br />
Brewer brings over 35 years of operational,<br />
financial and business development expertise<br />
to Nile. He currently serves as chairman of Arca<br />
Biopharma and was previously CEO and president<br />
of Scios, COO of Heartport and senior vice<br />
president of US marketing at Genentech.<br />
BioVex (Woburn, MA, USA) has appointed<br />
Kapil Dhingra to its board of directors.<br />
Dhingra spent nearly ten years at<br />
Hoffmann-La Roche, culminating in his<br />
appointment as vice president and head of<br />
oncology clinical development.<br />
Myriad Genetics (Salt Lake City, UT, USA) has<br />
announced the appointment of Gary A. King<br />
to the newly created position of executive vice<br />
president of international operations. King has<br />
over 25 years of life sciences experience, most<br />
recently as CEO of AverDx. Prior to AverDx,<br />
he was vice president, international operations<br />
at Biosite.<br />
Dean Mitchell (left)<br />
has been named president<br />
and CEO of Lux<br />
Biosciences (Jersey<br />
City, NJ, USA).<br />
Mitchell was formerly<br />
president and<br />
CEO of Alpharma<br />
and Guilford<br />
Pharmaceuticals.<br />
He is also a nonexecutive board member of<br />
ISTA Pharmaceutics, Intrexon and Talecris<br />
Biotherapeutics.<br />
Diagnostic kit developer Ingen Biosciences<br />
(Chilly-Mazarin, France) has appointed<br />
Karine Mignon-Godefroy as director of<br />
research and development. She joins Ingen<br />
from the blood virus division of Bio-Rad,<br />
where she was director of international projects.<br />
Before Bio-Rad, she held the post of R&D<br />
manager at BMD.<br />
Frank Morich, CEO of NOXXON Pharma<br />
(Berlin) has announced his intention to leave<br />
the company effective August 15 to take up<br />
the position of executive vice president, international<br />
operations of Takeda Pharmaceutical<br />
Company. Iain Buchanan, a director of<br />
NOXXON, will assume the role of interim<br />
CEO and will support the board during its<br />
search for a permanent replacement. Buchanan<br />
has over 30 years of experience in the pharma<br />
and biotech industry, most recently as CEO<br />
of Novexel.<br />
Marine biotechnology company Aquapharm<br />
Biodiscovery (Oban, UK) has named Tim<br />
Morley as CSO. Morley has over 20 years experience<br />
in the pharmaceutical industry, including<br />
previous positions as research and strategic<br />
project director at Quotient Biodiagnostics,<br />
vice president preclinical sciences at Ardana<br />
Bioscience and senior director molecular and<br />
cellular pharmacology at Vernalis.<br />
Exelixis (S. San Francisco, CA, USA) has<br />
announced the appointment of Michael<br />
Morrissey as president and CEO, succeeding<br />
George Scangos. Morrissey will also become<br />
a member of the board of directors. He joined<br />
Exelixis in 2000 and served as executive vice<br />
president, discovery before his appointment<br />
as president of research and development in<br />
January 2007.<br />
Illumina (San Diego) has announced the<br />
appointment of Nicholas J. Naclerio to the position<br />
of senior vice president, corporate development.<br />
Naclerio formerly served as cofounder<br />
and executive chairman of Quanterix, raising<br />
$15 million in venture financing to launch the<br />
company. In addition, Illumina has named<br />
to its board of directors Gerald Möller, who<br />
currently serves as an advisor at HBM Bio<br />
Ventures, a Swiss investment firm. Previously,<br />
Möller spent 23 years at Boehringer Mannheim<br />
and Roche, where he held a number of leadership<br />
positions including CEO of the worldwide<br />
Boehringer Mannheim Group and head<br />
of global development and strategic marketing,<br />
pharmaceuticals for Roche.<br />
BrainStorm Cell Therapeutics (New York and<br />
Petach Tikva, Israel) has named Liat Sossover<br />
as CFO. Sossover has served in senior financial<br />
positions at a number of publicly traded and<br />
private companies, most recently as vice president,<br />
finance at ForeScout Technologies.<br />
James F. Young has been appointed to the board<br />
of directors of 3-V Biosciences (Menlo Park,<br />
CA, USA). He currently serves on the board of<br />
directors of Novavax. Previously, he served as<br />
head of MedImmune’s R&D organization and<br />
was directly involved in the development of<br />
approximately 20 clinical programs.<br />
Patrick J. Zenner has been elected to the board<br />
of directors of Par Pharmaceutical (Woodcliff<br />
Lake, NJ, USA). Zenner retired in January 2001<br />
from Hoffmann-La Roche, where he served as<br />
president and CEO since 1993. He currently<br />
serves as chairman of the board of ArQule<br />
and Exact Sciences and as a director of West<br />
Pharmaceutical Services.<br />
876 volume 28 number 8 august 2010 nature biotechnology